Article

A Mixture of Green Waste Compost and Biomass Combustion Ash for Recycled Nutrient Delivery to Soil

by
Kristina Buneviciene
1,
Donata Drapanauskaite
1,
Romas Mazeika
1 and
Jonas Baltrusaitis
2,*
1
Lithuanian Research Centre for Agriculture and Forestry, Instituto al. 1, Akademija, LT-58344 Kėdainiai, Lithuania
2
Department of Chemical and Biomolecular Engineering, Lehigh University, B336 Iacocca Hall, 111 Research Drive, Bethlehem, PA 18015, USA
*
Author to whom correspondence should be addressed.
Agronomy 2021, 11(4), 641; https://doi.org/10.3390/agronomy11040641
Submission received: 25 February 2021 / Revised: 19 March 2021 / Accepted: 25 March 2021 / Published: 26 March 2021

Abstract

:
The use of major nutrient-containing solid residuals, such as recycled solid waste materials, has a strong potential in closing the broken nutrient cycles. In this work, biofuel ash (BA) combined with green waste compost (GWC) was used as a nutrient source to improve soil properties and enhance wheat and triticale yields. The main goal was to obtain the nutrient and heavy metal release dynamics and ascertain whether GWC together with BA can potentially be used for concurrent bioremediation to mitigate any negative solid waste effects on the environment. Both BA and GWC were applied in the first year of study. No fertilization was performed in the second year of the study. The results obtained in this work showed the highest spring wheat yield when the GWC (20 t ha−1) and BA (4.5 t ha−1) mixture was used. After the first harvest, the increase in the mobile forms of all measured nutrients was detected in the soil with complex composted materials (GWC + BA). The content of heavy metals (Cd, Zn, and Cr) in the soil increased significantly with BA and all GWC + BA mixtures. In both experiment years, the application of BA together with GWC resulted in fewer heavy metals transferred to the crops than with BA alone.

1. Introduction

The use of secondary, e.g., recycled or reused, materials is very important for sustainable development. One such secondary material is biofuel ash. In developing countries, about 60% of all municipal solid waste is incinerated [1]. Of this, only 4–13% [2] is returned to the environment in the form of ash, as biofuel combustion ash is disposed of in landfills and only a part is further processed and used in agricultural soils. Recycling biofuel ash in agricultural soils (a) reduces the need for landfilling; (b) leads to the return of valuable nutrients to the ecosystem; and (c) decreases soil acidification. As a result, energy production from wood-burning becomes more sustainable [3,4].
One way to use biofuel ash is to mix it with green waste compost. Different guidelines for mixing compost with ash apply in different countries. In Austria, ≤2% biofuel ash can be added to the compost mix and no limits apply in Germany [5,6]. Other works used 12% ash in a mixture with compost and found no adverse effects to the plants [7]. Other researchers have also shown that up to 15% use of biofuel ash had no negative impact [6].
Both biofuel ash and green waste compost contain various macro- and microelements required for soil and plants [8]. Biofuel ash also contains heavy metals [9]. The concentration of these heavy metals and their release properties can potentially be mitigated when mixing the ash with organic and compostable waste since compost can act as a biological mediator to mitigate any toxic effects of biofuel ash. Researchers have found that the addition of biofuel ash to green waste compost has effectively increased the macro- and microelements of the final product, including P, K, Mg, Ca, as well as Cu and Zn [10], while other researchers have found improved microorganism activity [11]. Other reports have found that ash and green waste compost (a) increased the amount of organic matter in the soil; (b) improved the physical, chemical, and biological properties of the soil; (c) improved the soil texture (air and water permeability); and (d) improved the plant yield [12].
This study aims to investigate if biofuel combustion bottoms ash (BA) in combination with green waste compost (GWC) could present any sizeable environmental risk or, instead, offer new opportunities for sustainable solid waste recycling and nutrient management in the environment. We studied the response of soil properties as well as spring wheat and spring triticale yield improvement to green waste compost with ash application in a 2-year field experiment. The ultimate goal was to perform a comprehensive assessment of the complex composted materials to not only reduce the consumption of mineral fertilizers but also the amount of biofuel ash in landfills.

2. Materials and Methods

2.1. Materials and Physicochemical Characterization

Biofuel ash and green waste compost were obtained from biomass processing centers in Lithuania. The GWC used in this study was obtained from JSC Alytaus regioninis atliekų tvarkymo centras (Alytus, Lithuania) and BA obtained from JSC Alytaus šilumos tinklai (Alytus, Lithuania). The BA was formed by burning wood pellets. All reagents for chemical analysis were reagent grade from Fisher Scientific (Leicestershire, UK) and used as received. Double distilled water was used in all experiments [13].
A chemical analysis of the recycled materials used in the field experiments was carried out. The samples were ground, sieved, and extracted with aqua regia. Atomic Absorption Spectroscopy (AAS) (Thermo Fisher Scientific, Waltham, MA, USA) was used to measure the concentration of total calcium Ca and total magnesium Mg; a flame photometer (FP) (Sherwood, Cambridge, UK) for total potassium K; a UV—VIS spectrophotometer (Shimadzu, Duisburg, Germany) for total phosphorus P; and inductively coupled plasma mass spectrometry (ICP-MS) (Thermo Fisher Scientific, Waltham, MA, USA) for the heavy metals (Cu, Cd, Cr, Ni, Pb, and Zn) [14]. Total nitrogen (Ntot) was determined using the Kjeldahl nitrogen distiller method while organic carbon (Corg) was determined using a dry combustion method with a total carbon analyzer Liqui TOC II [15].

2.2. BA and GWC Mixtures for Composting

The BA and GWC used, with their corresponding nomenclature, is shown in Table 1. Based on previous experiments with an ash content of up to 15% [6] and 16% [16] in the mixture, mixtures of 7%, 13%, and 18% of BA by weight were used. The application rates were 20 t ha−1 GWC + 1.5 t ha−1 BA, 20 t ha−1 GWC + 3.0 t ha−1, and 20 t ha−1 GWC + 4.5 t ha−1, respectively. The GWC rate of 20 t ha−1 corresponded to 60 kg GWC per field (30 m2) while that of BA of 3 t ha−1—to 9 kg. In mixtures with 7%, 13%, and 18% ash, the amounts applied were as follows: GWC 60 kg + BA 4.5 kg, GWC 60 kg + BA 9 kg, and GWC 60 kg + BA 13.5 kg. The rate of GWC was calculated based on the maximum permitted N rate of 170 kg ha−1, as indicated in the EC Directive 91/676/EEC [17]. Differently from the current literature data [18], the BA and GWC were not composted together but rather mixed manually before field application.
These were used in 2-year (total of 16 months) field experiments to assess the availability and transfer potential of nutrients from BA and GWC to the soil, the resulting changes in soil chemical composition, and yield improvement of spring barley as well as spring triticale.

2.3. Field Experiment Description and Experimental Design

At the beginning of the field experiment, soil samples were randomly collected from 8 different spots at a depth of 0–20 cm. The samples were thoroughly mixed to form a composite and analyzed for initial soil properties. Agrochemical properties measured from the upper soil layer were as follows: mobile P2O5 130 ± 10 mg kg−1, mobile K2O 150 ± 10 mg kg−1, mobile Ca 4000 ± 100 mg kg−1, mobile Mg 830 ± 10 mg kg−1, Cd 0.079 ± 0.005 mg kg−1, Zn 31.5 ± 0.4 mg kg−1, Cr 15.5 ± 0.2 mg kg−1, Ni 12.2 ± 0.3 mg kg−1, Pb 8.56 ± 0.11 mg kg−1, and Cu 9.49 ± 0.12 mg kg−1. Next, soil samples were collected after the first-year harvest (after 4 months), before the second-year sowing (after 12 months), and after the second-year harvest (after 16 months) from the start of the experiment.
The field experiments were conducted from 2018 to 2019 at the Lithuanian Research Center for Agriculture and Forestry, Institute of Agriculture (55°23′49″ N 23°51′40″ E) in Akademija, Lithuania. The soil at the experimental area is loamy (Endocalcaric Epigleyic Cambisol) [19]. The experiment consisted of 6 different variants, which were arranged in the field in three replications in randomization blocks. The field size was 30 m2 (3 × 10 m). For each application, three replicates were tested. Additionally, three plots without any fertilizer material were used as control. No mineral fertilizers were added.
The crop seedbed was prepared with a soil finisher/field cultivator shortly before seeding. GWC and BA mixtures were spread manually on the soil surface and incorporated into the soil (0–15 cm) before the sowing of spring wheat. The spring wheat cultivar “Collada” (Einbeck, Germany) and spring triticale cultivar “Milkaro” (Koscian, Poland) was chosen. The sowing rate was 270 kg ha−1 (spring wheat) and 250 kg ha−1 (spring triticale). Seeds were sown on 19 April 2018 and on 16 April 2019. The field was fertilized only in the first year of the two-year experiment. This was done to monitor the availability of the nutrients in the second year as the recycled materials were hypothesized to have slow-release properties. Each plot of each experiment was harvested with a small combine harvester. Crop yield was determined by weighing. Spring wheat and spring triticale grain and straw from each experimental plot were collected and weighed.
Soil mobile potassium (K2O), mobile phosphorus (P2O5), mobile calcium (Ca), and mobile magnesium (Mg) were determined using an ammonium lactate–acetic acid extraction, as described by Egner, Riehm and Domingo [20]. Inductively coupled plasma mass spectrometry (ICP-MS) (Thermo Fisher Scientific, Waltham, MA, USA) was used to find the content of the heavy metals in soil, too. Mineral nitrogen (Nmin) was determined using laboratory prepared spectrometric method LVP-D-05:2017. ICP-MS was used to determine the total P, K, Ca, Mg, and heavy metals in the spring wheat and spring triticale grain and straw. The Kjeldahl method was used to determine the total nitrogen (Ntot) in spring wheat and spring triticale grain and straw. All chemical analyses were performed in triplicate (n = 3).

2.4. Meteorological Conditions

At the experimental site, the sum of the active temperatures was 2100–2200°, the annual precipitation was 500–600 mm, and the mean annual temperature was 6.5 °C. Meteorological conditions during the experimental period were assessed according to the data from the Lithuanian Hydrometeorological Service under the Ministry of Environment (Vilnius, Lithuania). In 2018 and 2019, the temperature of the growing season was higher than the average perennial. Both years were equally humid in the growing season. Precipitation was 247 mm in 2018 and 245 mm in 2019. The average monthly temperature and the cumulative precipitation are shown in Figure 1.

2.5. Statistical Analysis

A one-way analysis (ANOVA) of variance was used to compare the soil characteristics before and after soil fertilizing, the spring wheat and spring triticale yield and properties of the BA, GWC, and GWC + BA mixtures, and the spring wheat and spring triticale grain and straw. Means were compared using Duncan’s test at p ≤ 0.01 and p ≤ 0.05. The statistical software package SAS (version 9.3, SAS Institute, Cary, NC, USA) [21] was used for all analyses.

3. Results and Discussion

3.1. Nutrient Composition of the BA, GWC, and GWC + BA Mixtures

Table 2 shows the chemical composition of the measured nutrients (Ptot, Ktot, Catot, and Mgtot) in the as-received BA and GWC. Both were chiefly comprised of Ca2+ ion-containing chemical compounds. Notable was the total P content in the GWC and BA of ~3.5–8.2% by weight for all the major nutrients measured. It is the main nutrient needed by plants for the synthesis of organic matter and metabolism [22]. The total P content in the present work in GWC was 0.52% (Table 2). Other authors found also found it rather low, 0.16–0.42% [23], while some reports found the total P concentration in various types of compost ranged from 0.8 to 1.8% [24,25]. The K concentration in the BA was ~16.9%. Meanwhile, in the compost, it was 25 times less (~0.69%) and can be considered as low [23]. Similar to our results, the total K concentration in green waste compost has been reported to range from 0.5 to 0.7% [26].
The total Ca content in the GWC was ~3.08% and in the BA ~20.9%. The total Mg content was ~0.51% and ~3.15% for the GWC and BA, respectively. Collectively, it can be seen that GWC does not serve as a significant source of Ptot, Ktot, Catot, and Mgtot to the plants.
The total (Ntot) and mineral (Nmin) nitrogen and organic carbon (Corg) were also evaluated, as Ntot is one of the most important nutrients. The literature indicates that Ntot is very low at <0.5% and very high at >2.0% in GWC [27]. The Ntot measured was >0.5% in GWC, i.e., 0.77 ± 0.01%. The Nmin in GWC was found to be 0.13 ± 0.01%. The Corg content of the GWC was found to be 9.27 ± 0.80%. Corg and Ntot were not detected in BA due to the oxidation of C during combustion and the evolution of N as a gas [28,29]. Hence, the addition of GWC is critical to BA to provide the nitrogen needed by plants [30]. If the ratio of organic carbon to total nitrogen (Corg:Ntot) is less than 10, the microorganisms performing the compost mineralization consume more nitrogen, which is absorbed from the GWC. As a result, the amount of it available to the plants is reduced. A ratio between 16 and 20 is considered optimal, and >25 is very good [27]. The Corg:Ntot ratio in the GWC found in the current experiment was 12, i.e., sufficient for both microorganisms and plants. However, to increase the low Corg:Ntot ratio, other carbon-containing substrates can be added (e.g., biochar, granular activated carbon, and digestate from the anaerobic digestion process) [31].
The corresponding concentrations of heavy metals measured in the BA, GWC, and BA/GWC mixtures are shown in Table 3. In this experiment, there were six heavy metals (Cd, Pb, Ni, Cu, Zn, and Cr) detected. Notably, Zn and Cu also can serve as microelements in low concentrations in soil [32]. The BA contained an almost 50 times higher concentration of microelements and heavy metals when compared to GWC, with ~9028 mg kg−1 of Zn, ~216 mg kg−1 Cu, ~240 mg kg−1 Cr, ~11.3 mg kg−1 Ni, ~216 mg kg−1 Pb, and ~75.8 mg kg−1 Cd. In general, the amount of elements in the ash depends on the type of wood used and their amount can vary over a very wide range. Studies conducted studies with ash found Zn concentration of 4920 mg kg−1 [33].
The content of heavy metals increased linearly with the increasing amount of BA in the mixtures. Hence, GWC + BA1.5 had the lowest concentration of microelements and heavy metals delivered to the soil primarily due to the higher content of the green mass. BA mixed with GWC complies with the maximum allowable limits, as shown in Table 3 [34].
The cumulative amount of heavy metals introduced into the soil is shown in Table 4. GWC and GWC + BA1.5 had the lowest contents of heavy metals delivered to the soil. The content of heavy metals in the complex composted materials did not exceed the max allowable levels permitted by EPA [35].

3.2. Nutrient and Heavy Metal Release from GWC + BA Mixtures as Measured via Chemical Composition of the Soil

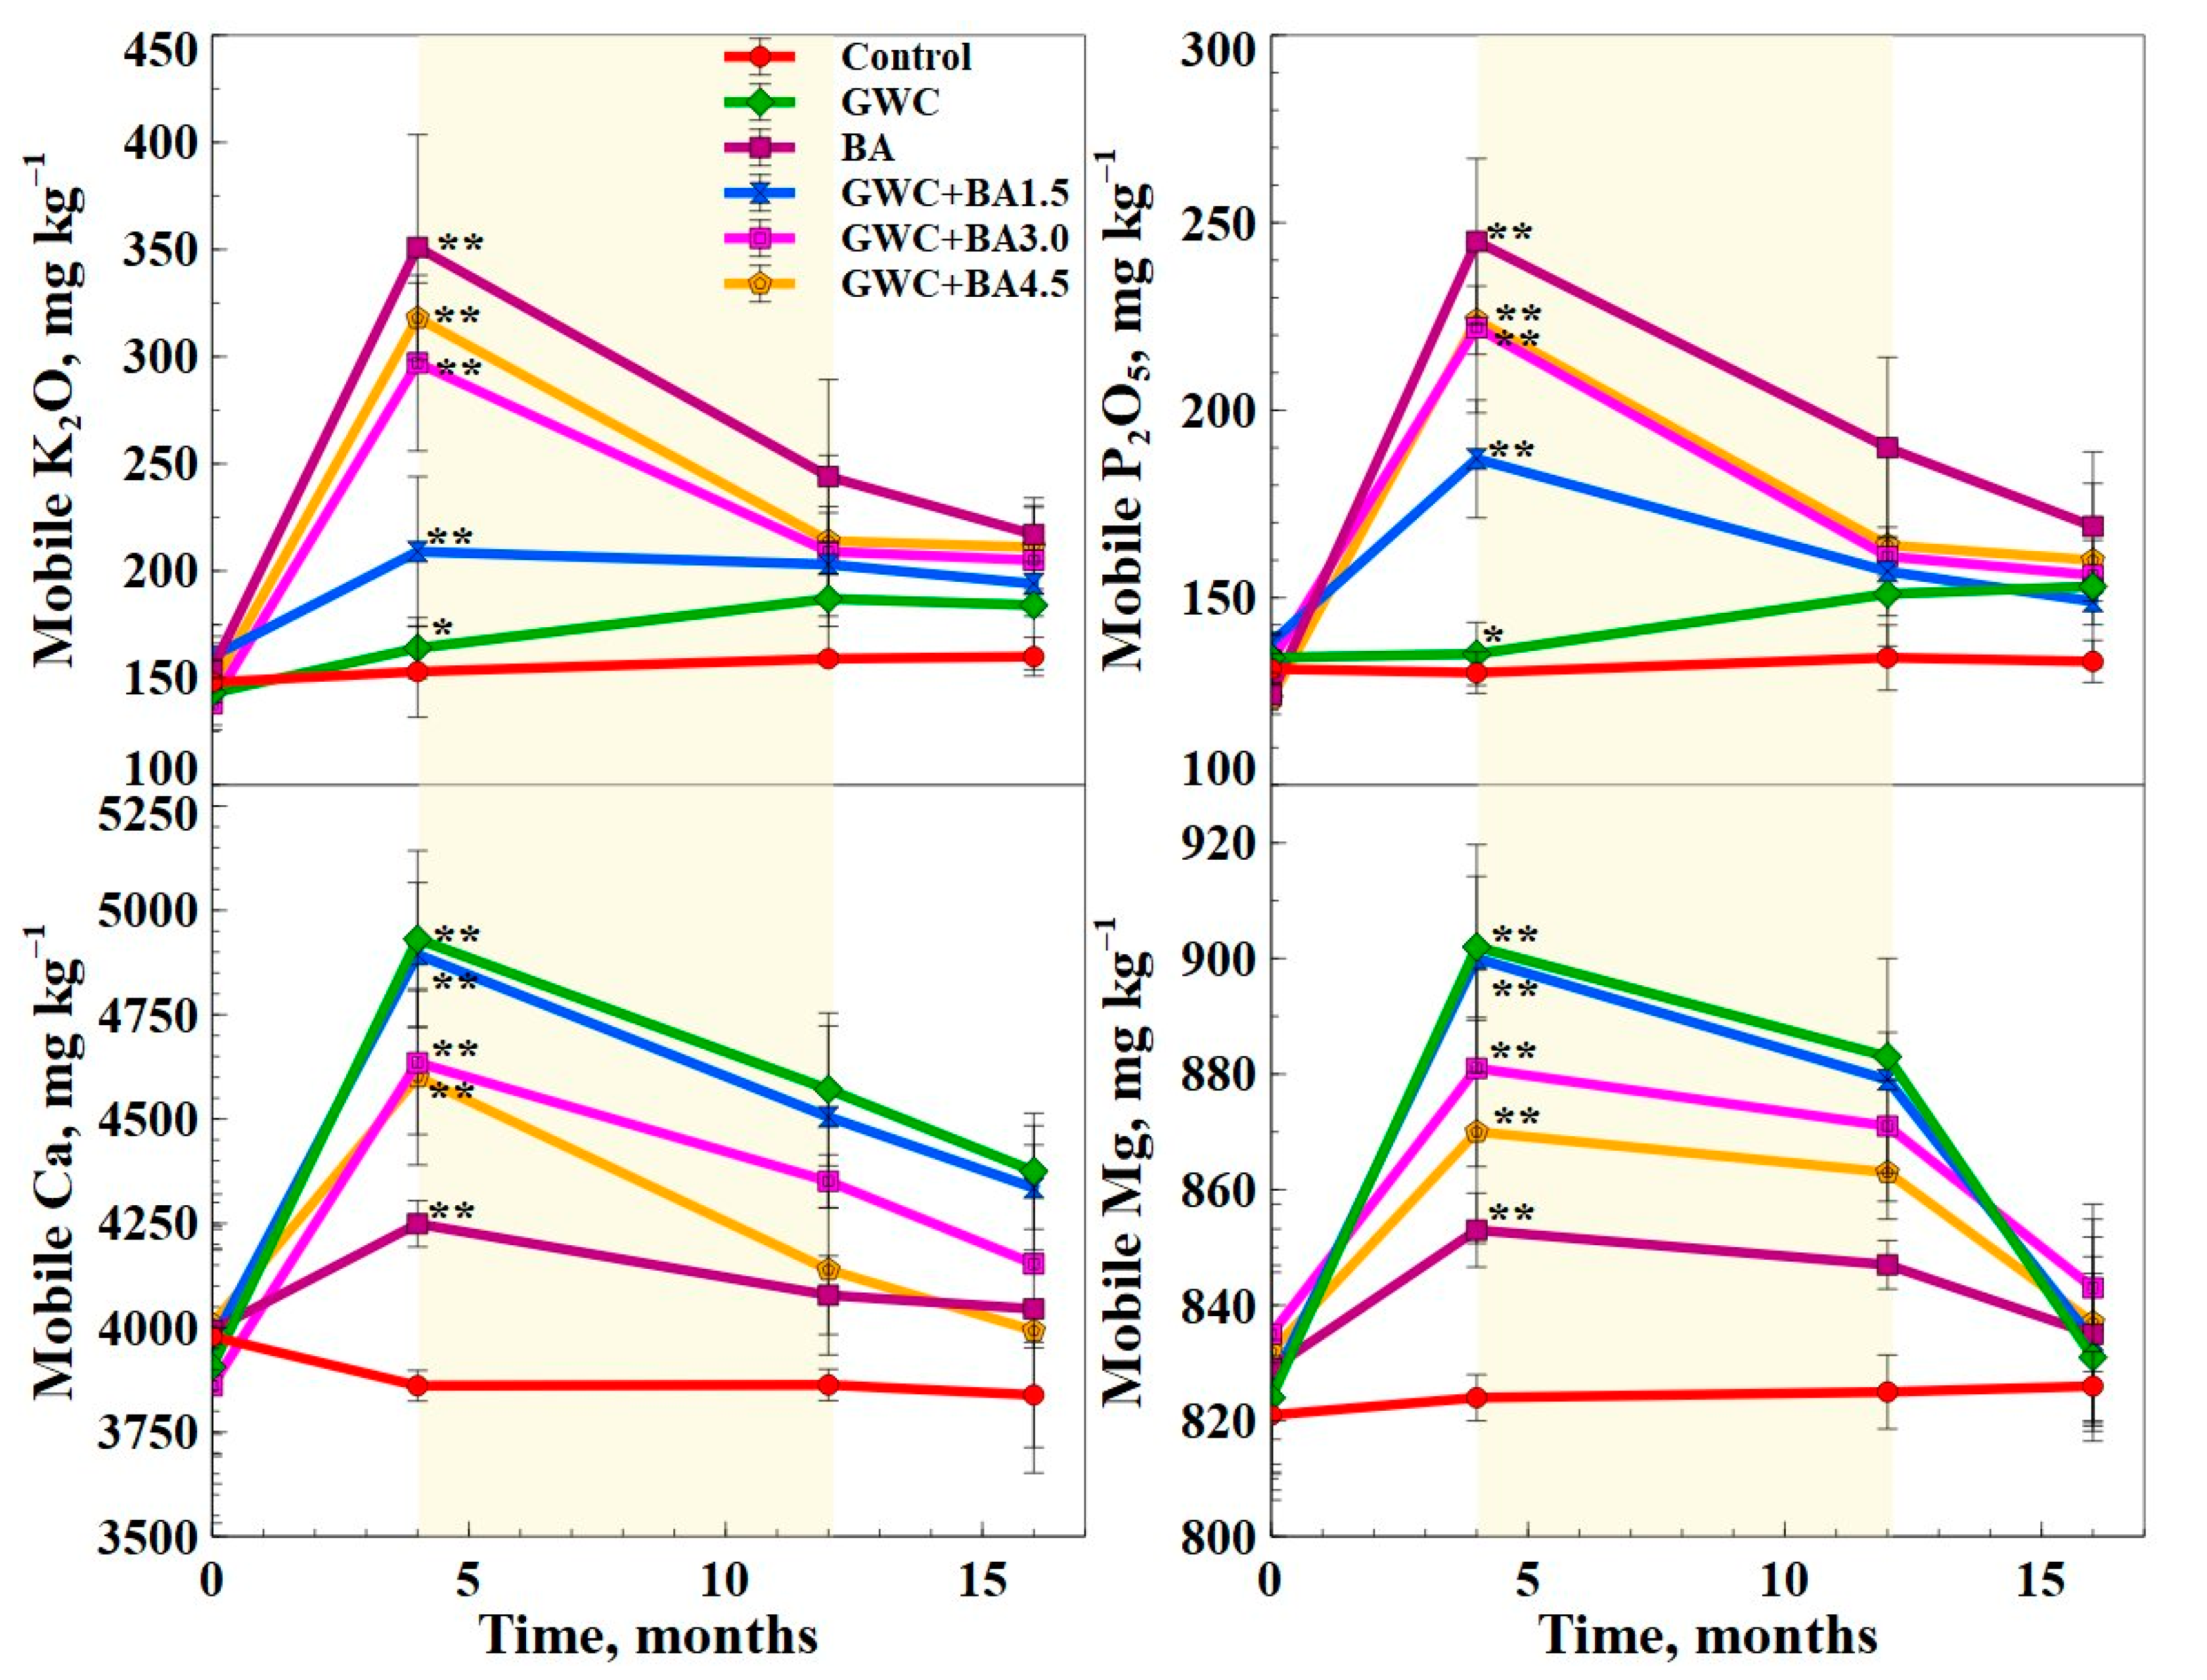
Important nutrient release patterns into the soil from the BA, GWC, and GWC + BA mixtures were measured during a 2-year field experiment and changes in mobile K2O, P2O5, Mg, and Ca in soil were recorded each year (Figure 2). Crops were harvested 4 months after the start of the experiment. After the spring wheat harvest, the amounts of mobile forms of all nutrients (K2O, P2O5, Ca, and Mg) differed significantly from the corresponding control soil. The mobile K2O amount increased linearly in treatments with BA, GWC + BA3.0, and GWC + BA4.5 as a function of BA content. This was due to the high amount of total K in the BA, suggesting the solubilization and release of normally insoluble forms of K. Differently, the mobile Ca measured in the soil increased by about 1000 mg kg−1 in the GWC and GWC + BA1.5 treatments after 4 months. The mobile Mg increased by about 80 mg kg−1 in the same treatments. Thus, the higher availability of these nutrients in the soil can also be proposed to contribute to higher nutrient uptake and an increased yield of spring wheat (vide infra). About two-fifths of the annual rainfall fell in cool weather when the soil was not covered with plants, as shown in Figure 1. As a result, the leaching of mobile Ca and Mg cations intensified, resulting in the peak measured. There was a marked decrease in soil nutrients after winter (Figure 2). The mobile Ca content in the soil closely follows the GWC content instead of BA, suggesting that, while both contain an effectively equal concentration of Ca, the latter is responsible for its facile release. However, there was still a positive nutrient balance in Year 2 of the experiment when compared to the control. An important conclusion from Figure 2 is that that mobile K2O and P2O5 are BA originated while the mobile Ca and Mg mostly originated from the GWC, providing a synergistic nutrient delivery.
Diffusion of heavy metals down the soil profile is normally difficult due to their low solubility and they are absorbed in the topsoil [21]. The most dangerous for the human body are Pb and Cd [36]. These elements are not considered to be essential for living organisms, so even small amounts of them can be detrimental [37]. Many chemical processes are involved in the transformation of these heavy metals in soil, affecting availability to plants, but precipitation–dissolution and adsorption–desorption are the most important controlling their bioavailability and mobility [13]. In the present experiments, Cd was statistically significantly (p ≤ 0.01) detected when fertilized with BA and all mixtures after the first harvest (Figure 3). After 4, 12, and 16 months, the Cd content was significantly different only when BA and GWC + BA4.5 were applied, i.e., treatments with the most BA content, as shown in Table 3. However, these did not exceed the allowable limits, as during the experiment, the Cd concentration increased to 0.25–0.30 mg kg−1. The concentration of Cd permitted in the soil is 1–3 mg kg−1 [38]. Furthermore, the Cd content at the end of the experiment in soil with the GWC + BA1.5 and GWC + BA3.0 treatments decreased. This was likely influenced by the Cd uptake by the spring wheat grain. The soil that is saturated with Ca ions is more resistant to any heavy metal release and resulting mobility because Ca (as well as Mg) reduces the availability of heavy metals to the plants [39]. This, in turn, suggests that heavy metals normally toxic to plants are more difficult to absorb using GWC + BA mixtures containing high levels of Ca and Mg.
In addition to Cd, an increase in the Zn and Cr concentrations in soil was also measured. The Zn concentration was found to be significantly different from the control in all treatments except GWC. Higher soil Zn concentrations in the BA and GWC + BA mixtures treatments compared to the GWC treatment can be explained by its large concentration in BA (Table 3). However, at the end of the experiment (after 16 months), the Zn concentration was not significantly different from the control in either treatment. A portion of it was also absorbed by spring wheat and triticale. Despite increased Zn levels, the application of BA in quantities tested in the present investigation should not create a risk for the environment. This is because the permitted amount of Zn in the soil is 150–300 mg kg−1 [38]. All of the applications used within the 2-year experiment resulted in 30–60 mg kg−1 (Figure 3). An increase in Cr was observed after 4 months, 12 months, and at the end of the experiment. The maximum allowed concentration of Cr in the soil is 100 mg kg−1 [38]. At the end of the experiment, the content was about 15–20 m kg−1, i.e., 5–7 times less than allowed. The Cu detected in the soil after 4 and 12 months differed significantly only in the BA treatment. The maximum allowed concentration of Cu is 50–140 mg kg−1. The experiment resulted in about 10 mg kg−1. Finally, another heavy metal measured in the soil, Pb, did not exhibit any significant variations over time or with the different applied fertilization treatment, as shown in Figure 3. Similarly, no Ni increase was measured in the soil beyond the control concentrations.
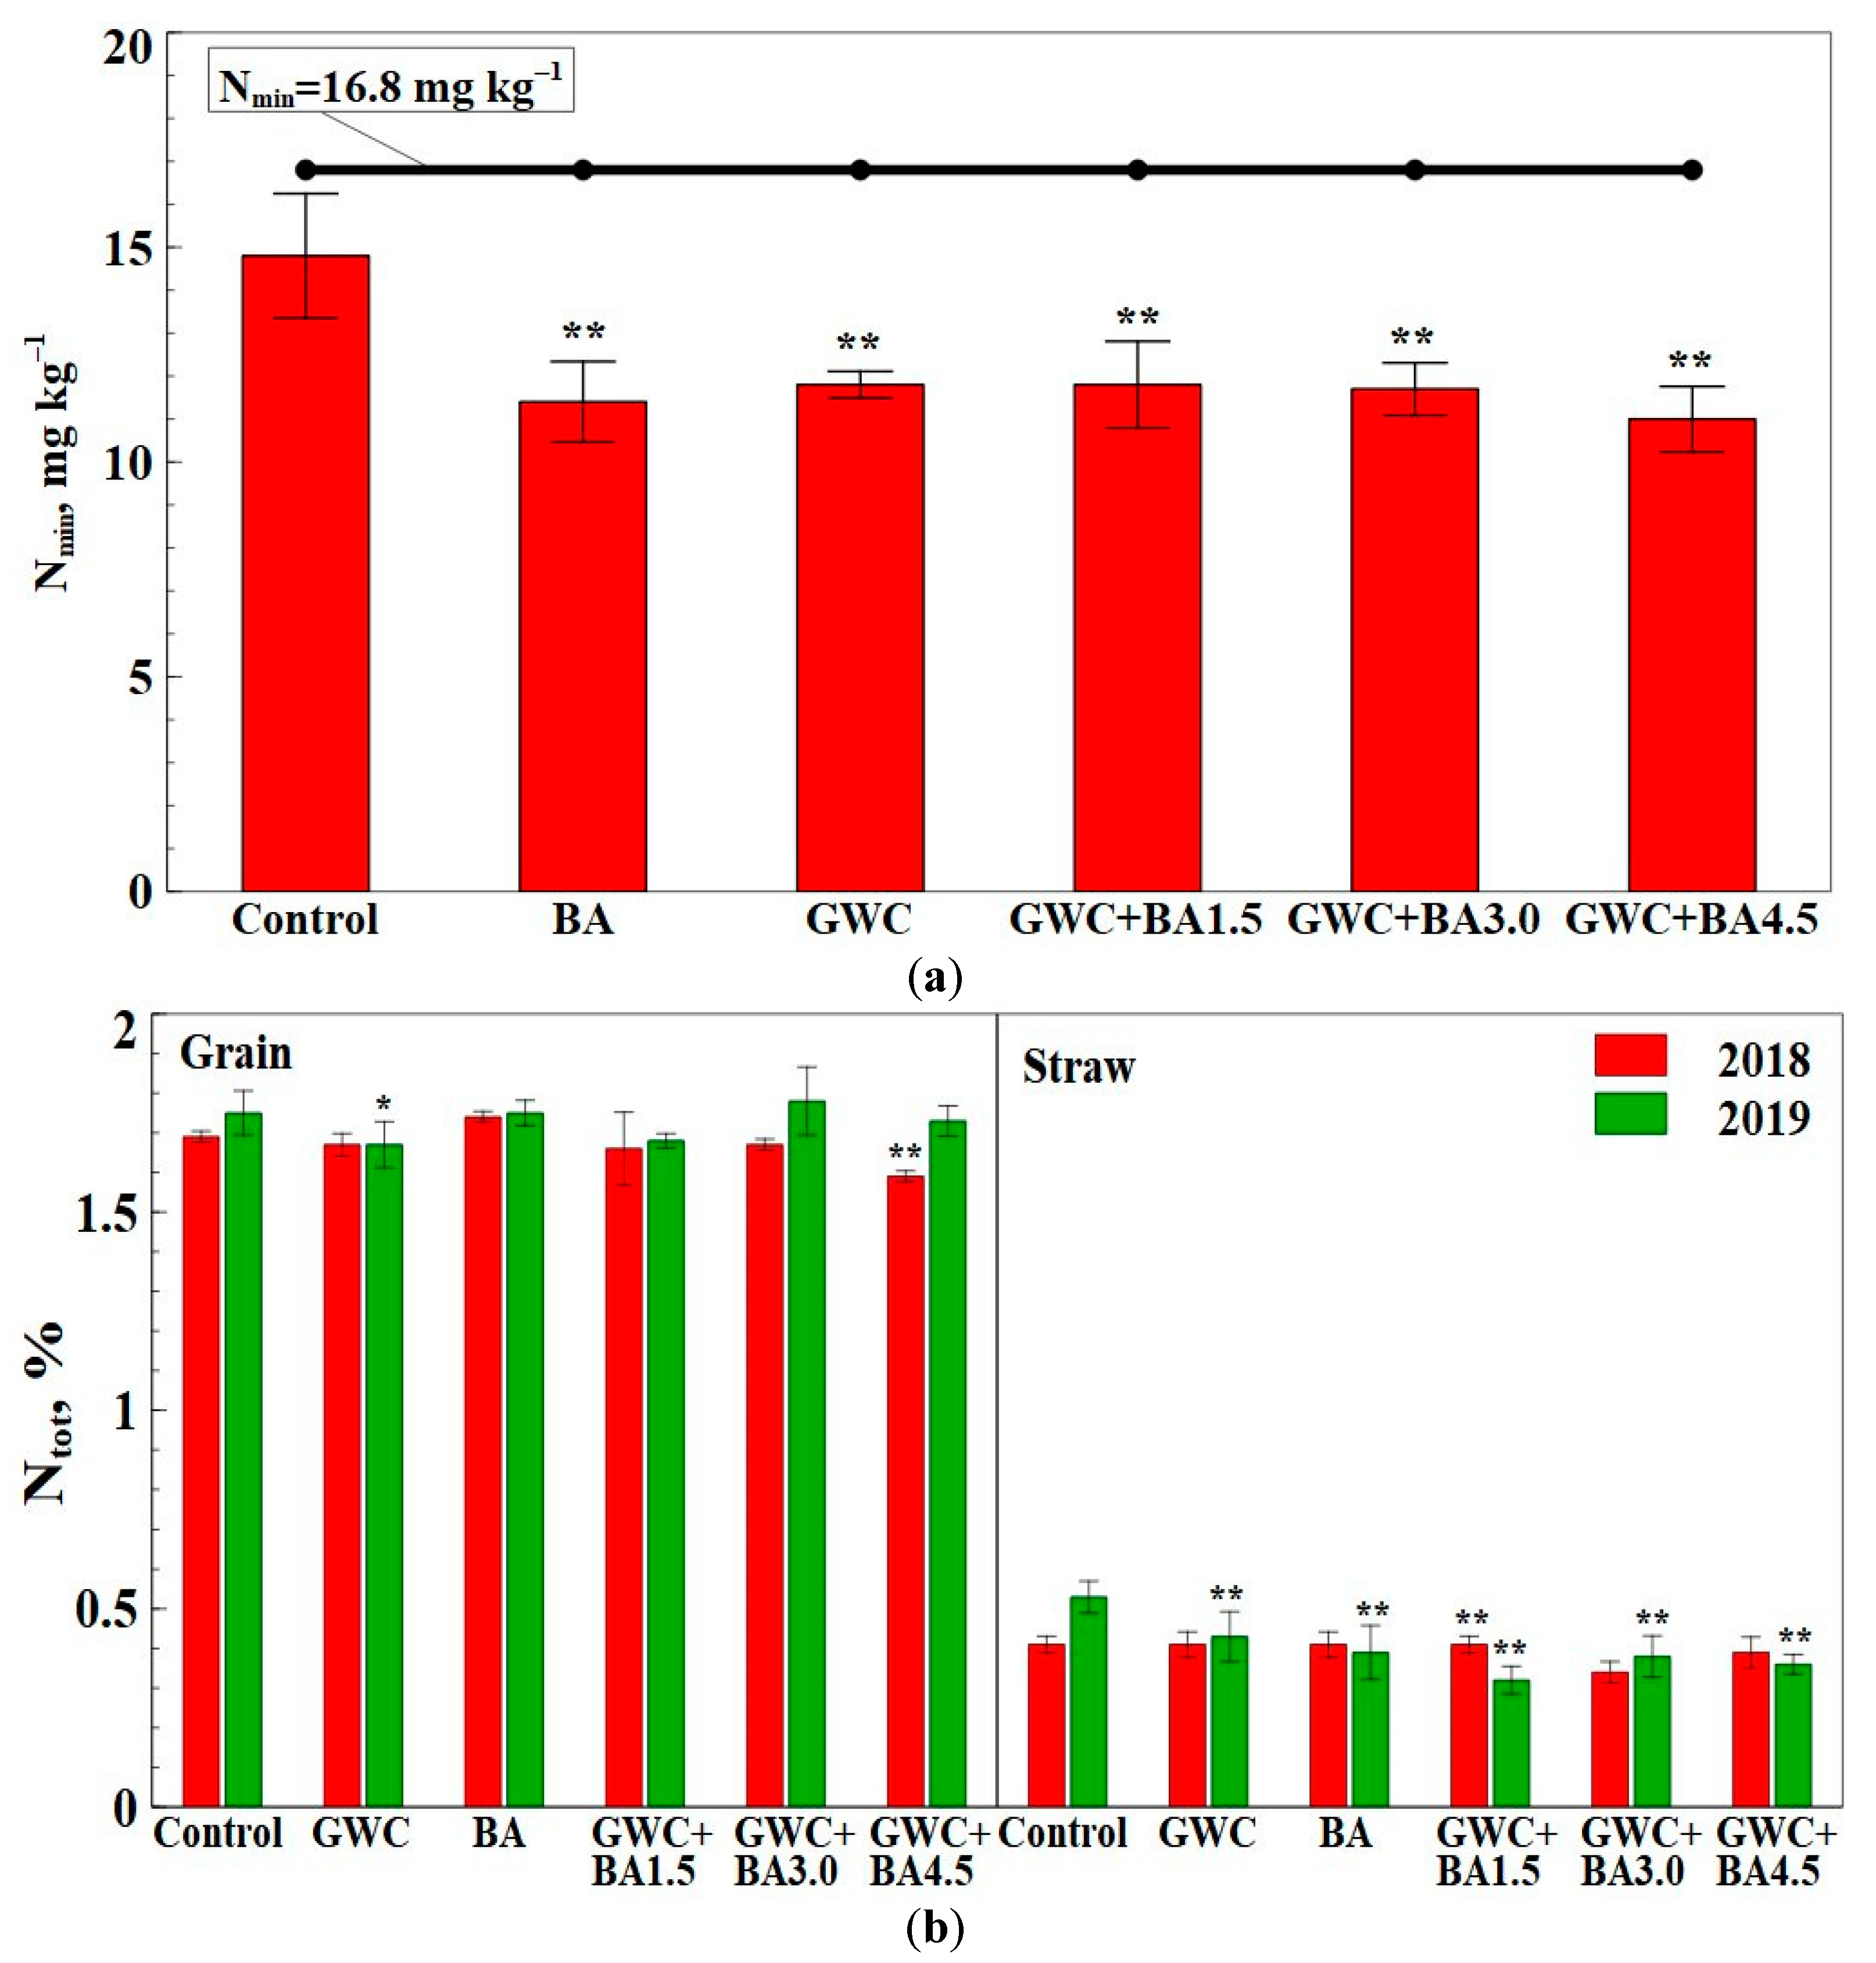
Nmin is a very important nutrient for plants and it consists of ammonia and nitrate and nitrite nitrogen [40]. Nmin was measured in the soil before and after the experiment. The results obtained are shown in Figure 4a. The Nmin before the experiment is shown with a solid line. The concentration of Nmin in the soil depends on the mineralization of organic matter, the amount of precipitation, as well as the amount of it absorbed by plants [41]. The Nmin content determined before the experiment was 16.8 mg kg−1. Nmin decreased and ranged from 11.0 to 11.8 mg kg−1 after the experiment.
Ntot was measured in the grain and straw of spring wheat and spring triticale. The results are shown in Figure 4b. It was found that the heavy metals in the mixtures did not significantly affect the Ntot uptake in the plants.

3.3. Chemical Composition of Major Nutrients and Heavy Metals in Spring Wheat and Spring Triticale Grain and Straw

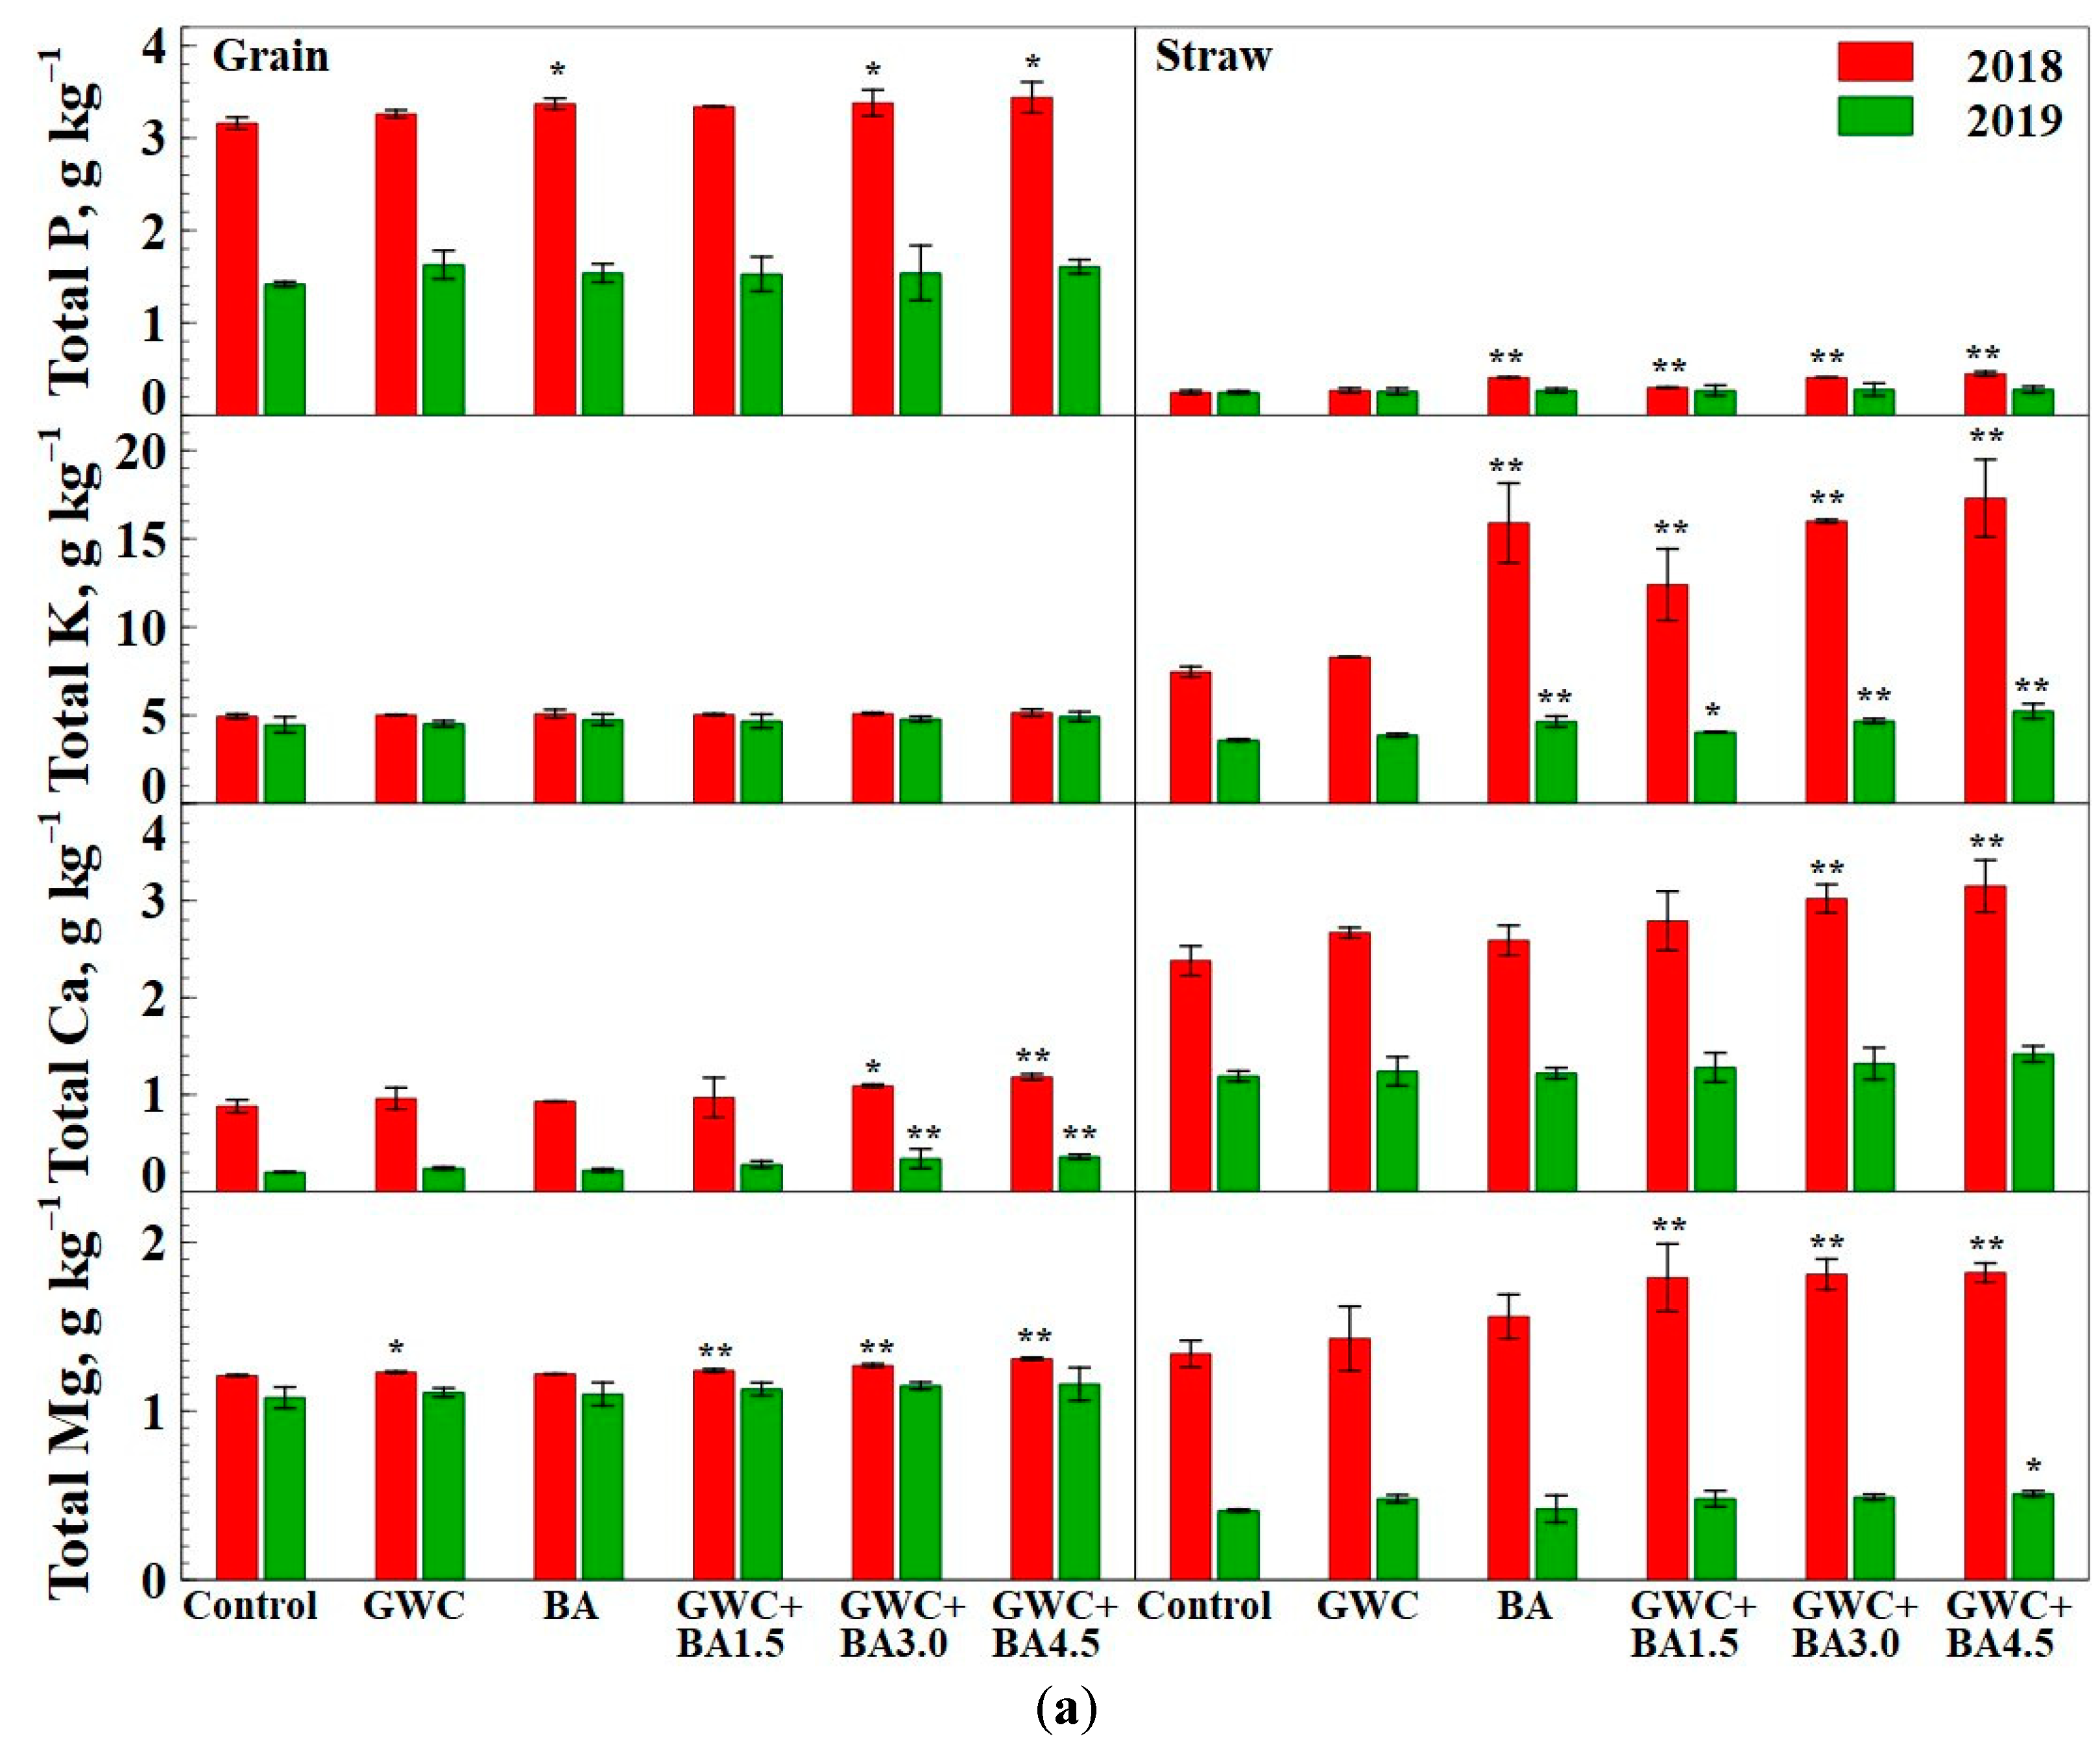
The study sought to determine whether increased levels of heavy metals in materials affect and interfere with plant nutrient uptake. It was also important to find out how much heavy metals are absorbed by plants. The comparison of the nutrient concentrations in grains and straw among the different treatments shows that total P significantly (p ≤ 0.05) increased in spring wheat grain treatments with BA, GWC + BA3.0, and GWC + BA4.5. It was determined that the amount of total P in spring wheat straw was ~10 times lower than in grain, as shown in Figure 5a. Total K content in straw was statistically significant (p ≤ 0.01) compared to control with BA and GWC + BA mixtures in 2018. Specifically, it increased ~2 times compared to the control. Interestingly, in the second year of the experiment, with no added nutrients, the straw still contained a statistically significant higher content of K. However, the total K uptake of spring triticale straw in 2019 was ~5 g kg−1 when compared to ~20 g kg−1 in 2018. Hence, while there is a significant immediate nutrient release effect, a slow-release pattern can be suggested to last into the second year of experiments. The total amount of K in the cereals was not statistically significant compared to the control in both study years. The amount of total Ca in straw during the first year of the experiment was twice as high as in grain (Figure 5a). However, only GWC + BA3.0 and GWC + BA4.5 differed significantly (p ≤ 0.01) from the control. In the second year of the experiment, the total Ca content of the same treatments was also statistically significant (p ≤ 0.01) in the spring triticale grain. Analysis of total Mg in spring wheat and triticale grain and straw showed that the total Mg content of straw in the first year of the study was statistically significant (p ≤ 0.01) with GWC + BA mixtures. Spring wheat straw absorbed ~3 times more Mg than spring triticale. The Mg content of the grain was about 1.2 g kg−1 in both experimental years. As expected, all nutrients (total P, K, Ca, and Mg) tested were lower in the spring wheat and triticale grains and straw in the second year of the study.
Zn is an essential micronutrient and phytotoxic only at enough high concentrations in plants of about 100–500 mg kg−1, whereas Cd becomes toxic at much lower concentrations of 10–20 mg kg−1 [42]. The measured grain Zn concentrations in this experiment were ~17–20 mg kg−1 in both experiment years while the straw Zn concentrations were about 2 to 3 times lower from 2018 to 2019 (Figure 5b). The Cd mobility is higher compared to other heavy metals (Cd > Ni > Zn > Cu > Pb = Cr) [43] and thus it has a high potential for bioaccumulation in food. According to European legislation [44], the permitted Cd concentration in grains is 0.2 mg kg−1. The average grain Cd concentration measured in this work was <0.05 mg kg−1. Straw Cd concentrations showed similar trends to those of the grain Cd. However, Cd exhibited a statistically significant difference between the grains with the BA and GWC + BA mixtures. The amount of Cd in straw was statistically different from the control when BA was used. Although the concentration of Cu in the soils varied only in the BA treatment (Figure 3), it varied significantly in the spring wheat straw with the BA and all GWC + BA mixtures (Figure 5b). The concentration of Cu in spring wheat grain also increased with BA, GWC + BA3.0 and GWC + BA4.5. Cu from GWC + BA was absorbed by the grain and the straw and part of it leached into the groundwater. Spring wheat and spring triticale grain and straw data indicate that many application rates of BA can be applied on this type of soil as it does not appear to accumulate potentially toxic trace elements.

3.4. Quantifying Spring Wheat and Spring Triticale Grain Yields

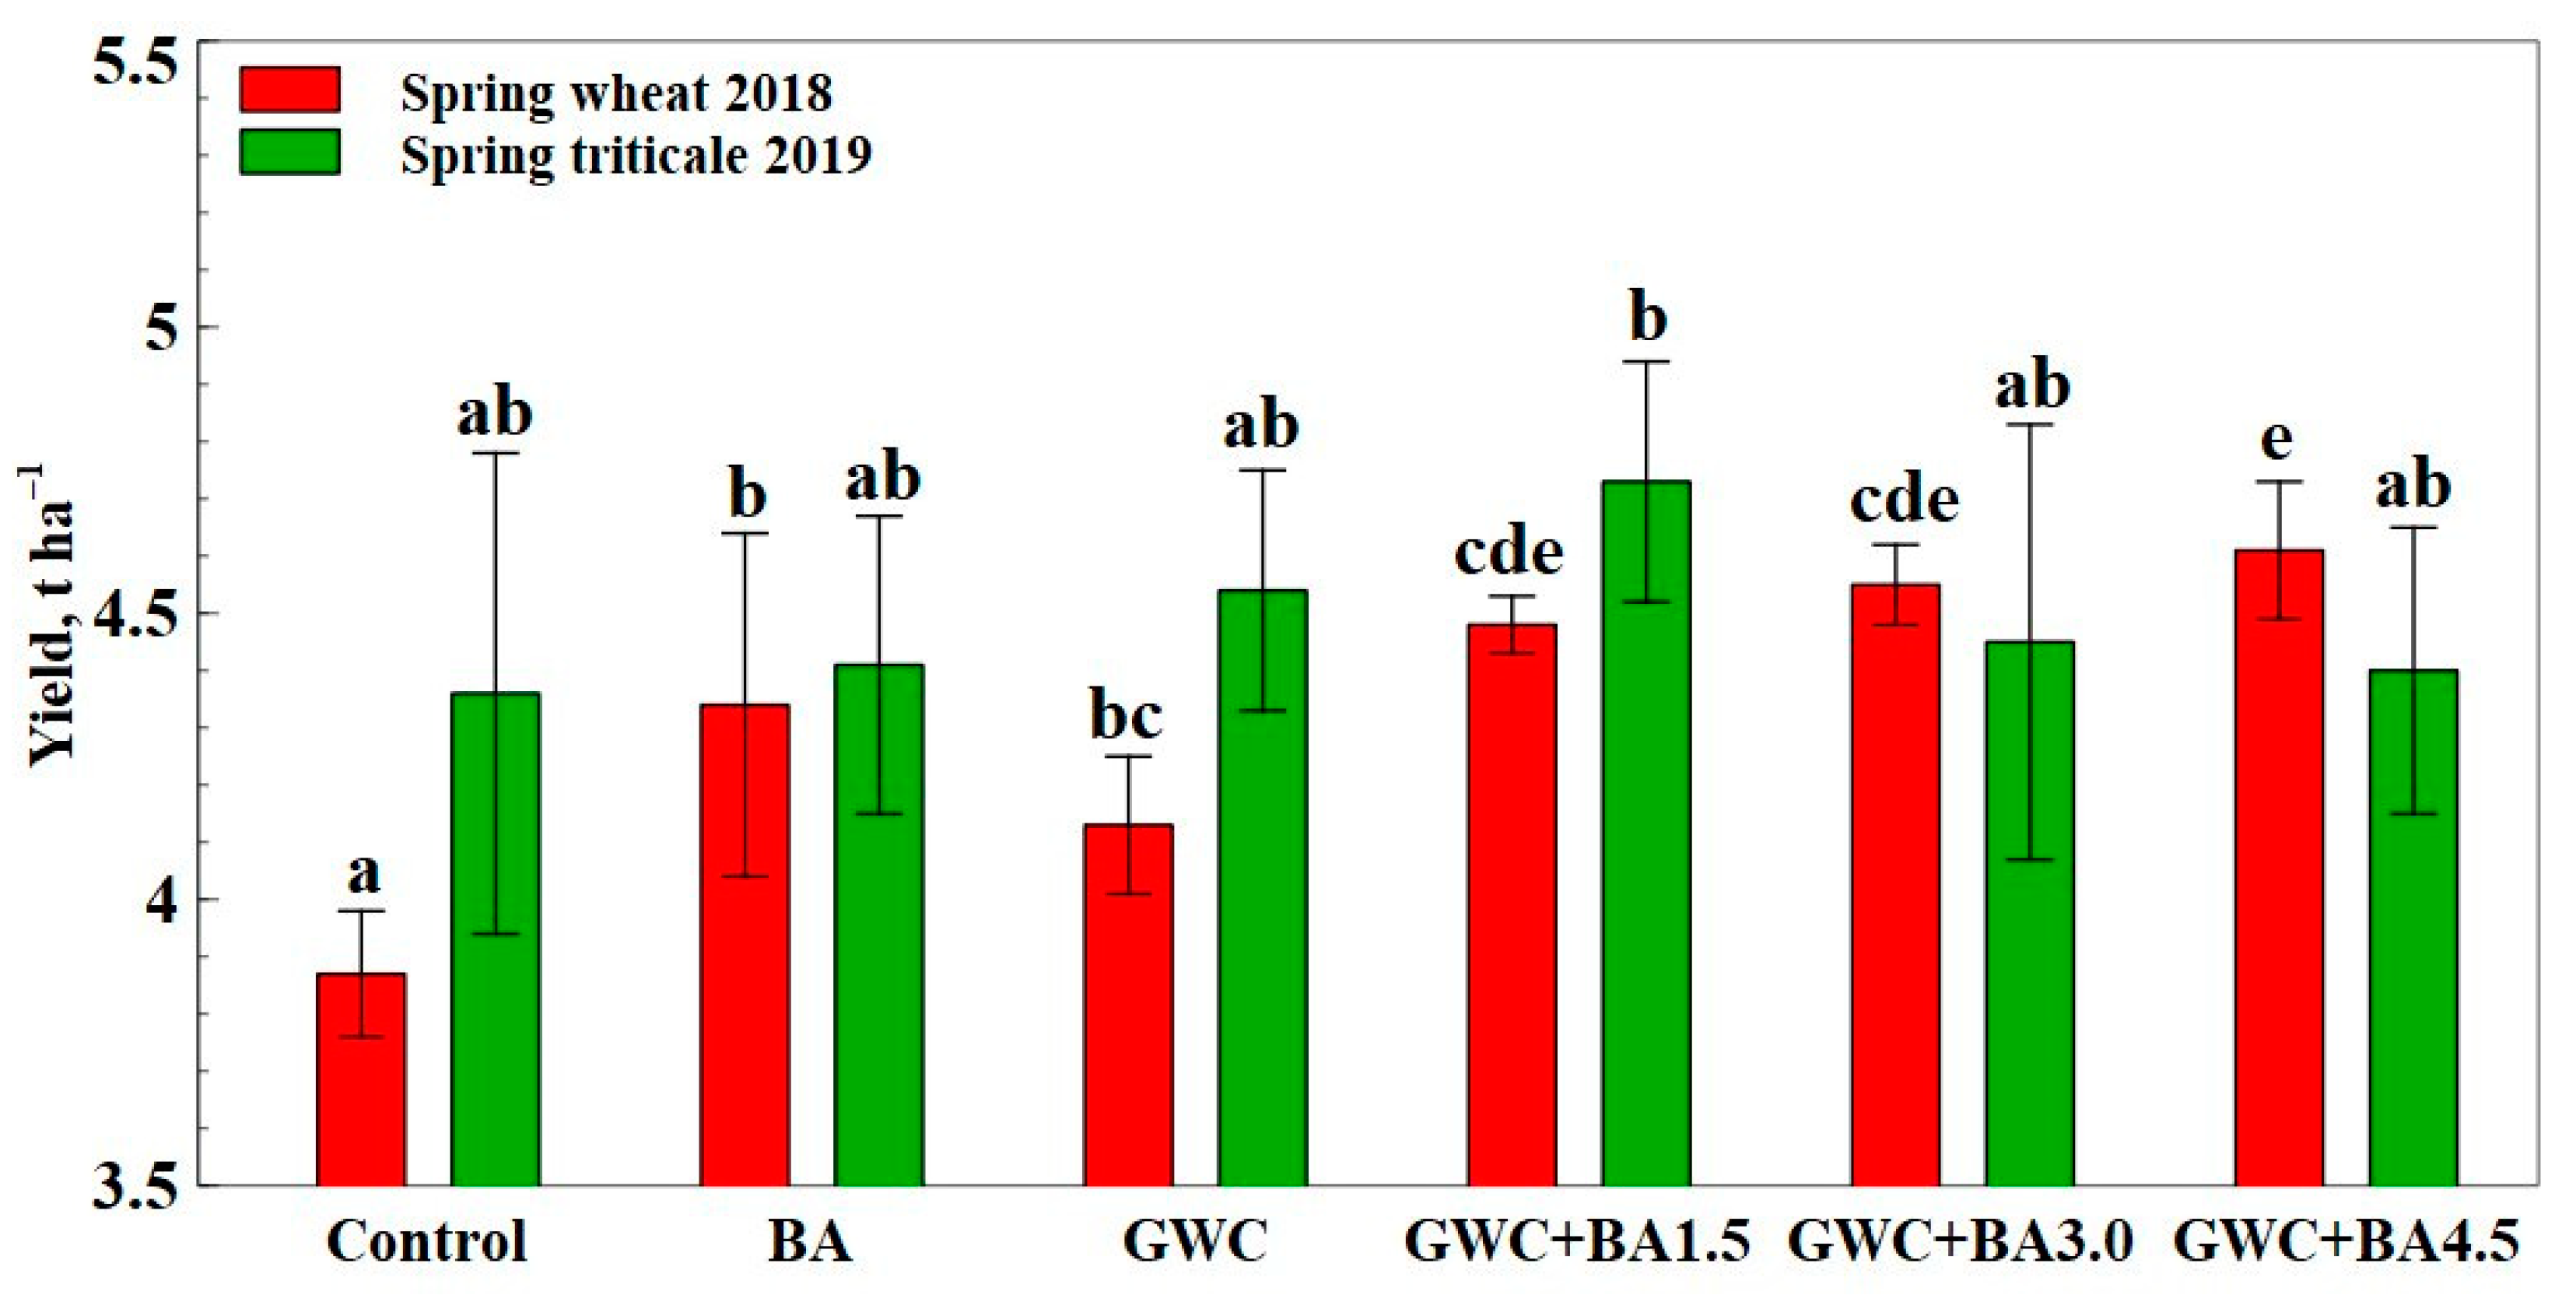
Grain yield improvement of the selected crops used in the rotation, when fertilized using BA, GWC, and GWC + BA mixtures, is shown in Figure 6. In the first year of the experiment, there was a statistically significant (p < 0.01) increase in spring wheat grain yield in all variants compared to the control. The highest increase in spring wheat grain yield was achieved by fertilization with the GWC + BA4.5 mixture, i.e., spring wheat yield was obtained at 4.61 t ha−1 (Figure 6). The lowest increase was observed in fertilization with pure green waste compost and was 6.8% higher compared to the control.
In the second year of the experiment, when fertilization was not conducted, the BA, GWC, and GWC + BA still increased the spring triticale grain yield, but the increase was not statistically significant, as shown in Figure 6. This was likely due to the reduced nutrient content in the soil after 12 months, as shown in Figure 2, as significant rainfall took place in the winter after the first year of the experiment. The amount of precipitation in the 2018–2019 winter was 1.6 times higher than the long-term (1928–2018) average, as shown in Figure 1. In contrast to the first year, spring triticale grain yield was greatest when amended with GWC + BA1.5 and GWC. Interestingly, for the BA, GWC + BA3.0, and GWC + BA4.5, the yield improvement was the lowest. BA contains high basicity (>12 pH units), potentially slowing down spring triticale growth. A notable second-year yield increase in GWC and GWC + BA1.5 can be associated with the unique properties of GWC itself. In particular, GWC is known to (a) slowly decompose and release plant absorbable carbon [45]; (b) decrease large cations and micronutrient release into the soil [46]; and (c) bind (chelate) heavy metals, thus making them not readily available for the crops [47]. This capacity is likely limited, as suggested by much lower 2-year yields with GWC + BA3.0 and GWC + BA4.5. Furthermore, the nutrients from BA are likely at a sufficient content and release rate to sustain plant growth in the first year of experiments but the presence of GWC likely extends their availability, as shown in Figure 6.
The secondary use of raw materials (BA and GWC) is linked to a sustainable environment. From the overall results, it can be seen that ash enriched the compost with the P and K needed by the plants. BA + GWC mixtures increased the grain yield by up to 20% compared to the control (in the first year of the experiment). The results also showed that higher rates of BA can be used in mixtures. Spring wheat and spring triticale appear to accumulate few potentially toxic elements (Pb, Ni, Cr) when using 1.5, 3.0, and 4.5 t ha−1 BA rates in mixtures.
An experiment with BA + GWC mixtures is being carried out in acidic and depleted soils (pH 5.5). The results obtained from this and future experiments will help to evaluate the uptake of nutrients and heavy metals in plants in soils with a different pH.

4. Conclusions

In this work, BA combined with GWC was used as nutrient-containing materials to test their synergistic properties towards wheat and triticale growth. In particular, BA and GWC were applied thoroughly mixed. The resulting mixtures were analyzed for their chemistry and tested in a field experiment (2018–2019) towards their propensity to release nutrients. The experimental design focused on (1) the control; (2) BA; (3) GWC; (4) GWC + BA1.5; (5) GWC + BA3.0; and (6) GWC + BA4.5. The results obtained in this work showed that the highest increase in spring wheat grain yield was achieved by fertilization with the GWC + BA4.5 mixture, i.e., spring wheat yield was obtained at 4.61 t ha−1. The lowest increase was observed in fertilization with pure green waste compost and was 6.8% higher compared to the control. In the second year of the experiment, when fertilization was not conducted, BA, GWC, and GWC + BA still increased the spring triticale grain yield, but the increase was not statistically significant. After the first harvest, an increase in the mobile forms of all the measured nutrients (K2O, P2O5, Ca, and Mg) was observed in the soil. No fertilization was performed in the second year of the study. Consecutively, a marked decrease in all soil nutrients was observed after 12 months. The content of heavy metals (Cd, Zn, and Cr) in the soil increased significantly compared to the control. Total P increased in grain and K, Ca, and Mg in straw. Only three heavy metals (Cd, Zn, and Cu) were detected in grain and straw. The results obtained show that the application of BA together with GWC results in less heavy metal transfer to the crops.

Author Contributions

Conceptualization, K.B. and R.M.; methodology, K.B. and R.M.; software, K.B.; validation, K.B.; formal analysis, K.B. and D.D.; investigation, K.B. and D.D.; data curation, K.B. and J.B.; writing—original draft preparation, K.B. and J.B.; writing—review and editing, K.B. and J.B.; visualization, K.B.; supervision, J.B. All authors have read and agreed to the published version of the manuscript.

Funding

This work is supported by Engineering for Agricultural Production Systems program grant no. 2020-67022-31144 from the USDA National Institute of Food and Agriculture (Washington, DC, USA).

Institutional Review Board Statement

Not applicable.

Informed Consent Statement

Not applicable.

Data Availability Statement

Data is contained within the article.

Acknowledgments

Many thanks to the researchers from the Agrobiology Laboratory and Department of Plant Nutrition and Agroecology of the Institute of Agriculture, Lithuanian Research Centre for Agriculture and Forestry.

Conflicts of Interest

The authors declare no conflict of interest.

References

  1. Karak, T.; Bhagat, R.M.; Bhattacharyya, P. Municipal solid waste generation, composition, and management: The world scenario. Crit. Rev. Environ. Sci. Technol. 2012, 42, 1509–1630. [Google Scholar] [CrossRef]
  2. Lam, C.H.K.; Ip, A.W.M.; Barford, J.P.; McKay, G. Use of incineration MSW ash: A review. Sustainability 2010, 2, 1943–1968. [Google Scholar] [CrossRef] [Green Version]
  3. Brannvall, E.; Nilsson, M.; Sjoblom, R.; Skoglund, N.; Kumpiene, J. Effect of residue combinations on plant uptake of nutrients and potentially toxic elements. J. Environ. Manag. 2014, 132, 287–295. [Google Scholar] [CrossRef] [PubMed] [Green Version]
  4. Bang-Andreasen, T.; Nielsen, J.T.; Voriskova, J.; Heise, J.; Ronn, R.; Kjoller, R.; Hansen, H.C.B.; Jacobsen, C.S. Wood ash induced pH changes strongly affect soil bacterial numbers and community composition. Front. Microbiol. 2017, 8, 1400. [Google Scholar] [CrossRef] [PubMed]
  5. Bougnom, B.P.; Insam, H. Ash additives to compost affect soil microbial communities and apple seedling growth. Die Bodenkult. 2009, 60, 5–15. [Google Scholar]
  6. Fernandez-Delgado Juarez, M.; Prahauser, B.; Walter, A.; Insam, H.; Franke-Whittle, I.H. Co-composting of biowaste and wood ash, influence on a microbially driven-process. Waste Manag. 2015, 46, 155–164. [Google Scholar] [CrossRef]
  7. Karnchanawong, S.; Najarut, Y. Effects of composts from co-composting of tree pruning waste, cow dung, and biomass fly ash on soil acidity neutralization and growth of chinese cabbage. Adv. Mater. Res. 2014, 954, 168–172. [Google Scholar] [CrossRef]
  8. Huotari, N.; Tillman-Sutela, E.; Moilanen, M.; Laiho, R. Recycling of ash—For the good of the environment? For. Ecol. Manag. 2015, 348, 226–240. [Google Scholar] [CrossRef]
  9. Yao, Q.; Samad, N.B.; Keller, B.; Seah, X.S.; Huang, L.; Lau, R. Mobility of heavy metals and rare earth elements in incineration bottom ash through particle size reduction. Chem. Eng. Sci. 2014, 118, 214–220. [Google Scholar] [CrossRef]
  10. Kuba, T.; Tscholl, A.; Partl, C.; Meyer, K.; Insam, H. Wood ash admixture to organic wastes improves compost and its performance. Agric. Ecosyst. Environ. 2008, 127, 43–49. [Google Scholar] [CrossRef]
  11. Jokinen, H.K.; Kiikkila, O.; Fritze, H. Exploring the mechanisms behind elevated microbial activity after wood ash application. Soil Biol. Biochem. 2006, 38, 2285–2291. [Google Scholar] [CrossRef]
  12. Koivula, N.; Raikkonen, T.; Urpilainen, S.; Ranta, J.; Hanninen, K. Ash in composting of source-separated catering waste. Bioresour. Technol. 2004, 93, 291–299. [Google Scholar] [CrossRef] [PubMed]
  13. Buneviciene, K.; Drapanauskaite, D.; Mazeika, R.; Tilvikiene, V.; Baltrusaitis, J. Granulated biofuel ash as a sustainable source of plant nutrients. Waste Manag. Res. 2020, in press. [Google Scholar] [CrossRef]
  14. Buneviciene, K.; Drapanauskaite, D.; Mazeika, R.; Tilvikiene, V. Biofuel ash granules as a source of soil and plant nutrients. Zemdirb. Agric. 2021, 108, 19–26. [Google Scholar] [CrossRef]
  15. Višniauskė, I.; Barčauskaitė, K.; Bakšienė, E.; Mažeika, R. Evaluation of contamination levels of different types of composts and their suitability for usage in agriculture. Zemdirb. Agric. 2018, 105, 211–220. [Google Scholar] [CrossRef] [Green Version]
  16. Bougnom, B.P.; Mair, J.; Etoa, F.X.; Insam, H. Composts with wood ash addition: A risk or a chance for ameliorating acid tropical soils? Geoderma 2009, 153, 402–407. [Google Scholar] [CrossRef]
  17. The Council of European Communities. Council directive concerning the protection of waters against pollution caused by nitrates from agricultural sources (91/676/EEC). Off. J. Eur. Commun. 1991, L 375, 1–8.
  18. Asquer, C.; Cappai, G.; De Gioannis, G.; Muntoni, A.; Piredda, M.; Spiga, D. Biomass ash reutilisation as an additive in the composting process of organic fraction of municipal solid waste. Waste Manag. 2017, 69, 127–135. [Google Scholar] [CrossRef]
  19. WBR. World Reference base for Soil Resources; WBR: New York, NY, USA, 2014; Volume 43, pp. 187–189. [Google Scholar] [CrossRef]
  20. Oreshkin, N.G. Extraction of mobile forms of phosphorus and potassium by the Egner-Riehm-Domingo method. Agrokhimiia 1980, 8, 135–138. [Google Scholar]
  21. SAS Institute. The SAS System for Windows Version 9.3; SAS Institute: Cary, NC, USA, 2011. [Google Scholar]
  22. Abou-el-Seoud, I.I.; Abdel-Megeed, A. Impact of rock materials and biofertilizations on P and K availability for maize (Zea Maize) under calcareous soil conditions. Saudi J. Biol. Sci. 2012, 19, 55–63. [Google Scholar] [CrossRef] [Green Version]
  23. Barčauskaitė, K.; Žydelis, R.; Mažeika, R. Screening of chemical composition and risk index of different origin composts produced in Lithuania. Environ. Sci. Pollut. Res. 2020, 27, 24480–24494. [Google Scholar] [CrossRef] [PubMed]
  24. Hasan, K.M.M.; Sarkar, G.; Alamgir, M.; Bari, Q.H.; Haedrich, G. Study on the quality and stability of compost through a demo compost plant. Waste Manag. 2012, 32, 2046–2055. [Google Scholar] [CrossRef]
  25. Barrena, R.; Font, X.; Gabarrell, X.; Sanchez, A. Home composting versus industrial composting: Influence of composting system on compost quality with focus on compost stability. Waste Manag. 2014, 34, 1109–1116. [Google Scholar] [CrossRef] [PubMed] [Green Version]
  26. Bera, R.; Datta, A.; Bose, S.; Dolui, A.K.; Chatterjee, A.K.; Dey, G.C.; Barik, A.K.; Sarkar, R.K.; Majumdar, D.; Seal, A. Comparative evaluation of compost quality, process convenience and cost under different composting methods to assess their large scale adoptability potential as also complemented by compost quality index. Int. J. Sci. Res. Publ. 2013, 3, 1–11. [Google Scholar]
  27. Suhu, S.K.; Pattanayak, S.K.; Mahananda, M.R. Compost quality assessment for successful organic waste recycling. An Int. Q. J. Environ. Sci. 2013, 3, 199–203. [Google Scholar] [CrossRef]
  28. Karltun, E.; Saarsalmi, A.; Ingerslev, M.; Mandre, M.; Andersson, S.; Gaitnieks, T.; Ozolinčius, R.; Varnagiryte-Kabasinskiene, I. Wood ash recycling—Possibilities and risks. In Sustainable Use of Forest Biomass for Energy; Springer: Dordrecht, The Netherlands, 2008; pp. 79–108. [Google Scholar] [CrossRef]
  29. Knapp, B.A.; Insam, H. Current technologies and future research needs. In Recycling of Biomass Ashes; Springer: Berlin/Heidelberg, Germany, 2011; pp. 1–16. [Google Scholar] [CrossRef]
  30. Pesonen, J.; Kuokkanen, V.; Kuokkanen, T.; Illikainen, M. Co-granulation of bio-ash with sewage sludge and lime for fertilizer use. J. Environ. Chem. Eng. 2016, 4, 4817–4821. [Google Scholar] [CrossRef]
  31. Mainardis, M.; Flaibani, S.; Mazzolini, F.; Peressotti, A.; Goi, D. Techno-economic analysis of anaerobic digestion implementation in small Italian breweries and evaluation of biochar and granular activated carbon addition effect on methane yield. J. Environ. Chem. Eng. 2019, 7, 103184. [Google Scholar] [CrossRef]
  32. Aissaoui, H.; Barkat, D. Physico-chemical characterizations and impact of organic matter on the dynamics of heavy metals (Cu, and Zn) in some soils of Biskra (Algeria). J. King Saud Univ. Sci. 2018, 32, 307–311. [Google Scholar] [CrossRef]
  33. Yliniemi, J.; Pesonen, J.; Tiainen, M.; Illikainen, M. Alkali activation of recovered fuel-biofuel fly ash from fluidised-bed combustion: Stabilisation/solidification of heavy metals. Waste Manag. 2015, 43, 273–282. [Google Scholar] [CrossRef]
  34. Lietuvos Respublikos Aplinkos Ministerija. Dėl Biologiškai Skaidžių Atliekų Kompostavimo, Anaerobinio Apdorojimo Aplinkosauginių Reikalavimų Patvirtinimo. 2007, p. D1-57. Available online: https://e-seimas.lrs.lt/portal/legalAct/lt/TAD/TAIS.292658/asr (accessed on 25 March 2021).
  35. United States Environmental Protection Agency. Background Report on Fertilizer Use, Contaminants and Regulations; United States Environmental Protection Agency: Washington, DC, USA, 1999; pp. 1–395.
  36. Morais, S.; e Costa, F.G.; de Lourdes Pereir, M. Heavy metals and human health. Environ. Health Emerg. Issues Pract. 2012, 10, 227–246. [Google Scholar] [CrossRef] [Green Version]
  37. Moreno-Jimenez, E.; Fernandez, J.M.; Puschenreiter, M.; Williams, P.N.; Plaza, C. Availability and transfer to grain of As, Cd, Cu, Ni, Pb and Zn in a barley agri-system: Impact of biochar, organic and mineral fertilizers. Agric. Ecosyst. Environ. 2016, 219, 171–178. [Google Scholar] [CrossRef]
  38. European Commission. Protection of the Environment, and in particular of the soil, when sewage sludge is used in agriculture. Off. J. Eur. Commun. 1986, 4, 6–12. [Google Scholar]
  39. Olaniran, A.O.; Balgobind, A.; Pillay, B. Bioavailability of heavy metals in soil: Impact on microbial biodegradation of organic compounds and possible improvement strategies. Int. J. Mol. Sci. 2013, 14, 10197–10228. [Google Scholar] [CrossRef] [PubMed] [Green Version]
  40. Brod, E.; Haraldsen, T.K.; Breland, T.A. Fertilization effects of organic waste resources and bottom wood ash: Results from a pot experiment. Agric. Food Sci. 2012, 21, 332–347. [Google Scholar] [CrossRef] [Green Version]
  41. Larcher, W. Physiological Plant Ecology: Ecophysiology and Stress Physiology of Functional Groups; Springer Science & Business Media: Berlin/Heidelberg, Germany, 2003; p. 12. [Google Scholar]
  42. Kabata-Pendias, A. Trace Elements in Soils and Plants; CRC Press: Boca Raton, FL, USA, 2001; pp. 1–86. [Google Scholar]
  43. Kim, R.-Y.; Yoon, J.-K.; Kim, T.-S.; Yang, J.E.; Owens, G.; Kim, K.-R. Bioavailability of heavy metals in soils: Definitions and practical implementation—A critical review. Environ. Geochem. Health 2015, 37, 1041–1061. [Google Scholar] [CrossRef]
  44. European Commission. Commission Regulation (EC) No 1881/2006 of Setting Maximum Levels for Certain Contaminants in Foodstuffs; Cambridge University Press: Cambridge, UK, 2006; pp. 1–29. [Google Scholar] [CrossRef]
  45. European Commission. Applying Compost Benefits and Needs; European Commission: Brussels, Belgium, 2001; pp. 1–282. [Google Scholar]
  46. Adugna, G. A review on impact of compost on soil properties, water use and crop productivity. Acad. Res. J. Agric. Sci. Res. 2016, 4, 93–104. [Google Scholar] [CrossRef]
  47. Huang, M.; Zhu, Y.; Li, Z.; Huang, B.; Luo, N.; Liu, C.; Zeng, G. Compost as a soil amendment to remediate heavy metal-contaminated agricultural soil: Mechanisms, efficacy, problems, and strategies. Water Air. Soil Pollut. 2016, 359, 1–18. [Google Scholar] [CrossRef]
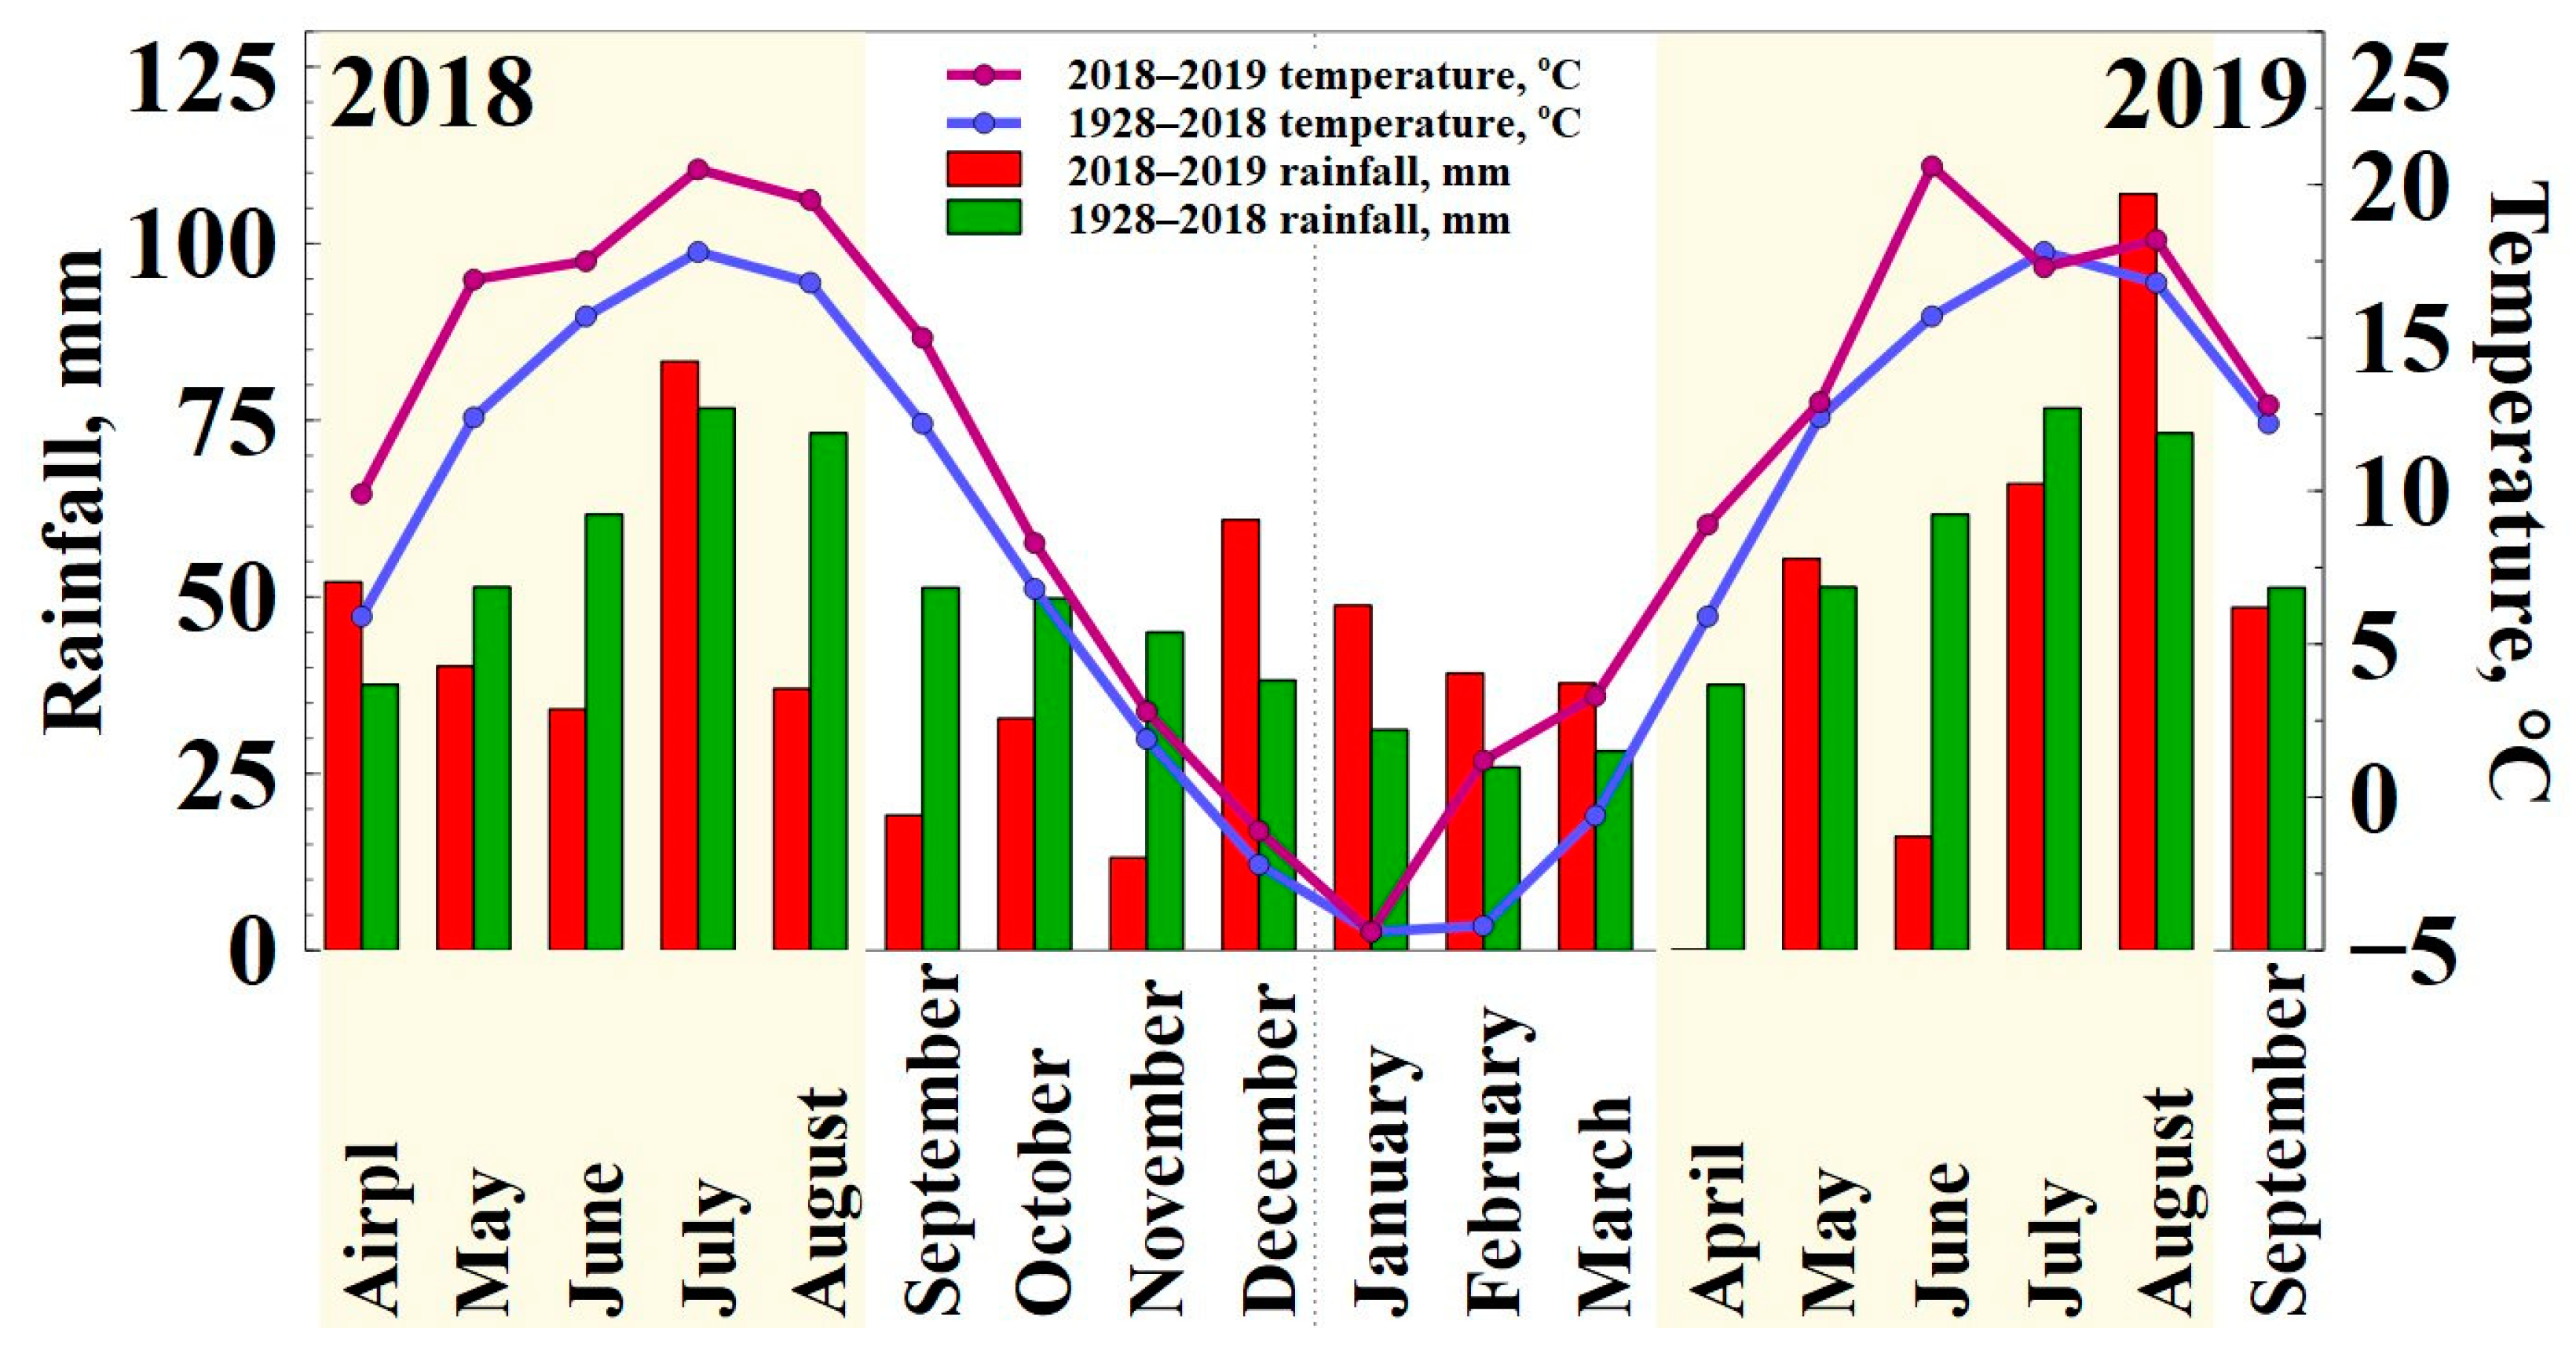
Figure 1. Rainfall sum (mm) and the average temperature (°C) for the testing period of 2018–2019, as well as the long-term average (1928–2018). The shaded area represents the time when the spring wheat (2018) and spring triticale (2019) were grown.
Agronomy 11 00641 g001
Figure 2. Change in the chemical composition of soil mobile K2O, P2O5, Ca, and Mg after GWC, BA, and GWC + BA application. The control represents no additives. The shaded area represents the chemical soil composition after the crop was harvested. * = significance at p ≤ 0.05 and ** = significance at p < 0.01. BA—biofuel ash; GWC—green waste compost; GWC + BA1.5—green waste compost (20 t ha−1) + biofuel ash (1.5 t ha−1); GWC+BA3.0—green waste compost (20 t ha−1) + biofuel ash (3.0 t ha−1); GWC+BA4.5—green waste compost (20 t ha−1) + biofuel ash (4.5 t ha−1).
Agronomy 11 00641 g002
Figure 3. Heavy metals measured in the soil within 16 months. * = significance at p ≤ 0.05 and ** = significance at p < 0.01. BA—biofuel ash; GWC—green waste compost; GWC+BA1.5—green waste compost (20 t ha−1) + biofuel ash (1.5 t ha−1); GWC+BA3.0—green waste compost (20 t ha−1) + biofuel ash (3.0 t ha−1); GWC+BA4.5—green waste compost (20 t ha−1) + biofuel ash (4.5 t ha−1).
Agronomy 11 00641 g003
Figure 4. (a) Nmin in the soil before and after the experiment. Nmin before the experiment is shown with a solid line. (b) Ntot concentration in spring wheat (2018) and spring triticale (2019) grain and straw. * = significance at p ≤ 0.05 and ** = significance at p < 0.01. BA—biofuel ash; GWC—green waste compost; GWC + BA1.5—green waste compost (20 t ha1) + biofuel ash (1.5 t ha1); GWC + BA3.0—green waste compost (20 t ha1) + biofuel ash (3.0 t ha1); GWC + BA4.5—green waste compost (20 t ha1) + biofuel ash (4.5 t ha1).
Agronomy 11 00641 g004
Figure 5. (a) Nutrient and (b) heavy metals concentration change in spring wheat (2018) and spring triticale (2019) grain and straw after fertilization with BA, GWC, and the GWC + BA mixture. * = significance at p ≤ 0.05 and ** = significance at p < 0.01. BA—biofuel ash; GWC—green waste compost; GWC + BA1.5—green waste compost (20 t ha1) + biofuel ash (1.5 t ha1); GWC + BA3.0—green waste compost (20 t ha1) + biofuel ash (3.0 t ha1); GWC + BA4.5—green waste compost (20 t ha1) + biofuel ash (4.5 t ha1).
Agronomy 11 00641 g005aAgronomy 11 00641 g005b
Figure 6. Two-year (2018–2019) data of the BA, GWC, and GWC + BA mixtures’ effect on spring wheat and spring triticale yields. The difference between the values with the same letter (a,b,c,d,e) was not statistically significant between the different materials when p < 0.01. BA—biofuel ash; GWC—green waste compost; GWC + BA1.5—green waste compost (20 t ha1) + biofuel ash (1.5 t ha1); GWC + BA3.0—green waste compost (20 t ha1) + biofuel ash (3.0 t ha1); GWC + BA4.5—green waste compost (20 t ha1) + biofuel ash (4.5 t ha1).
Agronomy 11 00641 g006
Table 1. Green waste compost and biofuel ash samples used in the experiments.
SampleAbbreviation
Control (without any fertilizer material) dataControl
Biofuel ash (3.0 t h−1)BA
Green waste compost (20.0 t h−1)GWC
Green waste compost (20.0 t h−1) mixed with biofuel ash (1.5 t h−1)GWC + BA1.5
Green waste compost (20.0 t h−1) mixed with biofuel ash (3.0 t h−1)GWC + BA3.0
Green waste compost (20.0 t h−1) mixed with biofuel ash (4.5 t h−1)GWC + BA4.5
Table 2. Chemical composition of the major nutrients (P, K, Ca, and Mg) in BA and complex composted materials (%).
NutrientsBAGWCGWC + BA1.5GWC + BA3.0GWC + BA4.5
%
Total P3.64 d0.52 a0.74 a,b0.93 b,c1.08 c
Total K16.9 d0.69 a1.82 b2.80 c3.61 c
Total Ca20.9 d3.08 a4.33 a,b5.40 b,c6.29 c
Total Mg3.15 e0.51 a 0.70 b0.85 c0.99 d
a,b,c,d,e The difference between the values with the same letter (a,b,c,d,e) was not statistically significant between the different materials when p < 0.05. BA—biofuel ash; GWC—green waste compost; GWC + BA1.5—green waste compost (20 t ha−1) + biofuel ash (1.5 t ha−1); GWC+BA3.0—green waste compost (20 t ha−1) + biofuel ash (3.0 t ha−1); GWC + BA4.5—green waste compost (20 t ha−1) + biofuel ash (4.5 t ha−1).
Table 3. Chemical composition of heavy metals (Ni, Cr, Cd, Pb, Cu, and Zn) in the BA and complex composted materials (mg kg−1).
Heavy MetalsBAGWCGWC + BA1.5GWC + BA3.0GWC + BA4.5Max Allowable Limits
mg kg−1
Ni11.3 c8.44 a8.64 a,b8.81 b8.95 b≤50
Cr43.7 c15.3 a31.1 a,b44.6 a,b55.8 b≤70
Cd75.8 d0.60 a5.86 a,b10.4 b,c14.1 c≤2
Pb216 d15.9 a29.9 b41.9 c51.9 c≤120
Cu240 d21.5 a35.1 b46.8 b,c56.5 c≤300
Zn9028 b128 a751 a1285 a1730 a≤800
a,b,c,d,e The difference between the values with the same letter (a,b,c,d,e) was not statistically significant between the different materials when p < 0.05. Max allowable limits in composts (mg kg−1) in Lithuania [34] are shown in the last column. BA—biofuel ash; GWC—green waste compost; GWC + BA1.5—green waste compost (20 t ha−1) + biofuel ash (1.5 t ha−1); GWC+BA3.0—green waste compost (20 t ha−1) + biofuel ash (3.0 t ha−1); GWC+BA4.5—green waste compost (20 t ha−1) + biofuel ash (4.5 t ha−1).
Table 4. The amount of heavy metals (Ni, Cr, Cd, Pb, Cu and Zn) introduced into the soil (kg ha−1).
Heavy MetalsBAGWCGWC + BA1.5GWC + BA3.0GWC + BA4.5Max Allowable Limits
kg ha−1
Ni0.030.170.190.200.2236
Cr0.720.310.671.031.39-
Cd0.230.010.130.240.354
Pb0.650.320.640.971.29100
Cu0.650.430.751.081.40-
Zn27.12.5616.129.643.2370
Max allowable limits in kg ha−1 according to EPA [35] are shown in the last column. BA—biofuel ash; GWC—green waste compost; GWC + BA1.5—green waste compost (20 t ha−1) + biofuel ash (1.5 t ha−1); GWC + BA3.0—green waste compost (20 t ha−1) + biofuel ash (3.0 t ha−1); GWC + BA4.5—green waste compost (20 t ha−1) + biofuel ash (4.5 t ha−1).
Publisher’s Note: MDPI stays neutral with regard to jurisdictional claims in published maps and institutional affiliations.