Article

Analysis of the Biochemical and Volatile Components of Qianlincha and Qiandingcha Prepared from Eurya alata Kobuski and Camellia cuspidate

1
Fruit and Tea Research Institute, Hubei Academy of Agricultural Sciences, Wuhan 430064, China
2
Danjiangkou Economic Crop Technology Extension Station, Shiyan 442700, China
3
Department of Horticulture, Agricultural Faculty, Ataturk University, 25240 Erzurum, Turkey
4
Biological Technology and Engineering College, West Yunnan University, Lincang 677600, China
*
Author to whom correspondence should be addressed.
Fruit and Tea Research Institute, Hubei Academy of Agricultural Sciences, No. 10 Nanhu Road, Wuhan 430064, China.
Agronomy 2021, 11(4), 657; https://doi.org/10.3390/agronomy11040657
Submission received: 22 February 2021 / Revised: 24 March 2021 / Accepted: 27 March 2021 / Published: 30 March 2021

Abstract

:
Due to the accumulation of experiences on treating disease, tea began to develop to pluralism, and not limited to Camellia sinensis. The leaf buds of Eurya alata Kobuski and Camellia cuspidate were used to make Qianlincha (QLC) and Qiandingcha (QDC), which have special taste, aromas, and health benefits. In our study, the biochemical and volatile components of QLC and QDC were systematically analyzed and compared with a normal green tea (GT, C. sinensis). The biochemical and volatile components in the three tea samples were remarkably different. Compared with those in GT, QLC and QDC exhibited higher content of flavonoids and remarkably lower content of amino acids, catechins, and caffeine. High levels of flavonoids may play a crucial role in taste, liquor color, and health function of QLC and QDC. Low levels of amino acids, catechins, and caffeine may impart mouth-drying or velvety-like astringent taste; umami and refreshing taste of QLC and QDC was not as good as that of GT. High levels of linalool, geraniol, nonanal, dimethyl sulfide, and cis-jasmone may impart a clean and strongly floral or fruity aroma characteristic of QLC. High levels of linalool, 3,7-dimethyl-6-octen-3-ol, (-)-terpinen-4-ol, and terpenes may impart a strongly floral aroma characteristic of QDC.

1. Introduction

Camellia sinensis tea is one of the most widely consumed non-alcoholic beverages in the world [1]; it is beneficial to human health because of its antioxidant activity and ability to reduce the risk of cardiovascular disease and cancer [2,3]. The accumulation of experience on the efficacy of tea resulted in the development of diversity in tea.Tea production was not limited to the leaves of C. sinensis. For example, kudingcha from the leaves of Ilex latifolia or Ligustrum robustum is a popular beverage alternative to Camellia tea in southern China [4,5], and the therapeutic roles in diuretic effects, facilitates weight loss, acts as a remedy for sore throat, inflammation, and hypertension have been demonstrated [5,6,7]. Vine tea prepared from the leaves of Ampelopsis grossedentata exhibits the health function of bactericidal, anti-inflammatory, antioxidant, hypoglycemic, and hypolipidemic activities; improves the intestinal microbial balance; and can be used to prevent and treat cardiovascular disease [8,9]. Wanglaoji Cool Tea is a famous traditional herbal tea, which is the decoction of atoxic local herbs and the performance of pluralism development of tea in China [10,11]. Thus, many plants have been used to make tea because of their special taste or specific physiological and pharmacological activities, and some teas have gradually become the featured products or even indispensable beverage in some regions.
Materials from plants belonging to the theaceae family have been widely consumed as food practices for effective treatment of various human ailments more than one thousand years worldwide [12,13]. Qianlincha (QLC) from Eurya alata Kobuski and Qiandingcha (QDC) from C. cuspidata are popular beverage alternative to Camellia tea in the Wudang mountain area for several hundreds of years, and physiological and pharmacological activities, such as clearing away heat, bactericidal, anti-inflammatory, hypoglycemic, and hypolipidemic have been demonstrated by practice. The processing technology of QLC and QDC are the same to C. sinensis green tea, but the quality characteristics are entirely different. For example, QLC exhibits a bright orange liquor, high astringency, a thick taste, and strong flowery and fruity flavor characteristic features, while QDC has a bright golden liquor, sliding back alcohol sweet taste, and a flowery flavor (like honeysuckle).
C. sinensis green tea presents a special taste and potential health benefits because of the existence of compounds, such as polyphenols, amino acids, vitamins, carbohydrates, caffeine, and purine alkaloids [14,15]. Linalool, nonanal, dimethyl sulfide, geraniol, and caproicacidhexneylester are the main contributors to clean and refreshing aroma components in C. sinensis green tea [16,17]. However, the main biochemical and aromatic components of QLC and QDC are currently not completely known. Metabolomics is a popular approach to reveal the complexity of the metabolites, and identifies the variability functional components [18]. The untargeted metabolomics approach was applied to comprehensively analyze the biochemical component of QLC and QDC and used GT as the control, and the main active ingredients such as amino acids, catechins, and caffeine were quantitatively analyzed by high-performance liquid chromatography (HPLC). There are several approaches to detect the volatile components; among them, gas chromatography and mass spectrometry (GC-MS) is a powerful technique for the detection of volatile components in tea [16,17,19,20]. High sensitivity, high resolution and strong identification ability are the outstanding advantages of GC-MS, leading to more volatile components being accurately identified [19]. In this study, head space solid-phase microextraction (HS-SPME) combined with GC-MS was used to analyze the volatile components in QLC, QDC, and GT teas, and then reveal the aroma characteristics of each tea. The aims of our investigation were to provide producers with a clearer understanding of the quality characteristic and active ingredients of these teas, and promote the further application of QLC and QDC.

2. Materials and Methods

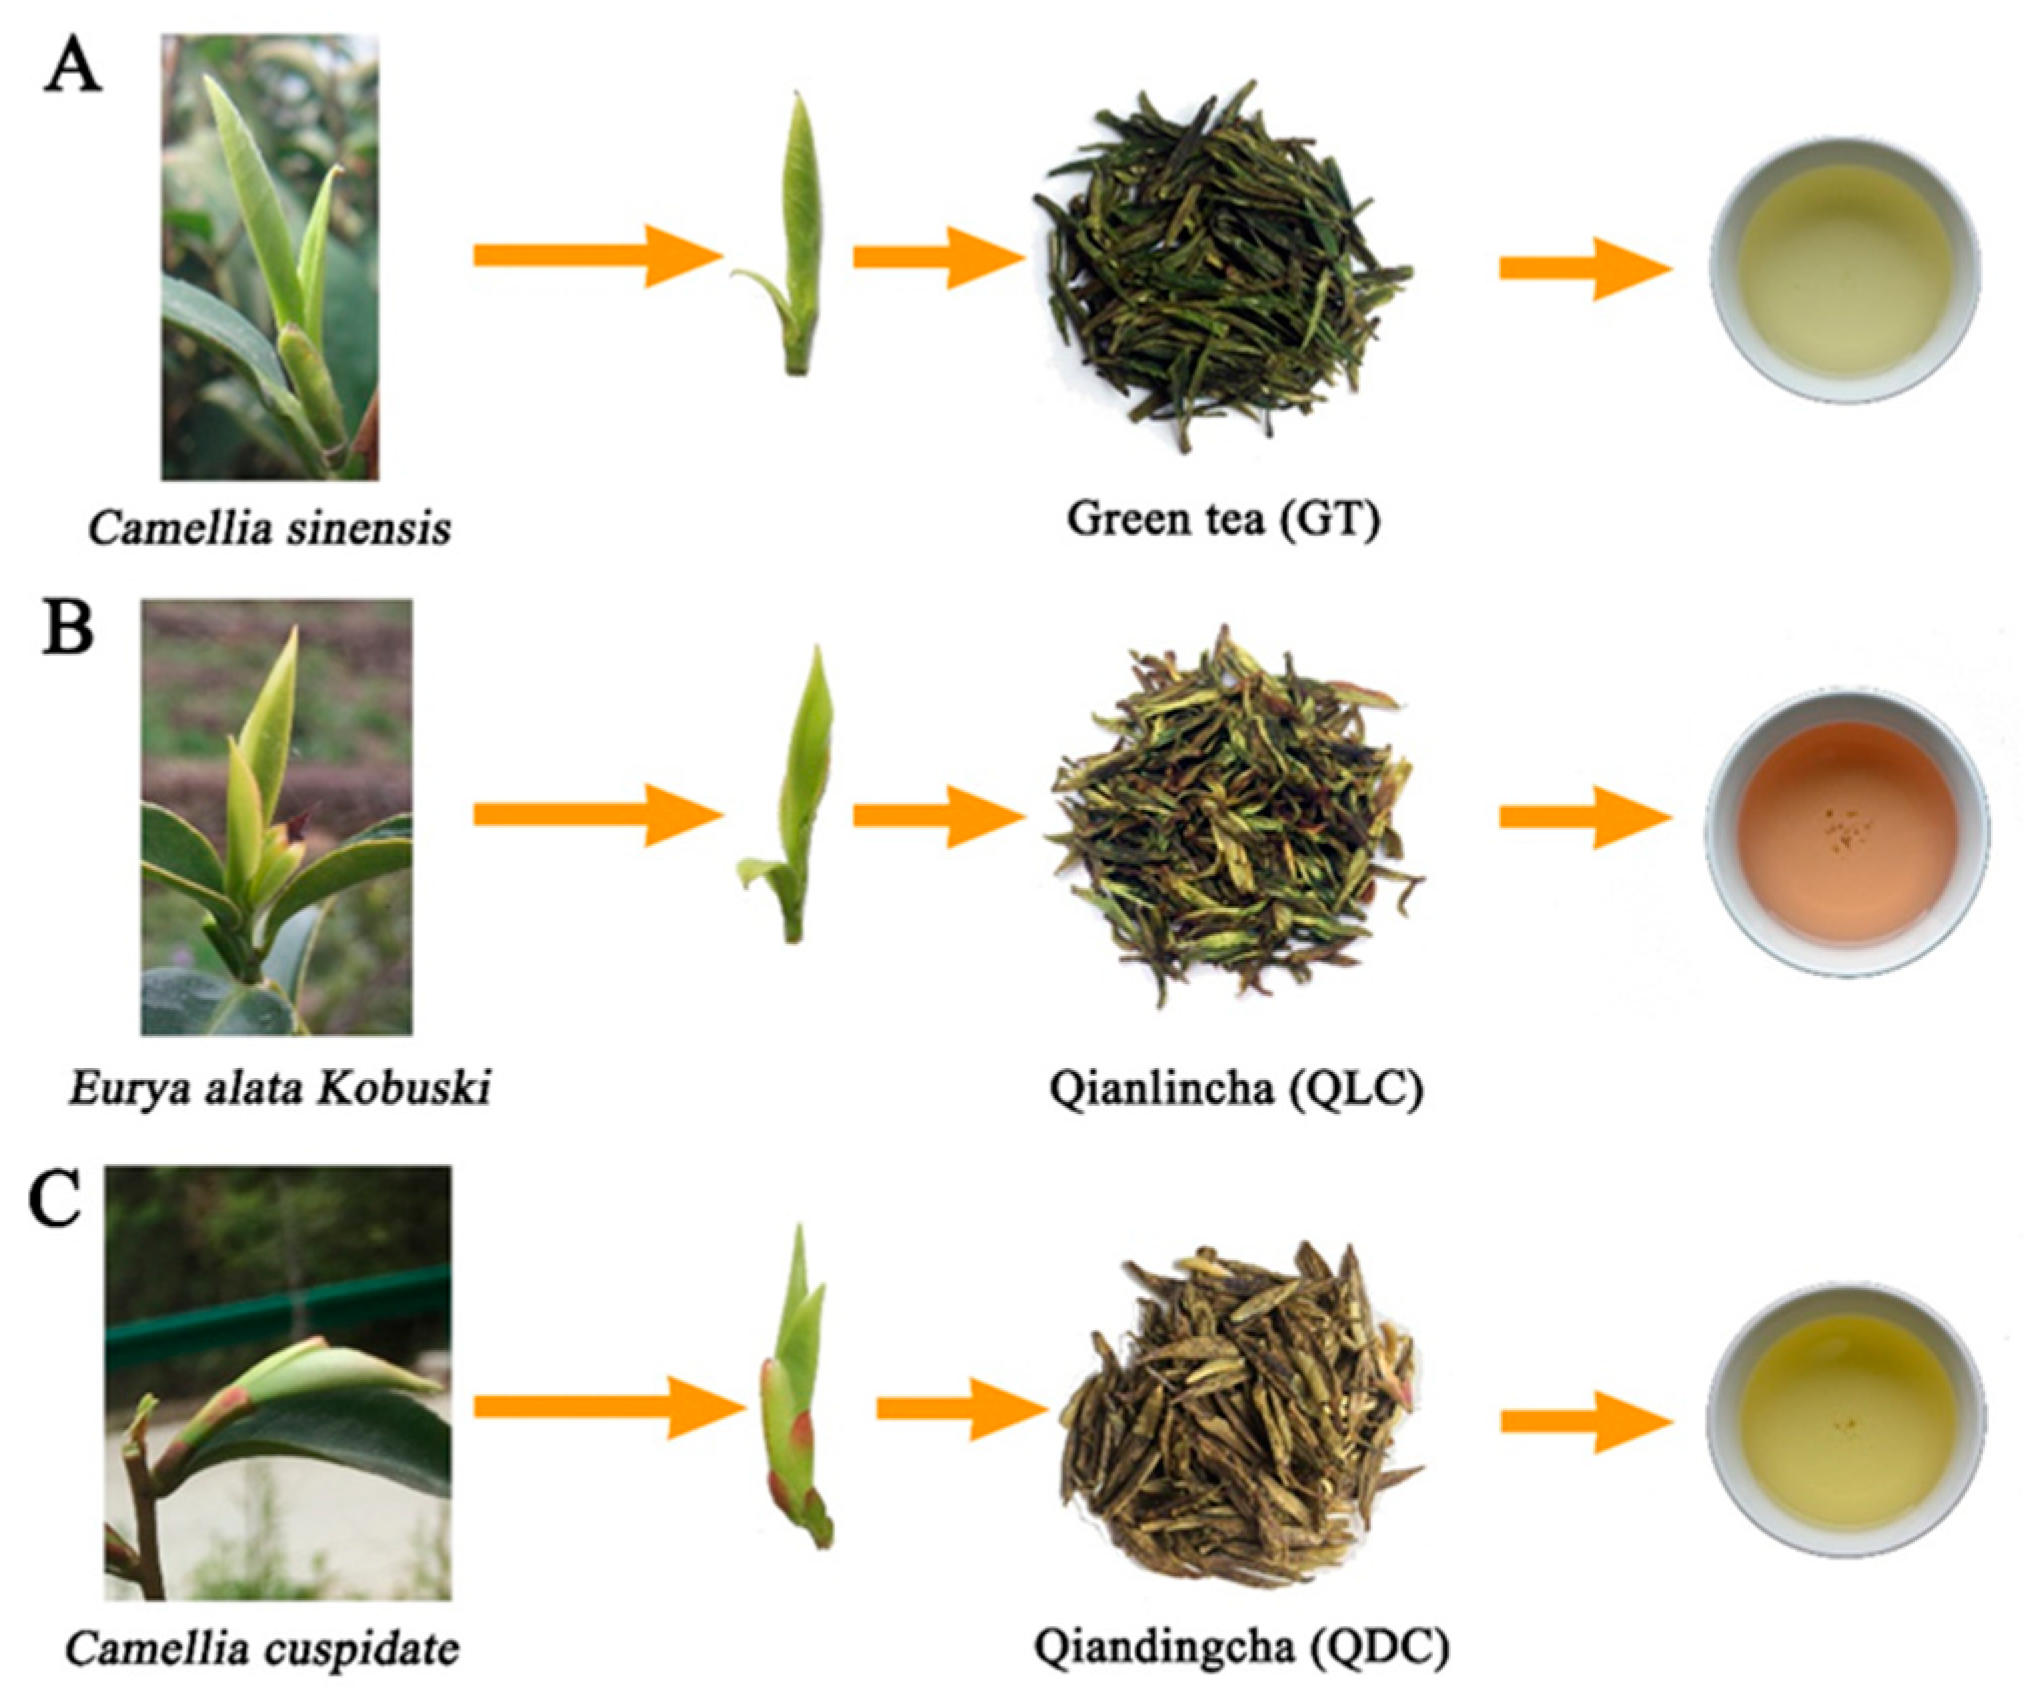
2.1. Experimental Materials

Buds of E. alata Kobuski, C. cuspidata, and C. sinensis were collected form Danjiangkou Economic Crop Technology Extension Station (Danjiangkou, Shiyan, China) on March 2018. All the samples were conducted following the same processes [16], including sample collection, pre-processing, extraction, and detection. The samples were processed using the typical green tea manufacturing approaches. Briefly, the fresh leaves were first withered (18–20 °C, relative humidity 75%) until the moisture content of tea leaves was decreased to around 60–65%, fixed at 150–180 °C for 5–7 min to terminate the endogenous enzymatic reaction, followed by cooling down for 1 h, then dried in the tea dryer (120–125 °C for 10–15 min), followed by cooling down for 30 min, then re-dried in the tea dryer (70–75 °C for 8–10 min) to less than 5%–6% moisture content to obtain the QLC, QDC, and GT samples. All the tea samples (Figure 1) were stored in a freezer at −20 °C until further use.

2.2. Experiment Methods

2.2.1. Ultra-High-Performance Liquid Chromatography Coupled with Hybrid Quadrupole-Orbitrap Mass Spectrometry (UPLC-Q-Exactive Orbitrap-MS) Analysis

The extraction methods were performed according to the method described by Li et al. (2020), but with minor modifications [21]. In brief, 50 mg of sample power was firstly extracted in 1 mL extract solvent (methanol/acetonitrile/water = 2:2:1), and 2-Chloro-L-phenylalanine was added as internal standard with final concentration of 5 mg·L−1. Next, the samples were vortexed for 30 s, homogenized at 45 Hz for 4 min, and sonicated for 5 min in an ice–water bath three times. Then, the samples were incubated at −20 °C for 1 h. The supernatants were collected after centrifuging at 12,000 rpm (4 °C, 15 min). The resulting supernatants were transferred to UPLC-Q-Exactive Orbitrap-MS vials and stored at −80 °C until the UPLC-Q-Exactive Orbitrap-MS analysis.
UPLC-Q-Exactive Orbitrap-MS analyses were performed using an utra-high-pressure liquid chromatography (UHPLC) system (1290, Agilent Technologies) with a UPLC HSS T3 column (2.1 mm × 100 mm, 1.8 μm, Waters) coupled to Q Exactive (Orbitrap MS, Thermo). The elution gradient, electrospray ionization (ESI) source conditions, and data processing of UPLC-Q-Exactive Orbitrap-MS were the same as Li et al. (2020) [21]. Mobile phase A comprised 0.1% formic acid in water and 5 mmol·L−1 ammonium acetate in water in the positive and negative ionization modes, respectively, and mobile phase B comprised acetonitrile. The elution gradient was set as follows: 0 min, 1% B; 1 min, 1% B; 8 min, 99% B; 10 min, 99% B; 10.1 min, 1% B; and 12 min, 1% B. The flow rate was 0.5 mL·min−1. The injection volume was 2 μL. ESI source conditions were set as follows: sheath gas flow rate, 45 Arb; aux gas flow rate, 15Arb; capillary temperature, 320 °C; full MS resolution, 70,000; MS/MS resolution, 17,500; collision energy, 20/40/60 eV in the normal curve equivalent model; spray voltage, 3.8 kV (positive) or –3.1 kV (negative), respectively.
The raw data acquired from the UPLC-Q-Exactive Orbitrap-MS was processed by R package XCMS (version 3.2), including retention time, mass-to-charge ratio (m/z), and MS intensity of the features. For each chromatogram, the intensity of each ion was normalized to the internal standard intensity, in order to partially compensate for the concentration bias of features between samples and to obtain the relative intensity of features. The acquired data set was subjected to statistical analyses.

2.2.2. HPLC Analysis of Amino Acid, Catechin, and Caffeine Concentrations

Amino acid concentrations were analyzed using the method of Feng et al. (2020), and with slight modifications [22]. Briefly, the samples were prepared with 0.5 g dried of tea powder, which was put into 50 mL of boiling water for 45 min, then shaken once every 5 min, filtered through 0.22 μm of nylon filter, and analyzed by using HPLC. The Waters AccQ•Tag method and a Waters AccQ•Tag column (Nova-Pak C18, 4 μm, 150 mm × 3.9 mm) were used to detect various amino acids according to the protocol provided with the AccQ•Fluor Reagent Kit [15,22]. Amino acid analysis was performed using a Waters 2695 HPLC system equipped with a 2998 PDA detector. Mobile phase A was 1/11 (v/v) Waters AccQ•Tag Eluent A in water, mobile phase B was acetonitrile, and mobile phase C was water. The column temperature and wavelength were 37 °C and 248 nm, respectively. The elution gradient was set as follows: 0 min, 100% A; 0.5 min, 99% A, 1% B; 18 min, 95% A, 5% B; 19 min, 91% A, 9% B; 10.1 min, 1% B; 29.5 min, 83% A, 17% B; 33 min, 60% B, 40% C; 36 min, 100% A; and 45 min, 100% A. The flow rate was 1.0 mL·min−1. The injection volume was 10 μL.
Catechins and caffeine were extracted and analyzed according to a method described by Feng et al. (2020) with minor modifications [22]. In brief, 0.1 g of freeze-dried sample was extracted using 3 mL of 80% methanol in an ultrasonicator for 10 min at 4 °C. After centrifugation at 6000 rpm for 5 min, the residue was re-extracted twice, as described. The supernatants were combined and diluted with 80% methanol to obtain a volume of 10 mL. Subsequently, they were filtered through a 0.22 μm organic membrane before performing HPLC. Column temperature and wavelength were 40 °C and 280 nm, respectively. Mobile phase A was 2% (v/v) acetic acid in water, and mobile phase B was acetonitrile. The elution gradient was set as follows: 0 min, 93.5% A; 16 min, 15% A; 16–25 min, 25% A; 30 min, 93.5% A; and 40 min, 93.5% A. The flow rate was 1.0 mL·min−1. The injection volume was 10 μL.

2.2.3. GC-MS Analysis

Each sample was precisely weighed to 3 g and placed into an extraction bottle. Subsequently, 150 mL of boiling water was added. Next, 2.00 μL of internal standard substance (12 mg·L−1 ethyl decanoate) was added. A head space solid-phase microextraction (HS-SPME) handset equipped with a 50/30 μm divinylbenzene/carboxen/polydimethylsiloxane (DVB/CAR/PDMS) extraction head (the extraction head was aged for 15 min at 250 °C prior to the experiment) was then inserted into the extraction bottle through the rubber bottle cap, and the handset was placed in a 50 °C water bath for 10 min. After the extraction head had adsorbed analytes for 50 min, it was removed and immediately inserted into the inlet of the gas chromatograph apparatus to desorb for 3 min. The apparatus was then used to collect data. All tea samples were prepared and analyzed in three independent replicates.
The conditions and apparatus used in gas chromatography were a 7890A gas chromatograph and 5975C mass spectrometer (Agilent, USA), a HB-5MS (30 m × 0.32 mm × 0.25 μm) elastic quartz capillary column (Agilent Technologies), an inlet temperature of 240 °C, high purity helium (as the carrier gas), and a flow velocity of 1.0 mL·min−1. The column heating procedure was performed; the column was maintained at 50 °C for 5 min. Subsequently, the temperature was increased 3 °C/min until it reached 180 °C. The column was maintained at this temperature for 2 min after which the temperature was increased 10 °C/min until it reached 250 °C. Finally, the column was maintained at this temperature for 3 min. The conditions set for mass spectrometry were as follows: ionization energy (EI), 70 eV; quality scan range, 50–600 amu; ion source temperature, 230 °C; quadrupole temperature, 150 °C; and mass transmission line temperature, 280 °C.
Volatile components were identified using the National Institute of Standards and Technology (NIST) library (11.L), and a mass spectrum fitness of >90% was set as the substance identification standard. The relative content of each volatile component was calculated using the equation Ci = (Ai/Ait) × 100%, where Ci is the relative content of a particular volatile component (%), Ai is the peak area of a particular volatile component, and Ait is the summation peak area of the all volatile components.

2.2.4. Data Analysis

All the data were expressed as the mean ± standard deviation (SD). Statistical significance between groups was evaluated by one-way ANOVA, followed by Duncan test using SPSS Statistics 19.0 (IBM, Chicago, USA). p < 0.05 was considered as statistically significant. Principal component analysis (PCA) and orthogonal projections to latent structures discriminant analysis (OPLS-DA) were conducted using software SIMCA-P 13 (Umetrics, Umea, Sweden). The online software MultiExperiment Viewer (version 4.8.1) was employed for heatmap visualization. Venn plots were performed and drawn using the online website https://www.omicshare.com/tools/Home/Soft/venn (accessed on October 2020).

3. Results and Discussion

3.1. Untargeted Metabolite Profiling of Three Tea Samples

To explore global metabolic variations in the three tea samples, an untargeted metabolomic approach was used, which identified 7046 annotated metabolites from 36,233 ion features under the positive ion mode and 4172 annotated metabolites from 23,314 ion features under the negative ion mode (Table S1). To provide an insightful overview of the metabolic variations, the PCA score plot was constructed on the integrated UPLC-Q-Exactive Orbitrap-MS datasets including the positive and negative ion modes of the three tea samples. The PCA results (Figure 2) revealed that the first two principal components explained 64.8% and 24.5% of the total variance, and all replicates from each sample clustered together and were separated from other tea samples. The PCA results indicated that the types or concentrations of the biochemical components in the three tea samples were remarkably different.

3.2. Analysis of Differentially Accumulated Metabolites (DAMs)

To analyze the constituents responsible for the three tea samples clustering, OPLS-DA analysis was performed on a random combination of tea samples to find components with variable importance in the projection (VIP) scores >1 and T-test values of p < 0.05. A total of 105 DAMs were identified by comparison with authentic standards and elucidation of MS2 spectra. Figure 3 indicated the presence of 105 DAMs, including 25 flavonoids and flavone glycosides, 5 catechins, 14 amino acids, 21 organic acids, 15 heterocyclics, 5 saccharides, and 20 other components. As displayed in the heat-map, the relative abundance of the DAMs were significantly different in the three tea samples, and these may be the important reasons for the differences in taste, liquor color, and health function of the three tea samples. The following portion discuss several significant variation in each chemical category.

3.2.1. Flavonoids

Flavonoids are widely distributed in plants and human diets with positive effects for the treatment of multiple diseases, including obesity, cardiovascular diseases, diabetes, and cancer [23,24]. In this study, the relative abundance of most flavonoids in QLC were significantly higher than those in GT. Flavonoid glycosides are easily soluble in water with extremely low taste threshold of mouth-drying and velvety-like astringency, and are regarded as the main contribution to the taste and color of C. sinensis tea infusions [25,26,27]. High levels of flavonoid glycosides such as diosmin, apigenin-7-O-glucoside, and kaempferol-7-O-D-glucopyranoside may impart QLC with the strongest mouth-drying and velvety-like astringency taste and deepest color compared with GT. In QDC, the relative abundance of most flavonoids were also significantly higher than those in GT, but not as drastic as QLC.

3.2.2. Catechins

Catechins, which are widely present in C. sinensis leaves, accounting for 12%~24% of dry weight, and have multiple effects on human health and play crucial antibacterial, antiviral, antiradiation, antiaging, and anticancer roles [28]. As shown in Figure 3, the relative abundance of all catechins except EC in GT were significantly higher than those in QLC and QDC. In addition, catechins are the primary bitterness and astringency taste substances in C. sinensis green tea, and an important determinant of C. sinensis green tea quality [25,29]. Nevertheless, catechins, such as EGCG, had the puckering astringent and bitter taste, which was different from the mouth-drying or velvety-like astringent taste of flavonoid glycosides [25]. Therefore, high levels of catechins was an important reason for the formation of health function and taste of GT, and catechins were relatively lesser importance at QLC and QDC taste and health functions.

3.2.3. Amino Acids

Amino acids have been reported to be the primary contributors to the umami and refreshing taste of C. sinensis green tea, and some amino acid such as theanine, and arginine, have health-promoting functions in humans [30]. In this study, the relative abundance of most amino acids in GT were significantly higher than those in QLC and QDC. High levels of amino acids may impart GT with more umami and refreshing taste and health functions than QLC and QDC. Theanine was discovered by Sakato as the most abundant amino acid in C. sinensis leaves [31]. Only limited reports have subsequently been published on the distribution of theanine in plants [32]. As shown in Figure 3, theanine was detected in QDC and QLC, but the relative abundance was significantly lower than GT. Except theanine, arginine, aspartic acid, glutamic acid, and glutamine are also the main amino acids in C. sinensis green tea, and the relative abundance of all them in GT was significantly higher than those in QLC and QDC [33].

3.2.4. Organic Acids, Heterocyclics, Saccharides, and Other Components

Sour and sweetness are not the main taste characteristics of C. sinensis green tea, but they can supplement and adjust the overall taste of C. sinensis green tea [25,34]. In general, organic acids and saccharides are the main sour and sweetness components in C. sinensis green tea [25,34]. As shown in Figure 3, the relative abundance of most organic acids in QLC and QDC were significantly higher than those in GT, and the relative abundance of D-glucose, trehalose, and galactinol in QLC and QDC were significantly higher than GT. The difference of organic acids and saccharides may be an important factor in the formation of the difference of sour and sweetness taste in the three tea samples. Heterocyclics and other components were no obvious change rules in the three tea samples. Caffeine, which is the main heterocyclic in C. sinensis leaves, accounts for 2%~5% of dry weight, and is the main factor associated with the bitterness of tea infusions [35]. In Figure 3, the relative abundance of caffeine in GT is significantly higher than QLC and QDC.

3.3. Quantitative Analysis Confirms Variations in Amino Acids, Catechins, and Caffeine

Amino acids, catechins, and caffeine have been reported to be the main active ingredients in C. sinensis green tea and the main substances affecting the taste of C. sinensis green tea [14,33]. To precisely determine the content differences of three tea samples, including amino acids, catechins, and caffeine, were quantified using a typical HPLC analysis. As shown in Table 1, the average total amino acid concentration in GT, QLC, and QDC was 28.72 ± 1.27, 3.59 ± 0.06, and 4.59 ± 0.36 mg·g−1, respectively. Theanine is one of the most abundant free amino acids in C. sinensis green tea and has many benefits for human health [36]. In this study, the concentration of theanine was 15.97 ± 0.99 mg·g−1 in GT similar to previous studies [33], whereas the concentration was only 0.01 ± 0.00 mg·g−1 in QLC, and not detected in QDC. Moreover, the concentration of total amino acids was significantly lower in QLC and QDC than in GT, and the concentration of almost all of the amino acids exhibited similar variations.
Total catechin concentrations in QLC and QDC were 19.95 ± 0.99 and 22.04 ± 3.07 mg·g−1, which were significantly lower than the concentration in GT (130.27 ± 5.87 mg·g−1). Gallocatechin, gallocatechin gallate, epicatechin-3-gallate, and catechin gallate were not detected in QLC and QDC. Epigallocatechin gallate, catechin, and epicatechin were detected in all the three tea samples, but considerable variations in concentrations were observed. The caffeine concentrations in QLC and QDC were 0.45 ± 0.03 and 4.97 ± 0.06 mg·g−1, respectively, which were significantly lower than that in GT (39.67 ± 1.67 mg·g−1). All of these results were similar to those of the metabolome analysis and indicated the reliability and accuracy of the metabolomic data.

3.4. Analysis of Volatile Component Concentrations in the Three Tea Samples

HS-SPME-GC-MS was used to identify the volatile components of the three tea samples, and 94 major volatile components were detected (Table S2). To provide an insightful overview of the variation in volatile components, a PCA score plot was constructed on the integrated GC-MS datasets of the three tea samples. The volatile components of the three tea samples were well discriminated, all replicates from each sample clustered together and were separated from other tea samples, as shown in Figure 4A (PC1 = 62.0% and PC2 = 35.2%). In brief, the tea samples (GT, QLC, and QDC) were grouped into three distinct areas, indicating that the types and component ratios of the volatile components in the three tea samples were remarkably different. The volatile components in the three tea samples (GT, QLC, and QDC) were compared using a Venn diagram (Figure 4B). In total, 94 major volatile components were detected, and 25 were detected in all the samples; thus, they were deemed common volatile components. The number of differential volatile components found exclusively in each tea sample was 19 for GT, 10 for QLC, and 12 for QDC. These components were considered as the defining volatile components for each sample.
The difference in volatile component varieties, contents and component ratios in tea has a direct influence on the aroma characteristics. As shown in Figure 4, the 94 volatile components were 24 aldehydes, 13 alcohols, 10 esters, 18 alkenes, 9 aromatic hydrocarbons, 7 ketones, and 13 other components, and the concentrations of volatile component types varied substantially among the three tea samples. The levels of volatile components of GT were similar to those in C. sinensis green tea of previous studies [16,17], whereas they have significant differences in QLC and QDC. In QLC, aldehydes, alcohols, and alkenes were the most prevalent of the volatile component types, and accounted for 54.68 ± 1.32%. Linalool, geraniol, and nonanal were the major parts of the volatile components in QDC, and previous studies have shown linalool, nonanal, and geraniol as the main substances that emit a floral or fruity flavor in GT [37,38]. Furthermore, the levels of dimethyl sulfide and cis-jasmone in QDC were relatively high, and accounted for 21.13 ± 0.58% and 5.90 ± 0.28%, respectively. Dimethyl sulfide was a crucial and unique substance in the volatile component with a clean aroma of fresh GT [17], and cis-jasmone exhibits a strong floral aroma and significantly contributes to the profile of oolong tea [39]. Alcohols and alkenes were the major parts of the volatile component types in QDC, and accounted for 79.95 ± 1.95% of the volatile components. Linalool, 3,7-dimethyl-6-octen-3-ol, and (-)-terpinen-4-ol were the main alcohols in QDC, and shown a strong floral aroma with a low odor detection threshold [17,27]. α-terpinene, γ-terpinene, α-ocimene, and terpinolene were the main alkenes in QDC, and most terpenes have floral aroma [27,38,40].

4. Conclusions

In our study, an untargeted metabolomics, metabolic target analysis, and HS-SPME-GC-MS were applied to examine the biochemical and volatile component variations in QLC, QDC, and GT, which were prepared from E. alata Kobuski, C. cuspidata, and C. sinensis, respectively. The biochemical and volatile components in the tea samples from the three theaceae plants were remarkably different. The levels of most flavonoids were significantly higher in QLC and QDC than in GT, and these may impart QLC and QDC with strong mouth-drying and velvety-like astringency taste and deep color. The levels of catechins, amino acids, and caffeine, which are the main taste and functional components in C. sinensis green tea, were significantly lower in QLC and QDC than in GT, and these may impart mouth-drying or velvety-like astringent taste; the umami and refreshing taste of QLC and QDC was not as good as that of GT. In addition, 94 volatile components were detected, and the types and component ratios of the volatile components in QLC and QDC were remarkably different compare with GT. Linalool, geraniol, nonanal, dimethyl sulfide, and cis-jasmone in QDC were relatively high, and these may impart a clean and strongly floral or fruity aroma characteristic. Linalool, 3,7-dimethyl-6-octen-3-ol, (-)-terpinen-4-ol and terpenes were the main volatile components in QDC, and show a strongly floral aroma characteristic.

Supplementary Materials

The following are available online at https://www.mdpi.com/article/10.3390/agronomy11040657/s1, Table S1: Untargeted metabolite profiling of three tea samples under the positive or negative ion mode, Table S2: Analysis of the volatile component contents of the three tea samples (%).

Author Contributions

This study was conceived by X.J.; L.M. supervised the project, formulated the data including figures and tables, as well as wrote the manuscript. Y.Y. and Z.G. collected the samples. Data were analyzed and the manuscript was revised by D.C., Y.L., S.E., Z.L. All authors have read and agreed to the published version of the manuscript.

Funding

This research was funded by the Agricultural Science and Technology Innovation Project of Hubei Province (2019-620-000-001-24), and the Young Top-notch Talents Support Program of Hubei Academy of Agricultural Sciences (Q2018030).

Institutional Review Board Statement

Not applicable.

Informed Consent Statement

Not applicable.

Data Availability Statement

The data presented in this study are available on request from the corresponding author.

Conflicts of Interest

The authors declare no competing interests.

References

  1. Fang, W.P.; Meinhardt, L.; Tan, H.W.; Zhou, L.; Mischke, S.; Zhang, D.P. Varietal identification of tea (C. sinensis) using nanofluidic array of single nucleotide polymorphism (SNP) markers. Hortic. Res. 2014, 1, 14035. [Google Scholar] [CrossRef] [PubMed] [Green Version]
  2. Chow, H.S.; Hakim, I.A. Pharmacokinetic and chemoprevention studies on tea in humans. Pharmacol. Res. 2011, 64, 105–112. [Google Scholar] [CrossRef] [Green Version]
  3. Mukhtar, H.; Khan, N. Tea and health: Studies in humans. Curr. Pharm. Des. 2013, 19, 6141–6147. [Google Scholar]
  4. Liang, Y.R.; Ma, W.Y.; Lu, J.L.; Wu, Y. Comparison of chemical compositions of Ilex latifolia Thumb and Camellia sinensis L. Food Chem. 2001, 75, 339–343. [Google Scholar] [CrossRef]
  5. Li, L.; Xu, L.J.; Ma, G.Z.; Dong, Y.M.; Peng, Y.; Xiao, P.G. The large-leaved Kudingcha (Ilex latifolia Thunb and Ilex kudingcha C.J. Tseng): A traditional Chinese tea with plentiful secondary metabolites and potential biological activities. J. Nat. Med. 2013, 67, 425–437. [Google Scholar] [CrossRef] [Green Version]
  6. Kim, J.Y.; Jeong, H.Y.; Lee, H.K.; Yoo, J.K.; Bae, K.; Seong, Y.H. Protective effect of Ilex latifolia, a major component of “kudingcha”, against transient focal ischemia-induced neuronal damage in rats. J. Ethnopharmacol. 2011, 133, 558–564. [Google Scholar] [CrossRef]
  7. Fan, S.J.; Zhang, Y.; Hu, N.; Sun, Q.H.; Ding, X.B.; Li, G.W.; Zheng, B.; Gu, M.; Huang, F.S.; Sun, Y.Q.; et al. Extract of kuding tea prevents high-fat diet-induced metabolic disorders in C57BL/6 mice via liver X receptor (LXR) β antagonism. PLoS ONE 2012, 7, e51007. [Google Scholar] [CrossRef]
  8. Gao, Q.P.; Ma, R.Y.; Chen, L.; Shi, S.Y.; Cai, P.; Zhang, S.H.; Xiang, H.Y. Antioxidant profiling of vine tea (Ampelopsis grossedentata): Off-line coupling heart-cutting HSCCC with HPLC-DAD-QTOF-MS/MS. Food Chem. 2016, 225, 55–61. [Google Scholar] [CrossRef]
  9. Fan, L.; Zhao, X.Y.; Tong, Q.; Zhou, X.Y.; Chen, J.; Xiong, W.; Fang, J.G.; Wang, W.Q.; Shi, C.Y. Interactions of dihydromyricetin, a flavonoid from vine tea (Ampelopsis grossedentata) with gut microbiota. J. Food Sci. 2018, 83, 1444–1453. [Google Scholar] [CrossRef]
  10. Li, S.B.; He, R.R.; Wang, M.; Xie, G.; Yao, X.S.; Kurihara, H.S. Effects of Wanglaoji Herbal Tea on cytotoxic T lymphocyte activity in spleen of restraint stress mice. Tradit. Chin. Drug Res. Clin. Pharmacol. 2010, 21, 223–226. [Google Scholar]
  11. Yang, Y.Y.; Deng, J.W.; Yu, Y.H.; Zhong, X.L. Fingerprint analysis of Wanglaoji guangdong herbal tea granule by ultra-high performance liquid chromatography. J. Instrum. Anal. 2012, 31, 613–617. [Google Scholar]
  12. Yang, J.B.; Yang, S.H.; Li, H.T.; Yang, J.; Li, D.Z. Comparative chloroplast genomes of Camellia species. PLoS ONE 2013, 8, e73053. [Google Scholar] [CrossRef] [PubMed] [Green Version]
  13. Wang, Y.J.; Yang, Y.Q.; Wei, C.L.; Wan, X.C.; Thompson, H.J. Principles of biomedical agriculture applied to the plant family theaceae to identify novel interventions for cancer prevention and control. J. Agric. Food Chem. 2016, 64, 2809–2814. [Google Scholar] [CrossRef] [PubMed]
  14. Feng, L.; Gao, M.J.; Hou, R.Y.; Hu, X.Y.; Zhang, L.; Wan, X.C.; Wei, S. Determination of quality constituents in the young leaves of albino tea cultivars. Food Chem. 2014, 155, 98–104. [Google Scholar] [CrossRef] [PubMed]
  15. Tai, Y.L.; Wei, C.L.; Yang, H.; Zhang, L.; Chen, Q.; Deng, W.W.; Wei, S.; Zhang, J.; Fang, C.B.; Ho, C.T. Transcriptomic and phytochemical analysis of the biosynthesis of characteristic constituents in tea (Camellia sinensis) compared with oil tea (Camellia oleifera). BMC Plant Biol. 2015, 15, 190. [Google Scholar] [CrossRef] [PubMed] [Green Version]
  16. Ma, L.L.; Cao, D.; Liu, Y.L.; Gong, Z.M.; Liu, P.P.; Jin, X.F. A comparative analysis of the volatile components of green tea produced from various tea cultivars in China. Turk. J. Agric. For. 2019, 43, 451–463. [Google Scholar]
  17. Liu, P.P.; Xu, Y.Q.; Yin, J.F.; Chen, G.S.; Wang, F.; Yuan, H.B.; Liu, Y. Effect of main water quality factors on volatile components of Huangshan Maofeng tea with faint scent. J. Chin. Inst. Food Sci. Technol. 2016, 16, 245–257. [Google Scholar]
  18. Su, X.Q.; Ma, Y.; Yang, X.F.; Kong, J.H.; Zuo, X.B.; Zhao, M. Progress of researches in tea science by omics technologies. Sci. Technol. Food Ind. 2017, 38, 333–340. [Google Scholar]
  19. Sparkman, O.D.; Penton, Z.; Kitson, F.G. Gas Chromatography and Mass Spectrometryy: A Practical Guide, 2nd ed.; Academic Press: New York, NY, USA, 2011. [Google Scholar]
  20. Maiti, K.S.; Lewton, M.; Fill, E.; Apolonski, A. Human beings as islands of stability: Monitoring body states using breath profiles. Sci. Rep. 2019, 9, 16167. [Google Scholar] [CrossRef] [Green Version]
  21. Li, N.; Yan, F.F.; Wang, N.N.; Song, Y.; Yue, Y.X.; Guan, J.Q.; Li, B.L.; Huo, G.C. Distinct gut microbiota and metabolite profiles induced by different feeding methods in healthy Chinese infants. Front. Microbiol. 2020, 11, 714. [Google Scholar] [CrossRef] [PubMed]
  22. Feng, L.; Liu, P.P.; Zheng, P.C.; Zhang, L.; Zhou, J.; Gong, Z.M.; Yu, Y.C.; Gao, S.W.; Zheng, L.; Wang, X.P.; et al. Chemical profile changes during pile fermentation of Qingzhuan tea affect inhibition of α-amylase and lipase. Sci. Rep. 2020, 10, 3489. [Google Scholar] [CrossRef] [Green Version]
  23. Ross, J.A.; Kasum, C.M. Dietary flavonoids: Bioavailability, metabolic effects, and safety. Annu. Rev. Nutr. 2002, 22, 19–34. [Google Scholar] [CrossRef] [PubMed]
  24. Courts, F.L.; Williamson, G. The occurrence, fate and biological activities of C-glycosyl flavonoids in the human diet. Crit. Rev. Food Sci. Nutr. 2015, 55, 1352–1367. [Google Scholar] [CrossRef] [PubMed] [Green Version]
  25. Zhang, L.; Cao, Q.Q.; Granato, D.; Xu, Y.Q.; Ho, C.T. Association between chemistry and taste of tea: A review. Trends Food Sci. Tech. 2020, 101, 139–149. [Google Scholar] [CrossRef]
  26. Tan, J.F.; Dai, W.D.; Lu, M.L.; Lv, H.P.; Guo, L.; Zhang, Y.; Zhu, Y.; Peng, Q.H.; Lin, Z. Study of the dynamic changes in the non-volatile chemical constituents of black tea during fermentation processing by a non-targeted metabolomics approach. Food Res. Int. 2016, 79, 106–113. [Google Scholar] [CrossRef]
  27. Wan, X. Tea Biochemistry (In Chinese), 3rd ed.; China Agriculture Press: Beijing, China, 2003. [Google Scholar]
  28. Wei, K.; Wang, L.Y.; Zhou, J.; He, W.; Zeng, J.M.; Jiang, R.W.; Cheng, H. Comparison of catechins and purine alkaloids in albino and normal green tea cultivars (Camellia sinensis L.) by HPLC. Food Chem. 2012, 130, 720–724. [Google Scholar] [CrossRef]
  29. Xu, Y.Q.; Zhang, Y.N.; Chen, J.X.; Wang, F.; Du, Q.Z.; Yin, J.F. Quantitative analyses of the bitterness and astringency of catechins from green tea. Food Chem. 2018, 258, 16–24. [Google Scholar] [CrossRef] [PubMed]
  30. Yu, Z.M.; Yang, Z.Y. Understanding different regulatory mechanisms of proteinaceous and non-proteinaceous amino acid formation in tea (Camellia sinensis) provides new insights into the safe and effective alteration of tea flavor and function. Crit. Rev. Food Sci. Nutr. 2020, 60, 844–858. [Google Scholar] [CrossRef]
  31. Sakato, Y. Studies on the chemical constituents of tea Part III. On a new amide theanine. Nippon Nogeikagaku Kaishi 1949, 23, 262–267. [Google Scholar] [CrossRef]
  32. Deng, W.W.; Ogita, S.; Ashihara, H. Distribution and biosynthesis of theanine in theaceae plants. Plant Physiol. Biochem. 2010, 48, 70–72. [Google Scholar] [CrossRef]
  33. Ma, L.L.; Liu, Y.L.; Cao, D.; Gong, Z.M.; Jin, X.F. Quality constituents of high amino acid content tea cultivars with various leaf colors. Turk. J. Agric. For. 2018, 42, 383–392. [Google Scholar] [CrossRef]
  34. Yin, X.; Huang, J.A.; Zhang, S.G.; Liu, Z.H. Research progress of chemical components deciding the green tea taste. J. Tea Commun. 2018, 45, 9–13. [Google Scholar]
  35. Ma, L.L.; Liu, Y.L.; Cao, D.; Liu, P.P.; Wang, S.P.; Huang, Y.M.; Jin, X.F. Analysis and evaluation model construction based on the taste quality of green tea made from various cultivars or strains. Trans. CSAE 2020, 36, 277–286. [Google Scholar]
  36. Yamaguchi, S.; Ninomiya, K. Umami and food palatability. J. Nutr. 2000, 130, 921–926. [Google Scholar] [CrossRef] [PubMed]
  37. Cheng, Y.; Huynh-Ba, T.; Blank, I.; Robert, F. Temporal changes in aroma release of Longjing tea infusion: Interaction of volatile and nonvolatile tea components and formation of 2-Butyl-2-octenal upon aging. J. Agric. Food Chem. 2008, 56, 2160–2169. [Google Scholar] [CrossRef] [PubMed]
  38. Liu, G.F.; Liu, J.J.; He, Z.R.; Wang, F.M.; Yang, H.; Yan, Y.F.; Gao, M.J.; Gruber, M.Y.; Wan, X.C.; Wei, S. Implementation of CsLIS/NES in linalool biosynthesis involves transcript splicing regulation in Camellia sinensis. Plant Cell Environ. 2017, 41, 176–186. [Google Scholar] [CrossRef] [PubMed]
  39. Cao, L.T.; Guo, X.M.; Liu, G.J.; Song, Y.L.; Ho, C.T.; Hou, R.Y.; Zhang, L.; Wan, X.C. A comparative analysis for the volatile compounds of various Chinese dark teas using combinatory metabolomics and fungal solid-state fermentation. J. Food Drug Anal. 2018, 26, 1–12. [Google Scholar] [CrossRef]
  40. Yin, H.X.; Yang, Y.Q.; Yao, Y.F.; Zhang, M.M.; Wang, J.Q.; Jiang, Y.W.; Yuan, H.B. Discrimination of different characteristics of chestnut-like green tea based on gas chromatography-mass spectrometry and multivariate statistical analysis. Food Sci. 2018, 40, 192–198. [Google Scholar]
Figure 1. Morphological differences in the buds and tea samples from three theaceae plants ((A), C. sinensis and GT; (B), C. cuspidata and QLC; and (C), E. alata Kobuski and QDC).
Agronomy 11 00657 g001
Figure 2. A PCA score plot derived from the UPLC-Q-Exactive Orbitrap-MS datasets of the three tea samples.
Agronomy 11 00657 g002
Figure 3. A heat map of the relative amounts of the differentially accumulated metabolites (DAMs) in the three tea samples. The scale (ranging from 5.0 to 10.0) represents the log10 (Abundance) of the DAMs. Color-coding is graded from green to red with the relative intensity shift from low to high, respectively.
Agronomy 11 00657 g003
Figure 4. Analysis of volatile components of the three tea samples. (A). PCA score plot derived from the concentrations of volatile components of the three tea samples. (B). Venn diagram of the volatile components from the three tea samples. (C). The volatile component types of the three tea samples.
Agronomy 11 00657 g004
Table 1. Contents of amino acids, catechins, and caffeine in three tea samples.
Content (mg·g−1, DW)GTQLCQDC
Amino Acids
Aspartic acid2.05 ± 0.030.33 ± 0.01 **0.91 ± 0.02 **
Serine0.74 ± 0.020.08 ± 0.01 **0.12 ± 0.00 **
Glutamic acid2.56 ± 0.060.33 ± 0.01 **0.48 ± 0.01 **
Glycine0.06 ± 0.000.02 ± 0.00 **0.02 ± 0.00 **
Histidine0.17 ± 0.020.02 ± 0.00 **0.02 ± 0.00 **
Glutamine2.12 ± 0.250.24 ± 0.02 **0.22 ± 0.01 **
Arginine0.77 ± 0.020.09 ± 0.01 **1.76 ± 0.22 **
Threonine0.62 ± 0.010.11 ± 0.01 **0.21 ± 0.04 **
Alanine0.36 ± 0.010.11 ± 0.00 **0.11 ± 0.03 **
Proline0.71 ± 0.020.07 ± 0.00 **0.24 ± 0.04 **
Theanine15.97 ± 0.990.01 ± 0.00 **- **
Cysteine0.06 ± 0.020.04 ± 0.010.01 ± 0.00 **
Tyrosine0.54 ± 0.010.08 ± 0.01 **0.11 ± 0.01 **
Valine0.34 ± 0.010.05 ± 0.01 **0.04 ± 0.00 **
Methionine-1.40 ± 0.05 **-
Ornithine0.12 ± 0.010.10 ± 0.010.06 ± 0.01 *
Lysine0.39 ± 0.010.04 ± 0.00 **0.08 ± 0.00 **
Isoleucine0.25 ± 0.010.40 ± 0.02 *0.06 ± 0.01 **
Leucine0.45 ± 0.010.04 ± 0.01 **0.06 ± 0.00 **
Phenylalanine0.42 ± 0.010.04 ± 0.00 **0.09 ± 0.00 **
Total amino acids28.72 ± 1.273.59 ± 0.06 **4.59 ± 0.36 **
Catechins
Gallocatechin9.67 ± 0.41- **- **
Epigallocatechin14.10 ± 0.461.37 ± 0.03 **- **
Catechin3.49 ± 0.980.77 ± 0.05 **0.34 ± 0.08 **
Epigallocatechin gallate57.65 ± 3.035.18 ± 0.55 **12.84 ± 0.47 **
Epicatechin6.98 ± 0.2211.89 ± 0.36 **7.88 ± 2.42
Gallocatechin gallate18.59 ± 0.57- **- **
Epicatechin-3-gallate16.40 ± 0.31- **- **
Catechin gallate3.39 ± 0.11- **- **
Total catechins130.27 ± 5.8719.95 ± 0.99 **22.04 ± 3.07 **
Caffeine39.67 ± 1.670.45 ± 0.03 **4.97 ± 0.06 **
Note: All data were expressed as mean ± SD. Significant differences were presented at the levels of *, p < 0.05 and **, p < 0.01.
Publisher’s Note: MDPI stays neutral with regard to jurisdictional claims in published maps and institutional affiliations.

