Abstract
Intensive agricultural practices are leading to loss of soil fertility and overexploitation of natural resources which cause nutrients imbalance and further impair ecosystem services. Organic farming (OF), also coupled with minimum tillage and crop rotations, represents one of the strategies to limit this process and maintain soil functions. In a two-year field trial, organic farming practices, including a set of fertilizations combined with crop rotations and association with nitrogen fixing cover crops, were compared. The aim of this research was to assess in the short-term the effects on soil organic carbon, aggregate stability, and soil enzymes activities of using a combination of promising management practices in the delta region of the Po river. Results did not show improvements in organic carbon content and soil aggregate stability. Conversely, enzymatic activities were always significantly higher in OF treatments than the conventional one. Crop rotation and associated legumes were effective in enhancing β-glucosidase and P fixation through phosphatases activities. The present work suggests that an effective choice of crop species coupled with legumes can enhance biological activity re-starting main mechanisms of microbial development even without a contemporary increase of organic matter.
1. Introduction
The growing threats of climate change and unsustainable farming systems require a critical review of agronomic strategies needed to secure food production, while mitigating greenhouse gasses (GHGs) emissions, enhancing biodiversity, restoring quality of soil and water resources, and reducing soil erosion [1,2,3]. In seeking for the best agriculture practice, main issues to be addressed include: (i) depletion of soil organic matter (SOM), (ii) nutrient imbalance, (iii) accelerated soil erosion (with the oncoming risk of desertification), (iv) degradation of soil structure leading to, e.g., crusting and compaction, and (v) decline in soil water and nutrient retention capacities with reduction in resource use efficiency [4].
Organic farming (OF), which is legally defined in European Union (EU), has been proposed as a suitable alternative to conventional farming (CF) [5], with the ambition to drive the transition towards a sustainable food system that enhances the environment. Within the framework of the European Green Deal (European Commission, 2020) [6], the EU aims to achieve the target of 25% of agricultural land under OF by 2030. Organic farming relies on the SOM management to enhance soil physical, chemical, biological properties, in order to optimize crop production [7]. In OF systems, plant production depends almost exclusively on nutrient transformations in soils, since only limited amounts of permitted fertilizers are used [8]. Some direct benefits of consolidating the SOM pools include improvement in soil structure, retention of water and plant nutrients, increase in soil biodiversity, and decrease in risks of soil erosion and the related degradation. Moreover, OF intends to decrease agriculture diffuse pollution by significantly decreasing the use of mineral fertilizers and consequent aquifer and other water bodies contamination. Important, among numerous ancillary benefits, are increases in input efficiency because of the reduction in losses of water and nutrients from the root zone, increase in the soil and ecosystem resilience, and mitigation of climate change through CO2 sequestration [9]. Thus, in comparison with conventional farming, OF has potential benefits in promoting soil structure formation, enhancing soil biodiversity, alleviating environmental stresses, and improving food quality and safety through increasing SOM [10].
The increase of SOM content leads to more stable aggregates, thus increasing soil physical quality. Six and Paustian [11] have indicated that the key factors of SOM function are location of organic matter within the soil matrix by creating stable organic–mineral complexes. Mechanisms of SOM action to reduce soil vulnerability to structure degradation to both slaking and physical–chemical dispersion are [12]: (i) the formation of a hydrophobic film around soil particles that slows wetting, (ii) the relative increase of the soil micropore fraction (5–30 µm), which in turn reduces the internal air pressure and minimizes aggregate disruption [13], (iii) the greater inter-particle cohesion [14]. In contrast, there is still debate on to what extent fertilization types and levels, i.e., organic fertilization or crop residues, combined with growing different crops in rotation may affect the aggregate stability, having most likely changed the microbial-derived soil structure cohesion that would affect the aggregate stability [15].
Hydrolytic enzymes make nutrients available to plants and soil microorganisms from a wide array of complex substrates occupying a pivotal role in catalyzing reactions associated with organic matter decomposition and nutrient cycling. These enzymes are influenced by a wide range of soil properties such as pH, organic matter content, soil texture, which, in turn, are altered by management [16]. Enzyme activities have been suggested as soil indicators suitable for use in the evaluation of the degree of alteration of soils in both natural and anthropic agroecosystems [17]. Some research has already suggested the positive effects of farming practices on soil enzyme activities under Mediterranean [18] and temperate climate [19].
Furthermore, crop species influence microbial populations in the rizosphere: for example, wheat, ryegrass, bentgrass, and clover roots exudates increase different kinds of microbial species, indicating a clear discrimination between the carbon sources utilized by microbial communities from the different plant rhizospheres [20]. Miller et al. [21] found significant differences among the rhizosphere bacterial community of wheat, maize, and grass, while Houlden et al. [22] showed clear shifts in rhizosphere microbial communities depending on developmental stage in wheat, pea, and sugar beet.
The aim of this research was to assess in the short-term the differences induced by conventional and organic farming practices coupled with reduced tillage, crop rotation, and organic amendments in the delta region of the Po river.
In this context, the SOM content and characteristics, specific enzyme activities, and soil aggregate stability were selected as possible indicators for soil quality assessment [23] to evaluate the implications of different management practices and of a conversion into organic farming.
2. Materials and Methods
2.1. Study Area
A field trial was conducted in the years 2008–2009 at the Horticultural Experimental Centre “Po di Tramontana” in Rosolina (Italy) located on the Po delta area of the Veneto Region (45°04′04″ N 12°15′46″ E). The local climate is classified as temperate suboceanic [24] with a mean annual rainfall of 721 mm, 76 rainy days per year (30-years average). The temperature reaches minimum values in January (0.7 °C, on average) and maximum values in July and August (29.0 °C, on average). Air relative humidity ranges from 60 to 97%.
The characterization of the soil initial conditions for the experiment is reported in Table 1. The soil was a fairly homogeneous sandy loam classified as Calcaric Gleysol [25] characterized by a sub-neutral/alkaline pH, low SOC content, and low CEC.

Table 1.
Soil characterization.
2.2. Experimental Design
The experiment was conducted on plots, consisting each of 240 m2 (8 m × 30 m), which were conducted in accordance to organic EC Regulation since 2000. Experimental design consisted of one conventional (Conv) and four organic treatments (Org) in a randomized block design with three replicates.
In the two years preceding the experiment (2006 and 2007), the area was managed as follows: the Conv plots were left uncultivated for 3 out of 4 semesters and for the remaining semester cultivated with radicchio (Chicorium intybus L., 1753); the Org plots were uncultivated for 2 semesters, then cultivated again with wheat (Triticum aestivum L.) and cabbage (Brassica oleracea var. cauliflower) and intercropped with clover (Trifolium repens L.).
Conv was ploughed at 35 cm depth with crop residues incorporation followed by seedbed preparation with disk arrow (<15 cm depth), then cultivated with winter wheat and rapeseed (Brassica napus L., 1753) (Conv WR) and amended with 36 t ha−1 of organo-mineral fertilizers (Spiga d’oro produced by Unimer, Milano, Italy NPK 1:2.25:0), 50 kg ha−1 of urea, and 200 kg ha−1 of ammonium sulfate. Org was managed according to minimum tillage practices consisting in surface chiseling (20 cm) only. Cultivation treatments under comparison were: (1) a cropping sequence of sorghum (Sorghum vulgare Pers.), garlic (Allium sativum L.), and radicchio (hereafter labeled “Org SGR”); (2) the same cropping sequence as before plus clover (Trifolium repens L.) as associated intercrop (hereafter labeled Org “SGR + C”); (3) a pumpkin (Cucurbita maxima Duchesne, 1786), barley (Hordeum vulgare L.), and fennel (Foeniculum vulgare L., 1753) rotation (hereafter labeled “Org PBF”); (4) finally the fourth cropping sequence was the same as “Org PBF” with the addition of pea (Pisum sativum L., 1753) as associated intercrop (“Org PBF + P”). Fertilizations in Org consisted in liquid and pelleted organic amendments supplied as follows: in Org SGR + C, 1.5 t ha−1 of Borlanda produced by La Mediterranea, Budrio, Italy (liquid residues from sugarbeet wort alcoholic fermentation NPK 3:0:6) in September 2008 and 0.25 t ha−1 of Orgazot produced by AGM, Castelnuovo di Sotto, Italy (from lyophilized blood N = 14%) in August 2009; in Org PBF + P, the dose was doubled in September 2008 (3.0 t ha−1 Borlanda, NPK 3:0:6) while was maintained at 0.25 t ha−1 Orgazot (N = 14%) in August 2009. In both Org SGR and Org PBF amendments were equally distributed as follows: 2.5 t ha−1 of Bio-rex produced by Italpollina, Rivoli Veronese, Italy (pelleted manure, N = 2.8%, C/N = 13) in May 2008, 3.0 t ha−1 Borlanda (NPK 3:0:6) in September 2008, 6 t ha−1 of Organfertil produced by Compo Italia, Cesano Maderno, Italy (pelleted N = 1%; C/N = 25) in July 2009, 0.25 t ha−1 (N = 14%) in August 2009 (Table 2).
Table 2.
Experimental setup.
Treatments including clover and pea were supplied with a lower amount of N fertilizer due to the N fixing action of these species.
2.3. Crops Yield of the Experimental Fields
The yield achieved in each Org management was recorded for the two-year experiment and total production is reported in Table 3. Sorghum was harvested in May 2008; garlic in October 2008; radicchio in August 2009; pumpkin in May 2008; barley and pea in November 2008; and fennel in August 2009. CONV productivity was of 2.2 t ha-1 rapeseed harvested in July 2008; 6.0 t ha-1 of wheat were harvested in July 2009.
Table 3.
Crops yield of Org managements.
2.4. Soil Sampling
Disturbed soil samples were collected in the top 25 cm layer before starting the experiment (January 2008) for preliminary analyses reported in Table 1. Sampling on January 2008 was performed for initial soil characterization (main soil physical-chemical properties). During March, July, and November for both 2008 and 2009 years for a total of six sampling dates, samples for SOM and enzyme activities were collected. Field-moist bulk soil samples were split into two subsamples. One soil subsample was sieved at 2 mm and stored at 2 °C for enzyme activities analyses, while the other was used for chemical and physical analyses. Soil samples from each plot were composed of five subsamples that were bulked to obtain a sample of about 3 kg. Sampling involved the central area of the plots excluding a 2-m edge to avoid soil movement effects [26]. Additionally, a total of 30 undisturbed soil cores, 8 cm diameter, one per plot each year, in November 2008 and 2009, were taken from the topsoil (0–25 cm) for bulk density calculation.
2.5. Physical-Chemical Parameters
Undisturbed samples were weighed and a fraction was oven-dried at 105 °C for 24 h to calculate bulk density according to the core method [27]. The pH was measured potentiometrically on pulverized samples by adding deionized water (1:2.5 w/v, dry weight basis). The electrical conductivity (EC) was potentiometrically determined after water extraction (2:5 w/v) and filtration through Whatman filter N. 2 paper. Particle size analysis was performed according to the hydrometer method, using sodium hexametaphosphate as a dispersant (Gee and Bauder 1986). Exchangeable bases, including calcium (Ca), magnesium (Mg), potassium (K), and sodium (Na), were extracted using barium chloride as reported in [28], and their concentrations were determined by inductively coupled plasma-optical emission spectroscopy (ICP-OES) on a SPECTRO CIROS (Spectro Analytical Instruments, Kleve, Germany). Cation exchange capacity CEC was calculated as reported in [29]. Plant available phosphorus (P) was calculated using the Olsen method [30]. Carbonate content (CaCO3) was determined by the volumetric calcimeter method [31].
Soil organic C (SOC) was determined by a wet oxidation titration procedure using an acid dichromate system [32].
Total N was measured on air-dried 0.5 mm sieved samples using the flash combustion method (CNS Elemental Analyzer, Vario Max, Elementar Inc., Langenselbold, Germany).
For particle size distribution determination, the standard pipette method was used as described by USDA-NRCS (2004) [33]
2.6. Soil Organic Matter Parameters
Humic substances were extracted from 2 mm-sieved, air-dried samples with 0.1 M KOH (1:10 w/v) at room temperature for 16 h under an N2 atmosphere and freed from the suspended material by centrifugation at 7.000× g for 20 min and filtration on Whatman (Whatman, Maidstone, England) N° 42 filter paper. Organic carbon content was assayed by dichromate oxidation [32]. Molecular-weight distribution and gel-permeation chromatography of each humic extract was carried out on a Sephadex G-100 gel packed in a 70 cm × 1.6 cm Pharmacia column (Pharmacia, Uppsala, Sweden) as reported in Cardinali et al. [34]. The gel packing solution and the eluant were 20 mM Na2B4O7. The apparent molecular weight of the fractions was >100, 10–100, and <10 kDa. The column calibration was based on standard kit for molecular weights (Sigma-Aldrich Gel Filtration Molecular Weight Markers MWGF200). All chemical determinations were performed in triplicate.
2.7. Enzyme Activities
Enzyme activities were determined on fresh moist sieved (<2 mm) soils within 10 days from the collection of the samples. Triplicates were performed for each activity assay. Control assays were performed in all cases, except for dehydrogenase, by adding the substrate after the reaction was stopped and before filtration of the soil suspension. All data were corrected to soil dry weight by means of soil moisture content data.
Urease activity (E.C. 3.5.1.5) was assayed as described by Kandeler and Gerber [35] using 0.08 M urea as substrate while the samples were incubated at 30 °C for 2 h. N-α-benzoyl-L-argininamide (BAA) hydrolyzing protease activity was determined in 0.1 M phosphate buffer at pH 7; 0.03 M BAA was used as substrate [36]. The sample was incubated at 40 °C for 2 h. The resulting suspensions were filtered, and filtrates analyzed for ammonia by the following colorimetric procedure. One milliliter of filtrate was diluted to 10 mL with distilled H2O and, successively, 5 mL Na salicylate solution (100 mL sodium nitroprussiate 1.2 g L−1, 100 mL Na salicylate 17 g L−1, and 100 mL distilled H2O mixed and the moment of use) and 2 mL 10% Na dichloroisochanurate were added. Solutions were incubated for 30 min at room temperature and solution absorbance measured spectrophotometrically at 600 nm [35]. Urease and protease activities were determined as μg NH4+ g−1 dry soil h−1 released in the hydrolysis reaction.
Dehydrogenase activity was determined following a modification of Masciandaro et al. [37]. Soil was mixed with 0.2 mL of 0.4% (7.91 mM) 2-p-iodo-phenyl-3-p-nitrophenyl-5-phenyltetrazolium chloride (INT) solution (in distilled water, w/v). The control was the soil treated with distilled water (0.2 mL), instead of INT. Soils were incubated for 20 h at 20 °C in darkness; pH values did not vary during the incubation time. The iodonitrotetrazolium formazan (INTF) formed by the reduction of INT was extracted by adding 10 mL of a mixture of 1:1.5 tetrachloroethylene and acetone; then, the soil mixture was vigorously shaken by hand for 1 min and finally filtered through a Whatman no. 41 filter paper. The INTF concentration was measured spectrophotometrically at 490 nm, and the results were expressed as μg INTF g–1 dry soil h–1.
Alkaline phosphatase (EC 3.1.3.1 orthophosphoric- monoester phosphohydrolase, alkaline optimum), phosphodiesterase (EC 3.1.4.1 orthophosphoric diester phosphohydrolase), and β-glucosidase (EC 3.2.1.21, β-D-glucoside glucohydrolase) activities were determined according to official Italian methods for soil analysis. To measure alkaline phosphatase activity, four milliliters of modified universal buffer (MUB), pH 11, and 1 mL of substrate p-nitrophenyl phosphate (PNPP) 0.025 M were added to 1 g of soil and incubated at 37 °C for 1 h. The reaction was stopped by adding 1 mL 0.5 M CaCl2 and 4 mL 0.5 M NaOH.
Phosphodiesterase activity was determined following Browman and Tabatabai [38]. Briefly, 4 mL 0.05 M TRIS-buffer pH 8 and 1 mL bis-p-nitrophenyl phosphate 0.005 M were added to 1 g of soil and incubated at 37 °C for 1 h. The reaction was stopped by adding 1 mL 0.5 M CaCl2 and 4 mL 0.1 M TRIS-NaOH pH 12 buffer.
For the determination of β-glucosidase activity, four milliliters of modified universal buffer (MUB), pH 6, and 1 mL of substrate p-nitrophenyl-b-D-glucopyranoside (PNG) 0.025 M were added to 1 g of soil and incubated at 37 °C for 1 h The reaction was stopped by adding 1 mL 0.5 M CaCl2 and 4 mL 0.1 M TRIS-NaOH pH 12 buffer [39].The p-nitrophenol (pNP) formed in alkaline phosphatase, phosphodiesterase, and β-glucosidase activities was determined by spectrophotometry at 400 nm and reported as μg p-nitrophenol (pNP) g−1 dry soil h−1.
The fluorescein diacetate hydrolase (FDAH) activity was assessed as described by Adam and Duncan [40]. A 2-g soil sample was shaken for 15 min with 15 mL of 60 mM potassium phosphate pH 7.6 buffer and with 0.2 mL of 1000 μg mL−1 FDA solution for 20 min at 30 °C. 15 mL of 2:1 chloroform/methanol solution was added, and the contents shaken thoroughly by hand before filtration (Whatman, No 2). The absorbance was measured spectrophotometrically at 490 nm on the filtrate. The concentration was expressed in mg fluorescein released g−1 dry soil h−1.
2.8. Soil Aggregate Stability
Samples were air-dried. During the drying operation, the bulk soil was broken along natural fissures into small pieces by gentle hand manipulation [40]. Once dried, the 1–2 mm aggregate fraction was separated and subjected to 200-μm wet sieving, applying vertical shaking for 30 min with a frequency of 30 oscillations per minute (900 oscillations in total) at a 3 cm amplitude [41]. The material was then carefully transferred to a second beaker by a washing flask and oven-dried at 105 °C to constant mass. The coarse sand (200–2000 μm) content was determined by adding 25 mL of a solution containing 40 g sodium hexametaphosphate and 10 g sodium carbonate in 1 L to each dry sample (about 7 g), allowing to stand for 24 h, washing (with demineralized water) on a sieve (200 μm), and oven-drying the material retained.
The wet aggregate stability index (WASI) was calculated as specified in Dal Ferro et al. [13]:
where WSA is the dry mass of water stable aggregates >200 μm, Wagg the total dry mass of the sieved aggregates, and Wsand the dry mass of coarse sand particles measured after dispersion.
Before wet sieving, soil aggregates were subjected to fast wetting obtained by immersing 10 g soil aggregates in deionized water for 10 min to simulate the effect of heavy rain storms [42]. To distinguish slaking from physical–chemical dispersion, before fast wetting soil aggregates were subjected to: (i) no pretreatment (WSA), (ii) pretreatment with benzene (BSA = benzene stable aggregates) to coat the aggregates and emphasize the hydrophobic nature of SOM [12], (iii) pretreatment with ethanol (ASA = alcohol stable aggregates) to test the wet mechanical cohesion by substituting air with a polar liquid before energy is applied [43]. Immersion of ethanol-pretreated soil aggregates in water minimizes slaking of dried soil aggregates and emphasizes the resistance of soil aggregates to dissolution and the dispersive action of water.
2.9. Statistical Analyses
One-way ANOVA with repeated measures were performed in order to compare treatments among the sampling periods; for those parameters that have available less than 3 sampling times, a two-way ANOVA was performed, including the sampling time as a fixed factor. Duncan test was performed for post-hoc comparisons. Paired T test was performed to compare enzymatic activities between the same period of different years (e.g., March 2008 vs. March 2009). Levene and Mauchly’s tests were applied to check homoscedasticity and sphericity, respectively, to ensure that assumptions of the model were met as recommended in Field [44]. Pearson’s correlation was performed to test correlations between organic carbon content and soil stability indexes. All these procedures were performed by IBM SPSS 26.0.
A canonical discriminant analysis (CDA) was performed by SAS software (SAS Institute, 2004) to determine which variables best predicts group membership and to visualize the data by grouping the variables in one or more axes [34]. The analysis selects a limited set of discriminant functions that best describe the separation of the studied plots. A stepwise procedure was also applied to choose the set of variables characterized by the highest correlation with the factor and assess the relative importance of each independent variable. The consistency and overall robustness of the separation was evaluated by the Mahalanobis quadratic distance, an index that measures the squared distances between the centroids of each cloud, thus reflecting the actual separation between the different managements. The Wilks Lambda, performed to evaluate the quality of the multivariate statistics, shows significant differences among population means.
3. Results
3.1. Soil Physical Parameters
Bulk density (Table 4) showed significant differences only in 2008 between Org PBF and the other treatments. It was also noted a convergence to a narrow range of bulk density values in 2009 compared to the previous year. Although this behavior appears clear, from a statistically point of view, there is no evidence about a significant effect of the factor time.
Table 4.
Bulk density.
Wet aggregate stability indexes (WASI) (Table 5A) pretreated with ethanol (ASA) led to the highest aggregate stability in both years, showing a 48.6% biennial mean value, while benzene pretreatment (BSA) and non-pretreated aggregates (WSA) showed lower and similar values, respectively 8.1% and 12.8%. The aggregate structure was not degrading significantly in the different years, despite a tendency to lower WASI was observed in 2009 than 2008, regardless the tested treatments.
Table 5.
Evolution of stability indexes (WASI), humic fractions, and humic carbon contents.
WASI indexes were generally significantly lower in Conv WR than Org managements, especially after ASA, resulting over the years consistently <30% compared to values >45% in other treatments.
3.2. Soil Organic Carbon and Humic Fraction Content
Soil organic carbon content (Table 5B) was 9.5 g kg−1 in March 2008, on average, afterwards it decreased to 8.5 g kg−1 (July 2008) which was roughly maintained until the end of the experiment (November 2009). The only significant difference was observed between Conv and Org treatments, the former showing lower values (5.2 ± 0.4 g kg−1) than Org managements (10 ± 0.2 g kg−1) across the years.
Humic matters were characterized by a decrease of high (F1) and low (F3) apparent molecular weight fractions and an increase of intermediate ones (F2), regardless the agricultural system management (Table 5C). Time seems to be the most important factor in humic matter evolution (p < 0.01) with no interaction with management. Differences among treatments were statistically significant only for F1 and F3, particularly emphasized by a lower F1, and higher F3, in Org PBF than other organic or conventional treatments.
While the humic matter evolution process was affected by agricultural management systems, the humic carbon content (Table 5D) did not differ significantly across the tested dates. It showed a common pattern among all the organic treatments, with slight increases of humic carbon (HC) content in July and November 2008 and a following decrease, while in Conv WR content did not show significant variations.
3.3. Interaction between Soil Organic Matter and Soil Stability
Soil organic carbon and HC showed significant positive correlations with all aggregate stability indexes. Ethanol-pretreated aggregates (ASA) were the most correlated with SOC (r = 0.80) and HC (r = 0.73), followed by BSA (r = 0.63 for both SOC and HC) and WSA (r = 0.59 for both SOC and HC), confirming the role of organic matter in giving stability to soil aggregates (Table 5A). The high molecular weight humic fraction (F1) was the most positively correlated with aggregate stability indexes, in particular with BSA (r = 0.70) and ASA (r = 0.73) that emphasized the humic matter hydrophobicity and ability to enhance chemical bonds with soil mineral particles (Table 5B).
3.4. Enzymatic Activity
Average values of conventional management were always significantly lower than those of organic managements (M average). Among organic managements, dehydrogenase, phosphodiesterase, protease, and urease activities were similar (Table 6, Table 7, Table 8 and Table 9, respectively) while phosphomonoesterase, FDA, and β-glucosidase (Table 10, Table 11 and Table 12, respectively) activities were higher in thesis with legumes employed as cover/intercrops.
Table 6.
Dehydrogenase enzymatic activity in soil.
Table 7.
Phosphodiesterase enzymatic activity in soil.
Table 8.
Protease enzymatic activity in soil.
Table 9.
Urease enzymatic activity in soil.
Table 10.
Phosphomonoesterase enzymatic activity in soil.
Table 11.
Total microbial enzymatic activity measured by fluorescein diacetate hydrolase (FDA) activity in soil.
Table 12.
β-Glucosidase enzymatic activity in soil.
Among the seasons and years (T average), FDA and dehydrogenase showed highest values in summer of both years while β-glucosidase showed a regular increase from 2008 to 2009 with a peak in July 2009; the two phosphoesterases presented a peak in summer with an irregular trend across the years; protease and urease were constant with a peak in July 2008.
Within the seasons, except for FDA and β-glucosidase that presented significant differences between March 2008 and March 2009 for Org SGR and Org SGR + C, respectively (Table 11 and Table 12), all treatments showed significant differences only between July 2008 and 2009, and/or between November 2008 and 2009. Dehydrogenase activity remained stable in all the situations with the unique difference between CF and OF.
3.5. Canonical Discriminant Analysis
CDA analysis was performed (1) to confirm the differences in soil fertility parameters between CF and OF systems and (2) to evaluate the effects of diverse crop rotations on soil biochemical properties.
The scatter plot (Figure 1) of the first two extracted canonical roots showed that CAN 1 (accounting for 80.09% of the model variability) well discriminated Conv WR and Org SGR from Org PBF + P and Org PBF, whereas CAN 2 (explaining 17.48%) discriminated Org SGR from the other managements. The canonical scores are reported in supplementary data. The overall Wilk’s Lambda was 0.0074 (F = 10.01; p < 0.0001). The Mahalanobis quadratic distances of the 5 clouds and their significance (Table A1 and Table A2) are reported in Appendix A. Values indicated that only Org PBF + P and Org PBF were not significantly different.
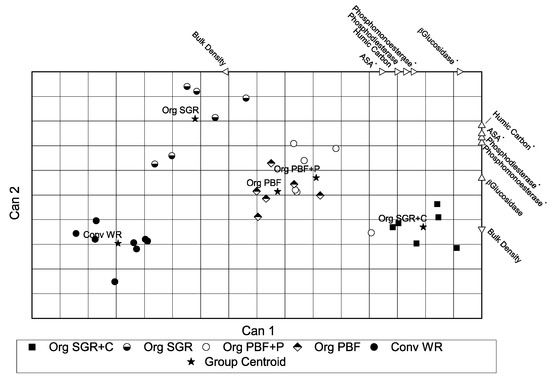
Figure 1.
Canonical discriminant analysis scatter plot showing the separation of samples from the different plots. Additional axes show the most important variables contributing to the formation of the canonical variables. The extension of each arrow from the plot center indicates the importance of the variable in the canonical structure according to Pearson correlation coefficients and its direction reports the increase or decrease of the variable. Stars indicate centroid of each cloud.
Variables that significantly contributed to the CDA model were the enzymatic activities β-glucosidase, phosphomonoesterase, phosphodiesterase, the humic carbon content, and the soil physical properties of aggregate stability (ASA) and bulk density (Figure 1). These variables were not equally important in the construction of the canonical functions, as demonstrated by Pearson correlation coefficients and significance levels (Table A2). Although, contributing to the model, bulk density values did not correlate with the canonical axes, while all other factors significantly correlate with the two canonical functions.
4. Discussion
4.1. Soil Organic Matter and Stability Indexes
Since the first sampling to the end of the experiment, Conv WR showed significantly lower topsoil content of both SOC and HC (Table 5B). These results were likely due to the combined effect of different fertilization (mineral in Conv vs. organic in Org) and tillage operations (intensive in Conv vs. minimum in Org), that were primarily involved in SOC change dynamics as also observed in other studies [45]. However, all treatments showed SOC and HC reduction, highlighting the poor ability of coarse texture soils to form stable organo-mineral complexes that would protect the organic matter from mineralization. These results corroborated previous findings in similar pedo-climatic conditions, where different soil improving cropping systems were compared for SOC stock in a 6-year experiment, and results revealed that they suffered from low soil reactivity to SOC accumulation dynamics [46]. These dynamics are in contrast with long-term studies where SOC accumulation dynamics occurred in different soil types, either clayey, loamy, or sandy [47]. In our experiment, the topsoil SOC depletion could be related with: (i) the short time of the experimental monitoring; (ii) the effects of soil disturbance and SOC mineralization with minimum tillage that counteracted the topsoil organic carbon accumulation with no tillage in previous years in the same plots. The latter seems in agreement with previous studies [48,49], where a topsoil SOC content was partially lost just after some greater intensity in soil tillage operations, suggesting that aggregate breakdown stimulation and reduced SOC protection occurred [50].
The results about WASIs corroborated previous findings on the strong relationship between SOC content and structure [51,52]: here, a trend towards a loss of aggregate structure stability was observed from early 2008 to 2009, which was consistent with the SOC and HC depletion. In addition, significant WASIs reductions were observed when more intensive tillage operations—under Conv—were compared with minimum tillage—under Org.
The wet mechanical cohesion between soil and organic matter particles assumed particular importance, being ASA stability indexes always greater in Org compared to Conv. In contrast, the BSA index had little differentiation between treatments, suggesting that the hydrophobic behavior of soil organic matter to protect the structure was likely a secondary mechanism.
Humic matter hydrophobicity may not be the most significant factor in improving aggregates stability [38], this is consistent with our data: although with the clear evolution of humic substances (Table 5B) towards the intermediate molecular fraction, there is no evidence of increased aggregate stability through WASI tests (Table 5A); those, conversely, showed a general decrease of stability in agreement with OC and HC decrease. On the other side, the clear correlation among WASIs indexes (especially ASA) and high molecular weight fraction (Table 13) can suggest that F1 can exert an influence on the chemical bonding that affects aggregates stability. This is corroborated by previous findings [9] that reported strong positive correlations (r > 0.90) between F1 and carboxyl groups, which in turn are responsible for strong soil-SOM chemisorptive bondings, especially in soils with low SOC content <1% [14]. We argue that the decrease of bulk density (Table 4), which could be a signal of enhanced porosity, was the consequence of conventional and light ploughing that broke down the superficial layer after the no cultivation period. A slow reaction to improve soil structure properties in similar silty soils with low organic carbon content was also observed in previous studies, [53], suggesting that long-term strategies to increase the chemical and physical soil fertility are required.
Table 13.
Pearson’s correlations.
4.2. Enzymatic Activities
All enzymes activities considered in this work show higher values in organic treatments than conventional one but with noticeable differences among themselves.
Fluorescein diacetate (FDA) hydrolysis and β-glucosidase are indicators of total enzymatic activity due to the capability of many enzymes free or bound to cell membranes to hydrolyze fluorescein diacetate, and the presence of β-glucosidase in circulant solution or in fungi: agricultural practices involving minimum soil disturbance, maximizing soil cover, and the use of organic amendments can contribute to improve β-glucosidase activity through the increase of fungi presence and organic C but FDA also displayed modifications caused by climate [54,55,56]. Our data showed a peak of activity for FDA in correspondence with the warmer periods of the experiment (July 2008 and 2009) while β-glucosidase showed also peak in November 2009. Interestingly, our data do not match with works cited above about direct relationship between C increase and enzymatic activity increase as we recorded a general OC and HC decrease, in particular from March 2008 to July 2008 and a following steady state until the end of the trial. Although in this trend, enzymatic activity of FDA hydrolases and β-glucosidase increased in all thesis except Conv WR for β-glucosidase. An explanation could be one as described in Weerasekara [57]: under the legume hairy vetch and cereal rye employed as cover crops in silty loam or sand, β-glucosidase increased its activity while FDA hydrolases significantly decreased. This is consistent with thesis Org SGR + C that employs a cereal (sorghum) as one of main crops plus a legume as cover and associate crop (clover) in a sandy loam soil: not only average β-glucosidase values are the highest but it shows the higher increase between the same seasons of the two years (Table 13). Conversely, FDA activity increased and remained higher in thesis Org SGR + C and Org PBF + P characterized by cereals + legumes (Table 11).
Plant diversity can increase microbial activity and carbon storage as result mainly of new carbon integration by microbial community [58] but there seems the need of the “right combination” of crops, soil, management, and climate in order to achieve some specific results in term of biological activity.
In our work, dehydrogenase activity did not show any significant change within each thesis during the experimental period (Table 6) nor among organic managements. In the present work, this enzymatic activity seems to depend on the organic carbon content that remained roughly stable in the present experiment, after a first decrease. Previous long-term data confirmed the relation among dehydrogenase activity and OC content [59]. Lange at al. indicated that C storing in soil is mainly the effect of new C integration by the microbial community [58] and that the dehydrogenase activity is strictly related to microbial biomass and not only to total organic matter content [60]. It is reasonable to hypothesize the conditions of our experiment were not enough to cause an increase of dehydrogenase activity in two years, although data on FDA indicates that organic managements were able to increase the microbial community.
Phosphodiesterase and phosphomonoesterase activities are known to act sequentially in soil. It has been reported that the lower activity of phosphodiesterases than acid and alkaline phosphomonoesterase causes the production of P monoesters from P diesters that may stimulate the microbial synthesis of more phosphomonoesterases [61]. This conclusion seems in agreement with our data where phosphomonoesterase shows an activity up to four times higher than phosphodiesterase. Phosphodiesterase activity is significantly higher in organic managements characterized by light tillage than in conventional tillage which is consistent with previous trials that reported a higher phosphodiesterase activity in light tillage + mulching than in conventional and no tillage [59,60,62]. Phosphodiesterase activity was in average higher in 2009 than in 2008: due to the stable OC content, the main cause of this increase could be the rotation and in particular the combination crop-associated legume. The clover-garlic (CG) combination resulted in the highest values in summer among all managements and within the Org SGR + C thesis, this combination gave always the highest results. The presence of garlic seems to be correlated with higher phosphodiesterase activity in Org SCG also when not associated with clover. The positive action of garlic root exudates was reported also in short-term continuous cropping (5–10 years) characterized by a significant increase in bacteria, fungi, phosphatase, and urease activity in the rhizosphere [63]. A positive effect on soil enzyme activities of garlic was also reported by Zhou at al. [64] for soil urease activity; Wang et al. [65] for urease and alkaline phosphatase activities. Yiang et al. [66] reported that garlic increased soil enzymatic activities and fungi populations also when rotated with watermelon. In both summer 2008 and 2009, the phosphodiesterase activity (Table 7), although without statistic evidence, seems to be higher in theses managed with legumes than in those organic theses without clover and pea: this is consistent with [67] who found that nodulated legumes species growing in savanna soils stimulated the acid phosphatase activity of the rhizosphere soil.
Although, phosphodiesterase and phosphomonoesterase act sequentially [52], when comparing the same period within the two years of experiment, we found phosphodiesterase increased in 2009, while phosphomonoesterase decreased (Table 10). We hypothesize the soil was enriched in organic and inorganic P through the years, causing a decrease of phosphomonoesterase activity. This is in agreement with Kandeler et al. [68] who found an inverse correlation between the phosphomonoesterase activity and the P organic content of the rhizosphere soil sampled from Triticum aestivum and Trifolium alexandrium.
Protease activity evidenced a decrease from 2008 to 2009 except for the march datapoint (Table 8), with the higher values in July 2008 and July 2009 when samples were collected during fertilizers addition and higher temperatures: the sudden increase in C and N availability could have increased the microbial community growth rate with a consequent higher need of N. As reported by Geisseler and Horwath [69], the level of protease synthesis is determined by the need for C rather than N: this could be in agreement with OC decrease during the experiment.
Urease activity followed the same trend of protease (Table 8): most authors, see for example [70], found an increase of urease activity correlated with zero/light tillage and the consequent increase of organic matter as confirmed in the present work on comparison with conventionally managed soils. For the year-to-year trend among the organic samples, we hypothesize, like for protease, a disbalance in C and N content. However, it is interesting to note that, although not significant, urease activity is higher in bare soil when compared with same soil covered by crop (Table 9).
The canonical discriminant analysis successfully discriminates conventionally managed soils and organic managed theses. This is in line with the known action of organic management in soil activities [71]. The analysis also distinguishes Org SGR and Org SGR + C from Org PBF treatments with or without pea intercropping and/or associated crop. This confirms the importance of the crops in determining the overall soil quality. Present results indicate that garlic plays an important role in these phenomena in association with the presence of leguminous crop as clover. Not all the factors were equally important in the CDA algorithm (Figure 1, Table A1); this is in agreement with our analysis: indeed phosphodiesterase, phosphomonoesterase, and β-glucosidase gave the main contribution in separating the 4 clusters. In particular, the two phosphatases showed the main role in separating groups being the two enzymes apparently not dependent on C content decrease/stability, probably due to the priority to store P to build ATP.
5. Conclusions
In a sandy loamy soil, characterized by low OC content, organic management, coupled with minimum tillage, maintained a higher level of biological activity in comparison with conventional farming systems. Due to the short-term period of the experiment, the main physical parameters depending on organic matter content, like bulk density, did not significantly change. In contrast, the soil aggregate stability seemed affected by the quantity and quality of organic matter, suggesting that tested OF systems are promising for improvements of soil physical fertility in the long-term.
Crop rotation and the association with a legume gave the higher contribution in enhancing the biological activity in soil increasing “phosphatase mechanism” as a main biological source of energy. Garlic showed the best results in term of phosphatases activity.
Microbial phosphomonoesterases are probably the major contributing enzymes to the measured enzyme activity in soil [72,73]. This work suggests that the right choice of an effective rotation with the right crop species is fundamental to re-start biological activity in impoverished soil or to rapidly ameliorate its structure. Finally, from a methodological point of view, this work confirms the pivotal role played by the enzymatic indexes for monitoring the effects of management systems, being sensitive soil attributes that reflect the capacity of a soil to function and can be used as indicators of soil quality also in the short term.
Author Contributions
Conceptualization, P.C., F.C. and F.M.; Analysis P.C., N.D.F.; data curation, M.P.; writing—original draft preparation M.P.; writing—reviewing and editing P.C., N.D.F., F.C., F.M.; supervision P.C., F.M.; funding acquisition F.C., P.C., F.M. All authors have read and agreed to the published version of the manuscript.
Funding
This research was funded by VENETO AGRICOLTURA—Agenzia Veneta per l’Innovazione nel Settore Primario—and conducted by the Horticultural Experimental Centre ‘Po di Tramontana’, Rosolina (RO), Italy. PC was financially supported by the University of Padova DOR2072992/20.
Institutional Review Board Statement
Not applicable.
Informed Consent Statement
Not applicable.
Data Availability Statement
Not applicable.
Acknowledgments
The authors are grateful to Luca Conte for the help in conceiving the experiment. The authors also thank Francesco Barbi, Chiara Vivian, Nicolò Avogaro and Gioia Scarpa for their valuable help during soil sampling operations.
Conflicts of Interest
The authors declare no conflict of interest.
Appendix A
Table A1.
Mahalanobis quadratic distances.
Table A1.
Mahalanobis quadratic distances.
| Mahalanobis Distances | |||||
| Managements | Org SGR + C | Org SGR | Org PBF + P | Org PBF | Conv WR |
| Org SGR + C | 0 | 34.67 | 7.91 | 12.60 | 55.09 |
| Org SGR | 34.67 | 0 | 10.23 | 7.82 | 15.41 |
| Org PBF + P | 7.91 | 10.23 | 0 | 2.28 | 26.64 |
| Org PBF | 12.60 | 7.82 | 2.28 | 0 | 17.92 |
| Conv WR | 55.09 | 15.41 | 26.64 | 17.92 | 0 |
| Significance of Mahalanobis Distances | |||||
| Org SGR + C | Org SGR | Org PBF + P | Org PBF | Conv WR | |
| Org SGR + C | 1.000 | <0.0001 | 0.0001 | <0.0001 | <0.0001 |
| Org SGR | <0.0001 | 1.000 | <0.0001 | 0.0001 | <0.0001 |
| Org PBF + P | 0.0001 | <0.0001 | 1.000 | 0.073 | <0.0001 |
| Org PBF | <0.0001 | 0.0001 | 0.073 | 1.000 | <0.0001 |
| Conv WR | <0.0001 | <0.0001 | <0.0001 | <0.0001 | 1.000 |
Table A2.
Pearson correlation coefficients.
Table A2.
Pearson correlation coefficients.
| Factors | CAN 1 | CAN 2 | ||
|---|---|---|---|---|
| Pearson Cor. | p | Pearson Cor. | p | |
| β-Glucosidase | 0.89991 | <0.0001 | 0.13598 | 0.458 |
| Phosphomonoesterase | 0.69523 | <0.0001 | 0.42232 | 0.016 |
| HC | 0.62265 | 0.0001 | 0.56273 | 0.0008 |
| Phosphodiesterase | 0.66125 | <0.0001 | 0.46454 | 0.0074 |
| ASA | 0.55407 | 0.001 | 0.49636 | 0.0039 |
| Average bulk density | −0.13675 | 0.4555 | −0.27578 | 0.1266 |
References
- Godfray, H.C.J.; Garnett, T. Food security and sustainable intensification. Philos. Trans. R. Soc. B Biol. Sci. 2014, 369, 20120273. [Google Scholar] [CrossRef]
- Lal, R. Soil carbon sequestration to mitigate climate change. Geoderma 2004, 123, 1–22. [Google Scholar] [CrossRef]
- Barao, L.; Alaoui, A.; Ferreira, C.; Basch, G.; Schwilch, G.; Geissen, V.; Sukkel, W.; Lemesle, J.; Garcia-Orenes, F.; Morugan-Coronado, A.; et al. Assessment of promising agricultural management practices. Sci. Total Environ. 2019, 649, 610–619. [Google Scholar] [CrossRef]
- FAO; ITPS. Status of the World’s Soil Resources (SWSR)-Main Report; Food and Agriculture Organization of the United Nations: Rome, Italy; Intergovernmental Technical Panel on Soils: Rome, Italy, 2015. [Google Scholar]
- Stockdale, E.A.; Shepherd, M.A.; Fortune, S.; Cuttle, S.P. Soil fertility in organic farming systems-fundamentally different? Soil Use Manag. 2002, 18, 301–308. [Google Scholar] [CrossRef]
- A European Green Deal|Euopena Commission. Available online: https://ec.europa.eu/info/strategy/priorities-2019-2024/european-green-deal_en (accessed on 25 March 2021).
- Watson, C.A.; Atkinson, D.; Gosling, P.; Jackson, L.R.; Rayns, F.W. Managing soil fertility in organic farming systems. Soil Use Manag. 2002, 18, 239–247. [Google Scholar] [CrossRef]
- Monokrousos, N.; Papatheodorou, E.M.; Stamou, G.P. The response of soil biochemical variables to organic and conventional cultivation of Asparagus sp. Soil Biol. Biochem. 2008, 40, 198–206. [Google Scholar] [CrossRef]
- Lal, R. Challenges and opportunities in soil organic matter research. Eur. J. Soil Sci. 2009, 60, 158–169. [Google Scholar] [CrossRef]
- Tu, C.; Ristaino, J.B.; Hu, S.J. Soil microbial biomass and activity in organic tomato farming systems: Effects of organic inputs and straw mulching. Soil Biol. Biochem. 2006, 38, 247–255. [Google Scholar] [CrossRef]
- Six, J.; Paustian, K. Aggregate-associated soil organic matter as an ecosystem property and a measurement tool. Soil Biol. Biochem. 2014, 68, A4–A9. [Google Scholar] [CrossRef]
- Le Bissonnais, Y. Aggregate stability and assessment of soil crustability and erodibility: I. Theory and methodology. Eur. J. Soil Sci. 1996, 47, 425–437. [Google Scholar] [CrossRef]
- Dal Ferro, N.; Berti, A.; Francioso, O.; Ferrari, E.; Matthews, G.P.; Morari, F. Investigating the effects of wettability and pore size distribution on aggregate stability: The role of soil organic matter and the humic fraction. Eur. J. Soil Sci. 2012, 63, 152–164. [Google Scholar] [CrossRef]
- Bachmann, J.; Guggenberger, G.; Baumgartl, T.; Ellerbrock, R.H.; Urbanek, E.; Goebel, M.-O.; Kaiser, K.; Horn, R.; Fischer, W.R. Physical carbon-sequestration mechanisms under special consideration of soil wettability. J. Plant Nutr. Soil Sci. 2008, 171, 14–26. [Google Scholar] [CrossRef]
- Singh, G.; Bhattacharyya, R.; Das, T.K.; Sharma, A.R.; Ghosh, A.; Das, S.; Jha, P. Crop rotation and residue management effects on soil enzyme activities, glomalin and aggregate stability under zero tillage in the Indo-Gangetic Plains. Soil Tillage Res. 2018, 184, 291–300. [Google Scholar] [CrossRef]
- Renella, G.; Szukics, U.; Landi, L.; Nannipieri, P. Quantitative assessment of hydrolase production and persistence in soil. Biol. Fertil. Soils 2007, 44, 321–329. [Google Scholar] [CrossRef]
- Gil-Sotres, F.; Trasar-Cepeda, C.; Leiros, M.C.; Seoane, S. Different approaches to evaluating soil quality using biochemical properties. Soil Biol. Biochem. 2005, 37, 877–887. [Google Scholar] [CrossRef]
- Riffaldi, R.; Saviozzi, A.; Levi-Minzi, R.; Cardelli, R. Biochemical properties of a Mediterranean soil as affected by long-term crop management systems. Soil Tillage Res. 2002, 67, 109–114. [Google Scholar] [CrossRef]
- Marinari, S.; Mancinelli, R.; Carnpiglia, E.; Grego, S. Chemical and biological indicators of soil quality in organic and conventional farming systems in Central Italy. Ecol. Indic. 2006, 6, 701–711. [Google Scholar] [CrossRef]
- Grayston, S.J.; Wang, S.Q.; Campbell, C.D.; Edwards, A.C. Selective influence of plant species on microbial diversity in the rhizosphere. Soil Biol. Biochem. 1998, 30, 369–378. [Google Scholar] [CrossRef]
- Miller, H.J.; Henken, G.; Vanveen, J.A. Variation and composition of bacterial-populations in the rhizospheres of maize, wheat, and grass cultivars. Can. J. Microbiol. 1989, 35, 656–660. [Google Scholar] [CrossRef]
- Houlden, A.; Timms-Wilson, T.M.; Day, M.J.; Bailey, M.J. Influence of plant developmental stage on microbial community structure and activity in the rhizosphere of three field crops. FEMS Microbiol. Ecol. 2008, 65, 193–201. [Google Scholar] [CrossRef]
- Bünemann, E.K.; Bongiorno, G.; Bai, Z.; Creamer, R.E.; De Deyn, G.; de Goede, R.; Fleskens, L.; Geissen, V.; Kuyper, T.W.; Mäder, P.; et al. Soil quality-A critical review. Soil Biol. Bio-Chem. 2018, 120, 105–125. [Google Scholar] [CrossRef]
- Barbi, A.; Cagnati, A.; Cola, G.; Checchetto, F.; Chiaudani, A.; Crepaz, A.; Delillo, I.; Mariani, L.; Marigo, G.; Meneghin, P.; et al. Atlante Climatico del Veneto; Regione del Veneto: Mestre, Italy, 2013. [Google Scholar]
- IUSS Working Group WRB. World Reference Base for Soil Resources 2014, Update 2015 International Soil Classification System for Naming Soils and Creating Legends for Soil Maps; World Soil Resources Reports No. 106; FAO: Rome, Italy, 2015. [Google Scholar]
- Sibbesen, E.; Skjøth, F.; Rubæk, G.H. Tillage caused dispersion of phosphorus and soil in four 16-year old field experiments. Soil Tillage Res. 2000, 54, 91–100. [Google Scholar] [CrossRef]
- Grossman, R.B.; Reinsch, T.G. Bulk Density and Linear Extensibility. In Methods of Soil Analysis: Physical Methods, Part 4; Dane, J.H., Topp, G.C., Eds.; Soil Science Society of America: Madison, WI, USA, 2002; pp. 201–228. [Google Scholar]
- Sitzia, T.; Pizzeghello, D.; Dainese, M.; Ertani, A.; Carletti, P.; Semenzato, P.; Nardi, S.; Cattaneo, D. Topsoil organic matter properties in contrasted hedgerow vegetation types. Plant Soil 2014. [Google Scholar] [CrossRef]
- Sumner, M.; Miller, W. Cation exchange capacity, and exchange coefficients. In Methods of soil Analysis. Part 2: Chemical Properties, 3rd ed.; Sparks, D., Ed.; Soil Science Society of America: Madison, WI, USA, 1996; pp. 1201–1229. [Google Scholar]
- Olsen, S.; Sommers, L.E. Phosphorus. In Methods of Soil Analysis. Part 2; Page, A., Miller, R., Keeney, D., Eds.; American Society of Agronomy: Madison, WI, USA, 1982; pp. 421–422. [Google Scholar]
- FAO. Standard operating procedure for soil calcium carbonate equivalent. In Volumetric Calcimeter Method; FAO: Rome, Italy, 2020. [Google Scholar]
- Walkley, A.; Black, I.A. An examination of Degtjareff method for determining soil organic matter and a proposed modification of the chromic acid titration method. Soil Sci. 1934, 37, 29–38. [Google Scholar] [CrossRef]
- USDA-NRCS United States. Department of Agriculture-Natural Resources Conservation Service, Soil Survey Laboratory Methods Manual; Version No. 4.0; Soil Survey Investigations Report No. 42 (2004); USDA-NRCS: Lincoln, NE, USA, 2004.
- Cardinali, A.; Carletti, P.; Nardi, S.; Zanin, G. Design of riparian buffer strips affects soil quality parameters. Appl. Soil Ecol. 2014, 80, 67–76. [Google Scholar] [CrossRef]
- Kandeler, E.; Gerber, H. Short-term assay of soil urease activity using colorimetric determination of ammonium. Biol. Fertil. Soils 1988, 6, 68–72. [Google Scholar] [CrossRef]
- Nannipieri, P.; Kandeler, E.; Ruggiero, P. Enzyme activities and microbiological and biochemical processes in soil. In Enzymes in the Environment; Burns, R.G., Dick, R.P., Eds.; Marcel Dekker: New York, NY, USA, 2002; pp. 1–34. [Google Scholar]
- Masciandaro, G.; Ceccanti, B.; Ronchi, V.; Bauer, C. Kinetic parameters of dehydrogenase in the assessment of the response of soil to vermicompost and inorganic fertilisers. Biol. Fertil. Soils 2000, 32, 479–483. [Google Scholar] [CrossRef]
- Browman, M.G.; Tabatabai, M.A. Phosphodiesterase Activity of Soils. Soil Sci. Soc. Am. J. 1978, 42, 284–290. [Google Scholar] [CrossRef]
- Eivazi, F.; Tabatabai, M.A. Glucosidases and galactosidases in soils. Soil Biol. Biochem. 1988, 20, 601–606. [Google Scholar] [CrossRef]
- Adam, G.; Duncan, H. Development of a sensitive and rapid method for the measurement of total microbial activity using fluorescein diacetate (FDA) in a range of soils. Soil Biol. Biochem. 2001, 33, 943–951. [Google Scholar] [CrossRef]
- Douglas, J.T.; Goss, M.J. Stability and organic matter content of surface soil aggregates under different methods of cultivation and in grassland. Soil Tillage Res. 1982, 2, 155–175. [Google Scholar] [CrossRef]
- Bocchi, S.; Confalonieri, R.; Frigeni, S.; Morari, F.; Patruno, A. Wet Aggregate Stability Index: Precision assessment of Tiulin method through an inter-laboratory test. Agrochimica 2008, 52, 71–82. [Google Scholar]
- Henin, S.; Monnier, G.; Combeau, A. Methode pour l’etude de la stabilitè structurale des sols. Ann. Agron. 1958, 9, 73–92. [Google Scholar]
- Field, A. Discovering Statistics Using SPSS, 2nd ed.; SAGE Publications Ltd.: London, UK, 2005. [Google Scholar]
- Dal Ferro, N.; Quinn, C.; Morari, F. A Bayesian belief network framework to predict SOC dynamics of alternative management scenarios. Soil Tillage Res. 2018, 179, 114–124. [Google Scholar] [CrossRef]
- Camarotto, C.; Piccoli, I.; Dal Ferro, N.; Polese, R.; Chiarini, F.; Furlan, L.; Morari, F. Have we reached the turning point? Looking for evidence of SOC increase under conservation agriculture and cover crop practices. Eur. J. Soil Sci. 2020. [Google Scholar] [CrossRef]
- Dal Ferro, N.; Piccoli, I.; Berti, A.; Polese, R.; Morari, F. Organic carbon storage potential in deep agricultural soil layers: Evidence from long-term experiments in northeast Italy. Agric. Ecosyst. Environ. 2020, 300, 106967. [Google Scholar] [CrossRef]
- Koch, H.-J.; Stockfisch, N. Loss of soil organic matter upon ploughing under a loess soil after several years of conservation tillage. Soil Tillage Res. 2006, 86, 73–83. [Google Scholar] [CrossRef]
- VandenBygaart, A.J.; Kay, B.D. Persistence of Soil Organic Carbon after Plowing a Long-Term No-Till Field in Southern Ontario, Canada. Soil Sci. Soc. Am. J. 2004, 68, 1394–1402. [Google Scholar] [CrossRef]
- Six, J.; Conant, R.T.; Paul, E.A.; Paustian, K. Stabilization mechanisms of soil organic matter: Implications for C-saturation of soils. Plant Soil 2002, 241, 155–176. [Google Scholar] [CrossRef]
- An, S.; Mentler, A.; Mayer, H.; Blum, W.E.H. Soil aggregation, aggregate stability, organic carbon and nitrogen in different soil aggregate fractions under forest and shrub vegetation on the Loess Plateau, China. CATENA 2010, 81, 226–233. [Google Scholar] [CrossRef]
- Le Bissonnais, Y.; Arrouays, D. Aggregate stability and assessment of soil crustability and erodibility: II. Application to humic loamy soils with various organic carbon contents. Eur. J. Soil Sci. 1997, 48, 39–48. [Google Scholar] [CrossRef]
- Piccoli, I.; Camarotto, C.; Lazzaro, B.; Furlan, L.; Morari, F. Conservation Agriculture Had a Poor Impact on the Soil Porosity of Veneto Low-lying Plain Silty Soils after a 5-year Transition Period. Land Degrad. Dev. 2017, 28, 2039–2050. [Google Scholar] [CrossRef]
- Patle, P.N.; Navnage, N.P.; Barange, P.K. Fluorescein Diacetate (FDA): Measure of Total Microbial Activity and as Indicator of Soil Quality. Int. J. Curr. Microbiol. Appl. Sci. 2018, 7, 2103–2107. [Google Scholar] [CrossRef]
- Lupwayi, N.Z.; Larney, F.J.; Blackshaw, R.E.; Kanashiro, D.A.; Pearson, D.C. Phospholipid fatty acid biomarkers show positive soil microbial community responses to conservation soil management of irrigated crop rotations. Soil Tillage Res. 2017, 168, 1–10. [Google Scholar] [CrossRef]
- Muscolo, A.; Settineri, G.; Attinà, E. Early warning indicators of changes in soil ecosystem functioning. Ecol. Indic. 2015, 48, 542–549. [Google Scholar] [CrossRef]
- Weerasekara, C.S.; Udawatta, R.P.; Gantzer, C.J.; Kremer, R.J.; Jose, S.; Veum, K.S. Effects of Cover Crops on Soil Quality: Selected Chemical and Biological Parameters. Commun. Soil Sci. Plant. Anal. 2017, 48, 2074–2082. [Google Scholar] [CrossRef]
- Lange, M.; Eisenhauer, N.; Sierra, C.A.; Bessler, H.; Engels, C.; Griffiths, R.I.; Mellado-Vazquez, P.G.; Malik, A.A.; Roy, J.; Scheu, S.; et al. Plant diversity increases soil microbial activity and soil carbon storage. Nat. Commun. 2015, 6, 6707. [Google Scholar] [CrossRef]
- Chu, H.; Lin, X.; Fujii, T.; Morimoto, S.; Yagi, K.; Hu, J.; Zhang, J. Soil microbial biomass, dehydrogenase activity, bacterial community structure in response to long-term fertilizer management. Soil Biol. Biochem. 2007, 39, 2971–2976. [Google Scholar] [CrossRef]
- Garcia, C.; Hernandez, T.; Costa, F. Potential use of dehydrogenase activity as an index of microbial activity in degraded soils. Commun. Soil Sci. Plant. Anal. 1997, 28, 123–134. [Google Scholar] [CrossRef]
- Nannipieri, P.; Giagnoni, L.; Landi, L.; Renella, G. Role of Phosphatase Enzymes in Soil. In Phosphorus in Action; Springer: Berlin/Heidelberg, Germany, 2011; pp. 215–243. [Google Scholar] [CrossRef]
- Deng, S.P.; Tabatabai, M.A. Effect of tillage and residue management on enzyme activities in soils. 3. Phosphatases and arylsulfatase. Biol. Fertil. Soils 1997, 24, 141–146. [Google Scholar] [CrossRef]
- Liu, S.; Liu, S.; Zhang, Z.; Wei, H.; Qi, J.; Duan, J. Influence of garlic continuous cropping on rhizosphere soil microorganisms and enzyme activities. Sci. Agric. Sin. 2010, 43, 1000–1006. [Google Scholar]
- Zhou, X.; Yu, G.; Wu, F. Effects of intercropping cucumber with onion or garlic on soil enzyme activities, microbial communities and cucumber yield. Eur. J. Soil Biol. 2011, 47, 279–287. [Google Scholar] [CrossRef]
- Wang, M.; Wu, C.; Cheng, Z.; Meng, H.; Zhang, M.; Zhang, H. Soil chemical property changes in eggplant/garlic relay intercropping systems under continuous cropping. PLoS ONE 2014, 9, e111040. [Google Scholar] [CrossRef]
- Yang, R.; Mo, Y.; Liu, C.; Wang, Y.; Ma, J.; Zhang, Y.; Li, H.; Zhang, X. The Effects of Cattle Manure and Garlic Rotation on Soil under Continuous Cropping of Watermelon (Citrullus lanatus L.). PLoS ONE 2016, 11, e0156515. [Google Scholar] [CrossRef]
- Izaguirre-Mayoral, M.L.; Flores, S.; Carballo, O. Determination of acid phosphatase and dehydrogenase activities in the rhizosphere of nodulated legume species native to two contrasting savanna sites in Venezuela. Biol. Fertil. Soils 2002, 35, 470–472. [Google Scholar] [CrossRef]
- Kandeler, E.; Marschner, P.; Tscherko, D.; Gahoonia, T.S.; Nielsen, N.E. Microbial community composition and functional diversity in the rhizosphere of maize. Plant. Soil 2002, 238, 301–312. [Google Scholar] [CrossRef]
- Geisseler, D.; Horwath, W. Regulation of extracellular protease activity in soil in response to different sources and concentrations of nitrogen and carbon. Soil Biol. Biochem. 2008, 40, 3040–3048. [Google Scholar] [CrossRef]
- Deng, S.P.; Tabatabai, M.A. Effect of tillage and residue management on enzyme activities in soils. 1. Amidohydrolases. Biol. Fertil. Soils 1996, 22, 202–207. [Google Scholar] [CrossRef]
- Tully, K.L.; McAskill, C. Promoting soil health in organically managed systems: A review. Org. Agric. 2020, 10, 339–358. [Google Scholar] [CrossRef]
- Renella, G.; Egamberdiyeva, D.; Landi, L.; Mench, M.; Nannipieri, P. Microbial activity and hydrolase activities during decomposition of root exudates released by an artificial root surface in Cd-contaminated soils. Soil Biol. Biochem. 2006, 38, 702–708. [Google Scholar] [CrossRef]
- Renella, G.; Landi, L.; Valori, F.; Nannipieri, P. Microbial and hydrolase activity after release of low molecular weight organic compounds by a model root surface in a clayey and a sandy soil. Appl. Soil Ecol. 2007, 36, 124–129. [Google Scholar] [CrossRef]

Publisher’s Note: MDPI stays neutral with regard to jurisdictional claims in published maps and institutional affiliations. |
© 2021 by the authors. Licensee MDPI, Basel, Switzerland. This article is an open access article distributed under the terms and conditions of the Creative Commons Attribution (CC BY) license (https://creativecommons.org/licenses/by/4.0/).