Article

Winter Wheat Resistant to Increases in Rain and Snow Intensity in a Semi-Arid System

Department of Wildland Resources and the Ecology Center, Utah State University, Logan, UT 84322-5230, USA
*
Author to whom correspondence should be addressed.
Agronomy 2021, 11(4), 751; https://doi.org/10.3390/agronomy11040751
Submission received: 16 March 2021 / Revised: 3 April 2021 / Accepted: 5 April 2021 / Published: 12 April 2021

Abstract

:
As the atmosphere warms, precipitation events have been predicted and observed to become fewer and larger. Changes in precipitation patterns can have large effects on dryland agricultural production, but experimental tests on the effects of changing precipitation intensity are limited. Over 3 years, we tested the effects of increased precipitation intensity on winter wheat (Triticum aestivum L.; Promontory variety) in a temperate dryland agricultural system that was on a rotation of crop and fallow years. We used 11 (2.1 × 2.5 m) shelters to collect and redeposit rain and snow as larger, more intense events. Total precipitation was the same in all plots, but event sizes in each plot varied from 1 to 18 mm. Treatments increased soil water availability, but winter wheat biomass and grain yield did not differ among treatments. Similarly, other measured plant growth responses, including vegetation greenness, leaf area index, canopy temperature, photochemical efficiency, root area, and new root growth, did not differ among treatments. Results indicate that at least in the semiarid climate and silt loam soils studied here, anticipated increases in precipitation intensity are unlikely to affect winter wheat production negatively. Further, increased precipitation intensity may mitigate water stress caused by increasing temperatures and encourage the use of wheat varieties that utilize deeper, later season soil water.

1. Introduction

Globally, rainfed agriculture accounts for 80% of cultivated land and 60% of food production [1]. Because this type of agriculture is not subsidized by irrigation, it is sensitive to climate change, particularly in arid and semi-arid climates [2,3]. While the effects of warming and changes in the amount of precipitation have been widely studied, a less well-understood aspect of climate change is increasing precipitation intensity. As the atmosphere warms, precipitation events are predicted and have been observed to become fewer and larger [4,5]. Fewer, larger precipitation events are likely to change how water moves through the soils and, therefore, are likely to affect plant growth in agricultural, and particularly rainfed, systems [6,7,8].
How larger precipitation events impact plant growth depends on what happens to the rainfall, which is a function of the biotic and abiotic conditions of the system. For example, larger precipitation events may decrease interception and increase percolation [9,10]. Deeper water percolation may especially benefit deep-rooted plants [11]. In natural grasslands, increased precipitation intensity has tended to increase plant growth in arid, semi-arid, and sandy systems and decrease plant growth in mesic systems [6,12,13,14,15]. Agricultural systems may be more likely to respond negatively to increased precipitation intensity due to increased overland flow or percolation below the often shallow rooting zones.
To limit vulnerability, dryland crop producers select crops and varieties for climate-resistant traits, such as optimized water uptake, high water-use efficiency through conservative water use, and drought escape (e.g., early maturity) [3,16]. However, both observational and modeling studies have reported a wide range of crop responses to precipitation intensity, from positive to negative [8,17,18,19]. Thus, uncertainty remains regarding how crops, especially those dependent on natural rainfall, will respond to altered precipitation regimes [20,21]. Because it is reasonable to expect both positive and negative responses, there is a need for experimentation to better constrain the conditions under which increasing precipitation intensity will increase or decrease crop productivity.
Wheat is the third most produced crop in the world, after maize and rice [22]. In the United States, wheat is the most widely grown cereal crop, a large proportion (70%–80%) of which is winter wheat (Triticum aestivum L.), and winter wheat is primarily grown under rainfed conditions [23,24]. Winter wheat is well suited for water-limited systems because it is planted in the fall, allowing it to develop earlier in the growing season and avoid midsummer droughts [25]. Observational studies suggest that winter wheat tends to be more resistant to changes in climate than other crops, including being resistant to increases in precipitation intensity [18,26]. Rezaei et al. [27] reported that winter wheat growth shifted 2 weeks earlier over the past half century, allowing yields to be unaffected by increasing summer temperatures. However, winter wheat can be sensitive to water stress that occurs early in the growing season, for example, during flowering [28].
While valuable, observational studies that link climate to crop yield often suffer from strong correlations between climate variables, which makes evaluating the impacts of individual variables difficult [29,30]. Experiments measuring the effects of increased precipitation intensity on winter wheat have found neutral [31] and negative [32] responses. Studies of other crops, using experimental manipulations of precipitation intensity, have also found limited crop responses [33,34,35]. However, these experiments were conducted in relatively mesic sites in Europe, making it unclear whether the results generalize to winter wheat grown in more arid climates.
Experiments can help provide estimates of the effects of individual climate variables and improve our mechanistic understanding of the impacts of climate change on crops. Our objective was to measure winter wheat responses to increasing precipitation intensity in a semi-arid dryland system in northern Utah, USA, to isolate the effect of one aspect of climate change on a dryland crop. We established plots of winter wheat that received fewer, larger precipitation events while maintaining the same total precipitation. We measured soil moisture and above- and belowground winter wheat growth responses to treatments during 2 years separated by a fallow year.

2. Materials and Methods

2.1. Site Description

The experiment was conducted at the Emily Godfrey Fonnesbeck Research Farm in Clarkston, Utah, USA (41°53′44″ N; 112°2′39″ W; elevation: 1485 m) in an area that was naturally a shrub-steppe ecosystem. The mean annual precipitation in the area is 461 mm, with 36% falling as snow [36]. Winter wheat was grown in plots in 2017 and 2019, and both years were wetter than average (636 and 586 mm, respectively; Figure 1). The mean temperatures in 2017 (9.6 °C) and 2019 (8.9 °C) were near the historical mean annual temperature of 9.2 °C (Figure 1). The soils are deep, well-drained silt loams in the Mendon series [37], and contain 23% sand, 62% silt, and 15% clay. In shallow (0–30 cm) soils, the organic matter is 20 g kg−1, pH is 7.2, the phosphorous concentrations are 0.5–3.9 mg kg−1, and the potassium concentrations are 311–431 mg kg−1 [38]. The area in which the plots were located was in a crop rotation consisting of alternating years of winter wheat and fallow during the experiment. We planted the Promontory variety, a high-yielding hard red winter wheat [39]. This early-maturing variety was developed for dryland crop production in a crop fallow system in low-rainfall areas of Utah and southern Idaho, USA; it maintains good test weight under lower-than-average moisture conditions and has resistance to dwarf bunt ([39,40]; D. Hole, pers. comm.).

2.2. Experimental Design

The experimental design generally followed that of Holdrege et al. [10]. Broadly, precipitation was collected and redeposited as larger events of fixed sizes (i.e., 1 to 18 mm) so that all plots received the same total amount of precipitation, but that precipitation was deposited as either many small or few large events.
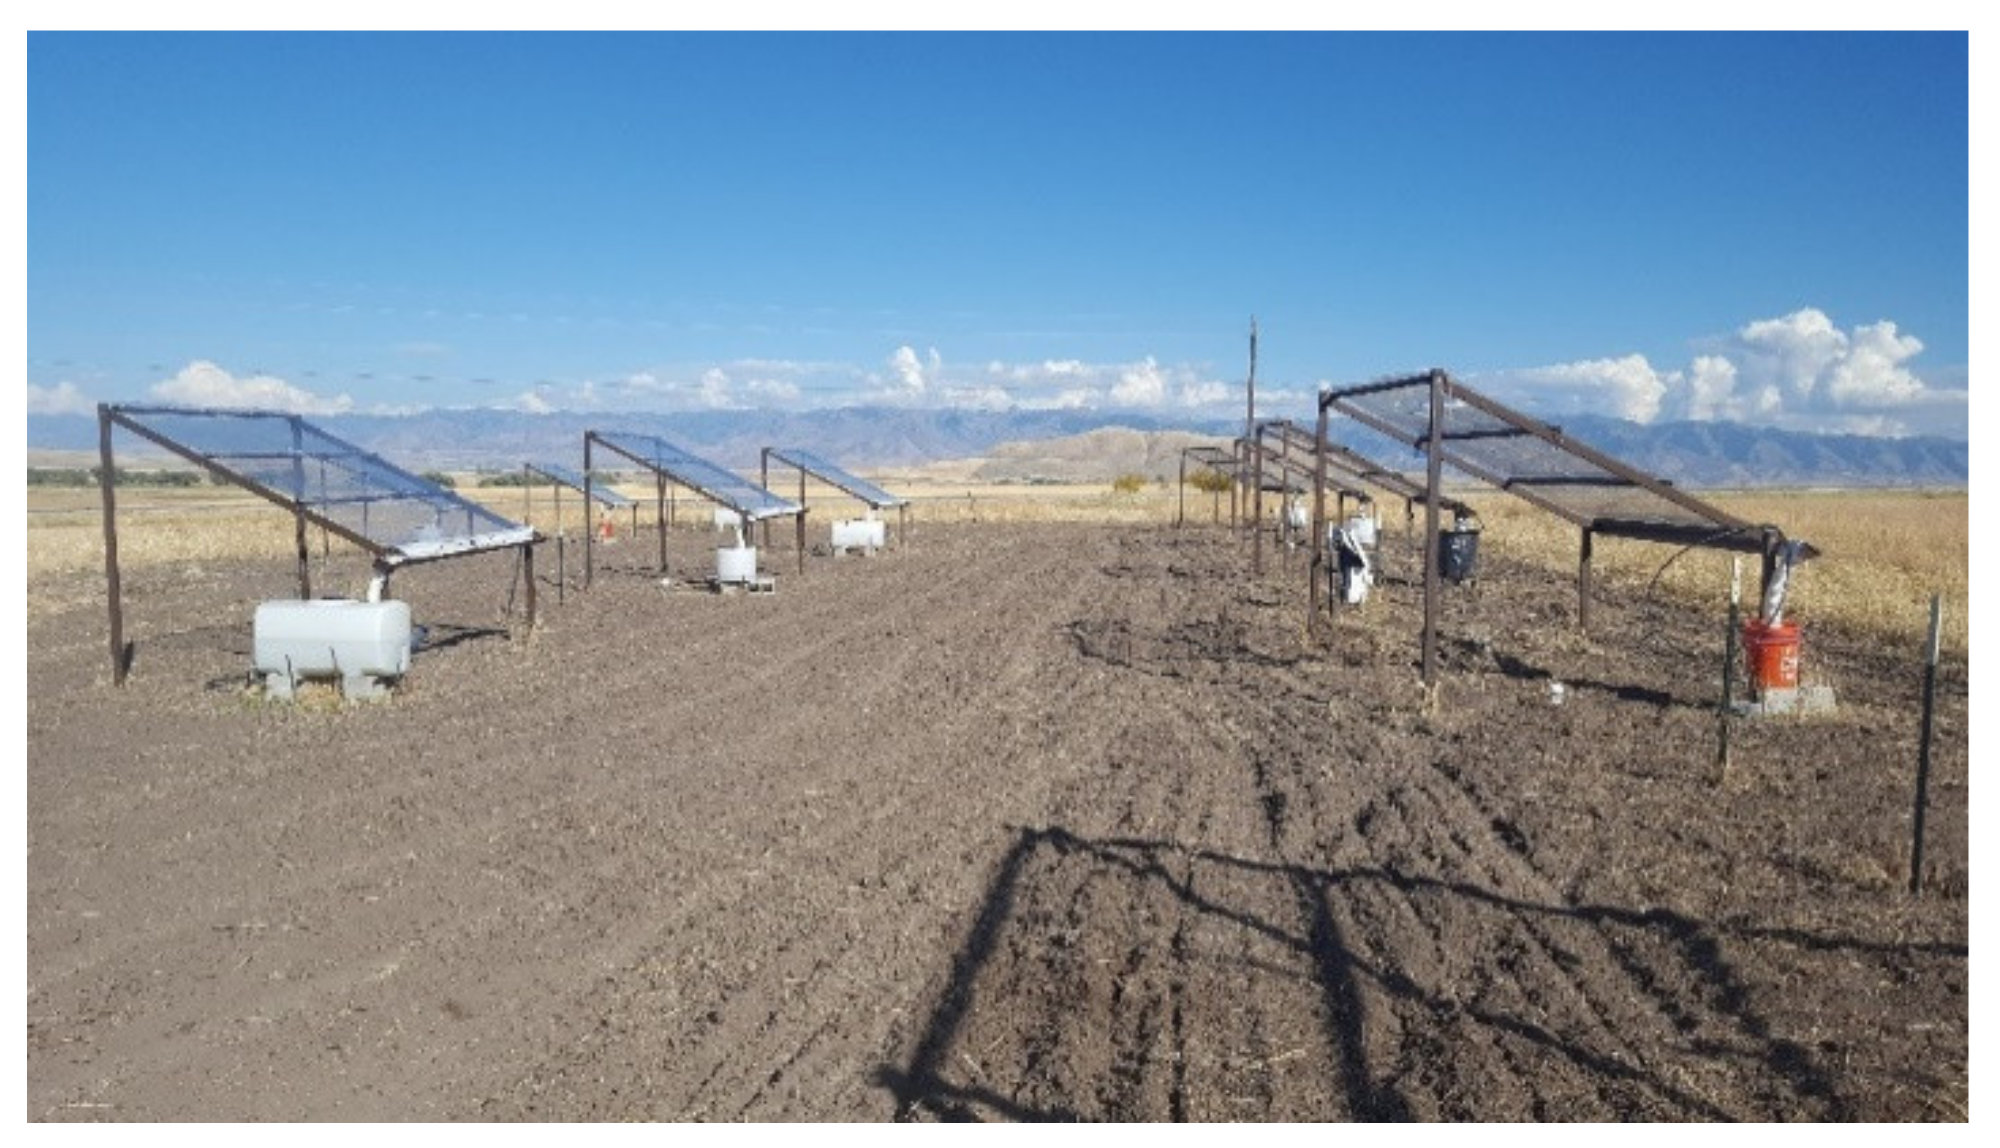
In May 2015, 14 plots were established 6 m apart in three rows in a 50 × 90 m area on a low-angle slope (1° slope). Three plots were shelter-free controls and used to determine shelter effects (Appendix A; Figures S1 and S2; Table S1). The remaining 11 plots were covered with 2.1 × 2.5 × 1.9 m (w × l × h) rainout shelters beginning April 2016 (Figure 2). A clear acrylic (5.1 mm thick, 92% light transmittance) roof covered each plot. Rainwater from each roof was collected in a water tank adjacent to the shelter. The tanks ranged from 75 to 380 L depending on the treatment size. Tethered floating outlets were installed in the water tanks so that once water accumulated to the desired level for the treatment, the outlet sank, causing the tank to drain [41]. The tanks drained into 12 drip nozzles via drip irrigation tubing that was fixed to the ground.
To allow regression analyses, seven plots were assigned to different treatment levels (representing precipitation event sizes ranging from 1 to 18 mm [9]; Table 1). Two additional replicate plots (for a total of three plots) were assigned to each of two treatment levels (sheltered-control plots, in which precipitation was immediately redeposited onto plots, and “4 mm” plots, which had 4 mm minimum precipitation event sizes; described below). To increase the sample size, analyses were also performed on data split into high- and low-precipitation intensity categories (Table 1).
Precipitation event sizes (i.e., treatments) were selected to reflect changes in precipitation intensity anticipated with temperature changes from −1 to +10 °C relative to current temperatures. Consistent with the Clausius–Clapeyron relation, precipitation event sizes were designed to increase by 7% per 1 °C of warming [10,42]. This method resulted in rain event sizes of 2, 3, 4, 8, and 18 mm for hypothetical temperature increases of 1, 2, 3, 5, and 10 °C (Table 1; Figure S3; see Appendix B for additional details). Rainfall intensity was manipulated from April to November in 2016–2018 and April to August in 2019. To further expand our inference, one treatment designed to reflect precipitation intensity associated with a −1 °C temperature change was added. In this treatment, irrigation was triggered manually approximately monthly during the growing season, depositing additional 1 mm events (hereafter referred to as the 1 mm treatment). All treatments received the same total precipitation and only differed in event size and frequency. The seasonality of precipitation was not manipulated.
To provide an example of how precipitation treatments functioned, assume that there was a natural 2 mm rain event one day, followed by a 6 mm event on a day the next week, and that the tanks all started empty, as was the case at the beginning of the experiment. The 2 mm of rain would be diverted from the shelter roofs into the tanks and be redeposited onto the 1 mm, control, and 2 mm treatment plots. In the other treatments, the water would be stored in the tank and not redeposited. When the following 6 mm precipitation event occurred, the 1 mm, control, 2 mm, and 3 mm treatments would all receive 6 mm of water. The 8 mm treatment plot would receive 8 mm of water (6 mm from this storm plus 2 mm from the previous storm). The 18 mm treatment would still receive no precipitation (it would require another 10 mm of rainfall to occur for water to be redeposited).
As with rainfall, snowfall manipulations were used to create fewer, larger snowfall events while holding the total snowfall on the plots constant. Snow treatments were applied from late December to early March such that the plots received the historical mean snow water equivalent for that period. Snow addition frequencies were calculated using historical data (1928–2014) of snow events >4 cm from those winter months [36]. A 7% change in event size for each 1 °C was estimated to result in a median of 9, 8, 7, 6, 5, 4, and 2 snow events per season for the 1 mm, control, 2 mm, 3 mm, 4 mm, 8 mm, and 18 mm treatments. Therefore, during the 2016/17 and 2018/19 winters, snow that was collected off of the shelters was added back to the plots across nine, eight, seven, six, five, four, and two shoveling events for the respective treatments.
The plots were seeded with winter wheat on 30 September 2016 and 15 October 2018 and were hand-harvested on 28 July 2017 and 3 August 2019, respectively. The plots were tilled to a depth of 13 cm before planting and seeded at a rate of 12.5 g m−2 with a row spacing of 15 cm. On the same schedule, the area between the plots was also tilled and planted at that rate to maintain similar environmental conditions around the plots. The fallow periods were from August 2015 to September 2016 and August 2017 to October 2018. Reflecting weed-suppression practices, Roundup PowerMAX (48.7% glyphosate; Bayer, Research Triangle Park, NC, USA) was applied in the spring of 2016 and 2018 (1.2 L ha−1 application rate). No fertilizer was applied to the plots during the experiment.

2.3. Treatment Responses

Volumetric water content was measured twice each month during the growing season using a capacitance sensor in an access tube in each plot (Diviner 2000, Sentek Pty Inc., Stepney, Australia). Additionally, hourly measurements of soil water potential were taken at six depths in one sheltered-control plot and one 4 mm treatment plot beginning in October 2015 (229L heat dissipation sensors, Campbell Scientific, Logan, UT, USA).
Several nondestructive measurements were made roughly two times per month during the growing season to assess plant growth over time. Vegetation “greenness” was measured using the normalized difference vegetation index (NDVI; SRS-NDVI Sensor, Meter Group, Inc., Pullman, WA, USA). Plant leaf area was estimated using the leaf area index (LAI; ACCUPAR LP–80, Meter Group, Inc., Pullman, WA, USA). Plant carotenoid content was used as an indicator of photosynthetic efficiency and measured using the photochemical reflectance index (PRI; SRS-PRI Sensor, Meter Group, Inc., Pullman, WA, USA; [43]). Canopy temperature was measured as an indicator of water stress (SI-111 infrared radiometer, Apogee Instruments, Logan, UT, USA). The infrared radiometer (which also contained an air temperature sensor) was mounted at a height of 1 m and faced downward at a 45° angle so that vegetation limited the sensor’s view of bare ground. The difference between the canopy temperature and the air temperature (Tc − Ta) was used as a relative index of plant water stress. This value increases when crops experience water stress because leaves become warmer when transpiration is reduced [44]. Measurements of the NDVI (sensor field of view, 1.75 m2), PRI (field of view, 1.75 m2), and canopy temperature (field of view, 1.1 m2) were made from two fixed locations in each plot, and the LAI was measured in eight fixed locations. The plot-level averages of these values were used in the analyses.
At the end of the growing season, mean canopy height was measured in four 30 cm radius circles in each plot. Then, all aboveground vegetation (both wheat and weeds) from the plots was harvested. Wheat from a 1 × 1 m subplot in the plot center was weighed wet and then threshed to measure grain yield. The dry weight of the wheat plants from this center subplot was not measured because the plants could not be oven-dried before threshing; however, it was estimated using a wet-to-dry weight conversion from wheat in the remainder of the plot. To derive biomass measurements, collected plant material was oven-dried at 60 °C to constant weight and weighed.
To measure root responses, one 2 m long by 5 cm wide acrylic plastic tube was installed at a 30° angle in each plot. A video microscope camera was used to capture images every 5.2 cm down one side of the tube (Bartz Technology Co., Carpinteria, CA, USA). Images were collected twice monthly from May to July in 2016 and 2018. Rootfly software (version 2.0.2, Wells and Birchfield, Clemson University, SC, USA) was used to measure root length and width and the number of new roots in the images. Root data were binned into 10 cm vertical increments (0–10, 10–20, 20–30, 30–40, 40–50, 50–60).

2.4. Analysis

Linear mixed-effects models were used to analyze aboveground biomass, grain yield, and wheat height data (“lme4” package [45]). The predictor variables were treatment (i.e., mean precipitation event size, a continuous variable), year (discrete variable), and treatment × year interaction. The plot was treated as a random effect. In cases where no significant treatment × year interaction was detected, models were rerun without the interaction term, and those results were reported.
Soil water potential, NDVI, LAI, PRI, radiometer, root area, and new root growth were analyzed using generalized additive mixed models (GAMMs) so nonlinear responses to date (soil water potential, NDVI, PRI, LAI, Tc − Ta) or depth (root data) could be modeled (“mgcv” package [46]). For each dataset and year, three GAMMs were fit that contained the fixed effect of either time or depth: (1) a null model where a single spline was fit to depth or time (no treatments distinguished), (2) a model that grouped treatments into two levels: low intensity (1 mm, control, 2 mm, and 3 mm treatments: six plots in total) and high intensity (4 mm, 8 mm, and 18 mm treatments: five plots in total), and (3) a model that separated all treatments. All GAMMs treated the plot as a random effect, and covariance among repeated measurements within plots was modeled using a first-order autoregressive structure.
For regression models, variables were considered significant if p < 0.05, and for GAMMs, top models were those with the lowest Akaike’s information criterion (AIC), and models were considered similar if ∆AIC < 2 [47]. All analyses were conducted using R version 3.6.2 [48].

3. Results

3.1. Soil Moisture Effects

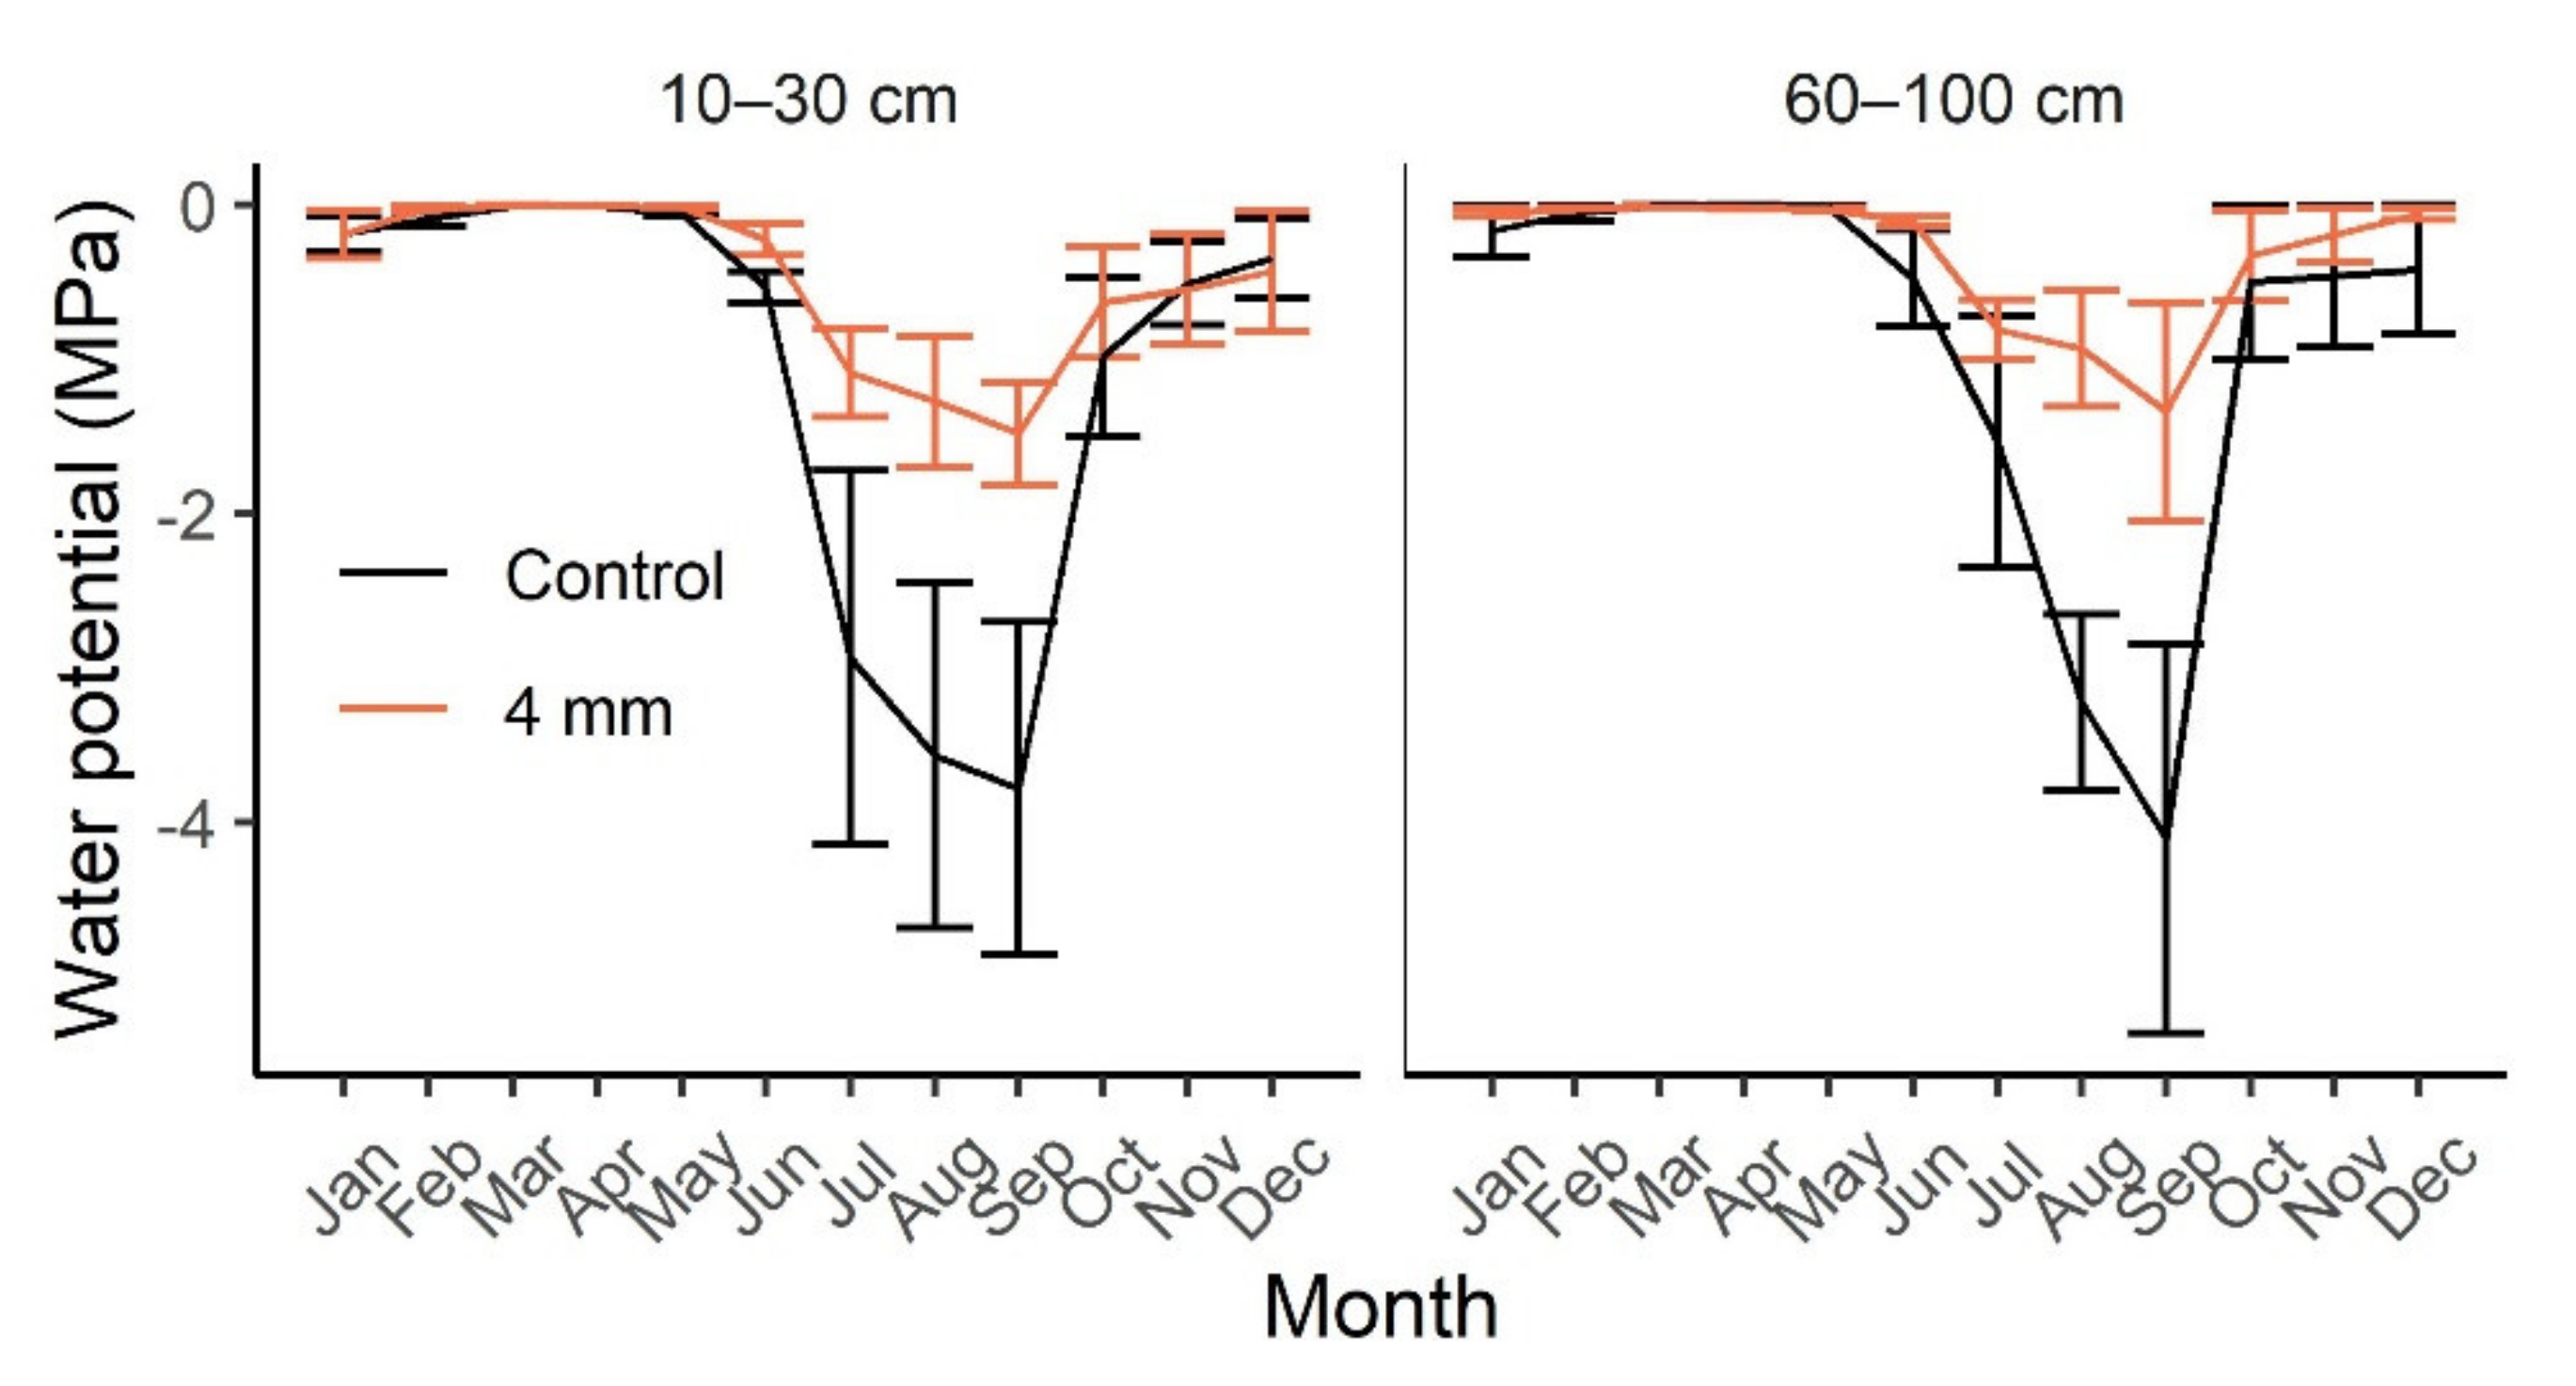
During the summer, the mean monthly soil water potential was lower in the control plot than the 4 mm plot (Figure 3 and Figure S4; Table S2). These differences in water potential were greatest from July through September and translate to 0.020 and 0.019 cm cm−1 more volumetric soil water in treated than in control plots during those months in shallow and deep soils, respectively. However, volumetric water content, which was measured less-frequently, but in every plot, did not show a treatment effect (Figure S5; Table S3).

3.2. Biotic Effects

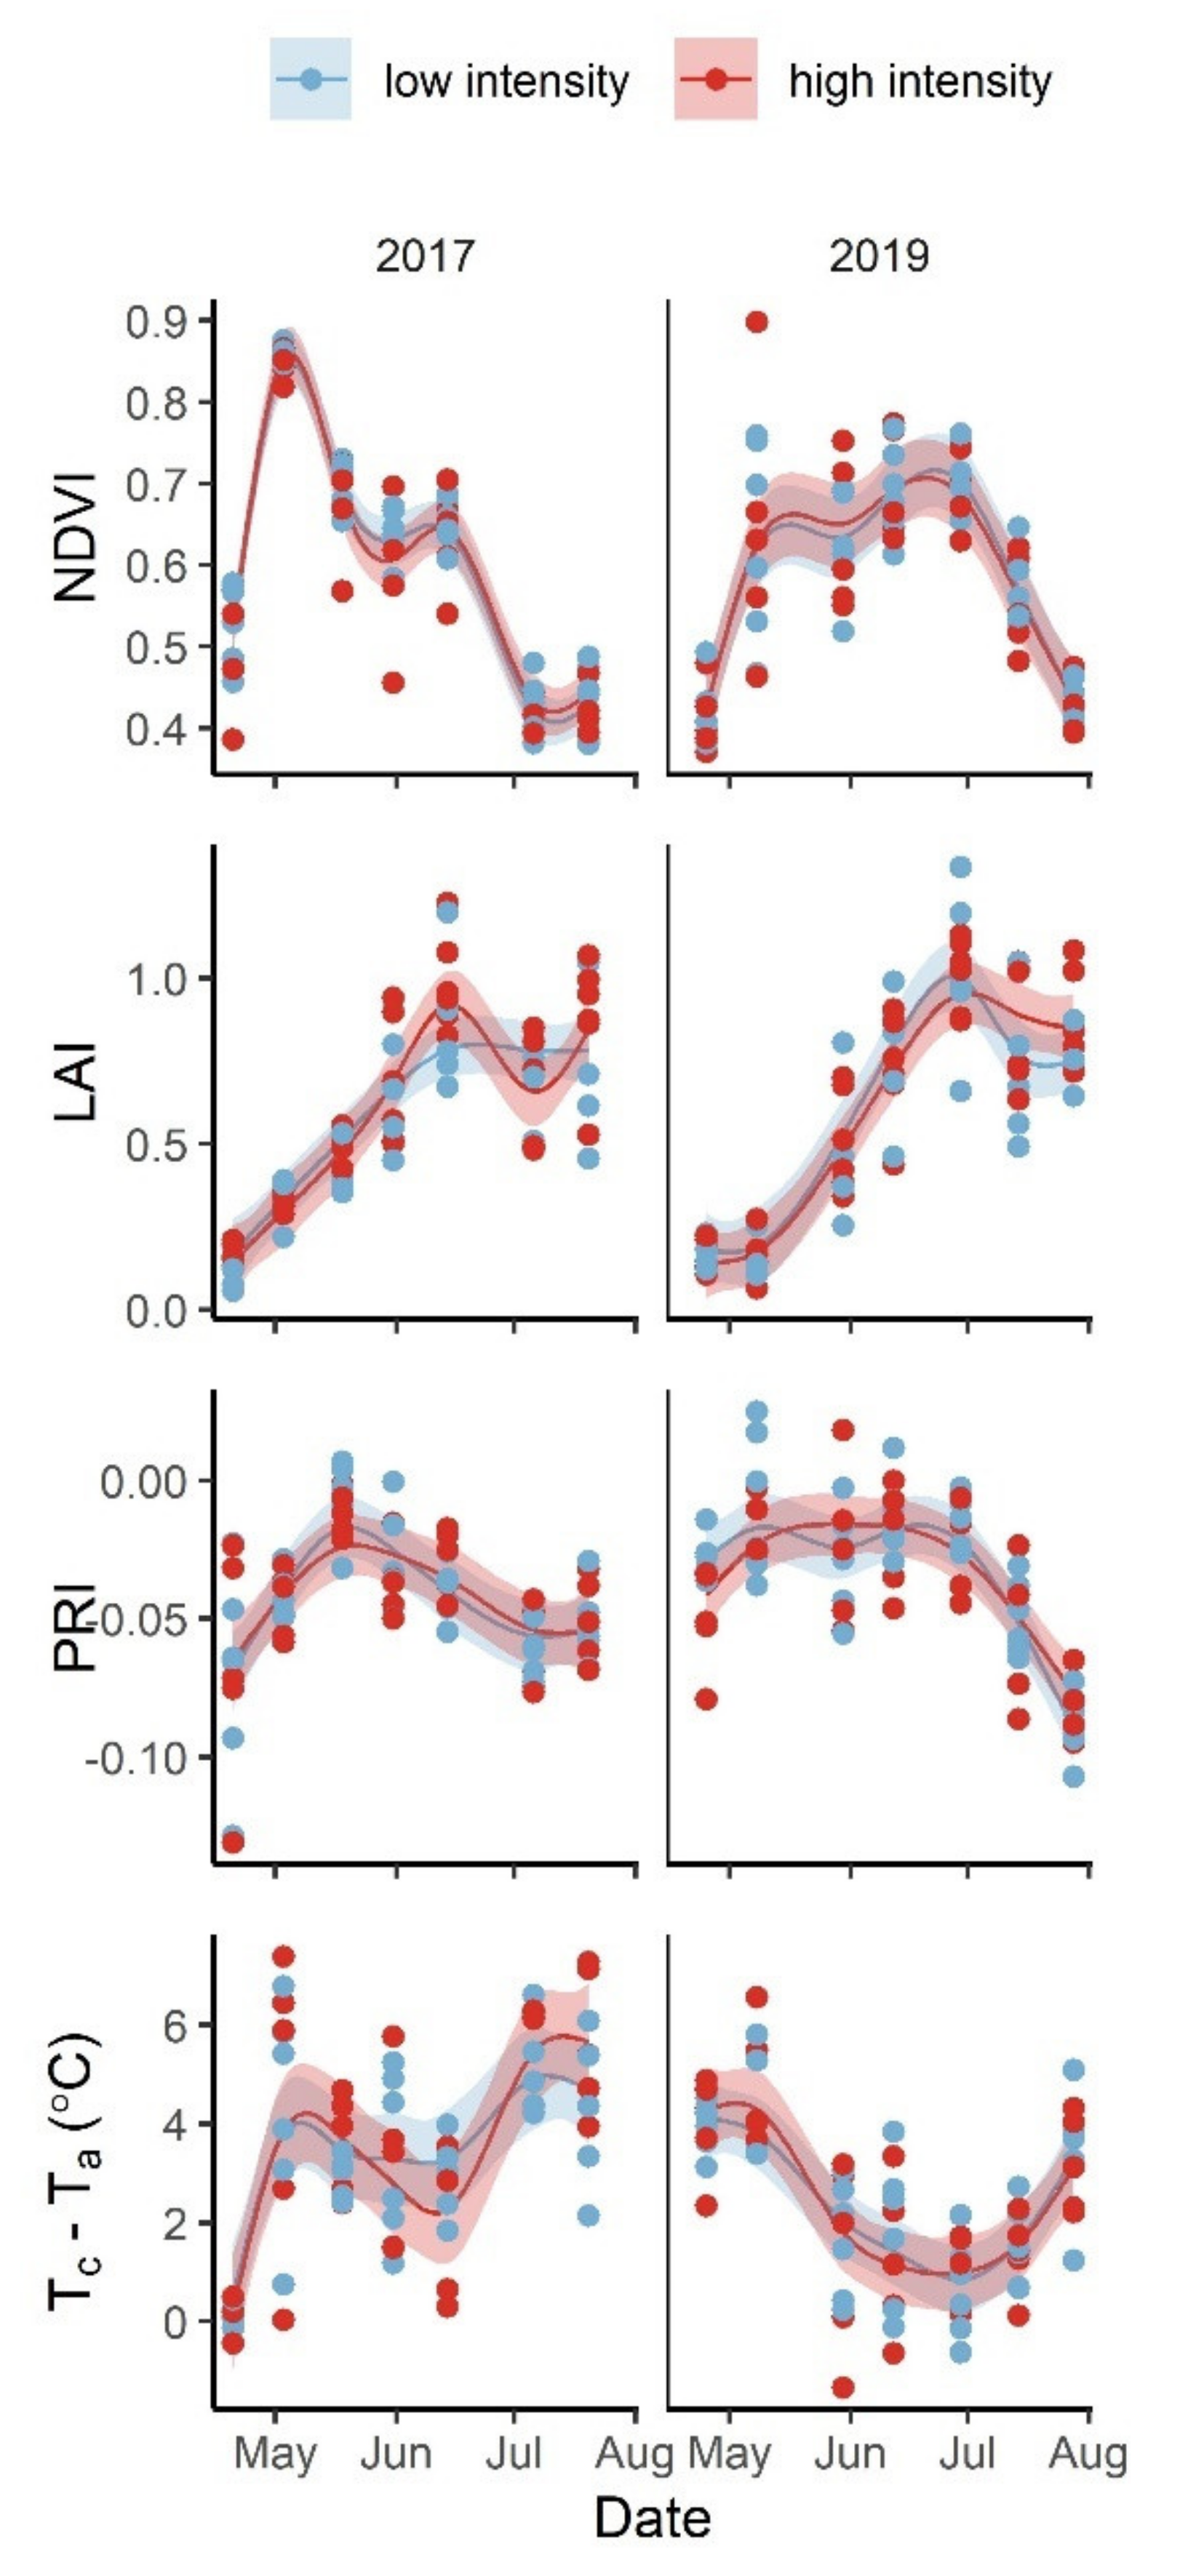
The null models best described the twice-monthly NDVI and LAI measurements in both 2017 and 2019 (Table S4), indicating that treatments did not affect the seasonal trend in vegetation growth (Figure 4). Similarly, null models best described PRI and infrared radiometer (Tc − Ta) measurements (Figure 4; Table S4), suggesting that treatments did not affect the seasonal trend in photochemical efficiency (assessed using PRI) and water stress (assessed using Tc − Ta).
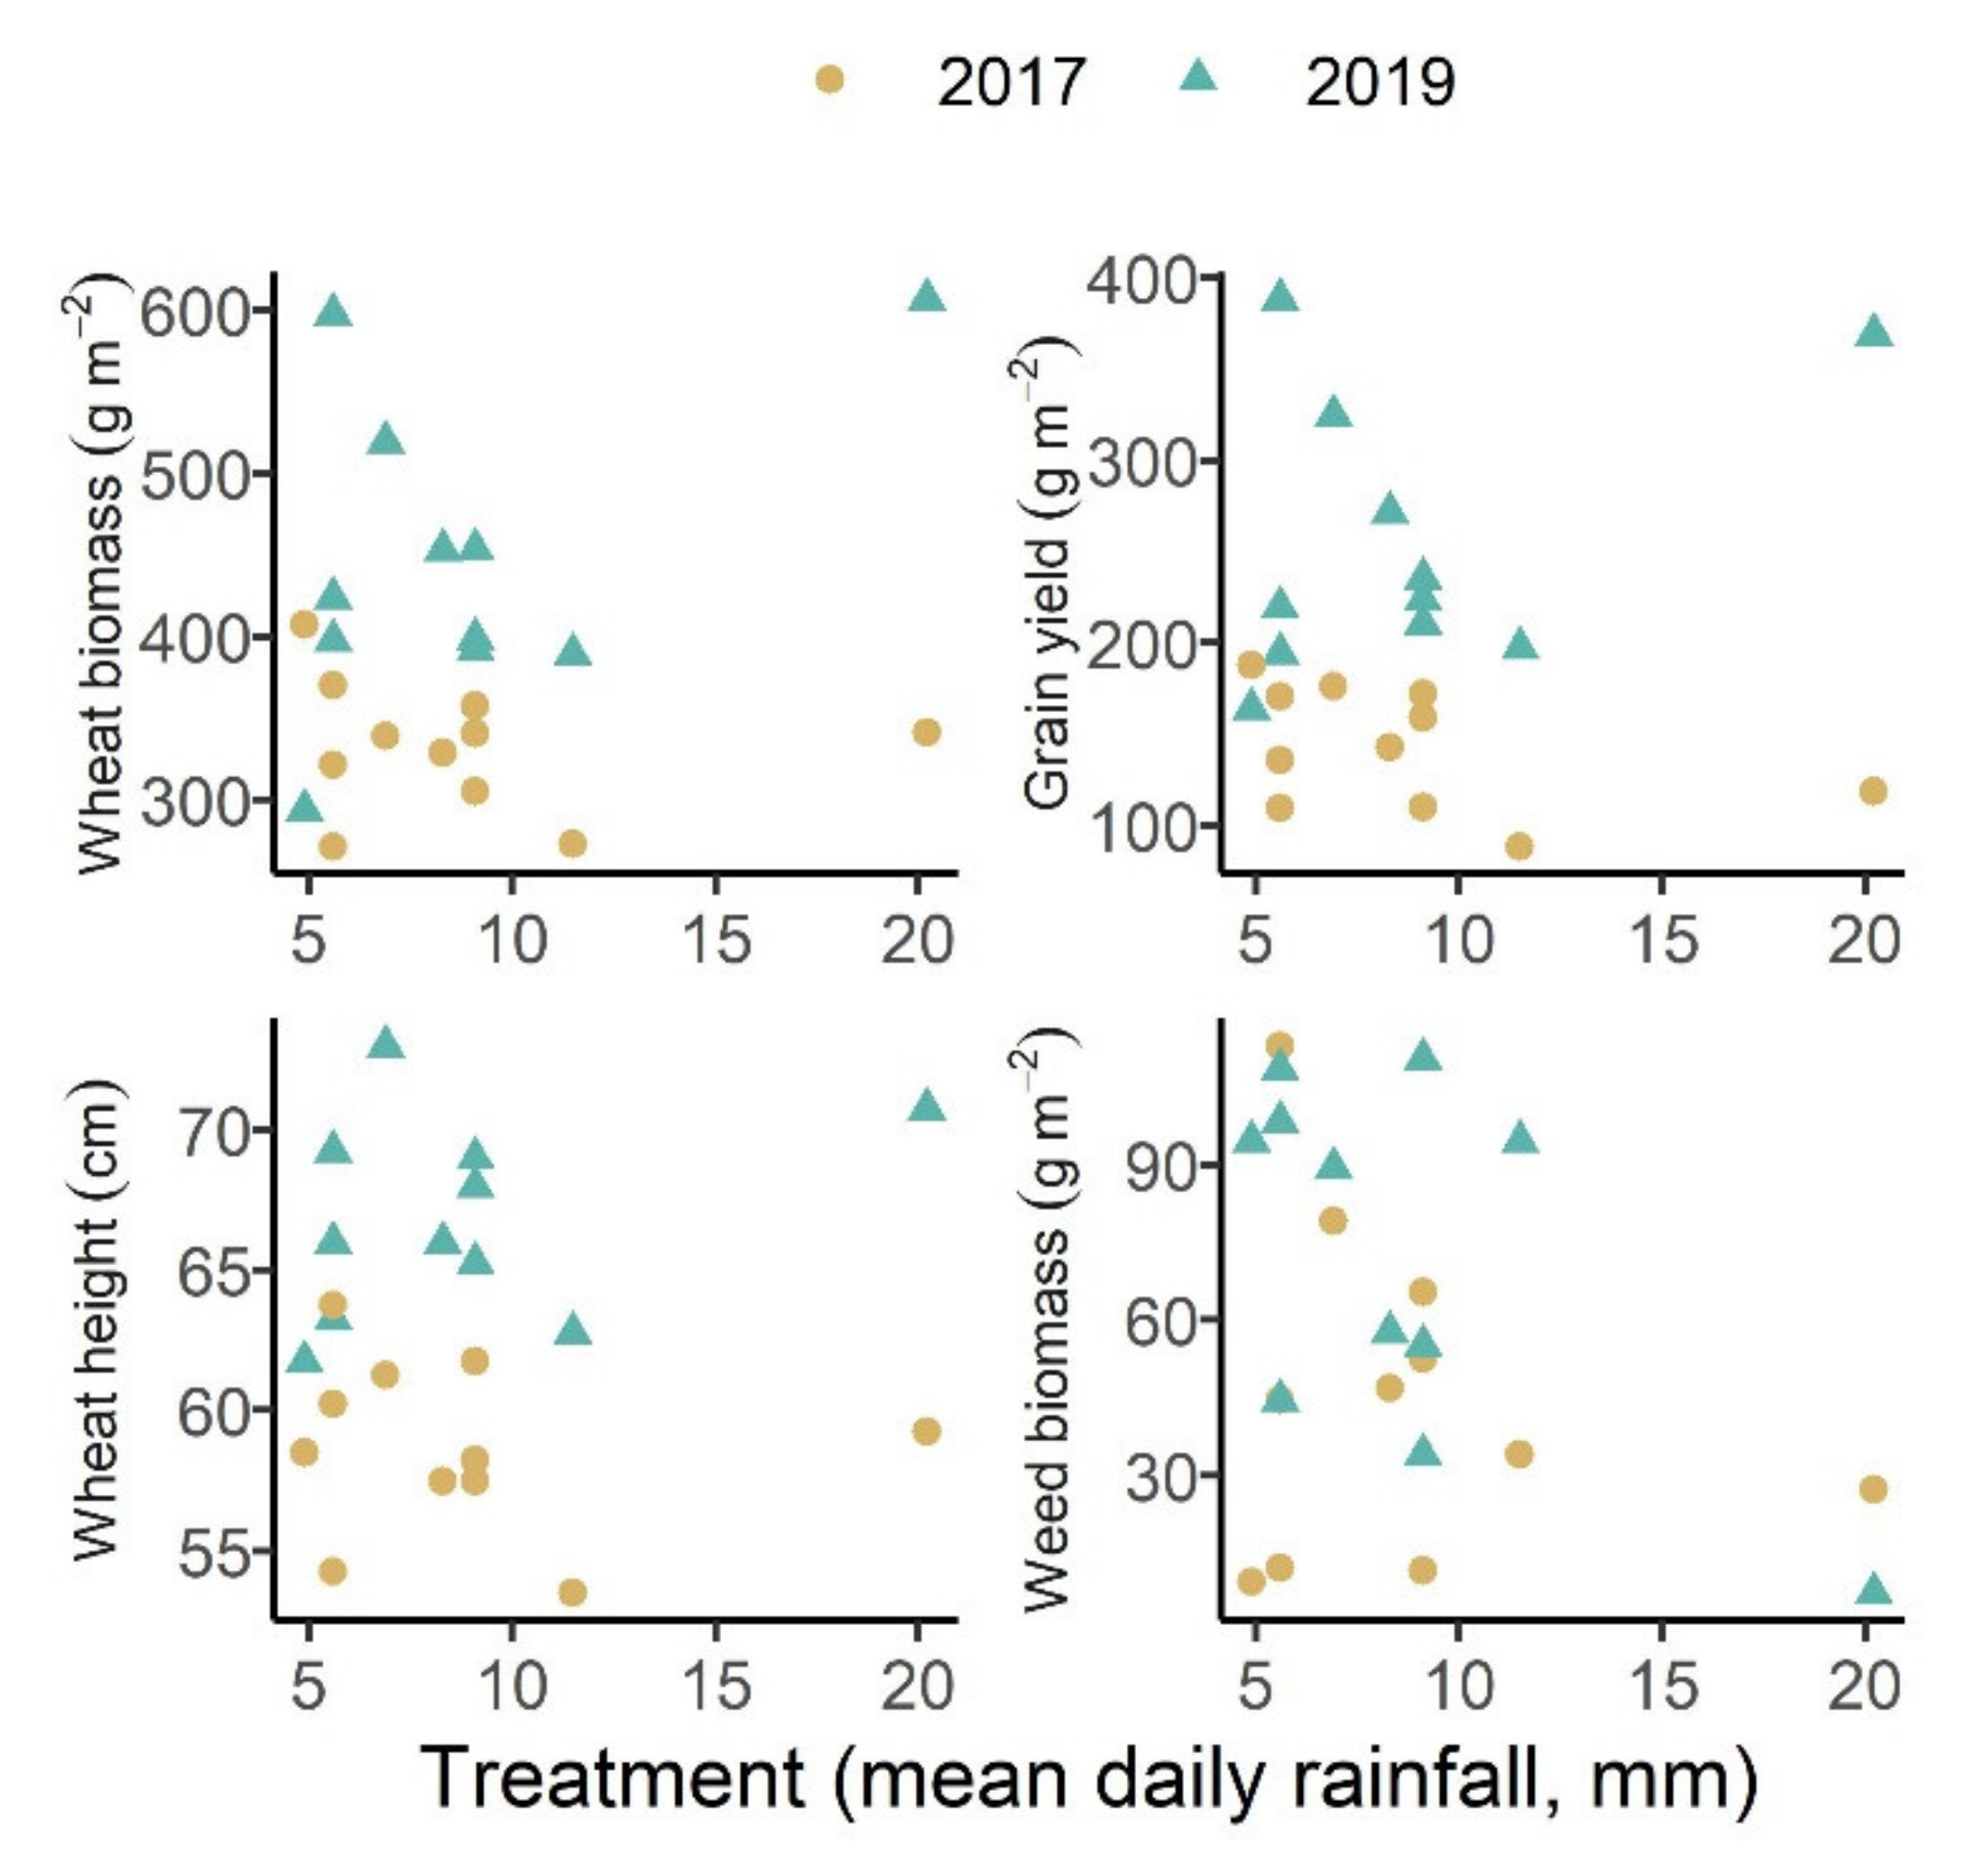
End-of-growing-season measurements of wheat growth did not change significantly with treatment (aboveground biomass, β = 4.24, F1,9 = 1.28, p = 0.29; grain yield, β = 1.68, F1,9 = 0.23, p = 0.64; wheat height, β = 0.08, F1,9 = 0.15, p = 0.71) (Figure 5). Aboveground wheat biomass, grain yield, and wheat height were higher in 2019 than 2017 (Figure 5; p < 0.05). In all three models, there was no treatment × year interaction (p > 0.05). Similarly, the total aboveground biomass of weeds (here defined as any nontarget plant species) did not respond to treatment (Figure 5; β = −3.15, F1,9 = 2.69, p = 0.14) and was higher in 2019 than 2017 (Figure 5; p = 0.02), with no treatment × year interaction (p = 0.18). Wheat and weed biomass from the center 1 × 1 m subplot (as opposed to biomass from the entire plot) also did not have a significant treatment response (p > 0.05), suggesting that edge effects did not have undue influence on biomass responses. In 2019, 98% of weed biomass was composed of four species: Polygonum douglasii Green (34%), Lactuca serriola L. (22%), Ranunculus testiculatus (Crantz) Roth (21%), and Agropyron cristatum (L.) Gaertn. (21%); weeds were not separated by species in 2017. When analyzed separately, none of these four species responded to treatment (p > 0.05).
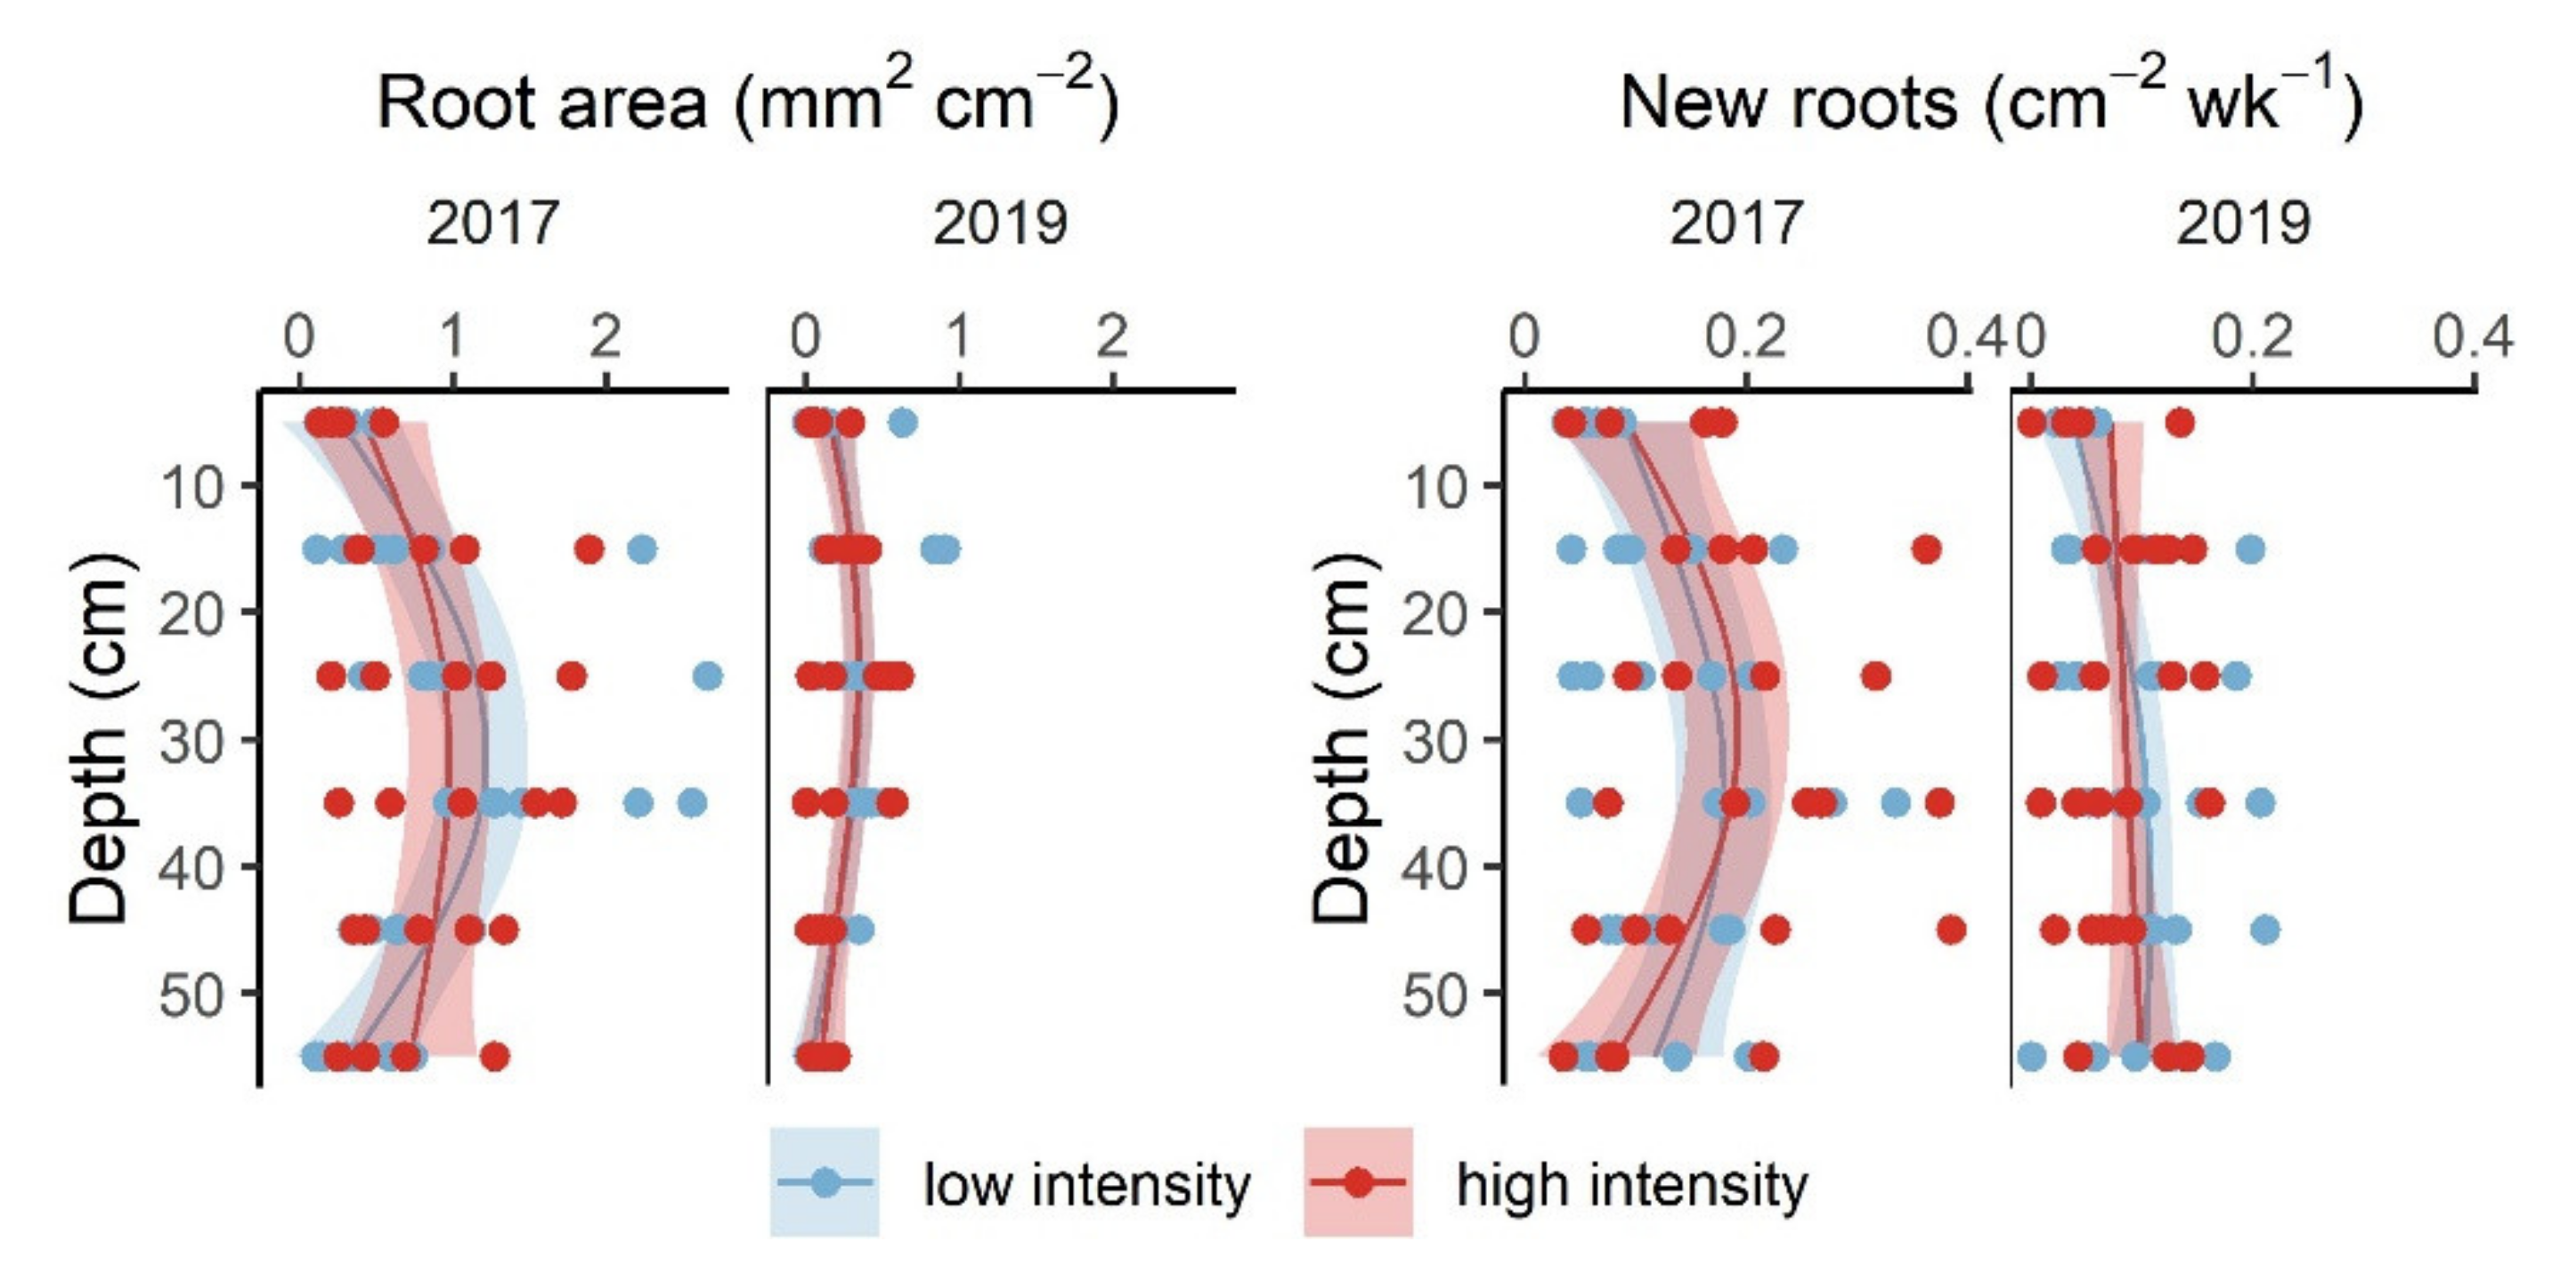
Mean root area and new root growth were higher in 2017 than in 2019 (Figure 6). In both 2017 and 2019, null models best described root area and new root growth (Figure 6; Table S5), suggesting that in both years, treatments did not impact root area or new root growth.

4. Discussion

Because climate variation includes changes in the amount, timing, and intensity of precipitation among other factors (e.g., temperature, relative humidity, and wind speed), it can be difficult to predict how anticipated future climates will affect crop production [49,50,51]. By manipulating only precipitation intensity over 3 years, our experiment isolated the effect of one aspect of climate change in a dryland crop system. Consistent with previous observational studies that found winter wheat to be resistant to changes in precipitation intensity [18,26], we found no response of winter wheat to a wide range of precipitation intensity treatments. This is in contrast to the findings of a paired study in a nearby rangeland site that used the same methods and experimental design, and that documented increased shrub growth in response to these same increased precipitation intensity treatments [10]. Our result that winter wheat was not responsive to treatments was consistent across all above- and belowground physiological and biomass measurements, including grain yield. Though convincing, it was somewhat surprising that wheat growth did not respond positively to the observed increases in soil water potential created by treatments. Results suggest that anticipated increases in precipitation intensity are unlikely to affect winter wheat production at our site in the foreseeable future.
Increased precipitation intensity has the potential to either increase or decrease soil moisture, depending on site conditions (i.e., soil texture, slope, and climate [52,53]). While our twice-monthly soil moisture measurements did not detect treatment effects, our hourly measurements revealed greater soil moisture in a treated than a control plot, particularly in the summer. This was consistent with observations from other studies using similar treatments in arid and semi-arid grasslands and savannas [12,41,54]. Given that all treatments received the same amount of precipitation, we assume that more water moved into the soil with larger precipitation events because a smaller proportion of water was lost to evaporation. The fact that deep-rooted plants have been observed to respond positively to increased precipitation intensity in other studies [41,54] suggests that it may be possible to select wheat varieties (i.e., with deeper roots) that can more fully exploit soil water resources made available by increasing precipitation intensity. Future experiments that measure responses of multiple wheat varieties to precipitation intensity could test this hypothesis.
Treatment effects on soil water potential were greatest from July through September, when plants were not growing [25]. Under hot and dry summer conditions, winter wheat genotypes that have earlier phenology have higher yields [55]. However, the optimal phenological strategy will vary with climate because maximizing yield in water-limited systems often relies on synchronizing phenology with soil moisture [56]. Therefore, other dryland crops or varieties of wheat that continue their growth late season may be more likely to respond positively to the increased soil water availability associated with increased precipitation intensity.
Winter wheat root depth and deep-root densities have been observed to increase in response to drought [57,58,59,60]. Additionally, positive relationships between winter wheat yield and maximum rooting depth and deep-root density have been observed under water-limited conditions, but not wet conditions [57,59]. We did not observe changes in root area or new growth of deep roots in response to changes in precipitation intensity. Results suggest that the Promontory wheat variety used in this study is well adapted to the typically dry conditions at the site, but less well adapted to take advantage of the increased soil water availability associated with our increased precipitation intensity treatments.
Aboveground biomass of weeds, 79% of which were annual forbs, also did not respond to treatments. In contrast, in a greenhouse study, annual weed emergence increased with precipitation intensity under dry conditions, but with variable effects under wetter conditions [7]. In natural grasslands, forb productivity has been documented to have both positive [61,62] and neutral [63,64] responses to increased precipitation intensity. The lack of weed response in this experiment and the variety of responses seen in other studies suggest that the weed growth response to increased precipitation intensity likely depends on the weed species and the environmental conditions.
Our study isolated the effects of altered precipitation intensity from other climate change effects, such as mean annual precipitation, temperature, and CO2 fertilization. Therefore, we cannot assess the net effects of climate change on this cropping system. Warming has been forecasted to decrease wheat yield in North America [65], while research in Europe suggests that winter wheat yields may increase due to increased radiation use efficiency caused by higher CO2 concentrations, despite increases in summertime drought [66]. A meta-analysis of 90 modeling studies helps explain these disparate findings and indicates that both positive and negative effects of climate change on wheat are possible, and the outcome largely depends on which of the counteracting effects of CO2 fertilization or warming are stronger [51]. Our results suggest that in this system, increased precipitation intensity is unlikely to exacerbate increased water stress that could be caused by warming. However, positive, neutral, and negative responses to increased precipitation intensity have been observed in other crops [8,17,18], underscoring the need for experiments such as ours to help estimate likely growth responses of specific crops.
Experiments manipulating precipitation intensity in agricultural settings are limited (but see [31,32,34]). Experiments in grasslands suggest that increased precipitation intensity will increase plant productivity in arid sites and decrease productivity in mesic sites [12,13,67]. The semi-arid cropland studied here may fall into a climatic window in which the advantages of decreased interception and evaporation are balanced by the disadvantages of overland flow and percolation below the rooting zone that are more likely in mesic systems. It is important to note that dryland agricultural systems are less likely to benefit from increased precipitation intensity relative to diverse grasslands and shrublands because these natural systems have deeper, more extensive, and more diverse rooting systems that can better exploit soil water resources [68]. Additionally, the two growing seasons studied were wetter than average for the site. Treatments may have had neutral to slightly positive effects on wheat growth in drier years because treatments increased soil water availability.

5. Conclusions

While we detected differences in above- and belowground wheat growth among growing seasons, winter wheat was highly resistant to a wide range of precipitation intensity treatments at our site. Winter wheat is often planted in dryland systems because it is resistant to climate variability, especially summer droughts. Our results demonstrate that this variety of winter wheat is resistant to changes in precipitation intensity, including increased soil water availability, in this dryland system. While other climate effects must be considered (i.e., temperature), our results indicate that under the climatic and edaphic conditions studied, increased precipitation intensity is unlikely to exacerbate potential negative impacts of climate change on winter wheat, which is important given that increases in precipitation intensity are expected regardless of changes in total annual precipitation.

Supplementary Materials

The following are available online at https://www.mdpi.com/article/10.3390/agronomy11040751/s1: Figure S1: Daily maximum and minimum temperatures under ambient and shelter conditions. Ambient temperatures are mostly not visible in figure due to overplotting because ambient and shelter temperatures were very similar. Figure S2: Daily maximum and minimum relative humidity under ambient and shelter conditions. Ambient humidity values are mostly not visible in the figure due to overplotting because ambient and shelter values were very similar. Table S1: Results of four mixed models that tested shelter effects on wheat and weed growth. Models included fixed effects of shelter (i.e., sheltered vs. shelterless control) and year. Figure S3: A tipping bucket model was applied to precipitation data to simulate the effects of the treatments on daily rainfall. Each panel shows the distribution of daily rainfall during April to November for a given treatment during the period of the experiment. The dotted line shows mean daily rainfall on days that received rain (i.e., the distribution mean). Total rainfall was the same in each treatment. Note that distributions are not continuous. This occurred for the 18 mm treatment, for example, because water was only deposited once enough had accumulated in the tank to create an 18 mm event. In rare occasions, it rained enough on 1 day for water to be deposited a second time (i.e., for a daily total of 36 mm). Table S2: Model results from shallow and deep soil water potential over time in a 4 mm treatment plot and a control plot. Separate sets of generalized additive mixed models (GAMMs) were fit to monthly mean water potential from sensors in shallow (10–30 cm) and deep soils (60–100 cm). Null models did not distinguish between treatments, fitting a single spline to month. The “separate” models separated the treated and control plots (i.e., fit separate splines for each plot; Figure S4). Figure S4: Monthly mean shallow (10–30 cm; top panel) and deep (60–100 cm; bottom panel) soil water potential over time in a treated and a control plot. Water potential was measured separately with three sensors for each depth category in one control plot and one treated plot in which all precipitation events were 4 mm or greater. The lines show the predicted values from the GAMM (“separate” model; Table S2). The shaded regions are 95% confidence intervals. Figure S5: Shallow (10–30 cm; top panels) and deep (40–100 cm; bottom panels) volumetric water content (VWC) in 2017 (left panels) and 2019 (right panels). Volumetric water content was measured in all plots approximately twice monthly during the growing season. Measurements were taken in 10 cm increments and then averaged into two depth categories (10–30 cm and 40–100 cm). Lines show the predicted values from the GAMMs. The shaded regions are 95% confidence intervals. While the null models outperformed the “low vs. high” models presented here (Table S3), they are shown to illustrate our data. Table S3: In each year, separate sets of GAMMs were fit to volumetric water content in shallow and deep soils. Null models did not distinguish between treatments, fitting a single spline to day of year. The “low vs. high” treatment models separated low (3 mm, 2 mm, 1 mm, and control)- and high (18 mm, 8 mm, and 4 mm)-precipitation-intensity treatments (Figure S5). The “all separate” model separated all treatments (i.e., fitting a separate spline to day of year for each treatment). Volumetric water content was measured in all plots approximately twice monthly during the growing season. Measurements were taken in 10 cm increments and then averaged into two depth categories (10–30 cm and 40–100 cm). Table S4: For each response variable, separate sets of generalized additive mixed models (GAMMs) were fit to growing season data from 2017 and 2019. Null models did not distinguish between treatments, fitting a single spline to day of year. The low versus high treatment models (“low vs. high”) separated low (3 mm, 2 mm, 1 mm, and control)- and high (18 mm, 8 mm, and 4 mm)-precipitation-intensity treatments (Figure 4 in the manuscript). The “all separate” model separated all treatments (i.e., fitting a separate spline to day of year for each treatment). Table S5: Root responses to precipitation intensity treatments. Separate sets of generalized additive mixed models (GAMMs) were fit to data from 2017 and 2019. Response variables were mean growing season root area (mm2 cm−2) and mean growing season new root growth rate (new roots, cm−2 week−1). Null models did not distinguish between treatments, fitting a single spline to day of year. The low versus high treatment models (“low vs. high”) separated low (3 mm, 2 mm, 1 mm, and control)- and high (18 mm, 8 mm, and 4 mm)-precipitation-intensity treatments (Figure 6 in the manuscript). The “all separate” model separated all treatments (i.e., fitting a separate spline to day of year for each treatment).

Author Contributions

Conceptualization, A.K.; methodology, A.K.; data curation, M.C.H.; formal analysis, M.C.H.; investigation, M.C.H.; writing—original draft preparation, M.C.H.; writing—review and editing, M.C.H., K.H.B., and A.K.; supervision, K.H.B.; project administration, K.H.B.; funding acquisition, A.K. and K.H.B. All authors have read and agreed to the published version of the manuscript.

Funding

This research was supported by the Utah Agricultural Experiment Station and approved as journal paper #9420, Utah State University, and the Utah State University Ecology Center.

Data Availability Statement

Data and code used in this manuscript are available in Holdrege, Beard, and Kulmatiski. (2021). Winter wheat responses to increased precipitation intensity, Utah, USA (2016–2019). Knowledge Network for Biocomplexity, doi:10.5063/0000GQ.

Acknowledgments

We thank L. Beck, S. Benvegnu, C. Carlisle, C. Chirvasa, M. Catalano, S. Hall, A. Kunz, D. Soderberg, S. Sprouse, B. Vernon, and E. Wilde for field assistance; S. Durham for statistical advice; and D. Hillyard and B. Newhall for farm management support.

Conflicts of Interest

The authors declare no conflict of interest.

Appendix A. Effects of Rainout Shelters

Appendix A.1. Shelter Effects on Temperature and Humidity

Air temperature and relative humidity were measured at a height of 1.5 m on the inside and outside of one shelter (HOBO Pro v2, Onset Computer Corp., Bourne, MA, USA). Sensors were installed 19 May 2017, and hourly measurements were collected until the end of the experiment (3 August 2019). Shelters were in place during this entire period.
Shelters had a negligible impact on temperature and humidity. Shelters had very slightly higher mean daily maximum temperature (15.8 vs. 15.7 °C) and the same daily minimum temperature (2.7 °C) as ambient conditions (Figure S1). Shelters had slightly lower mean daily maximum relative humidity (79.4% vs. 80.3%) and daily minimum relative humidity (43.4% vs. 43.8%) than ambient conditions (Figure S2).

Appendix A.2. Shelter Effects on Vegetation

Shelter effects on vegetation were analyzed using mixed-effects models to compare vegetation in the three shelterless-control plots and the three sheltered-control plots. Four models were fit, with the respective response variables being wheat height, aboveground wheat biomass, wheat grain yield, and aboveground weed biomass (“lme4” package [45]). In all cases, the fixed effects were shelter (i.e., sheltered vs. shelterless) and year (treated as a categorical variable). Plot was treated as a random effect.
No significant shelter effects of wheat height, wheat biomass, grain yield, or weed biomass were detected (Table S1). However, in all four models, there was a significant effect of year (Table S1).

Appendix B. Description of Precipitation Intensity Treatments

Holdrege et al. [10] used the same experimental design as was employed here (but in a shrubland with different plot sizes, snow treatments, and methods of water application). For the convenience of the reader, descriptions of the precipitation treatments are also included here.
  • Water was applied to plots via drip irrigation lines once enough water was collected in the tanks to create a precipitation event of a certain size (which varied by treatment). The target precipitation event sizes were calculated using historical precipitation data and the Clausius–Clapeyron relation. For example, for the 2 mm treatment associated with 1 °C of warming, the following steps were used to calculate the target event size: historical observed daily precipitation was put in descending order.
  • A curve was fit to this distribution of historical precipitation events to create a model of the precipitation distribution.
  • Precipitation events in this generalized distribution were multiplied by 1.07 to create a new distribution of larger events.
  • Enough of the smallest precipitation events were removed from this new distribution so that the sum of annual precipitation was equal to the sum of the original distribution (since all events were increased by 7%, if the smallest events were not “removed,” then total annual precipitation would necessarily also increase by 7%). This created a new distribution with fewer larger precipitation events, but the same total annual precipitation.
The smallest precipitation event size from this new distribution was used as the event size for the treatment. In the case of the 2 mm treatment, this smallest event size was 2 mm; this means that 2 mm of water was collected in tanks before being redistributed. The above sequence of steps was repeated to calculate event sizes for the treatments meant to reflect increased precipitation intensity associated with 2, 3, 5, and 10 °C of warming.
Rainwater was applied to the plots in a way that can be described as a tipping bucket model. That is, once the “bucket” (a water tank in our case) filled to the target level (e.g., 2 mm for the 2 mm treatment) with water collected off the shelter roof, it would “tip” (in our case, that means the floating outlet would sink and water would drain onto the plots via drip irrigation lines). Because a tank could fill and empty multiple times during a storm (i.e., multiple events in one day), this tipping bucket model was applied to observed precipitation data to calculate the mean daily rainfall that resulted from the treatments, that is, the mean amount of rain received on days when there was >0 mm of rain. For the 1 mm treatment (which unlike the other treatments had lower precipitation intensity than the control), 1 mm of precipitation from larger natural events was “removed” and redeposited on days no natural precipitation occurred. The tipping bucket model was applied to precipitation data from the period of the experiment (April 2016–August 2019), but only data from the months of April to November were used because those were snow-free months when our floating outlets were operational, and therefore, the time during which the tipping bucket model most accurately represented the way treatments were applied. The distributions of daily rainfall for each treatment are shown in Figure S3. Mean daily rainfall values were 4.9, 5.6, 6.9, 8.3, 9.1, 11.5, and 20.5 mm, for the 1 mm, control, 2 mm, 3 mm, 4 mm, 8 mm, and 18 mm treatments, respectively. These mean daily rainfall values were used in our regression analyses of wheat biomass, grain yield, wheat height, and weed biomass (Figure 5).
Mean daily rainfall of the treatments was within the range of historical daily precipitation. Meaning, the treatments did not receive more water on a single day than can naturally occur. Mean daily rainfall values for the 1 mm, control, 2 mm, 3 mm, 4 mm, 8 mm and, 18 mm treatments fall into the 67th, 72nd, 77th, 81st, 84th, 89th, and 97th percentiles of historical daily precipitation, respectively. This means, for example, that historically on days with precipitation, about 3% of days received more than 20.5 mm (which is the mean daily rainfall of the 18 mm treatment). Note that the distribution of daily rainfall is strongly right-skewed (many small events, few large), causing even the 1 mm and control treatments to have mean daily rainfall well above the 50th percentile of daily rainfall.
The target number of snow events to be applied for a given treatment was calculated using a similar methodology as described above for rain. However, for snow, instead of calculating a target event size, the target number of snow events for winter months was calculated. Snow from around the plots was shoveled onto plots to achieve the target number of snow events. All plots received an equal amount of snow water equivalent. If additional snow drifted into plots, it was removed.

References

  1. UNESCO. United Nations World Water Development Report 2020: Water and Climate Change; UNESCO: Paris, France, 2020. [Google Scholar]
  2. Venkateswarlu, B.; Shanker, A.K. Dryland agriculture: Bringing resilience to Ccop production under changing climate. In Crop Stress and its Management: Perspectives and Strategies; Springer: Dordrecht, The Netherlands, 2012; pp. 19–44. ISBN 9789400722200. [Google Scholar]
  3. Stewart, B.A. Dryland Farming. In Reference Module in Food Science; Elsevier B.V.: Amsterdam, The Netherlands, 2016. [Google Scholar]
  4. Donat, M.G.; Lowry, A.L.; Alexander, L.V.; O’Gorman, P.A.; Maher, N. More extreme precipitation in the world’s dry and wet regions. Nat. Clim. Chang. 2016, 6, 508–513. [Google Scholar] [CrossRef]
  5. Fischer, E.M.; Knutti, R. Observed heavy precipitation increase confirms theory and early models. Nat. Clim. Chang. 2016, 6, 986–991. [Google Scholar] [CrossRef]
  6. Wilcox, K.R.; von Fischer, J.C.; Muscha, J.M.; Petersen, M.K.; Knapp, A.K. Contrasting above- and belowground sensitivity of three Great Plains grasslands to altered rainfall regimes. Glob. Chang. Biol. 2015, 21, 335–344. [Google Scholar] [CrossRef]
  7. Robinson, T.M.P.; Gross, K.L. The impact of altered precipitation variability on annual weed species. Am. J. Bot. 2010, 97, 1625–1629. [Google Scholar] [CrossRef]
  8. Fishman, R. More uneven distributions overturn benefits of higher precipitation for crop yields. Environ. Res. Lett. 2016, 11. [Google Scholar] [CrossRef]
  9. Smith, N.G.; Rodgers, V.L.; Brzostek, E.R.; Kulmatiski, A.; Avolio, M.L.; Hoover, D.L.; Koerner, S.E.; Grant, K.; Jentsch, A.; Fatichi, S.; et al. Toward a better integration of biological data from precipitation manipulation experiments into Earth system models. Rev. Geophys. 2014, 52, 412–434. [Google Scholar] [CrossRef] [Green Version]
  10. Holdrege, M.C.; Beard, K.H.; Kulmatiski, A. Woody plant growth increases with precipitation intensity in a cold semi-arid system. Ecology 2020, 1–11. [Google Scholar] [CrossRef]
  11. Gherardi, L.A.; Sala, O.E. Enhanced precipitation variability decreases grass- and increases shrub-productivity. Proc. Natl. Acad. Sci. USA 2015, 112, 12735–12740. [Google Scholar] [CrossRef] [PubMed] [Green Version]
  12. Heisler-White, J.L.; Blair, J.M.; Kelly, E.F.; Harmoney, K.; Knapp, A.K. Contingent productivity responses to more extreme rainfall regimes across a grassland biome. Glob. Chang. Biol. 2009, 15, 2894–2904. [Google Scholar] [CrossRef]
  13. Heisler-White, J.L.; Knapp, A.K.; Kelly, E.F. Increasing precipitation event size increases aboveground net primary productivity in a semi-arid grassland. Oecologia 2008, 158, 129–140. [Google Scholar] [CrossRef]
  14. Good, S.P.; Caylor, K.K. Climatological determinants of woody cover in Africa. Proc. Natl. Acad. Sci. USA 2011, 108, 4902–4907. [Google Scholar] [CrossRef] [PubMed] [Green Version]
  15. Case, M.F.; Staver, A.C. Soil texture mediates tree responses to rainfall intensity in African savannas. New Phytol. 2018, 219, 1363–1372. [Google Scholar] [CrossRef] [Green Version]
  16. Bodner, G.; Nakhforoosh, A.; Kaul, H.P. Management of crop water under drought: A review. Agron. Sustain. Dev. 2015, 35, 401–442. [Google Scholar] [CrossRef]
  17. Shortridge, J. Observed trends in daily rainfall variability result in more severe climate change impacts to agriculture. Clim. Chang. 2019, 157, 429–444. [Google Scholar] [CrossRef]
  18. Troy, T.J.; Kipgen, C.; Pal, I. The impact of climate extremes and irrigation on US crop yields. Environ. Res. Lett. 2015, 10. [Google Scholar] [CrossRef] [Green Version]
  19. Mearns, L.O.; Rosenzweig, C.; Goldberg, R. The effect of changes in daily and interannual climatic variability on CERES-Wheat: A sensitivity study. Clim. Chang. 1996, 32, 257–292. [Google Scholar] [CrossRef]
  20. Butler, E.E. Heavy rain, come today. Nat. Clim. Chang. 2020, 10, 805–806. [Google Scholar] [CrossRef]
  21. Rockström, J.; Karlberg, L.; Wani, S.P.; Barron, J.; Hatibu, N.; Oweis, T.; Bruggeman, A.; Farahani, J.; Qiang, Z. Managing water in rainfed agriculture-The need for a paradigm shift. Agric. Water Manag. 2010, 97, 543–550. [Google Scholar] [CrossRef] [Green Version]
  22. FAO. World Food and Agriculture—Statistical Yearbook 2020; FAO: Rome, Italy, 2020; ISBN 978-92-5-133394-5. [Google Scholar]
  23. Vocke, G.; Ali, M. US wheat production practices, costs, and yields: Variations across regions. USDA-ERS 2013, EIB-116, 1–30. [Google Scholar]
  24. Jensen, K.J.S.; Hansen, S.; Styczen, M.E.; Holbak, M.; Jensen, S.M.; Petersen, C.T. Yield and development of winter wheat (Triticum aestivum L.) and spring barley (Hordeum vulgare) in field experiments with variable weather and drainage conditions. Eur. J. Agron. 2021, 122, 126075. [Google Scholar] [CrossRef]
  25. Webber, H.; Ewert, F.; Olesen, J.E.; Müller, C.; Fronzek, S.; Ruane, A.C.; Bourgault, M.; Martre, P.; Ababaei, B.; Bindi, M.; et al. Diverging importance of drought stress for maize and winter wheat in Europe. Nat. Commun. 2018, 9, 1–10. [Google Scholar] [CrossRef] [Green Version]
  26. Li, X.; Troy, T.J. Changes in rainfed and irrigated crop yield response to climate in the western US. Environ. Res. Lett. 2018, 13, 064031. [Google Scholar] [CrossRef]
  27. Rezaei, E.E.; Siebert, S.; Ewert, F. Intensity of heat stress in winter wheat—Phenology compensates for the adverse effect of global warming. Environ. Res. Lett. 2015, 10. [Google Scholar] [CrossRef]
  28. Gooding, M.J.; Ellis, R.H.; Shewry, P.R.; Schofield, J.D. Effects of restricted water availability and increased temperature on the grain filling, drying and quality of winter wheat. J. Cereal Sci. 2003, 37, 295–309. [Google Scholar] [CrossRef]
  29. White, J.W. Comments on a report of regression-based evidence for impact of recent climate change on winter wheat yields. Agric. Ecosyst. Environ. 2009, 129, 547–548. [Google Scholar] [CrossRef]
  30. Sheehy, J.E.; Mitchell, P.L.; Ferrer, A.B. Decline in rice grain yields with temperature: Models and correlations can give different estimates. Field Crop. Res. 2006, 98, 151–156. [Google Scholar] [CrossRef]
  31. Patil, R.H.; Laegdsmand, M.; Olesen, J.E.; Porter, J.R. Growth and yield response of winter wheat to soil warming and rainfall patterns. J. Agric. Sci. 2010, 148, 553–566. [Google Scholar] [CrossRef] [Green Version]
  32. Tataw, J.T.; Baier, F.; Krottenthaler, F.; Pachler, B.; Schwaiger, E.; Wyhlidal, S.; Formayer, H.; Hösch, J.; Baumgarten, A.; Zaller, J.G. Climate change induced rainfall patterns affect wheat productivity and agroecosystem functioning dependent on soil types. Ecol. Res. 2016, 31, 203–212. [Google Scholar] [CrossRef]
  33. Drebenstedt, I.; Schmid, I.; Poll, C.; Marhan, S.; Kahle, R.; Kandeler, E.; Högy, P. Effects of soil warming and altered precipitation patterns on photosynthesis, biomass production and yield of barley. J. Appl. Bot. Food Qual. 2020, 93, 44–53. [Google Scholar] [CrossRef]
  34. Poll, C.; Marhan, S.; Back, F.; Niklaus, P.A.; Kandeler, E. Field-scale manipulation of soil temperature and precipitation change soil CO2 flux in a temperate agricultural ecosystem. Agric. Ecosyst. Environ. 2013, 165, 88–97. [Google Scholar] [CrossRef]
  35. Drebenstedt, I.; Hart, L.; Poll, C.; Marhan, S.; Kandeler, E.; Böttcher, C.; Meiners, T.; Hartung, J.; Högy, P. Do soil warming and changes in precipitation patterns affect seed yield and seed quality of field-grown winter oilseed rape? Agronomy 2020, 10, 520. [Google Scholar] [CrossRef] [Green Version]
  36. Menne, M.J.; Durre, I.; Vose, R.S.; Gleason, B.E.; Houston, T.G. An overview of the Global Historical Climatology Network-Daily Database. J. Atmos. Ocean. Technol. 2012, 29, 897–910. [Google Scholar] [CrossRef]
  37. Soil Survey Staff Natural Resrouces Conservation Service; United States Department of Agriculture. Web Soil Survey. Available online: https://websoilsurvey.sc.egov.usda.gov/ (accessed on 7 October 2018).
  38. Hodges, R.; Clawson, R.; Cardon, G.E. Soil Series: Elevation and Agricultural Soil Test Survey of the Godfrey Dryland Experimental Farm, Clarkston, Utah; Factsheet 1797; Utah State University Extension: Clarkston, UT, USA, 2017. [Google Scholar]
  39. Hole, D.J.; Dewey, W.; Albrechtsen, R.S. Registration of ‘Promontory’ Wheat. Crop. Sci. 1995, 35, 1206–1207. [Google Scholar] [CrossRef]
  40. Robertson, D.L.; Guy, S.O.; Brown, B.D. Southern Idaho Dryland Winter Wheat Production Guide; Extension Bulletin 827; University of Idaho: Moscow, ID, USA, 2004. [Google Scholar]
  41. Kulmatiski, A.; Beard, K.H. Woody plant encroachment facilitated by increased precipitation intensity. Nat. Clim. Chang. 2013, 3, 833–837. [Google Scholar] [CrossRef]
  42. O’Gorman, P.A.; Muller, C.J. How closely do changes in surface and column water vapor follow Clausius-Clapeyron scaling in climate change simulations? Environ. Res. Lett. 2010, 5. [Google Scholar] [CrossRef]
  43. Garbulsky, M.F.M.F.; Peñuelas, J.; Gamon, J.; Inoue, Y.; Filella, I.; Penuelas, J.; Gamon, J.; Inoue, Y.; Filella, I. The photochemical reflectance index (PRI) and the remote sensing of leaf, canopy and ecosystem radiation use efficiencies. A review and meta-analysis. Remote Sens. Environ. 2011, 115, 281–297. [Google Scholar] [CrossRef]
  44. Payero, J.O.; Irmak, S. Variable upper and lower crop water stress index baselines for corn and soybean. Irrig. Sci. 2006, 25, 21–32. [Google Scholar] [CrossRef] [Green Version]
  45. Bates, D.; Mächler, M.; Bolker, B.; Walker, S. Fitting linear mixed-effects models using lme4. J. Stat. Softw. 2015, 67, 1–48. [Google Scholar] [CrossRef]
  46. Wood, S.N. Fast stable restricted maximum likelihood and marginal likelihood estimation of semiparametric generalized linear models. J. R. Stat. Soc. Ser. B 2011, 73, 3–36. [Google Scholar] [CrossRef] [Green Version]
  47. Burnham, K.P.; Anderson, D.R. Model Selection and Inference: A Practical Information-Theoretic Approach, 2nd ed.; Springer: New York, NY, USA, 2002; ISBN 978-0-387-22456-5. [Google Scholar]
  48. R Core Team. R: A Language and Environment for Statistical Computing; R Foundation for Statistical Computing: Vienna, Austria, 2019. [Google Scholar]
  49. Iizumi, T.; Ramankutty, N. Changes in yield variability of major crops for 1981-2010 explained by climate change. Environ. Res. Lett. 2016, 11. [Google Scholar] [CrossRef]
  50. Ray, D.K.; Gerber, J.S.; Macdonald, G.K.; West, P.C. Climate variation explains a third of global crop yield variability. Nat. Commun. 2015, 6, 1–9. [Google Scholar] [CrossRef] [PubMed] [Green Version]
  51. Wilcox, J.; Makowski, D. A meta-analysis of the predicted effects of climate change on wheat yields using simulation studies. Field Crop. Res. 2014, 156, 180–190. [Google Scholar] [CrossRef]
  52. Knapp, A.K.; Beier, C.; Briske, D.D.; Classen, A.T.; Luo, Y.; Reichstein, M.; Smith, M.D.; Smith, S.D.; Bell, J.E.; Fay, P.A.; et al. Consequences of more extreme precipitation regimes for terrestrial ecosystems. Bioscience 2008, 58, 811–821. [Google Scholar] [CrossRef]
  53. Kulmatiski, A.; Adler, P.B.; Foley, K.M. Hydrologic niches explain species coexistence and abundance in a shrub-steppe system. J. Ecol. 2020, 108, 998–1008. [Google Scholar] [CrossRef]
  54. Berry, R.S.; Kulmatiski, A. A savanna response to precipitation intensity. PLoS ONE 2017, 12, 1–18. [Google Scholar] [CrossRef]
  55. Lopes, M.S.; Royo, C.; Alvaro, F.; Sanchez-Garcia, M.; Ozer, E.; Ozdemir, F.; Karaman, M.; Roustaii, M.; Jalal-Kamali, M.R.; Pequeno, D. Optimizing winter wheat resilience to climate change in rain fed crop systems of Turkey and Iran. Front. Plant Sci. 2018, 9, 1–14. [Google Scholar] [CrossRef]
  56. Blum, A. Effective use of water (EUW) and not water-use efficiency (WUE) is the target of crop yield improvement under drought stress. Field Crop. Res. 2009, 112, 119–123. [Google Scholar] [CrossRef]
  57. Fang, Y.; Du, Y.; Wang, J.; Wu, A.; Qiao, S.; Xu, B.; Zhang, S.; Siddique, K.H.M.; Chen, Y. Moderate drought stress affected root growth and grain yield in old, modern and newly released cultivars of winter wheat. Front. Plant Sci. 2017, 8, 1–14. [Google Scholar] [CrossRef] [Green Version]
  58. Barraclough, P.B.; Weir, A.H.; Kulhmann, H. Factors affecting the growth and distribution of winter wheat roots under UK field conditions. In Plant Roots and Their Environment; Elsevier Science Publishers B.V.: Amsterdam, The Netherlands, 1991; Volume 24, pp. 410–417. [Google Scholar]
  59. Itoh, H.; Hayashi, S.; Nakajima, T.; Hayashi, T.; Yoshida, H.; Yamazaki, K.; Komatsu, T. Effects of soil type, vertical root distribution and precipitation on grain yield of winter wheat. Plant Prod. Sci. 2009, 12, 503–513. [Google Scholar] [CrossRef] [Green Version]
  60. Hodgkinson, L.; Dodd, I.C.; Binley, A.; Ashton, R.W.; White, R.P.; Watts, C.W.; Whalley, W.R. Root growth in field-grown winter wheat: Some effects of soil conditions, season and genotype. Eur. J. Agron. 2017, 91, 74–83. [Google Scholar] [CrossRef]
  61. Grant, K.; Kreyling, J.; Dienstbach, L.F.H.; Beierkuhnlein, C.; Jentsch, A. Water stress due to increased intra-annual precipitation variability reduced forage yield but raised forage quality of a temperate grassland. Agric. Ecosyst. Environ. 2014, 186, 11–22. [Google Scholar] [CrossRef]
  62. Grant, K.; Kreyling, J.; Beierkuhnlein, C.; Jentsch, A. Importance of seasonality for the response of a mesic temperate grassland to increased precipitation variability and warming. Ecosystems 2017, 20, 1454–1467. [Google Scholar] [CrossRef]
  63. Fay, P.A.; Blair, J.M.; Smith, M.D.; Nippert, J.B.; Carlisle, J.D.; Knapp, A.K. Relative effects of precipitation variability and warming on tallgrass prairie ecosystem function. Biogeosciences 2011, 8, 3053–3068. [Google Scholar] [CrossRef] [Green Version]
  64. Nippert, J.B.; Knapp, A.K.; Briggs, J.M. Intra-annual rainfall variability and grassland productivity: Can the past predict the future? Plant Ecol. 2006, 184, 65–74. [Google Scholar] [CrossRef]
  65. Asseng, S.; Ewert, F.; Rosenzweig, C.; Jones, J.W.; Hatfield, J.L.; Ruane, A.C.; Boote, K.J.; Thorburn, P.J.; Rötter, R.P.; Cammarano, D.; et al. Uncertainty in simulating wheat yields under climate change. Nat. Clim. Chang. 2013, 3, 827–832. [Google Scholar] [CrossRef] [Green Version]
  66. Richter, G.M.; Semenov, M.A. Modelling impacts of climate change on wheat yields in England and Wales: Assessing drought risks. Agric. Syst. 2005, 84, 77–97. [Google Scholar] [CrossRef]
  67. Walter, J.; Grant, K.; Beierkuhnlein, C.; Kreyling, J.; Weber, M.; Jentsch, A. Increased rainfall variability reduces biomass and forage quality of temperate grassland largely independent of mowing frequency. Agric. Ecosyst. Environ. 2012, 148, 1–10. [Google Scholar] [CrossRef]
  68. DuPont, S.T.; Beniston, J.; Glover, J.D.; Hodson, A.; Culman, S.W.; Lal, R.; Ferris, H. Root traits and soil properties in harvested perennial grassland, annual wheat, and never-tilled annual wheat. Plant Soil 2014, 381, 405–420. [Google Scholar] [CrossRef]
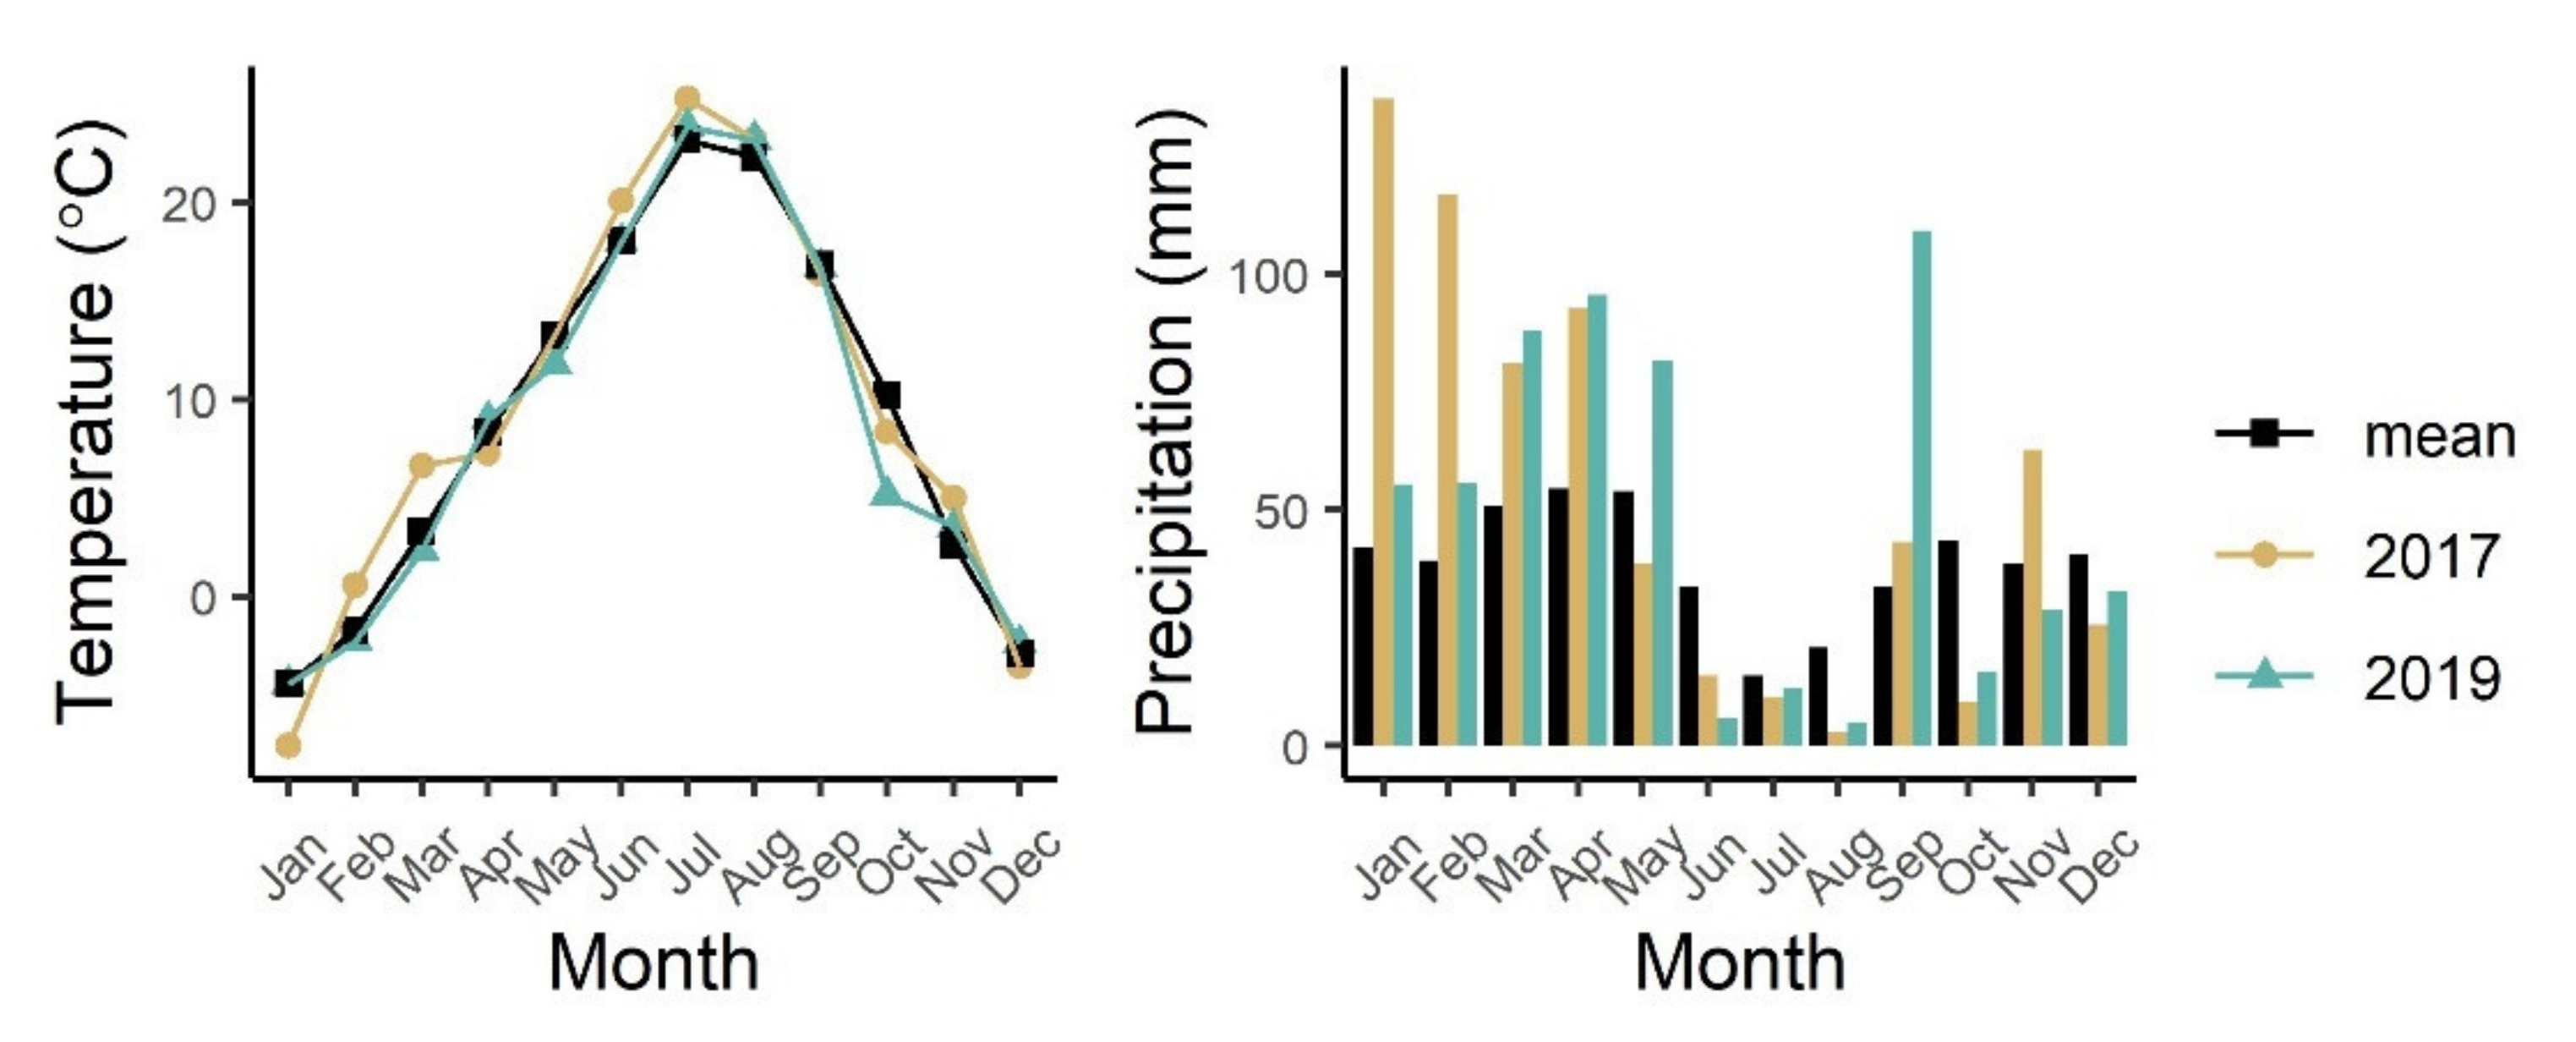
Figure 1. Monthly temperature and precipitation in 2017 and 2019, the years during which winter wheat was grown in plots. Historical mean monthly values of records from 1928–2019 are also shown.
Agronomy 11 00751 g001
Figure 2. Shelters (2.1 × 2.5 m) were used to redistribute rain and snow as fewer, larger events at a dryland agriculture site, Utah, USA. Two of three rows of plots are visible in the photograph.
Agronomy 11 00751 g002
Figure 3. Shallow (10–30 cm; left panel) and deep (60–100 cm; right panel) soil water potential over time in a 4 mm event size treated plot and control plot. Water potential was measured separately with three sensors for each depth in each plot. Total annual precipitation was the same in both plots. Monthly values represent averages from hourly measurements from April 2016 to August 2019, the period during which precipitation treatments occurred. Error bars are standard errors based on the three sensors at each depth.
Agronomy 11 00751 g003
Figure 4. Normalized difference vegetation index (NDVI), leaf area index (LAI), photochemical reflectance index (PRI), and the difference between canopy and air temperature (Tc − Ta) in low- versus high-precipitation-intensity plots. Data from 2017 (left panels) and 2019 (right panels) are shown. The lines show the predicted values from the generalized additive mixed models (GAMMs), and the shaded regions are 95% confidence intervals. Treatments were grouped into two precipitation intensity categories: low intensity (1 mm, control, 2 mm, and 3 mm treatments) and high intensity (4 mm, 8 mm, and 18 mm treatments). While the null models outperformed the GAMMs presented here (indicating no significant treatment responses; Table S4), they are shown to illustrate our data.
Agronomy 11 00751 g004
Figure 5. Aboveground wheat biomass, grain yield, wheat height, and aboveground weed biomass vs. mean daily rainfall (mean rainfall on days that received >0 mm rain; Table 1). Mean daily rainfall was not a significant predictor of the response variables shown here.
Agronomy 11 00751 g005
Figure 6. Root area (left panels) and new root growth rate (right panels) in low- versus high-precipitation-intensity treatment plots. Values are means of twice-monthly measurements during the growing seasons of 2017 and 2019. Lines show the predicted values from the GAMMs, and the shaded regions are 95% confidence intervals. Treatments were grouped into two precipitation intensity categories: low intensity (1 mm, control, 2 mm, and 3 mm treatments) and high intensity (4 mm, 8 mm, and 18 mm treatments). While the null models outperformed the models presented here (indicating no significant treatment responses; Table S5), they are shown to illustrate our data.
Agronomy 11 00751 g006
Table 1. Treatment descriptions, number of replicate plots (N), and the mean daily rain on days with rainfall. All treatments received the same total water and only differed in event size and frequency. Treatment names were based on event sizes, that is, the amount of water that would be collected from shelter roofs and accumulate in the tanks before being redeposited. Mean daily rain on days with >0 mm of rain was calculated using observed rainfall during the experiment (Appendix B; Figure S3). These values are larger than the event sizes because when large natural rain events occurred, water would be redeposited onto the plot multiple times in one day (i.e., multiple “events” in 1 day). The “intensity category” grouped treatments into low- and high-precipitation-intensity categories that were used in the analyses. Shelterless control plots were not included in the analyses of treatment effects but were used to assess shelter effects.
TreatmentsDescriptionNMean Daily Rainfall (mm)Intensity Category
Shelterless controlAmbient plot (no rainout shelter)35.6
1 mmReceived more frequent, small events than control plots.14.9Low intensity
ControlSheltered-control plot, water was redeposited immediately after being collected from the shelter roof.35.6Low intensity
2 mmWater was redeposited once enough rainwater was collected in the tank to create a 2 mm event.16.9Low intensity
3 mmWater was redeposited once enough rainwater was collected in the tank to create a 3 mm event.18.3Low intensity
4 mmWater was redeposited once enough rainwater was collected in the tank to create a 4 mm event.39.1High intensity
8 mmWater was redeposited once enough rainwater was collected in the tank to create an 8 mm event.111.5High intensity
18 mmWater was redeposited once enough rainwater was collected in the tank to create an 18 mm event.120.5High intensity
Publisher’s Note: MDPI stays neutral with regard to jurisdictional claims in published maps and institutional affiliations.