Abstract
Rapid, cost-effective, and environmentally friendly analysis of key soil fertility attributes requires an ideal combination of sensors. The individual and combined performance of visible and near infrared (VNIR) diffuse reflectance spectroscopy, X-ray fluorescence spectroscopy (XRF), and laser-induced breakdown spectroscopy (LIBS) was assessed for predicting clay, organic matter (OM), cation exchange capacity (CEC), pH, base saturation (V), and extractable (ex-) nutrients in tropical soils. A set of 102 samples, collected from two agricultural fields, with broad ranges of fertility attributes were selected. Two contrasting data fusion approaches have been applied for modeling: (i) merging spectral data of different sensors followed by partial least squares regression (PLS), known as fusion before prediction; and (ii) applying the Granger and Ramanathan (GR) averaging approach, known as fusion after prediction. Results showed VNIR as individual technique to be the best for the prediction of clay and OM content (2.61 ≤ residual prediction deviation (RPD) ≤ 3.37), while the chemical attributes CEC, V, ex-P, ex-K, ex-Ca, and ex-Mg were better predicted (1.82 ≤ RPD ≤ 4.82) by elemental analysis techniques (i.e., XRF and LIBS). Only pH cannot be predicted regardless the technique. The attributes OM, V, and ex-P were best predicted using single-sensor approaches, while the attributes clay, CEC, pH, ex-K, ex-Ca, and ex-Mg were overall best predicted using multi-sensor approaches. Regarding the performance of the multi-sensor approaches, ex-K, ex-Ca, and ex-Mg, were best predicted (RPD of 4.98, 5.30, and 4.11 for ex-K, ex-Ca and ex-Mg, respectively) using two-sensor fusion approach (VNIR + XRF for ex-K and XRF + LIBS for ex-Ca and ex-Mg), while clay, CEC and pH were best predicted (RPD of 4.02, 2.63, and 1.32 for clay, CEC, and pH, respectively) with the three-sensor fusion approach (VNIR + XRF + LIBS). Therefore, the best combination of sensors for predicting key fertility attributes proved to be attribute-specific, which is a drawback of the data fusion approach. The present work is pioneering in highlighting benefits and limitations of the in tandem application of VNIR, XRF, and LIBS spectroscopies for fertility analysis in tropical soils.
1. Introduction
Spectro-analytical techniques that allow direct analysis of samples are promising for environmentally friendly soil fertility characterization [1]. Integrating these sensing techniques with laboratory analytical methods in hybrid laboratories [2] can modernize the traditional methods for soil analysis [3] that will enable a new paradigm in soil management. The maturation of direct analysis techniques—i.e., those requiring minimal or no sample preparation—would also enable more accurate mapping of agricultural fields by means of in situ or mobile laboratory analysis [4]. Proximal soil sensing technologies are also promising for precision agriculture [5] and pedometrics [6] approaches.
For optimal fertilizer management, spatio-temporal information of key soil fertility attributes as clay, organic matter (OM), cation exchange capacity (CEC), pH, base saturation (V), and extractable (ex-) nutrients is required [4]. Although studies using single sensing techniques have demonstrated the potential to assess some of the above-mentioned attributes [7], it is unlikely that a single sensor can completely characterize the soil fertility to a sufficient degree of accuracy [5,8]. Each sensor presents a perspective regarding the possibilities of predicting soil attributes, which is related with the fundamentals of each technique and its operation mode. Thus, multi-sensor approaches allow the integration of information related to distinct soil properties, yielding more comprehensive and accurate characterizations of key soil fertility attributes [9,10,11].
Visible and near infrared diffuse reflectance spectroscopy (VNIR), X-ray fluorescence spectroscopy (XRF), and laser-induced breakdown spectroscopy (LIBS) are multi-source techniques compatible with direct analysis of soil samples. The visible part of VNIR spectra is sensitive to valence electron excitations of some atoms and functional groups, while the near infrared part responds to non-fundamental vibrations of specific molecules [12]. In soil analysis, the spectral features present in the VNIR region are strictly related to mineralogical and organic components [13]. In turn, elemental analysis techniques, as XRF and LIBS, provide the characterization of the elemental constitution of a wide variety of chemical elements present in soil samples [14]. XRF and LIBS are also considered complementary [14]. For example, elements with atomic number (Z) lower than 12 are hardly detected by XRF technique; however, elements such C (Z = 6) and Na (Z = 11) can be detected by LIBS. Hence, this study hypothesizes that the combination of data provided by VNIR sensors with those from elemental analysis sensors—i.e., XRF and LIBS—might provide complete characterization of key soil fertility attributes [8,15].
Although VNIR, XRF, and LIBS techniques have been evaluated individually for predicting fertility attributes [16,17,18,19,20,21], the combination of these techniques is still at its early stages of development. Recent studies have evaluated different data fusion approaches for combining VNIR and XRF data for predicting fertility attributes [22,23,24]. To the best of our knowledge, only Xu et al. [11] combined VNIR, XRF, and LIBS sensors for predicting soil fertility attributes (OM, pH, ex-P, ex-K, ex-N, and total N). Although these studies show the synergy among these techniques, they do not make a comprehensive evaluation of all the key soil fertility attributes. Moreover, the combination of these three sensors have never been evaluated for the analysis of key fertility attributed in tropical soils.
Therefore, the present study aimed at assessing the performance of the individual and combined use of VNIR, XRF, and LIBS sensors for predicting key soil fertility attributes in tropical soils. Two contrasting approaches of data fusion modeling has been applied: (i) a front-end approach that combines the raw data of each sensor, followed by partial least squares (PLS); and (ii) a back-end approach, that applies an adapted approach from the Granger and Ramanathan (GR) averaging method. While the former method can be called fusion before prediction, the latter can be designated as fusion after prediction.
2. Materials and Methods
2.1. Soil Samples and Reference Analysis
A total of 102 samples were selected from the soil sample bank of the Precision Agriculture Laboratory (LAP) of the University of São Paulo (USP). These samples were selected because their chemical analyses conducted prior to this study yielded broad ranges of variation in the studied soil fertility attributes. These samples were from two agricultural fields with soils characterized as Lixisol and Ferralsol [25], which are common soil types found in Brazil’s tropical areas [26]. The coordinates of the Lixisol field and Ferrasol field are 22°41′57″ S and 47°38′33″ W and 14°06′05″ S and 57°45′58″ W, respectively. The samples were collected from 0–20 cm depth, and stored after air-drying for 48 h and sieving (≤2 mm). The samples were again subjected to laboratory analyses, which provided the results of the reference data (y-variables) that were used to build the predictive models using the different spectral datasets. The contents of clay, OM, CEC, pH, V, ex-P, ex-K, ex-Ca, and ex-Mg were determined following the methods described by Van Raij et al. [27], in which, extractable nutrients were determined using ion exchange resin extraction; OM content by oxidation with potassium dichromate solution, pH by calcium chloride solution, and clay by using the Bouyoucos hydrometer method. The CEC was calculated by the sum of the soil potential acidity determined via buffer solution (SMP) plus the sum of bases. The V was calculated by the ratio between the sum of bases and CEC. Interrelationships between different soil attributes were calculated using Pearson correlation matrix.
2.2. Sample Preparation
The data acquisition with XRF and VNIR sensors was performed on the dry and sieved samples. For the XRF measurements, about ten grams of each loose soil sample was placed in a polyethylene cup of 31-mm in diameter (Chemplex Industries Inc., Palm City, FL, USA), whose bottom was sealed with a 4-μm thick polypropylene film (SPEX CertiPrep Inc., Metuchen, NJ, USA). For the LIBS analysis, approximately eight grams of each soil sample was mixed (10% w w−1) with a binder material (microcrystalline cellulose, Merck, Darmstadt, Germany), grounded, and homogenized using a planetary ball mill (PM 200 mill, Retsch, Haan, Germany) for 20 min before they were finally pelletized.
2.3. VNIR Measurements and Spectra Pre-Processing
The spectrometer of Veris MSP3 (Veris Technologies, Salina, Kansas, USA) was used in benchtop mode to acquire the VNIR spectra. This system uses a tungsten halogen lamp as the energy source and two detection systems, a CCD array (USB4000, Ocean optics, Largo, FL, USA) and an InGaAs photodiode-array (C9914GB, Hamamatsu Photonics, Hamamatsu, Japan), to register spectra from 343 to 2222 nm, with ±5 nm of spectral resolution. The same spectrometer used in this study was described elsewhere by Knadel et al. [28] and Debaene et al. [29]. As a quality control, the instrument automatically checks its spectrum intensity using four factory reference materials during its initialization. The sensor was self-calibrated, by making a dark and white reference measurements, before each spectra acquisition. For laboratory scanning, the samples were placed in a sample holder that prevents ambient light. Each sample was scanned in triplicate, by repositioning the sample after each reading to account for the micro heterogeneity of the sample [30]. Before the spectra pre-processing steps, the replicates were averaged.
The raw spectra were first reduced from 343–2222 nm to 437–2149 nm range due to noise at the spectrum edges. Thereafter, the link between the two detectors, an artifact at 1040 nm, was corrected following the method proposed by Mouazen et al. [31]. These spectra were then pre-processed following the successive order: standard normal variate (SNV) > maximum normalization > first derivative with Savitzky–Golay > smoothing with Savitzky–Golay. These four pre-processing algorithms are frequently adopted in the literature. The SNV is a scattering correction method that is applied to soil VNIR spectra to remove the multiplicative interferences of particle size [32]. The maximum normalization was carried out to get all spectral data to approximately the same scale [33], while the first derivative was applied to improve the signal-to-noise ratio by enhancing weak spectral features [34]. The smoothing approach was used to remove noise and improve the signal-to-noise ratio [35,36] further. All data pre-processing steps were performed using the Unscrambler® version 10.5.1 (Camo AS, Oslo, Norway).
2.4. XRF Measurements and Spectra Pre-Processing
A portable device Tracer III-SD model (Bruker AXS, Madison, Wisconsin, EUA) was used for XRF data acquisition. This instrument has a 4 W Rh X-ray tube and a Peltier-cooled Silicon Drift Detector with 2048 channels. The X-ray tube was configured for voltage and current of 35 kV and 7 μA, respectively [18]. No filter was used and the scanning time was 90 s, which was performed under atmospheric pressure [18]. Three readings were taken from each soil specimen at three different spots, and these were then averaged to be considered for spectra pre-processing and modeling.
The acquired spectra were normalized by the detector live time and evaluated in counts of photons per second (cps). Considering the area under each peak, 12 spectral lines (K-lines of Al, Si, K, Ca, Ti, Mn, Fe, Ni, and Cu, and the scattering peaks Rh-Lα Thomson, Rh-Kα Compton, and Rh-Kα Thomson) were selected to be used as explanatory variables, following the criteria recommended by Tavares et al. [37]. Finally, the K-lines of Al, Si, K, Ca, Ti, Mn, Fe, Ni, and Cu were normalized by the Compton peak. XRF emission lines were obtained using Artax® software (Bruker AXS, Madison, USA), whose pre-processing was conducted in Excel 2016 (Microsoft Corporation, Redmond, WA, USA).
2.5. LIBS Measurements and Spectra Pre-Processing
A benchtop LIBS system composed by a pulsed Nd:YAG laser at 1064 nm, generating 5 ns pulses of up to 365 mJ (Brilliant, Quantel, France) and an ESA 3000 spectrometer (LLA Instruments GmbH, Berlin, Germany) was used. The laser was focused on the sample surface by a convergent lens. Pressed pellets were placed into a plastic sample holder positioned in a two axes manually-controlled translation stage, movable in the plane orthogonal to the laser direction. A laminar stream of argon (5.0 L min−1) was continuously fed from the bottom of the sample holder in order to dislocate the atmospheric air around the sample surface. The emission from the plasma was collected by using a telescope composed of 50 mm and 80 mm focal length fused silica lenses and coupled to the entrance slit of the spectrometer using an optical fiber. The collection angle with respect to the laser optical axis was 25°. This spectrometer registers spectra from 200 to 780 nm with a resolution oscillating from 5 pm at 200 nm to 19 pm at 780 nm (totaling 53,717 variables). The same LIBS system used in this study was described elsewhere by Nunes et al. [38].
LIBS experimental conditions were carried out with 65 mJ laser pulses, 19.5 cm of lens-to-sample distance (180 µm spot size providing 255 J cm−2 laser fluence), 15 accumulated laser pulses, 2 µs of delay time, and 7 µs of integration time gate. These instrumental conditions were optimized in initial tests to obtain the maximum signal-to-noise ratio of the emission lines of interest, as suggested by Nunes et al. [39]. In order to consider the analytes micro-heterogeneity in the test samples, 21 laser shots were applied at different positions of the pellet surface, and the corresponding analytical signals were averaged in one reading to be used for the following pre-processing and modeling steps.
Initially, the LIBS spectra were pre-processed by downscaling them from 200 to 540 nm, which is a region containing the most valuable and high-intensity emission lines [40]. Afterwards, the interval successive projection algorithm (iSPA) was applied to select significant variables [41]. To employ this algorithm, the LIBS spectra from 200 to 540 nm were divided into 160 intervals of 243 variables. The LIBS spectra were pre-processed in MATLAB (MathWorks Inc., Natick, MA, USA) using the script developed by Gomes et al. [41]. The regions selected for each fertility attribute are shown in Table A1 (Appendix A). The mean raw spectra acquired with the VNIR, XRF, and LIBS technique are shown in Figure 1.
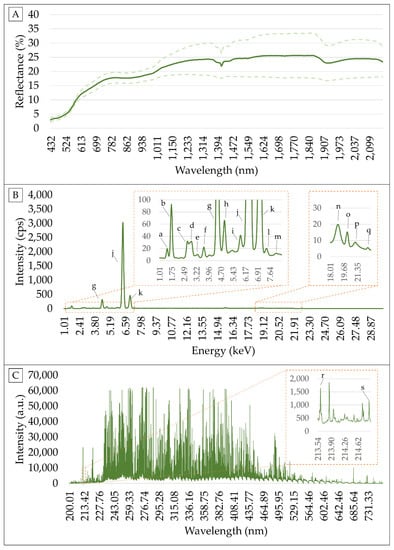
Figure 1.
Mean spectra measured with visible and near infrared (VNIR) (A), X-ray fluorescence (XRF) (B), and (LIBS) (C) sensors. Snapshot of some XRF and LIBS emission lines are also shown. VNIR spectra are presented with their standard deviation (dash line) above and below the mean curve. The emission lines identified with the following letters correspond to: Al-Kα (a), Si-Kα (b), Rh-Lα Thomson (c), Ar-Kα (d), K-Kα (e), Ca-Kα (f), Ti-Kα (g), Ti-Kβ (h), Mn-Kα (i), Fe-Kα (j), -Fe-Kβ (k), Ni-Kα (l), Cu-Kα (m), Rh-Kα Compton (n), Rh-Kα Thomson (o), Rh-Kβ Compton (p), Rh-Kβ Thomson (q), P I 213.62 (r), and P I 214.91 (s). Arbitrary units and counts of photons per second have been abbreviated as a.u. and cps, respectively.
2.6. Modeling
After pre-processing, spectral variables were associated with the laboratory measured soil attributes by establishing predictive models. This was done using the spectral data of each single-sensor and for all possible combinations of sensors, through the following associations: VNIR + XRF, VNIR + LIBS, XRF + LIBS, and VNIR + XRF+ LIBS. The calibration and validation subsets comprised, respectively, of 70% and 30% of the total number of samples, which were divided using the Kennard–Stone algorithm [42] executed on the measured soil attributes. The prediction performance was evaluated through the determination coefficient (R²), root mean square error (RMSE), and the residual prediction deviation (RPD). Based on the RPD values, the prediction quality of developed models were classified into four classes adapted from Chang et al. [43]: poor models (RPD < 1.40), reasonable models (1.40 ≤ RPD < 2.00), good models (2.00 ≤ RPD < 3.00), and excellent models (RPD ≥ 3.00). The relative improvement (RI) of the predictions accomplished by means of the multi-sensor approaches were also calculated, in terms of percentage of RMSE [44,45], and compared to the best prediction obtained using the single-sensor (VNIR, XRF, and LIBS, individually) and two-sensor approach (VNIR + XRF, VNIR + LIBS, and XRF + LIBS).
2.6.1. Single-Sensor Predictive Models
The predictive models using VNIR and LIBS data individually were established by means of PLS regression [16,21]. The number of latent variables adopted for each PLS model was determined for the model in cross-validation that resulted in the lowest RMSE. For the XRF, models were calibrated with multiple linear regression (MLR), as suggested by Tavares et al. [37]. All the calibrations and validations were performed using the Unscrambler software, version 10.5.1 (Camo AS, Oslo, Norway).
2.6.2. Data Fusion Approaches
Two data fusion approaches were used to build the predictive models using multi-sensor data. The first was designated as spectral fusion (SF) method. It is a front-end approach, consisting of merging the pre-processed spectral data of each combination of sensor (VNIR + XRF, VNIR + LIBS, XRF + LIBS, and VNIR + XRF + LIBS) in one matrix. The merged data were scaled by the standard deviation to create an even distribution of variances, before they were subjected to PLS regression to develop a model for each soil attribute. The number of latent variables for each PLS model was determined according to the leave-one-out cross-validation that resulted in the lowest RMSE.
The second data fusion method was adapted from the Granger and Ramanathan (GR) averaging method [46], as performed by Tavares et al. [9]. In the present study, the GR approach consisted of calibrating a multiple linear regression (MLR) with independent variables being the predictions made with the sensors, plus the prediction made with the multi-sensor merged data (i.e., SF approach). For example, for the combination between XRF and VNIR sensors, the GR method was applied according to Equation (1)
where Y is the soil property to be estimated; XVNIR and XXRF are the predictions made by VNIR and XRF single-models, respectively; XSF is the prediction made by the SF approach using the VNIR and XRF merged data; W0, WVNIR, WXRF, and WSF are the parameters of the MLR determined by least squares method, where the first parameter is the value of the line intercept and the others are the weights of the predictions.
Y = W0 + (WVNIR ∙ XVNIR) + (WXRF ∙ XXRF) + (WSF ∙ XSF),
Equation (1) was also applied for combinations of LIBS + VNIR, LIBS + XRF, and VNIR + XRF + LIBS. All data fusion models were calibrated and validated using the Unscrambler software, version 10.5.1 (Camo AS, Oslo, Norway).
3. Results
3.1. Characterisation of the Laboratory Measured Soil Properties
The boxplots in Figure 2 show that the range and standard deviation (SD) of soil attributes in the calibration set are close to those in the validation set, which is expected since we applied Kennard Stone method in sample split to avoid undesirable influences on the prediction accuracy that are not sensor-related [12,47]. If different range and SD exist between the validation and the calibration sets, this would result in poor prediction of concentrations that are not accounted for in the calibration set.
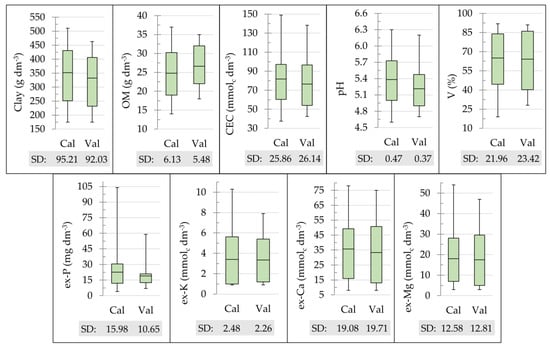
Figure 2.
Boxplot of the clay, organic matter (OM), cation exchange capacity (CEC), pH, base saturation (V), and extractable (ex-) P, K, Ca, and Mg content for the calibration (Cal; n = 68) and validation (Val; n = 34) dataset. The standard deviation (SD) for each dataset was also shown.
Figure 3 shows the correlation matrix of the soil fertility attributes. These interrelationships aid to understand reasons of successful determination of soil attributes having only indirect spectral signatures in the studied sensors. For example, pH or V has no emission lines in XRF and LIBS spectra, nor direct spectral signature in the VNIR range. In this study, it is important to highlight the following interrelationships: (i) CEC, V, ex-Ca, and ex-Mg were closely related with one another, showing Pearson correlations ranging from 0.85 to 0.94; (ii) ex-K had strong correlations with clay and V (r = 0.73 for both); (iii) clay showed strong correlations with V, ex-K, and ex-Ca (0.73 ≤ r ≤ 0.82); (iv) OM content was moderately correlated with all attributes (0.44 ≤ r ≤ 0.62), except for ex-P and pH (r of 0.06 and −0.02, respectively); (v) pH presented moderate correlations with CEC, V, ex-K, ex-Ca, and ex-Mg (0.40 ≤ r ≤ 0.50); and (vi) ex-P was the attribute that presented weaker correlations (−0.23 ≤ r ≤ 0.06), indicating P as an independent attribute from the other attributes, with potential of poor prediction using spectroscopic methods that do not present spectral response for P (e.g., VNIR and XRF).
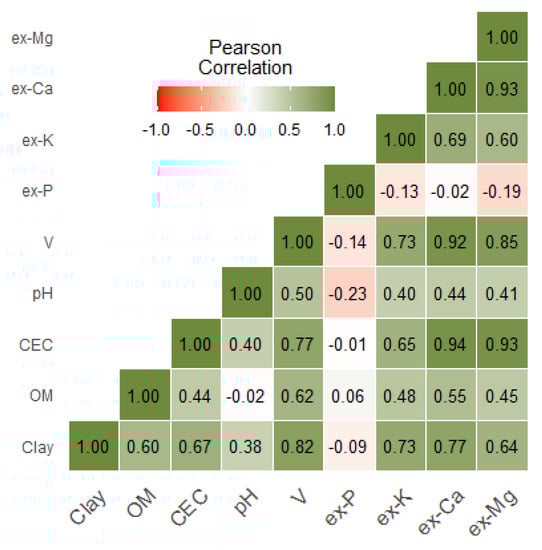
Figure 3.
Correlation matrix of the studied soil fertility attributes. Organic matter, cation exchange capacity, base saturation, and extractable nutrients were abbreviated as OM, CEC, V, and ex-P, ex-K, ex-Ca, and ex-Mg, respectively.
3.2. Prediction Performances of Single-Sensor and Data Fusion Approaches
The prediction results of individual and combined application of VNIR, XRF, and LIBS sensors are presented in Table 1 (see details in Table A2, in the Appendix A). Considering the single-sensor prediction performance, VNIR presented excellent and good prediction performance for clay (RPD = 3.37), OM (RPD = 2.61), and V (RPD = 2.26). Among the three sensors, VNIR showed the lowest RMSE for clay and OM prediction (Table A2). The XRF sensor showed good prediction performance for clay (RPD = 3.13), CEC (RPD = 2.57), and ex-Mg (RPD = 2.99), and excellent predictions for V (RPD = 4.18), ex-K (RPD = 4.26), and ex-Ca (RPD = 4.82). Meanwhile, the LIBS sensor achieved excellent prediction performance for clay (RPD = 3.06), V (RPD = 4.27), ex-Ca (RPD = 4.07), and ex-Mg (RPD = 3.65), and good prediction performance for OM (RPD = 2.14). Among the three sensors when used individually, XRF exhibited the lowest RMSE for CEC, ex-K and ex-Ca prediction, while LIBS showed the lowest RMSE for the prediction of pH, V, ex-P, and ex-Mg (Table A2). The pH was the only attribute that could not be satisfactorily predicted (RPD < 1.12) by any of the single-sensor approaches, while the ex-P was only satisfactorily predicted by LIBS (RPD = 1.82).

Table 1.
Residual prediction deviation (RPD) obtained for the validation set (n = 34) of clay, organic matter (OM), cation exchange capacity (CEC), pH, base saturation (V), and extractable (ex-) nutrients (ex-P, ex-K, ex-Ca, and ex-Mg) using the visible and near infrared (VNIR), X-ray florescence (XRF), and laser-induced breakdown spectroscopy (LIBS) data individually and different combination of them through spectra fusion (SF) and Granger and Ramanathan (GR) approaches.
Table 2 shows the RI for the predictions performed using multi-sensor data through the two applied data fusion approaches (SF and GR), compared with the best single-sensor approach. This indicator shows the improvement (when positive) or the deterioration (when negative) obtained in the sensor fusion relative improvement [44,45]. The attributes OM, V, and ex-P were better predicted by the individual than combined sensors. All the other attributes (clay, CEC, pH, ex-K, ex-Ca, and ex-Mg) were better predicted by multi-sensor approaches.
Table 2.
Relative improvement (RI) and root-mean-square error (RMSE) achieved for each multi-sensor approach using spectra fusion (SF) and Granger and Ramanathan (GR) data fusion methods, in comparison with the best prediction obtained using the single-sensor approaches.
The RI values for clay prediction ranged from −11.1% to 16.3%, for the SF approach, and from −3.2% to 15.2%, for the GR approach. For CEC prediction, the RI ranged from −31.1% to 1.4%, using SF, and from −32.0% to 2.3%, using GR. Although the pH models did not perform satisfactorily, their RI values ranged from −6.5% to 14.8% and 1.9% to 15.3% for SF and GR, respectively. For the ex-K prediction, the RI ranged from −117.4% to −12.6% for SF, and −104.5% to 14.4% for GR. For ex-Ca, the RI varied between −70.2% and 6.2% for SF, and between −23.9% and 9.2% for GR. For ex-Mg prediction, the RI values ranged from −28.5% to 24.2%, using SF, and from −12.4% to 27.2%, using GR. VNIR + XRF led to positive improvement in the prediction of clay, pH and ex-K (with GR only), although improvements were larger in VNIR + LIBS for clay and pH only. As expected, the fusion of XRF and LIBS improved the prediction of the extractable nutrients mainly, ex-K, ex-Ca, and ex-Mg, with minor improvement in CEC, with SF, and pH, with GR (Table 2). The fusion of the three sensors have scored the largest number of improvements with positive RI values for all studied attributes except for OM, V, and ex-P. In general, the performance of the back-end data fusion strategy using the GR approach outperformed the SF approach in 72.2% of cases. In summary, the improvement in predictive performance varied according to the combination of sensors as well as the data fusion strategy used; there was no one optimal approach for the prediction of all the attributes analyzed.
Table 3 compares the prediction performances of the three-sensor approach with the best performances obtained with the two-sensor and the single-sensor approaches. Results revealed that the best predictions of OM, V, and ex-P were obtained using the single-sensor approach (with VNIR for OM, and with LIBS for V and ex-P). Predictions of these attributes using two sensors showed degradation in predictive performance, with the best two-sensor approach showing an RMSE increment of 7.1%, 0.7%, and 18.2% for OM, V, and ex-P, respectively. A similar deterioration in the prediction performance of these attributes (OM, V, and ex-P) was also observed by the three-sensor approach, with an increase in the prediction error oscillating between 6.9% and 74.2% in comparison to the best performing single-sensor approach.
Table 3.
Relative improvement (RI) achieved for the predictions using the best three-sensor approach in comparison with the best prediction obtained using the two-sensor, and the single-sensor approaches. The root mean square error (RMSE) of each approach was also presented.
Concerning ex-K, ex-Ca, and ex-Mg, better prediction results were obtained when using the two-sensor approach. The VNIR + XRF combinations were the most promising for ex-K, while XRF + LIBS stood out for ex-Ca and ex-Mg. The performance increment obtained by the above-mentioned two-sensor approaches, relatively to the best single-sensor strategy, was 14.4%, 9.2%, and 27.2% for ex-K, ex-Ca, and ex-Mg, respectively. When combining a third sensor, the predictive performance was degraded, with a reduction of 2.9%, 6.5%, and 6.8% for ex-K, ex-Ca, and ex-Mg, respectively, relative to the best two-sensor approach.
Concerning the clay, CEC, and pH the best prediction performances were recorded by the three-sensor approach, which reduced the error to a range between 2.3% and 16.3%, in comparison to the best single-sensor approach, and between 0.9% and 2.2%, relative to the best approach using two sensors.
Due to the presence of synergistic information in the data, improved predictions were obtained for a large number of attributes (six out of nine) when using the three-sensor approach. The combination between XRF and LIBS showed synergy for the prediction of five out of nine attributes, while both the combinations VNIR + LIBS and VNIR + XRF showed synergy for three out of nine attributes.
4. Discussion
Soil spectral analyses via the tandem use of VNIR, XRF, and LIBS sensors have two potential benefits: (i) extend the set of predicted soil attributes in comparison with single-sensor approaches; and (ii) improve the models’ predictive performance by exploring synergy in the data through data fusion approaches, both are discussed in Section 4.1 and Section 4.2, respectively.
4.1. Individual Performance of VNIR, XRF, and LIBS Sensors: Coverage of Key Soil Fertility Attributes
The results observed in this work show that the tandem application of VNIR, XRF, and LIBS techniques, allows extending the number of predicted fertility attributes with optimal performances (Table A3, in the Appendix A). For individual sensor, limited number of attributes could be detected and optimal predictions are technology specific. For example, excellent and good predictions could be achieved for clay and OM, respectively, with both the VNIR and LIBS sensors; although, the VNIR sensor allowed more accurate predictions of these attributes, since both attributes have direct spectral responses in the NIR range [48]. A similar trend was observed for the chemical attributes CEC, V, ex-K, ex-Ca, and ex-Mg, whose optimal prediction performances were obtained with elemental analysis sensors (with RPD oscillating between 2.57 and 4.82) due to the fact these attributes are closely related to the emission lines present in these sensors.
The LIBS spectra presented emission lines for C, P, and Mg (C I 247.856 nm, P I 213.6182 and P I 214.914 nm, Mg I 277.983, and Mg I 285.213 nm), elements not observable in the corresponding XRF spectra. The presence of these emission lines explains the better performance of LIBS for OM, ex-P, and ex-Mg prediction than XRF. The XRF spectra showed K emission line (in 3.31 keV), which was not observed in the LIBS data, explaining its superior performance for ex-K prediction. The excellent ex-Ca prediction of both elemental techniques is well supported by appropriate detection of Ca emission lines (Ca Kα 3.69 keV for XRF, and Ca II 315.887 nm and Ca II 317.933 nm for LIBS). The presence of Ca emission lines also explains the similar performance for V and CEC prediction obtained by both XRF and LIBS (good predictions for CEC and excellent for V), since both attributes showed strong correlation with the ex-Ca (r ≥ 0.92; Figure 3).
The attributes with the worst predictive performance were the ex-P and the pH. Regarding ex-P, LIBS was the only sensor to present a satisfactory prediction for this attribute. Although LIBS shows well defined emission lines for P, total contents of P may not always correlate with ex-P contents due to the complex chemistry of this element in tropical soils [49]. P in tropical soils is commonly associated, in a non-extractable manner, with Fe and Al oxides [50], which makes the modeling of ex-P via elemental analysis techniques challenging [18,19]. A possible alternative to improve the predictive performance of ex-P and pH models is through the integration of electrochemical sensors (e.g., ion-selective electrodes (ISE) and the ion-sensitive field-effect transistor (ISFET)) to the multi-sensor array used, since with the former technology ensure direct soil analysis of the extractable contents of some ions (e.g., H+ and PO43−) [4,7].
In general, the predictive capability of key soil fertility attributes decreased as follows: LIBS > XRF > VNIR. These results differed from those presented by Xu et al. [11], which is the only research that explored VNIR, XRF, and LIBS sensors for predicting soil fertility attributes. The authors obtained better prediction performances with the VNIR sensor, in comparison to the XRF and LIBS sensors, for OM, pH, ex-P, ex-K, and ex-N. Our results, however, are in line with those of other research carried out in tropical soils that also evaluated the standalone use of VNIR [2,51,52,53,54] and XRF [19,55,56,57,58] techniques. Studies using LIBS sensors for the assessment of fertility attributes are incipient in tropical soils. However, the satisfactory performance obtained for clay is supported by that obtained by Villas-Boas et al. [59]. In turn, our poor pH predictions contrasted with the satisfactory predictions obtained by Ferreira et al. [60].
4.2. Combined Performance of VNIR, XRF, and LIBS Sensors: Synergy for Predicting Key Soil Fertility Attributes
The prediction of OM, V, and ex-P did not show any synergy by the multi-sensor approaches evaluated in this study, as they were better predicted by each sensor individually. However, improved prediction performance was obtained for all the other attributes (clay, CEC, pH, ex-K, ex-Ca, and ex-Mg), with RI ranging between 0.2% and 27.2% when using at least one of the multi-sensor approaches. The absence of synergy in the information provided by VNIR and elemental analysis sensors has already been reported in the literature for pH, ex-K, and OM [9,11]. Conversely, O’Rourke et al. [44], assessing the combination XRF + VNIR in Australian soils, reported RI ranging from 15% to 44% for clay, CEC, pH, ex-K, ex-Ca, and ex-Mg. Also evaluating data fusion between VNIR and XRF sensors, Zhang and Hartemink [24] obtained RI values oscillating from 3% to 20% for the prediction of clay, pH, and total carbon in North American soils. A similar study achieved RI of 26% for CEC in Chinese soils [22]. Also in Chinese soils, Xu et al. [10] reached an RI varying between 4% and 35% for OM prediction by the combination of LIBS and attenuated total reflectance Fourier-transform mid-infrared spectroscopy (FTIR-ATR).
In general, the prediction quality of the studied attributes by the sensor fusion decreased in the order of: VNIR + XRF + LIBS > XRF + LIBS > VNIR + LIBS > VNIR + XRF. Our results showed that there was no unique optimal sensor combination for predicting all the key soil fertility attributes, and that this is attribute specific. A similar behavior was also observed by Xu et al. [11]. Thus, the performance of different combinations of sensors should be evaluated by trial-and-error and that it is too soon to establish a clear trend, which requires further research. This means that data fusion is in its infancy stage, and more works will be necessary to recommend the optimal set of sensors for one or a set of soil attribute.
This study was conducted using 102 soil samples with broad variation of fertility attributes. They belong to Lixisols and Ferralsols, which are representative and common types of soil in Brazilian tropical agricultural lands. In addition, this pioneering evaluation provided useful information to help PSS users to understand the advantages and drawbacks of the combined use of VNIR, XRF, and LIBS sensors for soil fertility analysis. Nevertheless, future studies should consider larger datasets that account for other types of soils, soil mineralogy, textural classes, concentration range, and different agricultural practices.
4.3. Operational Aspects Related to Sample Preparation
It is important to consider practical aspects of sample preparation necessary to ensure the application of each technique. The VNIR and XRF techniques are less demanding in terms of sample preparation, and can be applied on loose soil samples (i.e., dried and sieved with 2 mm of particle size) without major impacts on the sensors performance [30,51]. However, the LIBS demands further sample preparation steps including particle size reduction with grinding, the addition of binding agent, followed by pressing to create pellets that are necessary for optimal LIBS performance. Pelletizing promotes a more reproducible laser–sample interaction that is necessary to maintain the stoichiometric proportion of the craters formed by the laser pulses [61]. These extra sample preparation steps to ensure the collection of reliable data make it challenging to apply LIBS to run analyses directly in the field [62]. However, despite the extra time consigned to sample preparation, it would not make it unfeasible to use LIBS in controlled environments (e.g., hybrid laboratories and mobile laboratories) that enable the execution of such sample conditioning [4].
5. Conclusions
This study shows that the fusion of data from visible and near infrared diffuse reflectance spectroscopy (VNIR), X-ray fluorescence spectroscopy (XRF), and laser-induced breakdown spectroscopy (LIBS) can extend the number of fertility attributes predicted with optimal performance, as well as improve the prediction accuracy by exploiting the synergy through data fusion techniques.
Comparing among the individual sensor performance, the VNIR technique performed best for the prediction of clay and organic matter (OM) (2.61 ≤ RPD ≤ 3.37), while the elemental analysis techniques showed better performance for the prediction of cation exchange capacity (CEC), base saturation (V), and the extractable (ex-) K, Ca, and Mg (2.61 ≤ RPD ≤ 3.37). The LIBS stood out for V, ex-P and ex-Mg prediction, while the XRF resulted in optimal predictions for CEC, ex-K, and ex-Ca. The attributes with the worst predictive performance were the ex-P (0.80 ≤ RPD ≤ 1.82) and pH (RPD ≤ 1.12), with the latter performing poorly in all individual and combined sensor options tested in this study.
Regarding the performance of the multi-sensor approaches, ex-K, ex-Ca, and ex-Mg, were better predicted when using two sensors (VNIR + XRF for ex-K, and XRF + LIBS for ex-Ca and ex-Mg), while clay, CEC and pH were best predicted with the three-sensor (VNIR + XRF + LIBS). However, the combined use of sensors did not always lead to improvement in the prediction results. For instance, the best sensing method for OM, V, and ex-P prediction was the single-sensor approach, showing that there was no synergy between the evaluated sensors for the prediction of these attributes. Furthermore, the best combination of sensors for predicting key fertility attributes proved to be attribute-specific, which is a drawback of the in tandem application of these analytical techniques. Another drawback to integrate the addressed techniques is the need for different sample preparations, where LIBS needs extra steps to conform the loose soil samples into pellets.
Finally, the present work evidenced benefits and limitations of the in tandem application of VNIR, XRF, and LIBS spectroscopies for fertility analysis in tropical soils. Further research should be encouraged to improve analytical protocols using multi-sensor approaches, to enable practical, environmentally friendly, and accurate analysis, allowing its incorporation into future hybrid laboratories.
Author Contributions
Conceptualization, T.R.T. and J.P.M.; Methodology, T.R.T., M.C.F.W., L.C.N. and J.P.M.; Validation, H.W.P.d.C., A.M.M. and J.P.M.; Formal analysis, T.R.T. and M.C.F.W.; Investigation, T.R.T.; Resources, T.R.T.; Data curation, T.R.T.; Writing—original draft preparation, T.R.T. and M.C.F.W.; Writing—review and editing, L.C.N., H.W.P.d.C., A.M.M., F.J.K. and J.P.M.; Visualization, T.R.T.; Supervision, H.W.P.d.C., A.M.M., F.J.K. and J.P.M.; Project administration, T.R.T. and J.P.M.; Funding acquisition, T.R.T., J.P.M., F.J.K. and H.W.P.d.C. All authors have read and agreed to the published version of the manuscript.
Funding
The T.R.T. was funded by São Paulo Research Foundation (FAPESP), grant number 2017/21969-0; and also partially funded by the Brazilian Federal Agencies: Coordination for the Improvement of Higher Education Personnel (CAPES)–Finance Code 001, and the National Council for Scientific and Technological Development (CNPq). Soil fertility tests were funded by CNPq—“Edital de Chamada Universal”, grant number 458180/2014-9. XRF facilities were funded by FAPESP, grant number 2015-19121-8, and “Financiadora de Estudos e Projetos” (FINEP) project “Core Facility de suportes às pesquisas em Nutrologia e Segurança Alimentar na USP”, grant number 01.12.0535.0. LIBS facilities were funded by FAPESP (FAPESP 04/15965-2), grant number 2015-19121-8. Authors also acknowledge the financial support received from the Research Foundation-Flanders (FWO) for Odysseus I SiTeMan Project (no. G0F9216N). H.W.P. Carvalho is the recipient of a research productivity fellowship from the Brazilian National Council for Scientific and Technological Development (CNPq) (grant no. 306185/2020-2).
Institutional Review Board Statement
Not applicable.
Informed Consent Statement
Not applicable.
Acknowledgments
We would like to thank the technician Eduardo de Almeida, from the Center for Nuclear Energy in Agriculture of the University of São Paulo (USP-CENA), for the support with X-ray fluorescence equipment; and Fábio L. Melquiades and Felipe R. dos Santos, both from the Londrina State University (UEL), for the support with the LIBS data pre-processing.
Conflicts of Interest
The authors declare no conflict of interest.
Appendix A
Table A1.
Intervals of variables selected by the interval successive projection algorithm (iSPA) in the LIBS spectra for the predictive modeling of each soil fertility attribute.
Table A1.
Intervals of variables selected by the interval successive projection algorithm (iSPA) in the LIBS spectra for the predictive modeling of each soil fertility attribute.
| Attribute | Number of Intervals Selected | Spectral Ranges of the Selected Intervals (nm) |
|---|---|---|
| Clay | 3 | 220.84–222.21, 246.77–248.29, and 251.37–252.94 |
| OM ¹ | 1 | 295.08–296.92 |
| CEC ² | 52 | 201.31–272.37, 287.89–298.73, and 414.15–416.63 |
| pH | 3 | 220.84–222.21, 237.82–239.27, and 391.78–394.22 |
| V ³ | 57 | 201.31–272.37, 279.18–300.60, and 396.59–399.10 |
| ex-P 4 | 1 | 214.14–215.44 |
| ex-K 4 | 1 | 375.28–377.53 |
| ex-Ca 4 | 1 | 389.37–391.77 |
| ex-Mg 4 | 1 | 284.36–286.14 |
1 Organic matter; 2 cation exchange capacity; 3 base saturation; 4 extractable (ex-) nutrients.
Table A2.
Prediction results of the validation set (n = 34) obtained using single VNIR, XRF, and LIBS data alone and using multi-sensor data, combined through spectra fusion (SF) and Granger and Ramanathan (GR) approaches.
Table A2.
Prediction results of the validation set (n = 34) obtained using single VNIR, XRF, and LIBS data alone and using multi-sensor data, combined through spectra fusion (SF) and Granger and Ramanathan (GR) approaches.
| Clay | OM ¹ | CEC ² | pH | V ³ | ex-P 4 | ex-K 4 | ex-Ca 4 | ex-Mg 4 | |
|---|---|---|---|---|---|---|---|---|---|
| R² | |||||||||
| VNIR | 0.93 | 0.86 | 0.51 | 0.19 | 0.80 | 0.07 | 0.74 | 0.68 | 0.52 |
| XRF | 0.92 | 0.74 | 0.88 | 0.34 | 0.95 | 0.01 | 0.95 | 0.96 | 0.89 |
| LIBS | 0.89 | 0.81 | 0.84 | 0.31 | 0.94 | 0.72 | 0.76 | 0.94 | 0.93 |
| VNIR + XRF – SF | 0.94 | 0.83 | 0.77 | 0.36 | 0.93 | 0.14 | 0.91 | 0.89 | 0.82 |
| VNIR + XRF – GR | 0.94 | 0.83 | 0.77 | 0.39 | 0.95 | 0.13 | 0.96 | 0.94 | 0.86 |
| VNIR + LIBS – SF | 0.95 | 0.84 | 0.85 | 0.45 | 0.93 | 0.32 | 0.75 | 0.93 | 0.89 |
| VNIR + LIBS – GR | 0.95 | 0.84 | 0.84 | 0.45 | 0.92 | 0.59 | 0.77 | 0.94 | 0.92 |
| XRF + LIBS – SF | 0.90 | 0.75 | 0.85 | 0.24 | 0.93 | 0.61 | 0.94 | 0.96 | 0.94 |
| XRF + LIBS – GR | 0.92 | 0.86 | 0.82 | 0.35 | 0.93 | 0.55 | 0.96 | 0.96 | 0.94 |
| VNIR + XRF + LIBS – SF | 0.95 | 0.84 | 0.85 | 0.46 | 0.94 | 0.31 | 0.83 | 0.94 | 0.92 |
| VNIR + XRF + LIBS – GR | 0.95 | 0.85 | 0.86 | 0.47 | 0.93 | 0.57 | 0.96 | 0.96 | 0.94 |
| RMSE | |||||||||
| vis-NIR | 27.32 | 2.10 | 18.66 | 0.34 | 10.38 | 12.05 | 1.20 | 10.98 | 8.85 |
| XRF | 29.40 | 3.01 | 10.19 | 0.33 | 5.60 | 13.27 | 0.53 | 4.09 | 4.28 |
| LIBS | 30.03 | 2.56 | 10.69 | 0.33 | 5.49 | 5.84 | 1.10 | 4.85 | 3.51 |
| VNIR + XRF – SF | 26.19 | 2.29 | 13.35 | 0.30 | 6.38 | 11.81 | 0.73 | 6.97 | 5.51 |
| VNIR + XRF – GR | 26.05 | 2.33 | 13.45 | 0.29 | 5.52 | 11.91 | 0.45 | 5.06 | 4.82 |
| VNIR + LIBS – SF | 23.57 | 2.30 | 10.26 | 0.28 | 6.34 | 9.97 | 1.16 | 5.32 | 4.48 |
| VNIR + LIBS – GR | 23.18 | 2.25 | 10.49 | 0.28 | 6.42 | 7.20 | 1.09 | 5.07 | 3.90 |
| XRF + LIBS – SF | 30.35 | 2.98 | 10.17 | 0.35 | 6.34 | 6.90 | 0.60 | 3.84 | 3.25 |
| XRF + LIBS – GR | 28.19 | 2.30 | 10.89 | 0.32 | 6.56 | 7.39 | 0.50 | 3.72 | 3.12 |
| VNIR + XRF + LIBS – SF | 22.88 | 2.27 | 10.04 | 0.28 | 6.04 | 10.17 | 0.93 | 4.96 | 3.70 |
| VNIR + XRF + LIBS – GR | 24.68 | 2.25 | 9.95 | 0.28 | 6.22 | 7.47 | 0.47 | 3.98 | 3.34 |
1 Organic matter; 2 cation exchange capacity; 3 base saturation; 4 extractable (ex-) nutrients (ex-P, ex-K, ex-Ca, and ex-Mg). The coefficient of determination (R2) values for the same soil attribute were compared and presented on green scale, highlighting the highest values within each soil attribute. The root-mean-square error (RMSE) are given in g dm−3 for clay and OM; in mmolc dm−3 for CEC, ex-K, ex-Ca, and ex-Mg; in % for V; and, for ex-P, the RMSE was given in mg dm−3.
Table A3.
Qualitative interpretation * of the residual prediction deviation (RPD) performance obtained for each of the evaluated approaches using single-sensor (VNIR, XRF, and LIBS) and multi-sensor (VNIR + XRF, VNIR + LIBS, XRF + LIBS, and VNIR + XRF + LIBS).
Table A3.
Qualitative interpretation * of the residual prediction deviation (RPD) performance obtained for each of the evaluated approaches using single-sensor (VNIR, XRF, and LIBS) and multi-sensor (VNIR + XRF, VNIR + LIBS, XRF + LIBS, and VNIR + XRF + LIBS).
| VNIR | XRF | LIBS | VNIR + XRF | VNIR + LIBS | XRF + LIBS | VNIR + XRF + LIBS | |
|---|---|---|---|---|---|---|---|
| Clay | Excel. | Excel. | Excel. | Excel. | Excel. | Excel. | Excel. |
| OM ¹ | Good | Reason. | Good | Good | Good | Good | Good |
| CEC ² | Reason. | Good | Good | Reason. | Good | Good | Good |
| pH | Poor | Poor | Poor | Poor | Poor | Poor | Poor |
| V ³ | Good | Excel. | Excel. | Excel. | Excel. | Excel. | Excel. |
| ex-P 4 | Poor | Poor | Reason. | Poor | Reason. | Reason. | Reason. |
| ex-K 4 | Reason. | Excel. | Good | Excel. | Good | Excel. | Excel. |
| ex-Ca 4 | Reason. | Excel. | Excel. | Excel. | Excel. | Excel. | Excel. |
| ex-Mg 4 | Reason. | Good | Excel. | Good | Excel. | Excel. | Excel. |
* The qualitative interpretation was adapted from Chang et al. [43] by using the following classes: poor models for RPD < 1.40 (highlighted in orange), reasonable models for 1.40 ≤ RPD < 2.00 (highlighted in light yellow), good models for 2.00 ≤ RPD < 3.00 (highlighted in light green), and excellent models for RPD ≥ 3.00 (highlighted in dark green); 1 Organic matter; 2 cation exchange capacity; 3 base saturation; 4 extractable (ex-) nutrients.
References
- Gredilla, A.; de Vallejuelo, S.F.O.; Elejoste, N.; de Diego, A.; Madariaga, J.M. Non-destructive Spectroscopy combined with chemometrics as a tool for Green Chemical Analysis of environmental samples: A review. TrAC Trends Anal. Chem. 2016, 76, 30–39. [Google Scholar] [CrossRef]
- Demattê, J.A.M.; Dotto, A.C.; Bedin, L.G.; Sayão, V.M.; e Souza, A.B. Soil analytical quality control by traditional and spectroscopy techniques: Constructing the future of a hybrid laboratory for low environmental impact. Geoderma 2019, 337, 111–121. [Google Scholar] [CrossRef]
- Viscarra Rossel, R.A.; Bouma, J. Soil sensing: A new paradigm for agriculture. Agric. Syst. 2016, 148, 71–74. [Google Scholar] [CrossRef]
- Molin, J.P.; Tavares, T.R. Sensor systems for mapping soil fertility attributes: Challenges, advances, and perspectives in brazilian tropical soils. Eng. Agric. 2019, 39, 126–147. [Google Scholar] [CrossRef]
- Nawar, S.; Corstanje, R.; Halcro, G.; Mulla, D.; Mouazen, A.M. Delineation of Soil Management Zones for Variable-Rate Fertilization: A Review, 1st ed.; Elsevier: Amsterdam, The Netherlands, 2017; Volume 143. [Google Scholar] [CrossRef]
- Rossiter, D.G. Past, present & future of information technology in pedometrics. Geoderma 2018, 324, 131–137. [Google Scholar] [CrossRef]
- Kuang, B.; Mahmood, H.S.; Quraishi, M.Z.; Hoogmoed, W.B.; Mouazen, A.M.; van Henten, E.J. Sensing Soil Properties in the Laboratory, In Situ, and On-Line. Adv. Agron. 2012, 114, 155–223. [Google Scholar] [CrossRef]
- Mahmood, H.S.; Hoogmoed, W.B.; van Henten, E.J. Sensor data fusion to predict multiple soil properties. Precis. Agric. 2012, 13, 628–645. [Google Scholar] [CrossRef]
- Tavares, T.R.; Molin, J.P.; Hamed Javadi, S.; de Carvalho, H.W.P.; Mouazen, A.M. Combined use of vis-nir and xrf sensors for tropical soil fertility analysis: Assessing different data fusion approaches. Sensors 2021, 21, 148. [Google Scholar] [CrossRef]
- Xu, X.; Du, C.; Ma, F.; Shen, Y.; Wu, K.; Liang, D.; Zhou, J. Detection of soil organic matter from laser-induced breakdown spectroscopy (LIBS) and mid-infrared spectroscopy (FTIR-ATR) coupled with multivariate techniques. Geoderma 2019, 355. [Google Scholar] [CrossRef]
- Xu, D.; Zhao, R.; Li, S.; Chen, S.; Jiang, Q.; Zhou, L.; Shi, Z. Multi-sensor fusion for the determination of several soil properties in the Yangtze River Delta, China. Eur. J. Soil Sci. 2019, 70, 162–173. [Google Scholar] [CrossRef]
- Stenberg, B.; Viscarra Rossel, R.A.; Mouazen, A.M.; Wetterlind, J. Visible and Near Infrared Spectroscopy in Soil Science. Adv. Agron. 2010, 107. [Google Scholar] [CrossRef]
- Clark, R.N.; Roush, T.L. Reflectance spectroscopy: Quantitative analysis techniques for remote sensing applications. J. Geophys. Res. Solid Earth 1984, 89, 6329–6340. [Google Scholar] [CrossRef]
- Krug, F.J.; Rocha, F.R.P. Métodos de Preparo de Amostras Para Análise Elementar; Sociedade Brasileira de Quimica: São Paulo, Brazil, 2016. [Google Scholar]
- Castanedo, F. A Review of Data Fusion Techniques. Sci. World J. 2013, 2013, 704504. [Google Scholar] [CrossRef] [PubMed]
- Abdul Munnaf, M.; Nawar, S.; Mouazen, A.M. Estimation of Secondary Soil Properties by Fusion of Laboratory and On-Line Measured Vis–NIR Spectra. Remote Sens. 2019, 11, 2819. [Google Scholar] [CrossRef]
- Romero, D.J.; Ben-Dor, E.; Demattê, J.A.M.; Souza, A.B.E.; Vicente, L.E.; Tavares, T.R.; Martello, M.; Strabeli, T.F.; da Silva Barros, P.P.; Fiorio, P.R.; et al. Internal soil standard method for the Brazilian soil spectral library: Performance and proximate analysis. Geoderma 2018, 312. [Google Scholar] [CrossRef]
- Tavares, T.R.; Molin, J.P.; Nunes, L.C.; Alves, E.E.N.; Melquiades, F.L.; de Carvalho, H.W.P.; Mouazen, A.M. Effect of x-ray tube configuration on measurement of key soil fertility attributes with XRF. Remote Sens. 2020, 12, 963. [Google Scholar] [CrossRef]
- Andrade, R.; Faria, W.M.; Silva, S.H.G.; Chakraborty, S.; Weindorf, D.C.; Mesquita, L.F.; Guilherme, L.R.G.; Curi, N. Prediction of soil fertility via portable X-ray fluorescence (pXRF) spectrometry and soil texture in the Brazilian Coastal Plains. Geoderma 2020, 357, 113960. [Google Scholar] [CrossRef]
- Riebe, D.; Erler, A.; Brinkmann, P.; Beitz, T.; Löhmannsröben, H.G.; Gebbers, R. Comparison of calibration approaches in laser-induced breakdown spectroscopy for proximal soil sensing in precision agriculture. Sensors 2019, 19, 5244. [Google Scholar] [CrossRef]
- Erler, A.; Riebe, D.; Beitz, T.; Löhmannsröben, H.-G.; Gebbers, R. Soil Nutrient Detection for Precision Agriculture Using Handheld Laser-Induced Breakdown Spectroscopy (LIBS) and Multivariate Regression Methods (PLSR, Lasso and GPR). Sensors 2020, 20, 418. [Google Scholar] [CrossRef]
- Wan, M.; Hu, W.; Qu, M.; Li, W.; Zhang, C.; Kang, J.; Hong, Y.; Chen, Y.; Huang, B. Rapid estimation of soil cation exchange capacity through sensor data fusion of portable XRF spectrometry and Vis-NIR spectroscopy. Geoderma 2020, 363, 114163. [Google Scholar] [CrossRef]
- Javadi, S.H.; Munnaf, M.A.; Mouazen, A.M. Fusion of Vis-NIR and XRF spectra for estimation of key soil attributes. Geoderma 2021, 385, 114851. [Google Scholar] [CrossRef]
- Zhang, Y.; Hartemink, A.E. Data fusion of vis–NIR and PXRF spectra to predict soil physical and chemical properties. Eur. J. Soil Sci. 2020, 71, 316–333. [Google Scholar] [CrossRef]
- IUSS Working Group WRB. World Reference Base for Soil Resources 2014, Update 2015: International Soil Classification System for Naming Soils and Creating Legends for Soil Maps; Schad, P., van Huyssteen, C., Micheli, E., Eds.; FAO: Rome, Italy, 2015; ISBN 978-92-5-108369-7. [Google Scholar]
- EMBRAPA Solos. Brazilian Soil Classification System, 5th ed.; EMBRAPA: Brasilia, Brazil, 2018. [Google Scholar]
- Van Raij, B.; Andrade, J.C.; Cantarela, H.; Quaggio, J.A. Análise Química Para Avaliação de Solos Tropicais; IAC: Campinas, Brazil, 2001. [Google Scholar]
- Knadel, M.; Stenberg, B.; Deng, F.; Thomsen, A.; Greve, M.H. Comparing Predictive Abilities of Three Visible-Near Infrared Spectrophotometers for Soil Organic Carbon and Clay Determination. J. Near Infrared Spectrosc. 2013, 21, 67–80. [Google Scholar] [CrossRef]
- Debaene, G.; Niedźwiecki, J.; Pecio, A.; Żurek, A. Effect of the number of calibration samples on the prediction of several soil properties at the farm-scale. Geoderma 2014, 214-215, 114–125. [Google Scholar] [CrossRef]
- Tavares, T.R.; Nunes, L.C.; Alves, E.E.N.; de Almeida, E.; Maldaner, L.F.; Krug, F.J.; de Carvalho, H.W.P.; Molin, J.P. Simplifying sample preparation for soil fertility analysis by x-ray fluorescence spectrometry. Sensors 2019, 19, 66. [Google Scholar] [CrossRef] [PubMed]
- Mouazen, A.M.; Maleki, M.R.; Cockx, L.; Van Meirvenne, M.; Van Holm, L.H.J.; Merckx, R.; De Baerdemaeker, J.; Ramon, H. Optimum three-point linkage set up for improving the quality of soil spectra and the accuracy of soil phosphorus measured using an on-line visible and near infrared sensor. Soil Tillage Res. 2009, 103, 144–152. [Google Scholar] [CrossRef]
- Barnes, R.J.; Dhanoa, M.S.; Lister, S.J. Standard Normal Variate Transformation and De-Trending of Near-Infrared Diffuse Reflectance Spectra. Appl. Spectrosc. 1989, 43, 772–777. [Google Scholar] [CrossRef]
- Mouazen, A.M.; Karoui, R.; De Baerdemaeker, J.; Ramon, H. Characterization of Soil Water Content Using Measured Visible and Near Infrared Spectra. Soil Sci. Soc. Am. J. 2006, 70, 1295–1302. [Google Scholar] [CrossRef]
- Ben-Dor, E.; Inbar, Y.; Chen, Y. The reflectance spectra of organic matter in the visible near-infrared and short wave infrared region (400–2500 nm) during a controlled decomposition process. Remote Sens. Environ. 1997, 61, 1–15. [Google Scholar] [CrossRef]
- Rinnan, Å.; van den Berg, F.; Engelsen, S.B. Review of the most common pre-processing techniques for near-infrared spectra. TrAC Trends Anal. Chem. 2009, 28, 1201–1222. [Google Scholar] [CrossRef]
- Nawar, S.; Mouazen, A.M. Predictive performance of mobile vis-near infrared spectroscopy for key soil properties at different geographical scales by using spiking and data mining techniques. Catena 2017, 151, 118–129. [Google Scholar] [CrossRef]
- Tavares, T.R.; Mouazen, A.M.; Alves, E.E.N.; Dos Santos, F.R.; Melquiades, F.L.; De Carvalho, H.W.P.; Molin, J.P. Assessing soil key fertility attributes using a portable X-ray fluorescence: A simple method to overcome matrix effect. Agronomy 2020, 10, 787. [Google Scholar] [CrossRef]
- Nunes, L.C.; Rocha, F.R.P.; Krug, F.J. Slope ratio calibration for analysis of plant leaves by laser-induced breakdown spectroscopy. J. Anal. At. Spectrom. 2019, 34, 2314–2324. [Google Scholar] [CrossRef]
- Nunes, L.C.; da Silva, G.A.; Trevizan, L.C.; Santos Júnior, D.; Poppi, R.J.; Krug, F.J. Simultaneous optimization by neuro-genetic approach for analysis of plant materials by laser induced breakdown spectroscopy. Spectrochim. Acta Part B At. Spectrosc. 2009, 64, 565–572. [Google Scholar] [CrossRef]
- Yu, K.Q.; Zhao, Y.R.; Liu, F.; He, Y. Laser-Induced Breakdown Spectroscopy Coupled with Multivariate Chemometrics for Variety Discrimination of Soil. Sci. Rep. 2016, 6, 27574. [Google Scholar] [CrossRef] [PubMed]
- Gomes, A.D.A.; Galvão, R.K.H.; De Araújo, M.C.U.; Véras, G.; Da Silva, E.C. The successive projections algorithm for interval selection in PLS. Microchem. J. 2013, 110, 202–208. [Google Scholar] [CrossRef]
- Kennard, R.W.; Stone, L.A. Computer Aided Design of Experiments. Technometrics 1969, 11, 137–148. [Google Scholar] [CrossRef]
- Chang, C.-W.; Laird, D.A.; Mausbach, M.J.; Hurburgh, C.R. Near-Infrared Reflectance Spectroscopy–Principal Components Regression Analyses of Soil Properties. Soil Sci. Soc. Am. J. 2001, 65, 480–490. [Google Scholar] [CrossRef]
- O’Rourke, S.M.; Stockmann, U.; Holden, N.M.; McBratney, A.B.; Minasny, B. An assessment of model averaging to improve predictive power of portable vis-NIR and XRF for the determination of agronomic soil properties. Geoderma 2016, 279, 31–44. [Google Scholar] [CrossRef]
- Cardelli, V.; Weindorf, D.C.; Chakraborty, S.; Li, B.; De Feudis, M.; Cocco, S.; Agnelli, A.; Choudhury, A.; Ray, D.P.; Corti, G. Non-saturated soil organic horizon characterization via advanced proximal sensors. Geoderma 2017, 288, 130–142. [Google Scholar] [CrossRef]
- Granger, C.W.J.; Ramanathan, R. Improved methods of combining forecasts. J. Forecast. 1984, 3, 197–204. [Google Scholar] [CrossRef]
- Nawar, S.; Mouazen, A.M. Optimal sample selection for measurement of soil organic carbon using on-line vis-NIR spectroscopy. Comput. Electron. Agric. 2018, 151, 469–477. [Google Scholar] [CrossRef]
- Ben-Dor, E. Quantitative remote sensing of soil properties. Adv. Agron. 2002, 75, 173–243. [Google Scholar] [CrossRef]
- Fontes, M.P.F. Intemperismo de rochas e minerais. In Pedologia: Fundamentos; Ker, J.C., Curi, N., Schaefer, C.E.G.R., Vidal-Torrado, P., Eds.; Sociedade Brasileira de Ciência do Solo: Viçosa, Brazil, 2012; pp. 171–205. [Google Scholar]
- Schäefer, C.E.G.R.; Fabris, J.D.; Ker, J.C. Minerals in the clay fraction of Brazilian Latosols (Oxisols): A review. Clay Miner. 2008, 43, 137–154. [Google Scholar] [CrossRef]
- Coutinho, M.A.N.; Alari, F.d.O.; Ferreira, M.M.C.; do Amaral, L.R. Influence of soil sample preparation on the quantification of NPK content via spectroscopy. Geoderma 2019, 338, 401–409. [Google Scholar] [CrossRef]
- Lacerda, M.P.C.; Demattê, J.A.M.; Sato, M.V.; Fongaro, C.T.; Gallo, B.C.; Souza, A.B. Tropical Texture Determination by Proximal Sensing Using a Regional Spectral Library and Its Relationship with Soil Classification. Remote Sens. 2016, 8, 701. [Google Scholar] [CrossRef]
- Demattê, J.A.M.; Ramirez-Lopez, L.; Marques, K.P.P.; Rodella, A.A. Chemometric soil analysis on the determination of specific bands for the detection of magnesium and potassium by spectroscopy. Geoderma 2017, 288, 8–22. [Google Scholar] [CrossRef]
- Demattê, J.A.M.; Alves, M.R.; Gallo, B.C.; Fongaro, C.T.; Romero, D.J.; Sato, M.V. Hyperspectral remote sensing as an alternative to estimate soil attributes. Rev. Ciênc. Agron. 2015, 46, 223–232. [Google Scholar] [CrossRef]
- Silva, E.A.; Weindorf, D.C.; Silva, S.H.G.; Ribeiro, B.T.; Poggere, G.C.; Carvalho, T.S.; Gonçalves, M.G.M.; Guilherme, L.R.G.; Curi, N. Advances in Tropical Soil Characterization via Portable X-Ray Fluorescence Spectrometry. Pedosphere 2019, 29, 468–482. [Google Scholar] [CrossRef]
- Silva, S.H.G.; Teixeira, A.F.d.S.; de Menezes, M.D.; Guilherme, L.R.G.; Moreira, F.M.d.S.; Curi, N.; Silva, S.H.G.; Teixeira, A.F.d.S.; de Menezes, M.D.; Guilherme, L.R.G.; et al. Multiple linear regression and random forest to predict and map soil properties using data from portable X-ray fluorescence spectrometer (pXRF). Ciênc. Agrotecnol. 2017, 41, 648–664. [Google Scholar] [CrossRef]
- Santos, F.R.; de Oliveira, J.F.; Bona, E.; dos Santos, J.V.F.; Barboza, G.M.C.; Melquiades, F.L. EDXRF spectral data combined with PLSR to determine some soil fertility indicators. Microchem. J. 2020, 152, 104275. [Google Scholar] [CrossRef]
- de Lima, T.M.; Weindorf, D.C.; Curi, N.; Guilherme, L.R.G.G.; Lana, R.M.Q.Q.; Ribeiro, B.T. Elemental analysis of Cerrado agricultural soils via portable X-ray fluorescence spectrometry: Inferences for soil fertility assessment. Geoderma 2019, 353, 264–272. [Google Scholar] [CrossRef]
- Villas-Boas, P.R.; Romano, R.A.; de Menezes Franco, M.A.; Ferreira, E.C.; Ferreira, E.J.; Crestana, S.; Milori, D.M.B.P. Laser-induced breakdown spectroscopy to determine soil texture: A fast analytical technique. Geoderma 2016, 263, 195–202. [Google Scholar] [CrossRef]
- Ferreira, E.C.; Gomes Neto, J.A.; Milori, D.M.B.P.; Ferreira, E.J.; Anzano, J.M. Laser-induced breakdown spectroscopy: Extending its application to soil pH measurements. Spectrochim. Acta Part B At. Spectrosc. 2015, 110, 96–99. [Google Scholar] [CrossRef]
- Jantzi, S.C.; Motto-Ros, V.; Trichard, F.; Markushin, Y.; Melikechi, N.; De Giacomo, A. Sample treatment and preparation for laser-induced breakdown spectroscopy. Spectrochim. Acta Part B At. Spectrosc. 2016, 115, 52–63. [Google Scholar] [CrossRef]
- Knadel, M.; Gislum, R.; Hermansen, C.; Peng, Y.; Moldrup, P.; de Jonge, L.W.; Greve, M.H. Comparing predictive ability of laser-induced breakdown spectroscopy to visible near-infrared spectroscopy for soil property determination. Biosyst. Eng. 2017, 156, 157–172. [Google Scholar] [CrossRef]


Publisher’s Note: MDPI stays neutral with regard to jurisdictional claims in published maps and institutional affiliations. |
© 2021 by the authors. Licensee MDPI, Basel, Switzerland. This article is an open access article distributed under the terms and conditions of the Creative Commons Attribution (CC BY) license (https://creativecommons.org/licenses/by/4.0/).