Article

Novel Loci for Kernel Hardness Appeared as a Response to Heat and Combined Heat-Drought Conditions in Wheat Harboring Aegilops tauschii Diversity

by
Gamila Mohamed Idris Elhadi
1,
Nasrein Mohamed Kamal
2,3,
Yasir Serag Alnor Gorafi
2,3,
Yuji Yamasaki
2,
Yusuke Ban
4,
Keita Kato
4,
Izzat Sidahmed Ali Tahir
3,
Takayoshi Ishii
2,
Hiroyuki Tanaka
5 and
Hisashi Tsujimoto
2,*
1
United Graduate School of Agricultural Sciences, Tottori University, Tottori 680-8553, Japan
2
Arid Land Research Center, Tottori University, Tottori 680-0001, Japan
3
Agricultural Research Corporation, Wad Medani P.O. Box 126, Sudan
4
NARO Western Region Agricultural Research Center, Fukuyama, Hiroshima 721-8514, Japan
5
Faculty of Agriculture, Tottori University, Tottori 680-8553, Japan
*
Author to whom correspondence should be addressed.
Agronomy 2021, 11(6), 1061; https://doi.org/10.3390/agronomy11061061
Submission received: 23 April 2021 / Revised: 21 May 2021 / Accepted: 21 May 2021 / Published: 25 May 2021
(This article belongs to the Special Issue Researches on Crop Nutritional Molecular Biology)

Abstract

:
Kernel hardness influences the milling and baking quality of wheat. Stress environments such as heat and combined heat-drought can produce harder kernels, thereby affecting the overall wheat quality. Beside puroindoline genes that are known to determine hardness, other QTLs contribute to the hardness. These QTLs, especially under stress conditions, need extensive research. Moreover, understanding the modification or stabilization of hardness under stress condition and the relationship with stress tolerance will facilitate the selection of superior lines that maintain both high yield and quality even under the stress environment. Therefore, in the current work, we aimed to identify the genetic loci and marker trait associations (MTAs) that contributes for hardness under optimum conditions in Japan, and heat and combined heat-drought (HD) conditions in Sudan. We used a panel of multiple synthetic derivatives (MSD) having diverse Aegilops tauschii genome segments and investigated the association between hardness stabilization and stress tolerance. Under stress conditions, we observed that less reduction of kernel weight is associated with either low change or stable kernel hardness. We identified 47 markers associated with hardness under all conditions; the D genome was the main contributor. For the first time, we found a significant association with hardness under stress conditions on chromosome 4D. We dissected several candidate genes associated with the change of hardness under stress conditions. Our results will improve the understanding of the genetic factors that affect wheat hardness stability.

1. Introduction

Kernel hardness is an important quality trait that greatly influences the milling and baking quality of wheat. The world wheat trade is largely carried out based on hardness grades. Wheat hardness is a quantitative trait with classes ranging from soft to hard [1]. Two genes mainly determine hardness, puroindoline a and b (Pina and Pinb), which are located on the short arm of chromosome 5D (5DS) and form the molecular basis of wheat hardness [2]. The presence of the wild-type form of these genes is associated with the soft kernel phenotype in hexaploid wheat. The absence or mutation in either gene results in a hard kernel phenotype [3].
Although puroindoline genes are considered major determinants of wheat hardness, many studies have demonstrated the complex nature of this trait [4,5], and suggest that hardness is affected by several factors. These factors include abiotic stresses such as heat and drought. Heat and drought stresses pose a serious risk to agriculture [6,7]. Several studies have demonstrated that stress from high temperatures and drought can accelerate kernel filling. These stresses compress the timing of key events during wheat kernel development, such as increasing the production of storage proteins and starch synthesis in the endosperm under stress, which together affect kernel hardness [8]. Furthermore, kernel hardness has been reported to be negatively associated with the thousand-kernel weight [9,10], as well as with shape traits such as kernel length, width, and diameter [9]. Proteins are considered important components of wheat grains since they govern wheat’s end-use quality. Alterations of the protein fraction composition due to drought and heat stress are primarily due to changes in the total nitrogen quantity accumulated during the seed-filling phase [11]. In turn, they increase hardness because the protein content is positively correlated with hardness [12].
In addition to the puroindoline genes, several studies have identified alleles that contribute to hardness; these were located on most of the 21 wheat chromosomes, but especially on chromosomes 1B, 2A, 4B, 5A, 5B, 5D, and 7D [1,13,14,15]. Several researchers studied the hardness of plants grown under stress condition [16,17]. However, the genetic factors that affected the change in hardness remained unclear. Therefore, better understanding of the change or stability in hardness under stress environment is essential because the factors or QTLs contributes to hardness stabilization or modification under stress environment will have a great value for wheat quality breeding. Therefore, we conducted this study to dissect the genetic factors that contribute to hardness under optimum, heat, and combined heat-drought (HD) conditions and to investigate the association between hardness stabilization or modification and stress tolerance.
We used a panel of multiple synthetic derivatives (MSD) lines that harbor a wide diversity from a wild species, Aegilops tauschii. Our results revealed a significant marker trait association on chromosome 4D under heat and combined heat-drought (HD) environments. The tolerant MSD lines, with low reduction in their kernel weight, have more stable hardness than sensitive ones. The germplasm source identified and characterized in this study will be an excellent source to breed wheat stress-tolerant cultivars with stable hardness.

2. Materials and Methods

2.1. Plant Materials

In this study, we used a multiple synthetic derivative (MSD) population of 400 lines developed by crossing and backcrossing 43 synthetic wheat lines with the Japanese wheat cultivar ‘Norin 61’ [18]. Based on heading time and vernalization requirements, 140 MSD lines were selected out of the 400 original lines and tested in Sudan under heat and HD conditions. All the MSD lines were genotyped using the DArT-seq platform [18].

2.2. Field Experiment

The field experiments were conducted in Japan and Sudan. We choose Japan as the optimum condition, because it is considered as having favorable conditions for wheat, while we selected Sudan for the heat and HD experiment because it has been recognized as the global platform for heat tolerance research [19]. In Japan, the 400 MSD lines were grown in a field at the Arid Land Research Center, Tottori University for two seasons (2015/2016 and 2018/2019), using an augmented randomized complete block design with eight blocks. We used four replicated checks in each block; “Norin 61” (the MSD parent), “Imam” and “Tagana” (Sudanese heat-tolerant cultivars), and “Safedak Ishkashim” (a Tajikistan landrace) [19]. In Sudan, we selected 140 lines because they do not require vernalization treatment and adapt to the Sudanese conditions. Those lines were evaluated under heat and HD conditions using alfa-lattice design, with two replications. The drought was imposed by withholding the irrigation after heading as described in our previous study [19].

2.3. Hardness and Protein Content Measurements and SEM Observation

The measurement of kernel hardness (index) of the MSD lines under optimum, heat, and HD conditions was performed with a bulk sample of 100 clean, unbroken wheat kernels using the single-kernel characterization system (SKCS 4100, Perten Instruments, Waltham, MA, USA) at the NARO Western Region Agricultural Research Center. This machine measures the force required to crush individual grains of a sample between two surfaces using (index) unit. The MSD lines were classified into hard and soft based on significant differences from the value for the background cultivar ‘Norin 61’.
We measured the nitrogen content of about 50 mg of wheat kernel powder using a CN Corder (Model MT-700; Yanaco, Inc., Kyoto, Japan). We recorded the nitrogen to carbon ratio, and then calculated the nitrogen content as a percentage and converted that value to the crude protein content by multiplying the N content by the conversion factor 5.95 [20].
To detect physical changes in response to stress, we examined the internal structure of the wheat kernels using a transverse section of the kernel under a scanning electron microscope (JSM-6610LV, JEOL, Peabody, MA, USA).

2.4. Statistical Analysis and Hardness Stress Indexes

We performed an analysis of variance (ANOVA) for the data from the Japanese experiment to detect differences between accessions using version 1.4 of the Plant Breeding Tools software (PBTools, http://bbi.Irri.org/products), Laguna, Philippines. We estimated the best linear unbiased predictions (BLUPs) across the two seasons and used the results for GWAS. For the Sudan experiments, we performed ANOVA using GenStat 18 (VSN International, Rothamsted Research, Harpenden, Hertfordshire, UK). Broad-sense heritability (H2) was defined as H2 = VG/(VG+VE), where VG and VE are the genetic and environment estimation, respectively [21]. We calculated relative performance for hardness under heat (HI) and HD conditions (HDI). Also, we calculated heat susceptibility index (HSI) and combined heat-drought susceptibility index (HDSI). All calculations were conducted using the following formulas:
HI = (performance in heat environment/performance in optimum environment) × 100%
HDI = (performance in HD environment/performance in optimum environment) × 100%
HSI or HDSI = (1 − [Yh/Y])/(1 − [Xh/X])
where Yh is the phenotypic means for each genotype under heat or HD condition, Y is the phenotypic means for each genotype under optimum condition, Xh is the means for all lines under heat or HD condition, and X is the means for all lines under optimum conditions.

2.5. Association Analysis

We performed genome-wide association analysis for kernel hardness using a mixed linear model (MLM) with 14,355 DarT-seq markers by version 5 of the TASSEL software [22]. Tassel MLM products were used to generate Manhattan plot using CM plot package in R. We created Manhattan plots using p < 3 × 10⁻³ as the threshold to identify significant associations.

2.6. Bioinformatics Analysis

To identify candidate genes for hardness and the related proteins, we selected the marker trait associations (MTAs) that were identified as significant under all conditions, and we BLAST them against the International Wheat Genome Sequencing Consortium (IWGS) RefSeq V.1 chromosomes, using URGI with BLAST option (https://urgi.versailles.inra.fr/blast/), accessed on 25 May 2021. Then, we searched for the candidate genes with high confidence in distance (±500 kbp) for the genome region. We used version 1.0 of IWGSC_Ref_seq to search for genes with high confidence. To identify the protein function, we used version 1.1 of IWGSC_Ref_Seq_Annotations along with EnsemblPlant (https://plants.ensembl.org), accessed on 25 May 2021. We investigated the expression levels of all candidate genes that highly contribute to hardness and compared them to the expression of the puroindoline genes using the Wheat Expression Browser expVIP [23]. This lead to understand the association between the candidate genes and hardness. This browser allows comparisons across several studies by taking an input of RNA-seq that collected from these studies. The output is viewable as browser interference with interactive filtering, sorting and export option. This allows an easy access for the researchers [23]. The visualization of the expression was realized using GENEVESTIGATOR software (https://genevestigator.com/gv/start/start.jsp), Tokyo, Japan, accessed on 25 May 2021.

3. Results

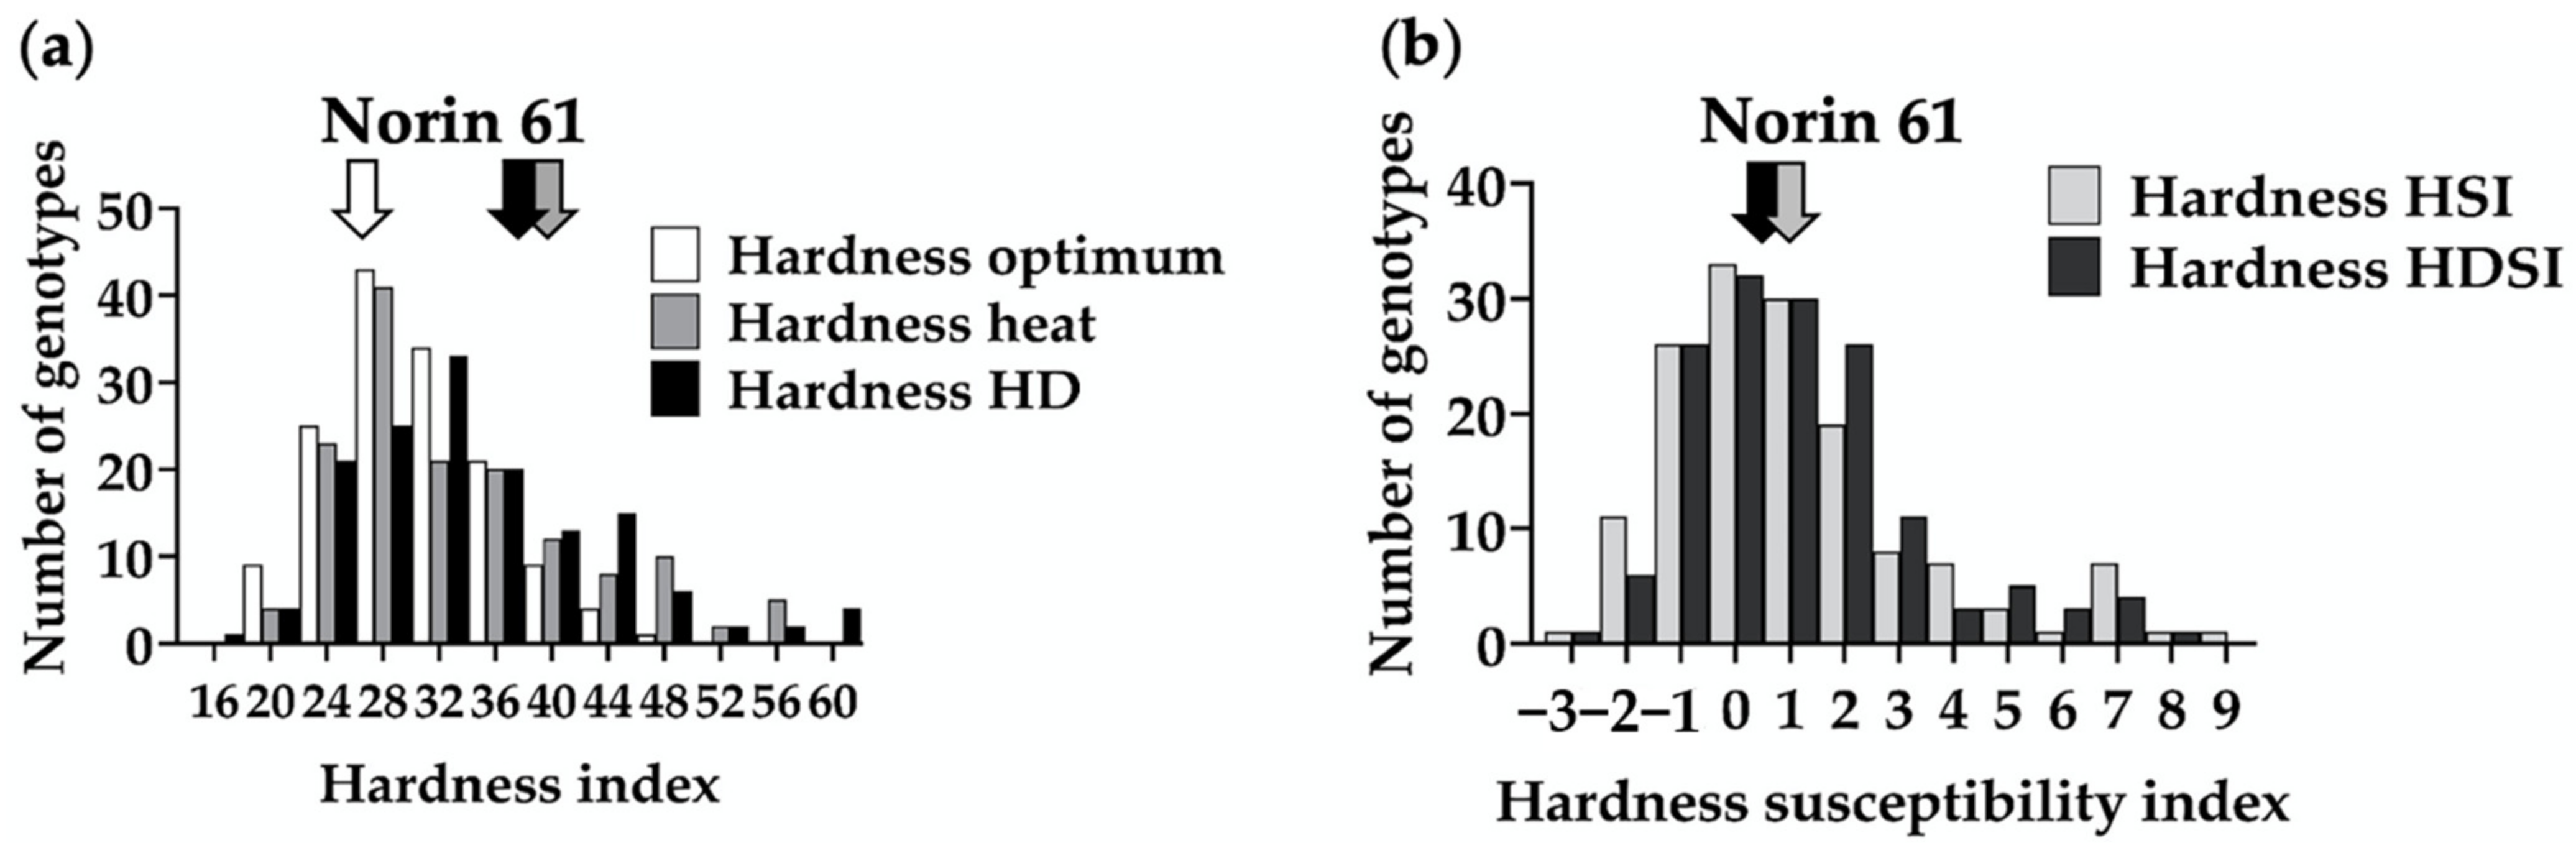
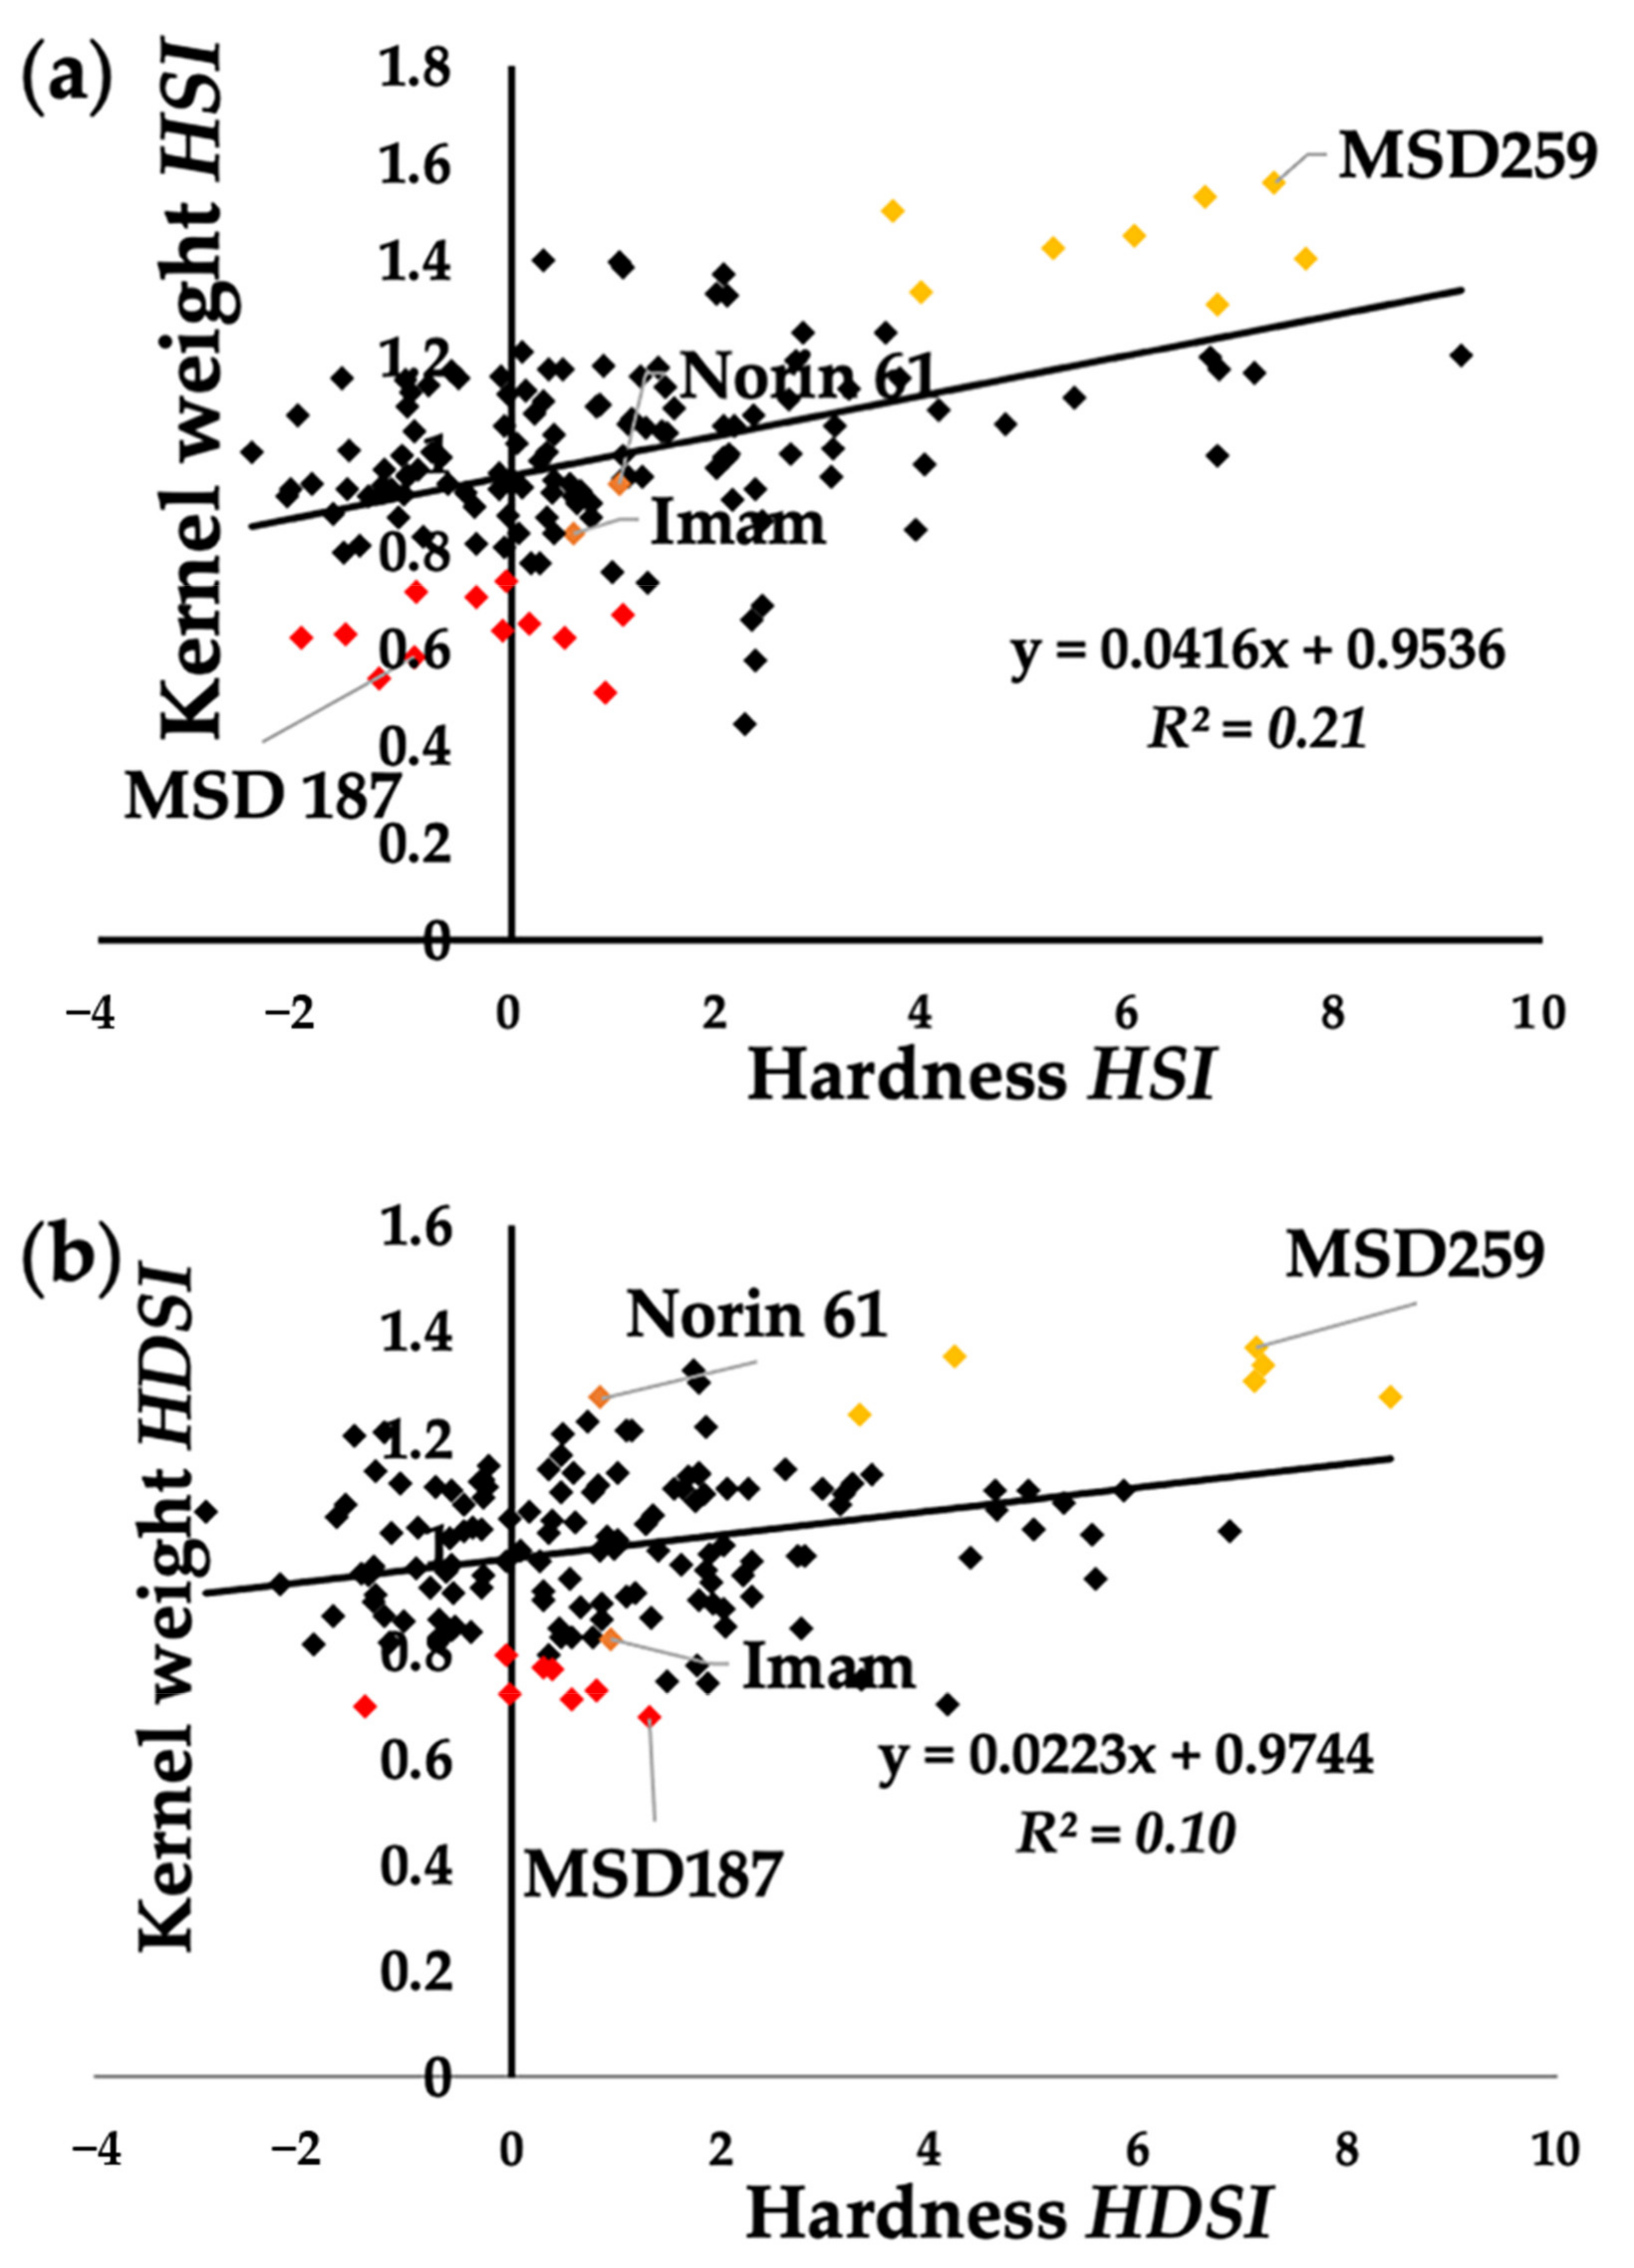
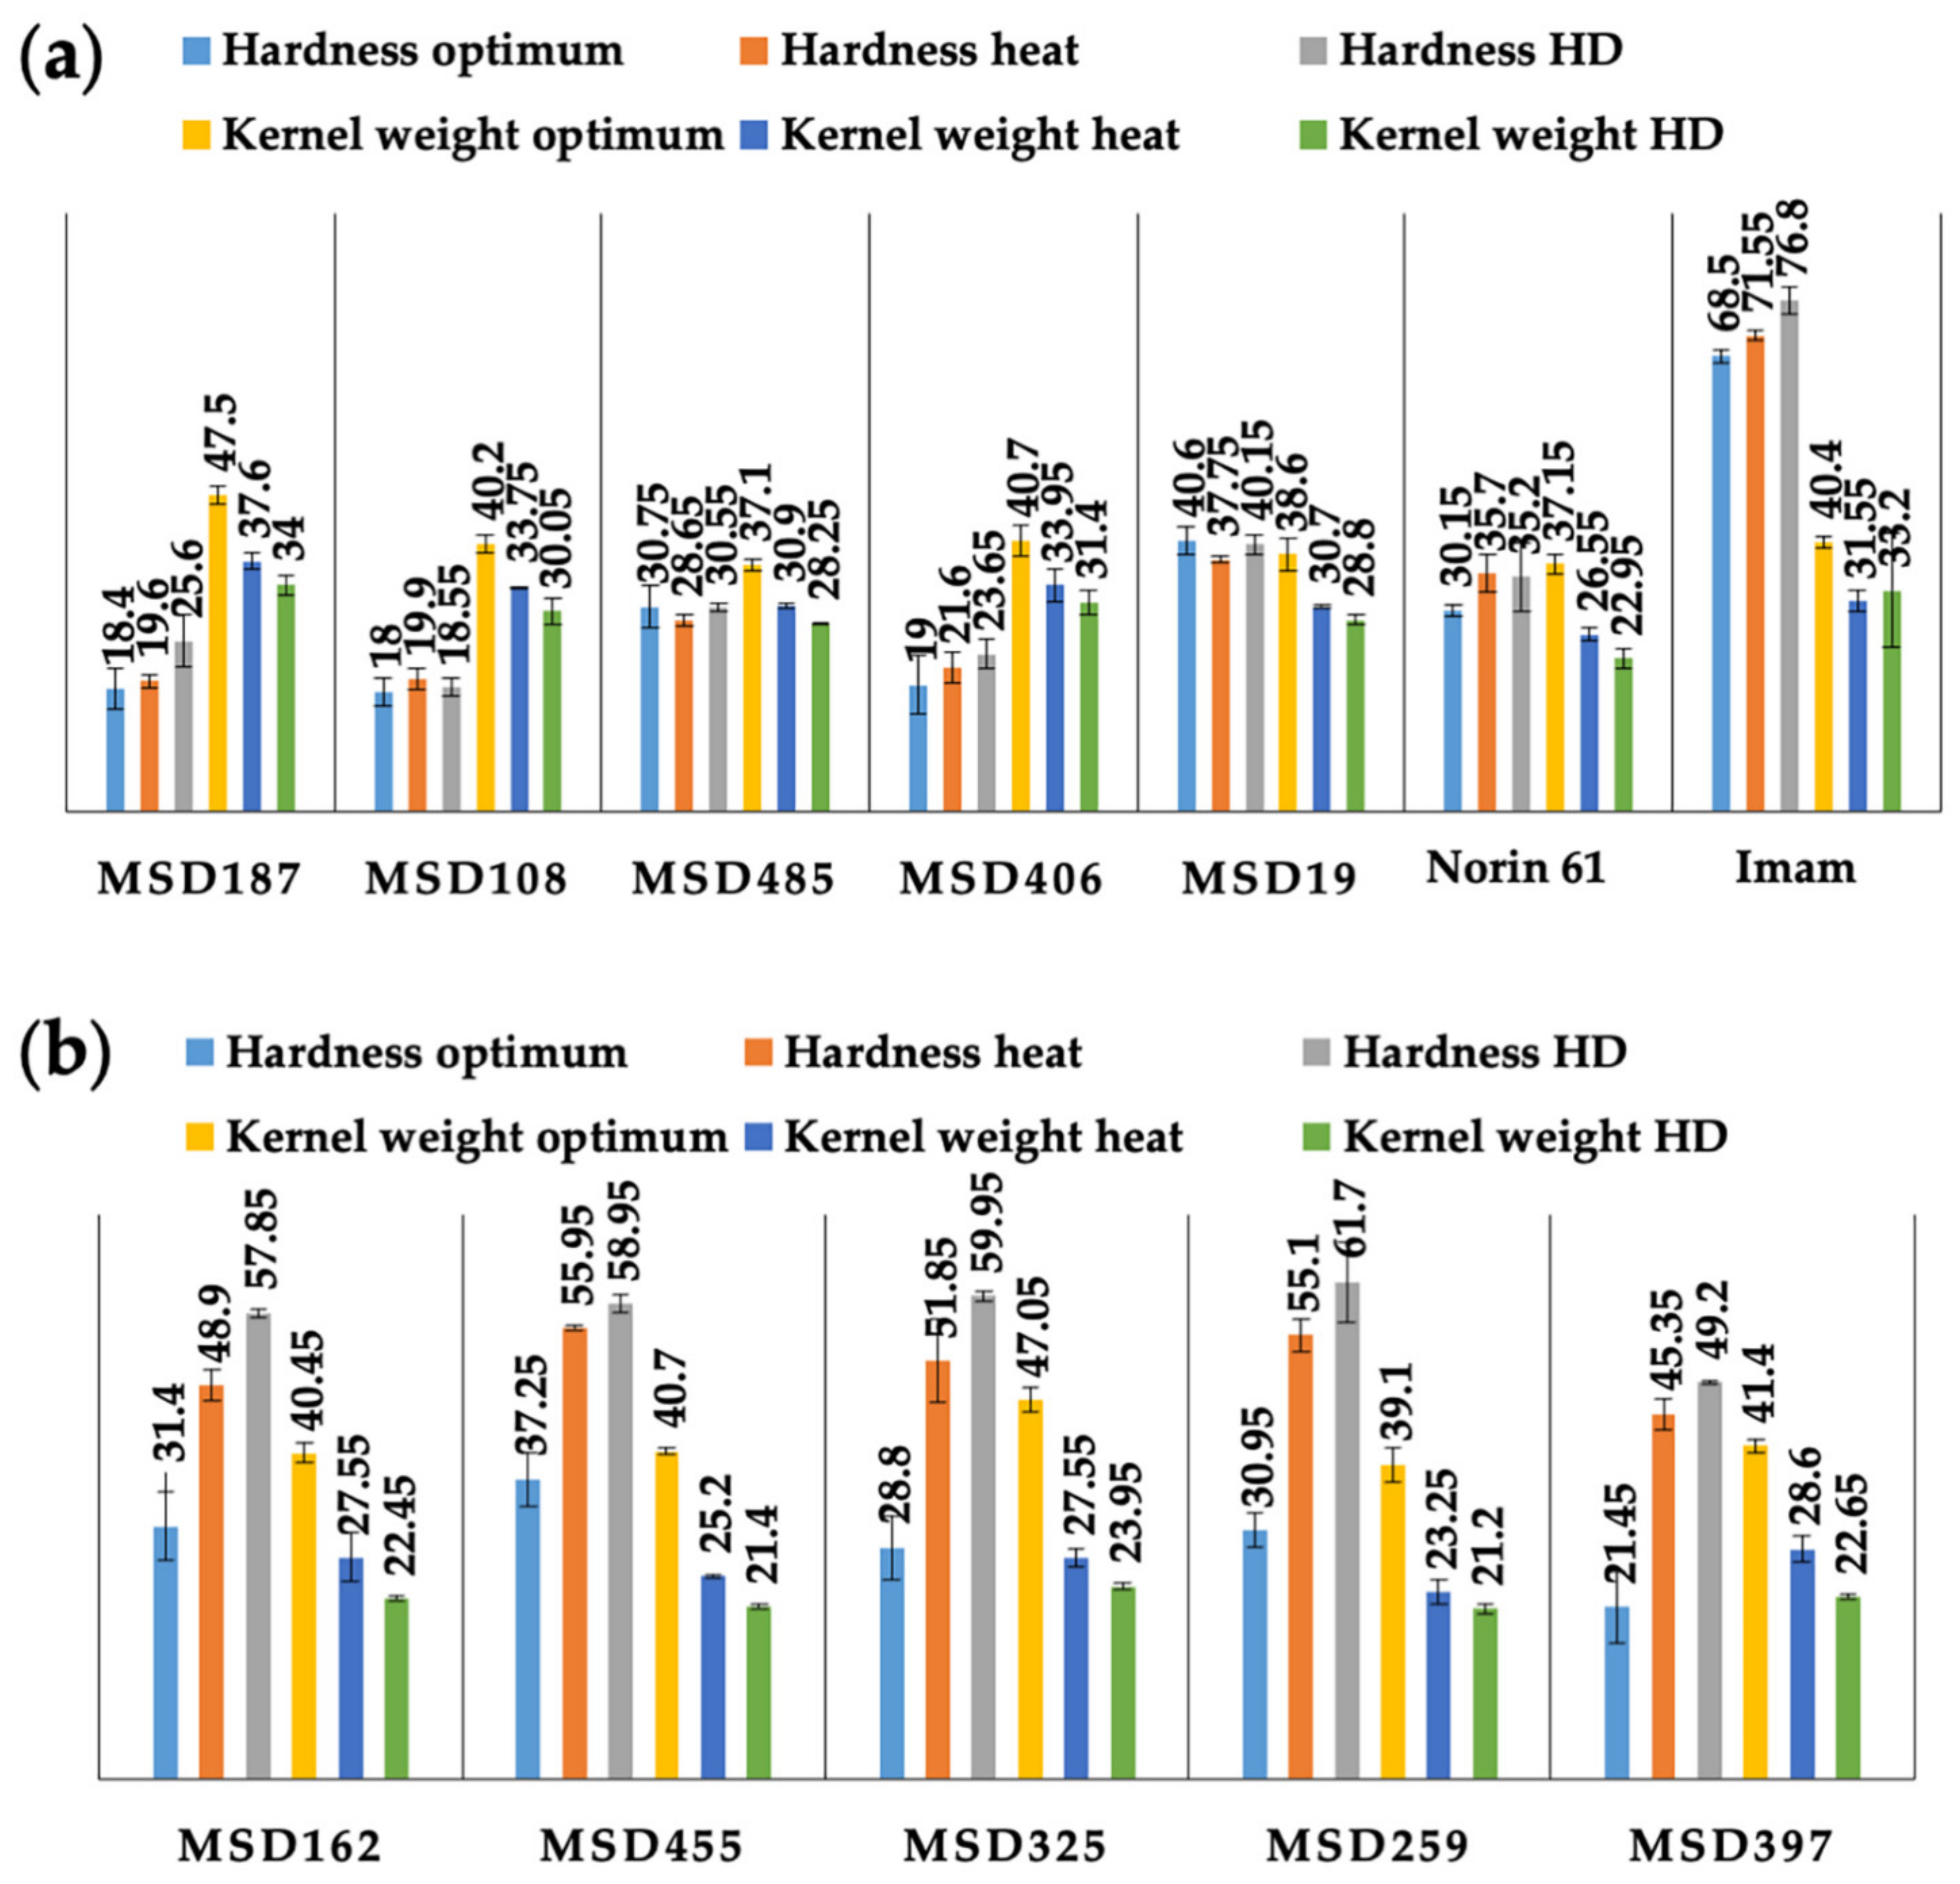
3.1. Phenotypic Variation and Diversity in Hardness among MSD Lines under Optimum and Stress Conditions

Under an optimum environment, significant variation (p < 0.001) in hardness was detected among the MSD lines. No significant differences were detected between the two seasons (Table 1), while the interaction between the environment and seasons (G × S) was significant (p < 0.05). The MSD lines exhibited a wide range of variation for hardness (18.5 to 47.8), whereas, the backcross parent (Norin 61) was 29.6. We selected 140 MSD lines out of the original 400 lines based on their suitability to grow under Sudanese conditions to understand the effect of the heat and HD environments on the hardness and to detect the different factors that influence the hardness under stress conditions. Therefore, the results of the 140 lines will be presented and discussed.
Under stress environments, significant differences were observed among the genotypes (p < 0.05) (Table 1). The environmental effect was significant, whereas the G × E effect was not significant. High heritability (>90%) was observed under the optimum as well as heat and HD environments (Table 1).
Under heat and HD environments, the genotypes shifted to became harder. This appeared on the frequency distribution, which ranged from 19.6 to 56.9 under heat, and from 25.5 to 60.2 under HD environments, respectively (Figure 1a). Norin 61 became harder with a hardness index of 35.7 and 35.2 under heat and HD environments, respectively, compared to 29.6 under optimum conditions.
The frequency distribution of heat and heat-drought susceptibility indexes for hardness, HSI and HDSI (Figure 1b), showed that 51 and 49 genotypes representing about 34.4 and 33.1% of the MSD population had a negative value (less than zero) under heat and HD environment, respectively, indicating that these genotypes became softer under stressed conditions than under optimum condition. In contrast, most of the MSD population (65.5 and 66.9%) changed towards harder grain under heat and HD environments, respectively (Figure 1b).
Hardness is one of the traits reported to correlate with kernel weight and other kernel-shape traits [9]. In our previous study [19], we discussed the effect of the stress environments on the kernel shape traits, including the kernel weight, and we identified some tolerant genotypes under heat or HD environment based on their kernel weight reduction. The correlation between the hardness and the other kernel-shape traits showed that kernel weight was significantly negatively correlated with hardness under optimum and stress conditions. However, this correlation became stronger under stress environments (Table S1). All the kernel-shape traits except kernel weight correlated with hardness only under stress environments (Table S1).
One of our objectives in the present study was to investigate whether the stabilization of kernel hardness under stress condition was associated with stress tolerance. Since kernel weight is correlated with hardness, the kernel weight susceptibility indexes, which assess the reduction under stress compared with optimum conditions. Thus, it can be used as tolerance indicators. We investigated the relationship between hardness and kernel weight for heat and heat-drought susceptibility index (HSI and HDSI) for the MSD lines (Figure 2). We observed a relationship between stress tolerance (a low kernel weight reduction) and hardness stabilization under stress condition. The kernel weight HSI ranged from 0.44 to 1.55, and the kernel weight HDSI ranged from 0.67 to 1.36. The hardness HSI ranged from −2.5 to 9.2, and the hardness HDSI ranged from −2.9 to 8.4. Genotypes with HSI and HDSI values less than 0.75 and 0.79, respectively (i.e., kernel weight reductions less than 20 and 27%, respectively) were considered to be tolerant, whereas the genotypes with HSI and HDSI values greater than 1.3 and 1.2, respectively (i.e., kernel-weight reductions greater than 35 and 41%, respectively) were considered stress-susceptible.
There was a clear association between having stable hardness and tolerance to heat or HD stress. The kernel weight HSI showed that 17 genotypes had a low kernel weight reduction, of which 12 had only a slight change in hardness, which remained stable or became softer (as shown in red color in Figure 2a). Based on HDSI, ten genotypes had a low kernel weight reduction, of which six had a low change in hardness (as shown in red color in Figure 2b).
In contrast, among 14 genotypes with high kernel weight reduction, 8 were largely affected in their hardness as shown in yellow color in (Figure 2). Of the 10 genotypes that had a high reduction in kernel weight under HD, 6 of them had a high change in hardness (with yellow color Figure 2). Among these genotypes, we found five genotypes shared for both HSI and HDSI (Figure 3). The tolerant line MSD187, which we identified in our previous study [19], had low change in hardness under both heat and HD (Figure 3a), whereas the sensitive line MSD259 showed a large reduction in hardness under both heat and HD (Figure 3b). The cultivars ‘Norin 61’, which is the parent of the MSD lines, and ‘Imam’, had relatively high reductions in kernel weight and moderate changes in hardness under heat conditions compared with MSD187 (Figure 3a). We further tested these lines for their internal structure and protein content to investigate the relationship between the kernel weight reduction and stabilization or modification of hardness.

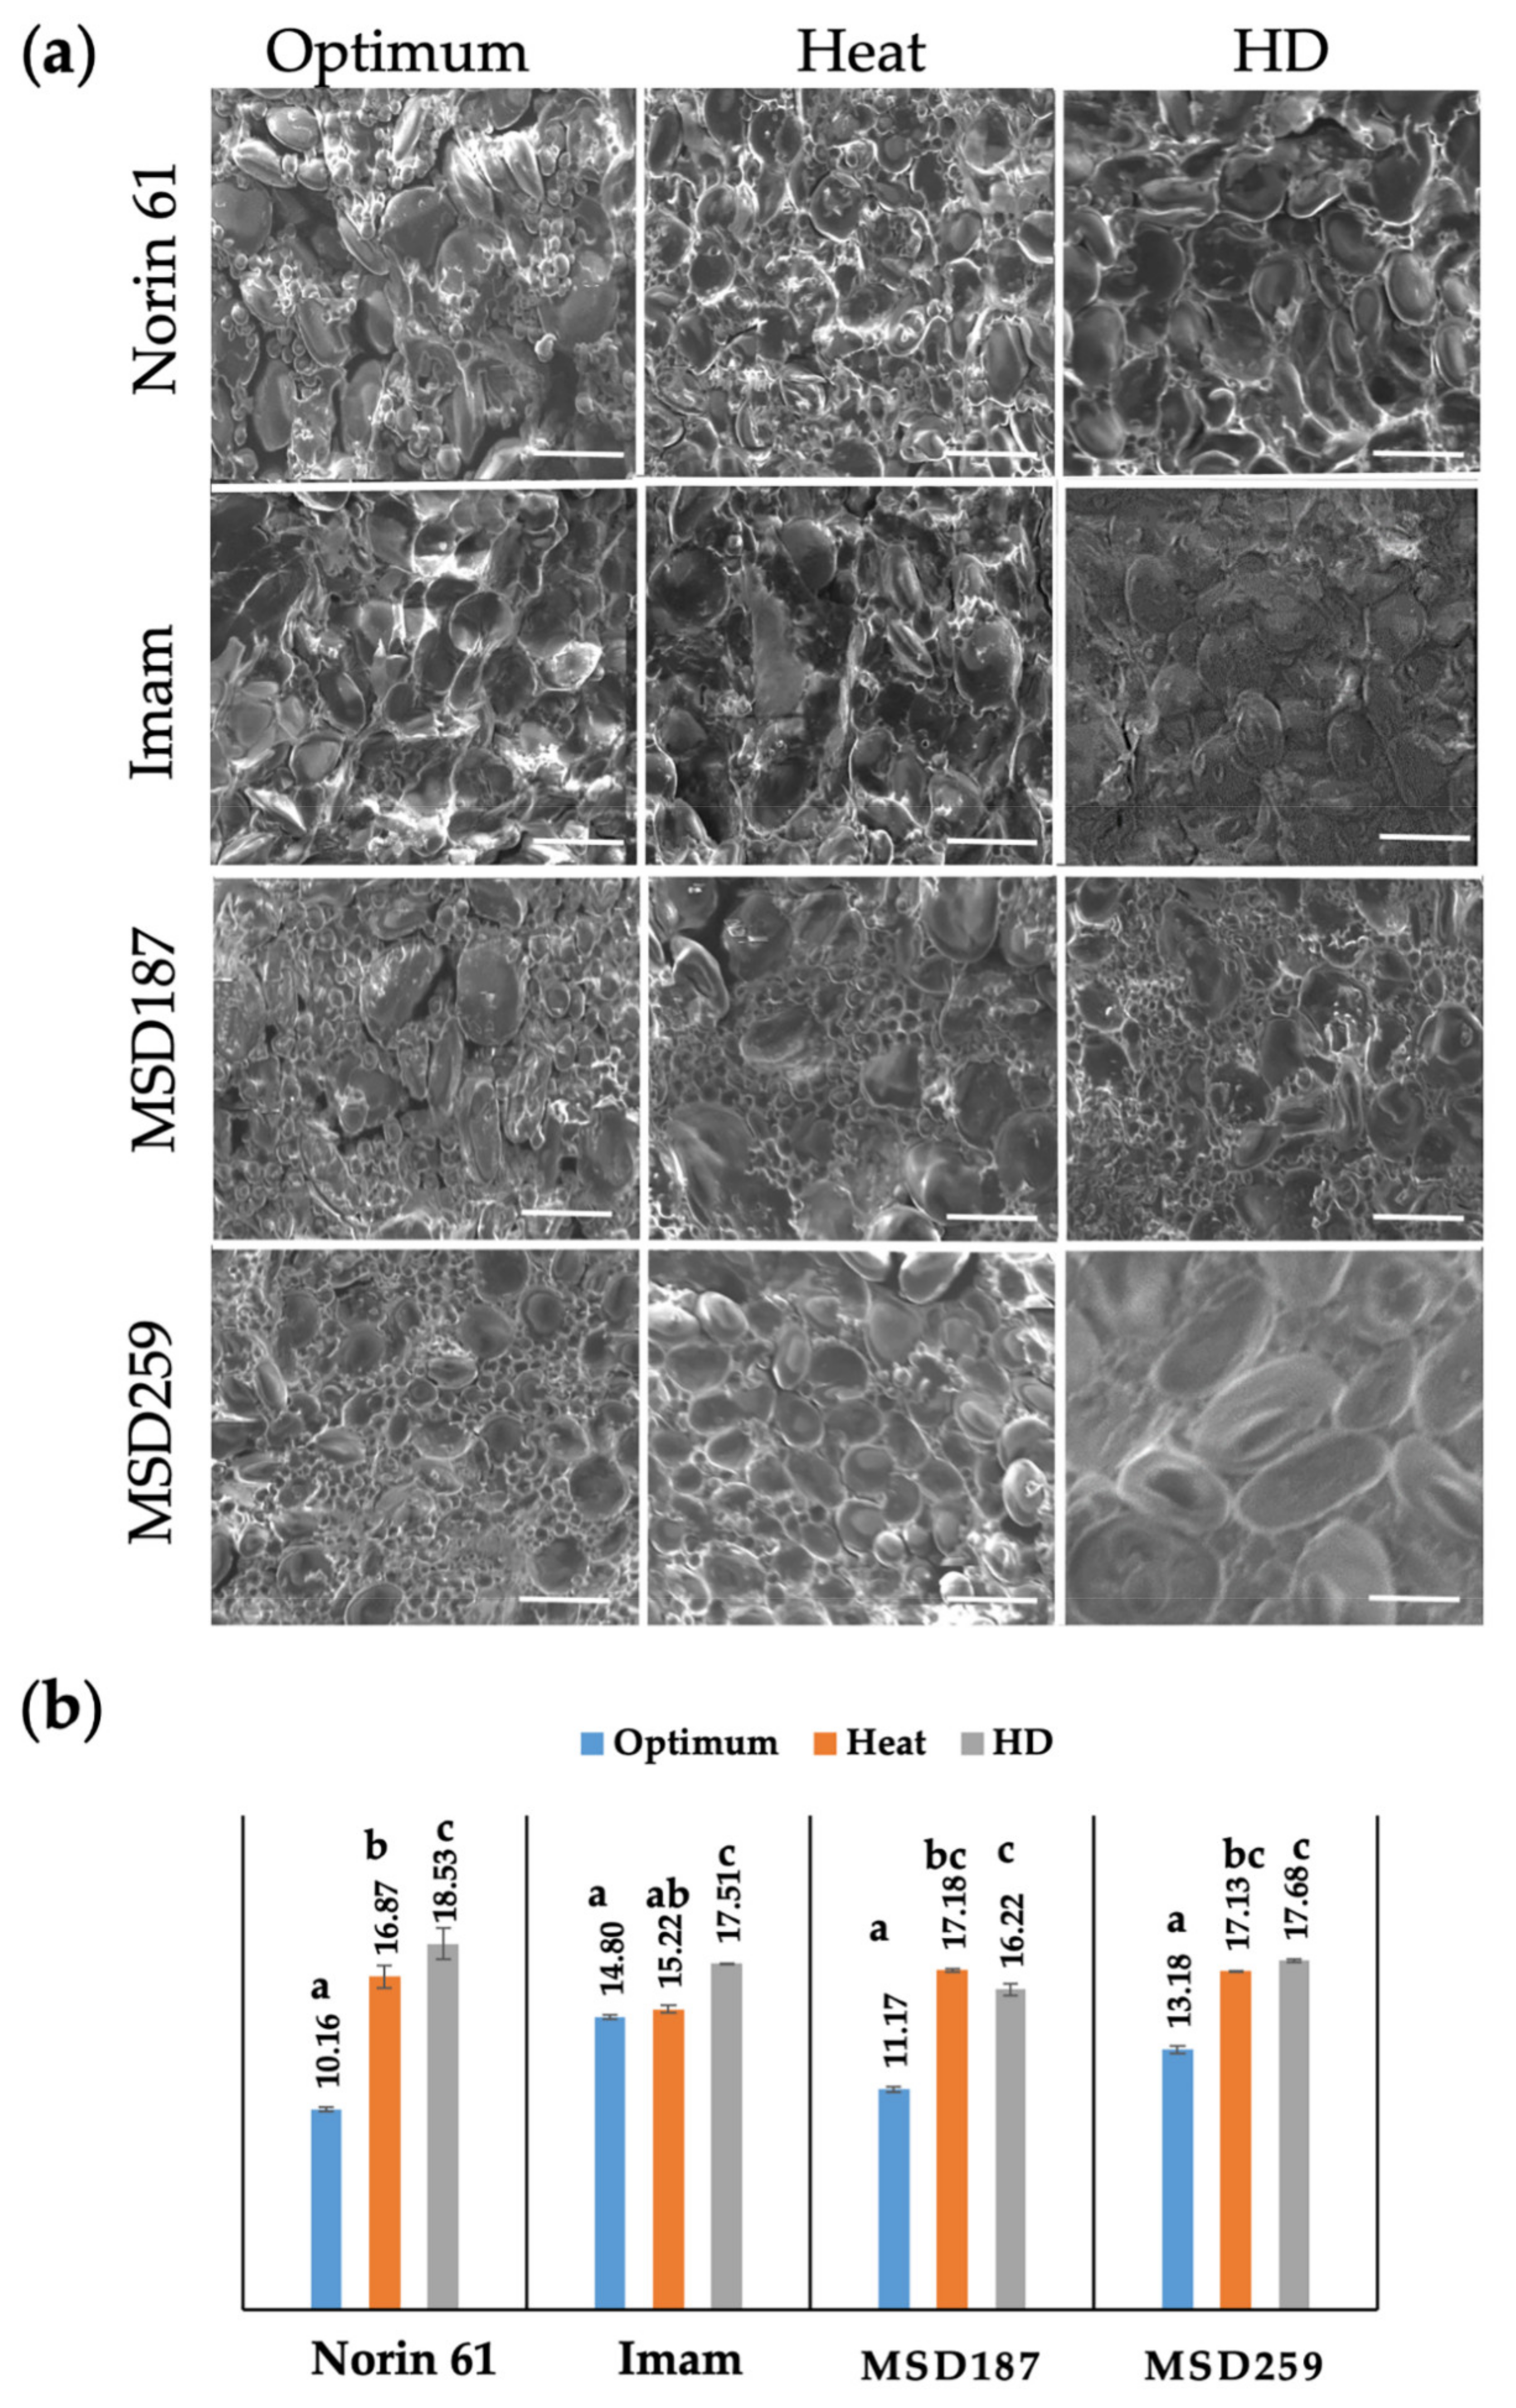
3.2. Internal Structure and Protein Content

We used a scanning electron microscope (SEM) to examine the internal structure of the mature kernels of the selected tolerant (MSD187), sensitive (MSD259), ‘Norin 61’ accessions and of the ‘Imam’ (Figure 4a). The starch granules of ‘Norin 61’ were loosely packed under optimum conditions as well as heat and HD condition, which indicates a soft kernel. ‘Imam’, which was hard under optimum as well as heat and HD, showed embedded starch granules with no gaps, which indicates hard kernels (Figure 4a). We observed that the surface of starch granules of the tolerant line MSD187 were separated from the protein matrix under optimum, heat and even under HD with no change due to the stresses (Figure 4a). In contrast, the starch granules of the sensitive line MSD259 were separated under optimum; however, under heat and especially HD, starch granule were tightly attached to the protein matrix, and were embedded in the protein matrix, indicating an increase in hardness as response to the stresses.
We observed an increase in protein content under heat conditions in the four tested lines comparing to optimum condition (Figure 4b), which could be due to the big variation between optimum in Japan and stress conditions in Sudan. However, in the Sudanese conditions, when HD and heat were compared, the protein content of the tolerant line MSD187 decreased compared to the sensitive line MSD259 and ‘Norin 61’ (Figure 4b). This indicated that a decrease in protein content is associated with a low change in hardness.

3.3. Marker Traits Association of Hardness and Hardness Indexes under Optimum and Stress Conditions

In the current study, we performed a genome-wide association study (GWAS) to identify genetic loci that contribute to hardness under optimum, heat, and HD conditions. We found a total of 47 statistically significant markers (Table 2). The Manhattan plots revealed several significant associations for hardness under all conditions (Figure 5). The A genome contributed to hardness only under stress conditions, in which chromosome 1A under HD, and 4A under both heat and HD environments showed significant MTAs (Figure 5, Table 2). In the B genome, only chromosome 5B contributed to hardness under optimum as well as stress condition. The D genome contributed more strongly to hardness than the A and B genomes, with the D genome explaining 91.4% of the total contribution under optimum, heat, and HD environments.
We observed MTAs on chromosome 5D under all three conditions (Figure 5, Table 2). The marker with the highest significance was 1,127,970 with 22.6% of the phenotypic variation explained (PVE) under optimum environment. Also, significant MTAs were observed on chromosome 4D, under heat and HD (Figure 5). Interestingly, these association appeared only under the stress environments. The marker with the highest significance was 1062681|F|0-26 on chromosome 4D was associated with heat and HD with a PVE of 20.5 and 17.3%, respectively. In addition, we obtained significant associations on chromosomes 6D and 7D under stress condition, but with a few significant markers under optimum conditions. Marker 1074408|F|0-12 on chromosome 6D was associated with heat and HD with PVE of 13.7 and 13.1%, respectively. Marker 3222372|F|0-27 on chromosome 7D was associated with heat conditions and had a PVE of 19.8%.
Hardness indexes revealed 45 MTAs for hardness heat index and hardness heat drought index (HI, HDI) distributed in the A, B, and D genomes. The highest contribution was from the D genome (64%, of which 62% was located on chromosome 4D), versus 22 and 14% for the A and B genomes, respectively (Table S2, Figure S1). Marker 1062681|F|0-26 on chromosome 4D was highly significant under heat and HD environments and was associated with both hardness and the hardness indexes, indicating that it contributed only under stress condition (Table S2). This marker explained 20.5, 17.3, and 17.5% of the PVE of heat, HD and HI, respectively (Table 2 and Table S2).

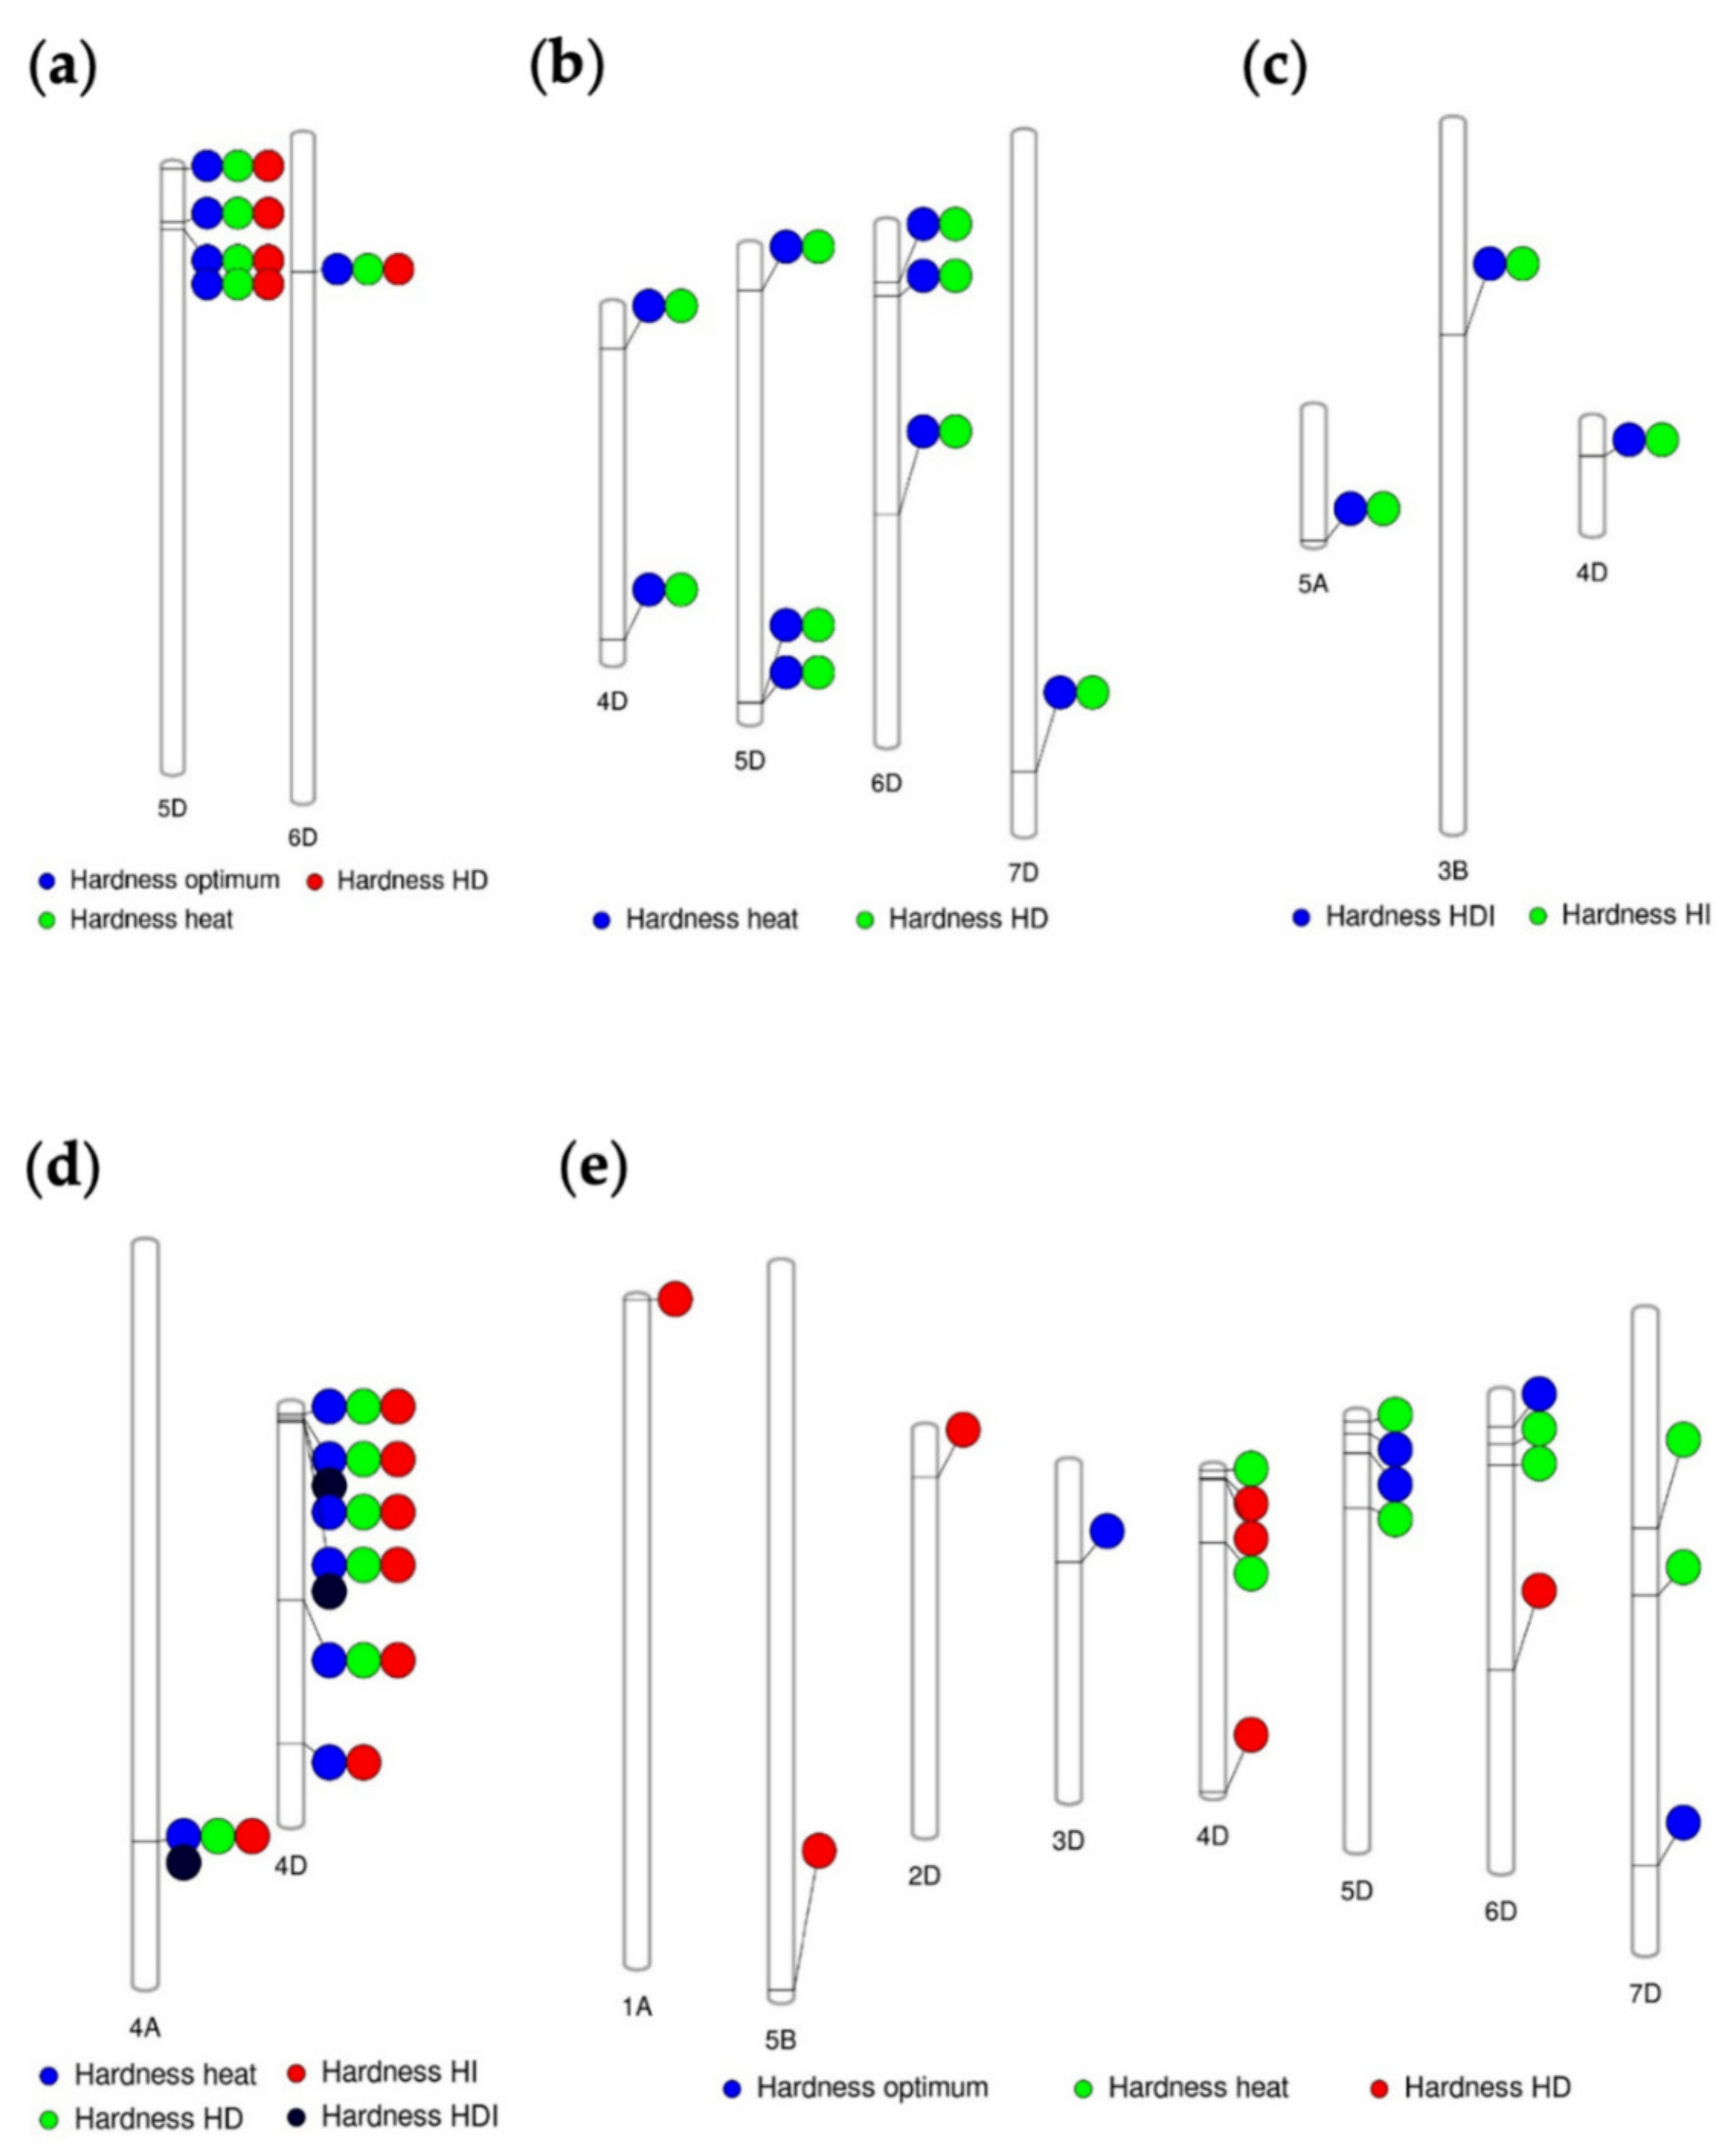
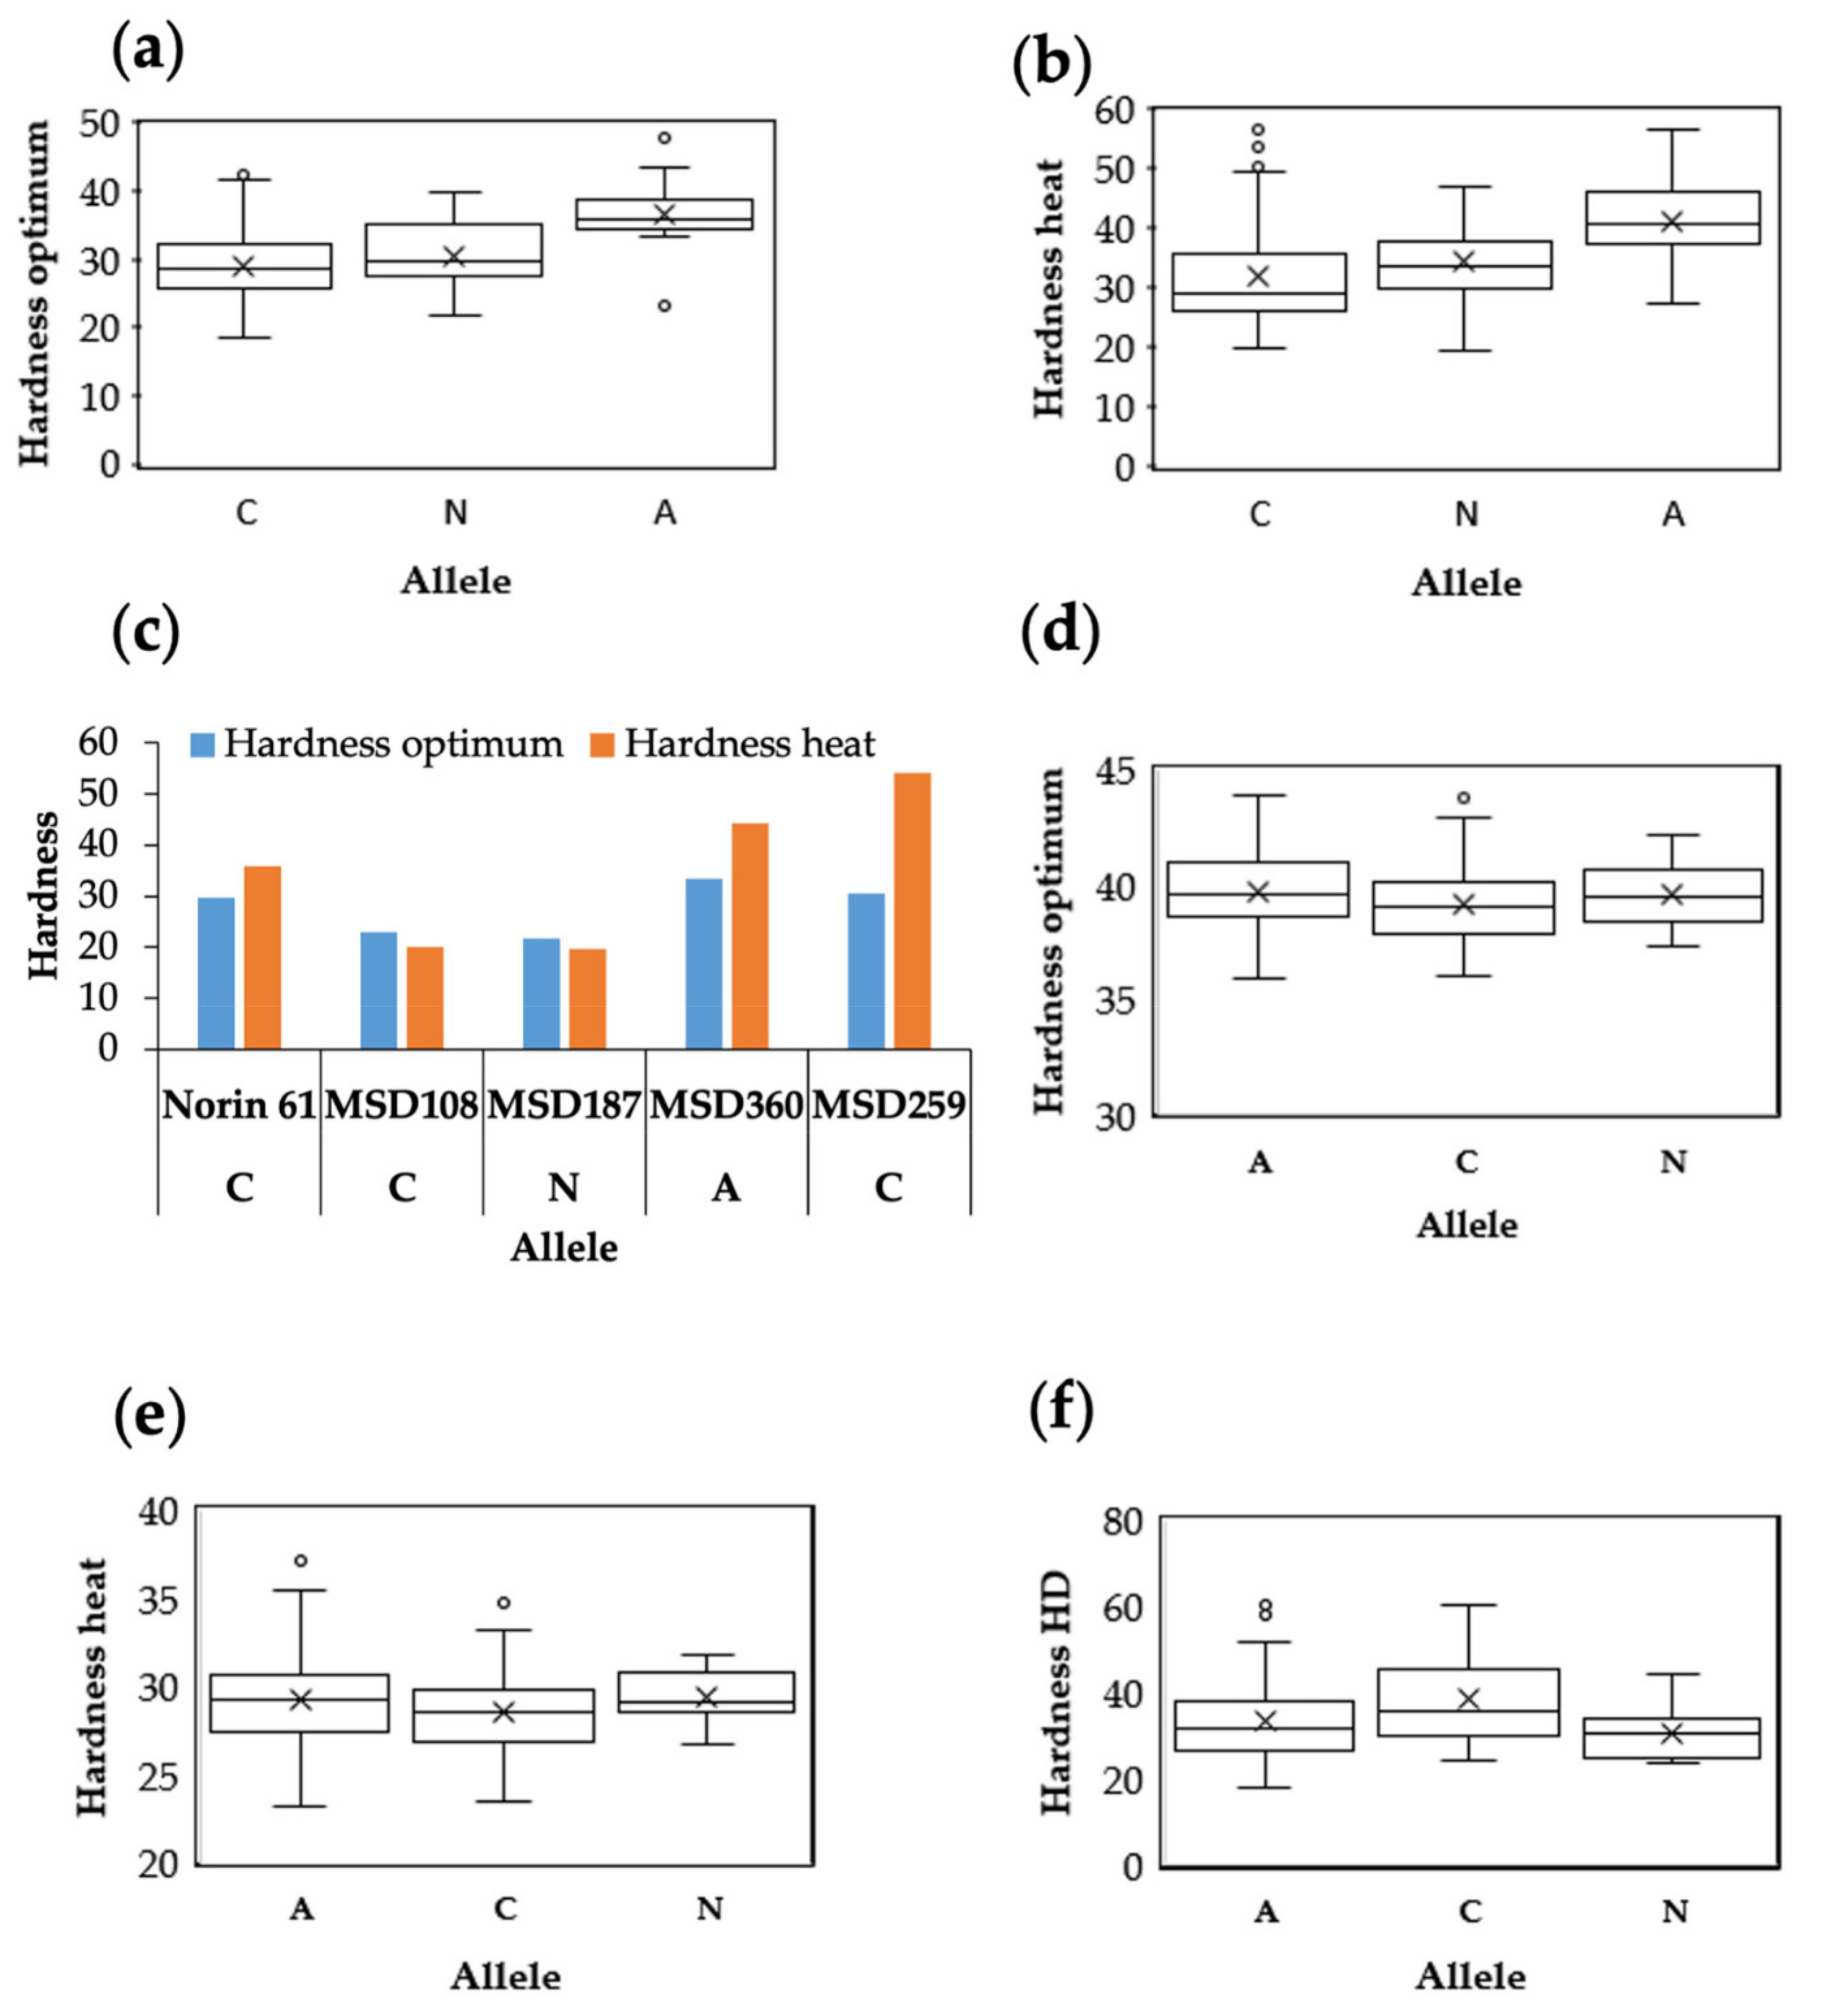
3.4. Common and Specific MTAs Associated with Kernel Hardness under Optimum and Stress Conditions

We identified stable markers for hardness across the three conditions, mainly in the D genome on chromosomes 5D and 6D (Figure 6a). We also detected significant markers in the D genome associated only with stress conditions on chromosomes 4D, 5D, 6D, and 7D (Figure 6b). Meanwhile, we identified markers from the A, B, and D genomes associated only with the two hardness indexes (Figure 6c, Table S2), indicating that these markers were associated with the modification of hardness in response to stress condition (Figure 6c). We identified markers associated with stress for hardness and the hardness indexes (Figure 6d). Most of the markers that we detected in the D genome were common across all conditions, whereas markers in the A and B genomes were specific to the HD condition (Figure 6e).
Under the optimum condition, there were significant associations with hardness only on the short arm of chromosome 5D, however, under the stress environments of heat and HD, there was another association on the long arm (Figure 5). This indicates that there are gene(s) on the chromosome 5D other than puroindoline contributing to the hardness under stress conditions. We noticed that all the markers associated with kernel weight and shape traits on chromosome 5D under the stress environments located on the long arm [19]. This result led us to investigate the relationships between markers for grain hardness and the kernel weight or shape traits under stress on this chromosome arm. However, we did not identify pleiotropic markers for both hardness and the kernel weight or shape traits (Figure S2).

3.5. Candidate Genes for Hardness and Gene Expression

We searched for candidate genes associated with the significant markers. We targeted the markers with a high PVE combined with a function related to hardness. The resulting candidates are listed in Table 3. Marker 1,127,970 on chromosome 5D was stable under all conditions and it encodes a puroindoline gene. Marker 3,532,985 on chromosome 5D detected under optimum and heat environments encoded for sucrose transporter gene SUT.
We further investigated the SUT allele’s contribution to hardness under optimum and heat environments (Figure 7a–c). We found that the “C” allele and “N” allele were associated with decreased hardness, whereas, the “A” allele was associated with increased hardness (Figure 7a,b). However, when we checked a stress-tolerant line (MSD187), a sensitive line (MSD259), and their parent ‘Norin 61’, we found that both the sensitive line and ‘Norin 61’ harbored the “C” allele that decreased hardness, whereas the tolerant line harbored the “N” allele (Figure 7c). Marker 3,947,128 on chromosome 1A was associated with hardness under HD and encodes for antigen that causes celiac disease in human, which is an autoimmune disease that triggered by wheat gluten. We investigated the allele’s contributions to celiac disease (Figure 7d–f) and found that under optimum condition, the allele’s contribution was almost the same (Figure 7d). However, under HD, allele “C” contributed to increase hardness. In contrast, the allele “A” contributed to decrease hardness. Markers 3944483, 1073587|F|0-24, and 5,357,783 were common and stable markers under all environments and encodes for NB-ARC protein. Marker 998809|F|0-7 on chromosome 4D encodes an ATP/ADP transporter. Moreover, we found that a marker associated with a candidate no-apical-meristem (NAM) gene was associated with marker 1,099,828 on chromosome 3B.
We detected the expression for the candidate genes using the expression data from expVIP databases [23] and compared their expression to puroindoline genes (Pina and Pinb) expression. The expression of puroindoline was high on seed part such as endosperm, starchy endosperm, seed coat and aleurone (Figure S3). The candidate gene TraesCS5D02G001200 on the chromosome 5D showed expression on seed parts besides shoot, leaves and root. The candidate gene TraesCS4D02G047400 on the chromosome 4D showed expression on seed part and spike (Figure S3). The candidate gene TraesCS1A02G008000 on the chromosome 1A that encodes for the antigen that cause celiac disease in human showed a high expression level same as puroindoline genes (Figure S3).

4. Discussion

4.1. Phenotypic Variation and Diversity for Hardness

Hardness is an important milling quality trait that is known to be controlled by two puroindoline genes (Pina and Pinb) on the short arm of chromosome 5DS [2]. In the current study, we detected the effect of heat and HD environments on hardness in the MSD population. We aimed to identify MTAs, and possible candidate genes that contributed to the stability or modification of kernel hardness under heat and combined heat-drought conditions, and to investigate whether the stabilization of kernel hardness under stress was associated with stress-tolerance genes.
The wide variation observed among the MSD genotypes indicates high diversity in this population, which includes genes derived from 43 Aegilops tauschii accessions [18]. However, most of the genotypes had soft kernels and resembled the backcross parent, ‘Norin 61’. Gedye et al. [24] characterized several synthetic wheat lines and found that most of the population had soft kernels.
MSD population shifted to become harder under heat and HD conditions. This could be attributed to the increased protein content under stress condition [25]. In addition, stress affected the plants, causing smaller kernels; this will lead to reduced kernel weight and overall yield [26]. This is due to the difference of the conversion ratio of carbohydrate and protein, i.e., the conversion ratio of carbohydrate is highly affected by the stress but not much in protein, resulting in smaller grains with a higher protein content. These seeds become harder than plump seeds with much starch [26].
Moreover, under heat and drought stress, the short kernel-filling duration results in less starch accumulation in wheat [27]. This, in turn, could also lead to increased hardness since starch content is negatively associated with kernel hardness [1].
Climate change is adversely affecting wheat production around the world, leading to yield losses and decreased quality [6]. Therefore, identifying varieties that have both high yield and high quality is critical for food security in the context of global climate change. These varieties will also be crucial for breeding programs. The resulting varieties will increase satisfaction for all stakeholders in the wheat value chain [28]. We observed a relationship between stress tolerance and stable kernel hardness or being softer under heat and HD environments. This could be attributed to the starch accumulation that occurs under stress conditions. Prathap and Tyagi [29] found that stress-tolerant rice lines can accumulate starch under drought stress due to the action of starch synthase enzymes and that this could lead to softer kernels under stress.
We confirmed our results by measuring the kernel protein content and examining the endosperm’s internal structure using an SEM. One important difference between soft and hard kernels was the degree of adhesion between starch granules and the protein matrix; starch granules in soft kernels were separated from the protein matrix [30]. Hard kernels instead had tight adhesion between starch granules and the protein matrix, and the starch granules were embedded in the protein matrix [31]. The stress-tolerant line MSD187 showed separated starch granules under heat and HD conditions. In contrast, the sensitive line MSD259 showed embedded starch granules with no gaps under stress condition. This indicates that the sensitive line’s kernels became harder under stress condition.
Under HD conditions, the protein content increased in the sensitive line, whereas the protein content for the tolerant line decreased. This result suggests that a smaller change in hardness is associated either with less change in the protein content or with decreasing protein content. Protein content is known to increase under stress condition. Peterson et al. [32] reported that one of the factors associated with increasing kernel hardness was an increase of the protein content. All these findings suggest that the stress-tolerant MSD lines could maintain their kernel hardness under stress conditions. These lines therefore represent an excellent resource for breeding stress-tolerant wheat genotypes with high yield and a range of end-use qualities.

4.2. Marker Traits Association for Hardness under Optimum and Stress Conditions

Our results indicated that the D genome contributed strongly to kernel hardness under all conditions, with a diverse range of D-genome markers associated with hardness. Among the MTAs in the D genome, we detected a significant association for marker 1,127,970 on chromosome 5D, whose associated gene encodes a puroindoline protein. This marker was stable across all conditions. We observed a high expression level for puroindoline on seed parts such as endosperm, starchy endosperm, and aleurone, whereas it showed low expression levels in shoots and roots. Similar results were reported by Kiseleva et al. [5].
In addition to the puroindoline genes, other markers associated with hardness were found on chromosome 5D under optimum as well as stress environments. Among these markers, marker 3,532,985 far with (1.52) Mb from Pinb contributed to hardness with 16.1 and 12.1% PVE under optimum and heat environments, respectively. The candidate gene TraesCS5D02G001200 for this marker encodes the sucrose transporter TaSUT. Starch formation in wheat kernels requires importation of sugar in the form of sucrose via a sucrose transporter [33]. TaSUT has five homologs, including TaSUT2-5D, which is located on chromosome 5D [34]. A recent study by Al-Sheikh Ahmed et al. [35] showed that TaSUS1 is associated with increased kernel weight under drought stress. This may explain the association between kernel weight and hardness. However, further investigation of the alleles in the stress-tolerant and sensitive lines indicate that both had alleles that decreased the hardness. This finding demonstrates that the activity of the sucrose transporter is not sufficient on its own to stabilize kernel hardness under stress. We found high expression of this gene in all wheat tissues, and this is logical since those genes are associated with sink–source relationships and starch formation.
We detected a marker 3,944,483 on chromosome 5D that was stable under all conditions. This marker is associated with the candidate gene TraesCS5D02G037000, which encodes an NB-ARC protein. The NB-ARC is a stress-resistance protein that contains a central nucleotide-binding domain [36]. It works as a dynamic signaling molecules performing reversible interaction which confer resistance to a wide variety of microbes [37]. Previously, Giroux et al. [38] reviewed the role of puroindoline genes in the plant defense. These results indicated that there are factors controlling hardness associated with plant defense against pathogens. Beside this marker we also found other markers; 1073587|F|0-24, and 5,357,783 under both heat and HD environments have the same candicey gene TraesCS6D02G105100, which encodes for NB-ARC protein, indicating that this gene also affects hardness under stress condition. However, we detected a low expression level for this gene in all tissues.
We detected a significant association for both kernel weight and hardness on the long arm of chromosome 5D under a stress environment. Previously, we detected a significant peak for kernel size under HD environment on the long arm of chromosome 5D [19]. We also found MTAs that appeared under stress and that were associated with kernel shape traits on the long arm on chromosome 5D [19]. These results indicated the occurrence of alleles that contribute to hardness, kernel weight, and kernel shape traits on chromosome 5D under stress environments and this could explain the relationship between hardness and shape traits under these conditions. However, we could not identify common markers between hardness and kernel weight despite of the phenotypic correlation between them and with the other shape traits. This may be due to the complexity of the MSD accessions, which have huge diversity resulting from the diverse D genome sources. In addition, the candidate gene TraesCS5D02G036300 associated with marker 1,025,407 encodes a zinc finger RING-type domain–containing protein. A recent study in wheat indicated that overexpression of this gene increases tolerance to drought and salinity [39].
On chromosome 1A, the marker 3,947,128 associated with the candidate gene TraesCS1A02G008000 encodes a protein associated with triggering symptoms of celiac disease in humans. Celiac disease is a multisystem immune-based disease triggered by the ingestion of gluten in genetically susceptible individuals [40]. We noticed a high expression level for this marker in the kernel, endosperm, and aleurone, same as the puroindoline expression level. Ribeiro et al. [40] found a negative but non-significant correlation between hardness and amount of toxic epitopes potentially associated with celiac disease.
We also identified MTAs that were only associated with the hardness indexes HI and HDI, which indicate an association with the change of hardness in response to stress condition. We found that all the A, B, and D genomes contributed to the hardness change under stress environments. Among them, we found that marker 1,099,828 on chromosome 3B contributed to hardness, with PVE of 12 and 10% for HI and HDI, respectively. The candidate gene TraesCS3B02G533100 encodes an NAM gene. Uauy et al. [41] reported that NAM-B1 underlies a high-protein-content locus (GPC-B1) that originated from wild emmer (durum) wheat, Triticum turgidum. This gene accelerates senescence, leading to increased protein content and nutrient content in the kernel (through a sink–source relationship). This gene shows expression on the seed coat, aleurone, and spike.
Puroindoline genes are major genes that control kernel hardness under optimum condition. However, it remains unclear whether puroindoline genes also control kernel hardness under stress condition or whether other genetic factors are responsible. Interestingly, we identified a significant peak on chromosome 4D under heat and HD stress environments as well as hardness indexes HI and HDI. This indicates the occurrence of genetic factors on chromosome 4D that contribute to hardness maintenance under stress environment. We also identified significant peaks on chromosomes 6D and 7D under stress, indicating that the associated loci contribute to kernel hardness under stress condition. In contrast with Wilkinson et al. [42], who found a puroindoline-like gene sequence on the long arm of a chromosome homoeologous to chromosomes 7A, 7B, and 7D, we did not identify such a gene sequence on chromosome 7D, indicating that the occurrence of other genetic factors on chromosome 7D contribute to kernel hardness.
We detected several markers on chromosome 4D. Marker 998809|F|0-7 was associated with stress conditions and had a PVE of 14.4 and 11.1% under heat and HD environments, respectively. This marker encodes an ATP/ADP transporter gene. Wang et al. [43] explained that ATP/ADP transporter genes increase the starch content in transgenic Arabidopsis. This could explain why the kernels of some genotypes became softer under stress conditions.
Additionally, we found marker 1062681|F|0-26 contributes for hardness and HI as well as heat and HD environments, with PVE 20.5, 17.3, and 17.4%, respectively. The associated candidate gene TraesCS4D02G047400 encodes glutamine synthetase. This enzyme plays an important role in nitrogen-use efficiency and in the uptake and assimilation of nitrogen [44]. These findings indicate that these MTAs are associated with nitrogen-use efficiency genes under stress environment, which is an important stay-green stress-tolerance mechanism. The stay-green trait results from a balance between N demand by the kernels and the N supply during kernel filling [45]. This suggests that hardness resulted from a stay-green mechanism associated with glutamine synthetase. Pinto et al. [46] showed an association of the stay-green trait in wheat with stress tolerance and identified markers on chromosomes homoeologous to 4A and 4B. Here we found the association on chromosome 4D, demonstrating that the stay-green influence hardness. We observed the same expression as puroindoline in the seed in addition to the spike. Muhitch [47] found glutamine synthetase in the developing kernel of maize plants, and it was abundant in the pedicel, pericarp, and kernel glumes.
We found marker 1001438|F|0-46 to be associated with heat conditions, and its contribution to hardness was high (PVE of 18.9%). The associated gene was close to the Rht-D1 region (2.4 Mb), indicating that dwarfing genes could be one of the factors that affects kernel hardness under heat conditions. Wang et al. [14] studied a recombinant inbred line population derived from crosses between accessions with soft and extra soft kernels and found a QTL on chromosome 4D that was close to the semi-dwarf gene Rht-D1.
Based on what is known about the abovementioned candidate genes, we hypothesize that the expression of those genes would affect kernel hardness. For instance, the candidate sucrose transporter gene, which plays a role in transporting sucrose, promotes starch accumulation in the kernels, and the candidate ATP/ADP transporter gene also increases starch content, which leads to decreased hardness under stress. The candidate NAM gene, which plays a role in source–sink nutrient and protein contents, leads to increased protein content, which increases kernel hardness. Moreover, the candidate glutamate synthase gene plays a role in nitrogen-use efficiency, increasing the uptake and assimilation of nitrogen resulting in high protein content, which in turn produces harder kernels.
We hypothesize that the stress-tolerant plants have a mechanism that utilizes the abovementioned genes efficiently, thereby maintaining the ratio between the starch and protein contents and leading to stabilization of kernel hardness and yield. However, further study will be needed to validate this hypothesis.

5. Conclusions

Heat and combined heat-drought (HD) environments increase hardness. We observed that the MSD line (MSD187) with tolerance potential to heat and HD environments had more stable hardness than the sensitive line (MSD259). We identified MTAs on chromosome 4D that associate with hardness under stress environment and hardness indexes (HI and HDI). This indicates that occurrence of MTAs contributes to the hardness changes under stress conditions. Along with dissecting candidate genes that can contributes for hardness change specially under stress environment, our findings could play an important role in understanding the factors that control the changes of the hardness under stress environments and their relationships to the stress tolerance. This will help breeders to develop stress-tolerant cultivars that maintain high yield and stable hardness, capable of resisting the adverse effects of global warming, thereby improving food security.

Supplementary Materials

The following are available online at https://www.mdpi.com/article/10.3390/agronomy11061061/s1, Figure S1. Manhattan plot and Q-Q plot for kernel hardness indices (a) Hardness heat indices HI, (b) Hardness drought indices HDI, (c,d) Q-Q plot for hardness indices. Figure S2. Relationship between all markers on chromosome 5D associated with hardness and kernel weight and shape related traits. Figure S3. Expression of the candidate genes and Pina, Pinb, GSP-1 in different tissues of wheat based on RNA-sequencing data collected from different experiments. Table S1. Correlation between hardness, kernel weight and shape related traits under optimum, heat and HD. Table S2. Marker trait associations of hardness of multiple synthetic derivatives for heat index (HI) and heat-drought index (HDI).

Author Contributions

H.T. (Hisashi Tsujimoto), H.T. (Hiroyuki Tanaka), N.M.K. and Y.S.A.G. proposed the research idea and designed the study; G.M.I.E. performed the experiment in Japan; I.S.A.T. designed and managed the experiment in Sudan; G.M.I.E. and N.M.K. performed the statistical analysis; G.M.I.E., Y.S.A.G. and Y.Y. performed the genotypic analysis; G.M.I.E. wrote the manuscript with inputs from Y.S.A.G. and N.M.K.; and N.M.K., Y.S.A.G., H.T. (Hisashi Tsujimoto), and H.T. (Hiroyuki Tanaka) supervised the research. All authors have read and agreed to the published version of the manuscript. T.I. aided with the electron microscope measurements. Y.B. and K.K. assist for measurement of kernel hardness and revised the manuscript.

Funding

This study was partly funded by the Science and Technology Research Partnership for Sustainable Development (SATREPS, JPMJSA1805), by JST, Kakenhi Grant (18H02179), and by the Marginal Region Agriculture Project of Tottori University.

Institutional Review Board Statement

Not applicable.

Informed Consent Statement

Not applicable.

Data Availability Statement

All data is available from the manuscript or the Supplementary Materials.

Acknowledgments

We thank the technical staff of Agriculture Research Center for managing the Sudan field, M. Iwashita and S. Okida; the technical staff in Arid Land Research Center for assistance with the CN Corder; staff of the National Agriculture and Food Research Organization for their kind support during the single-kernel characterization system (SKCS) measurements; and Sachiko Matsunaga for assistance with the SKCS measurements.

Conflicts of Interest

The authors declare no conflict of interest.

References

  1. Muqaddasi, Q.H.; Brassac, J.; Ebmeyer, E.; Kollers, S.; Korzun, V.; Argillier, O.; Stiewe, G.; Plieske, J.; Ganal, M.W.; Röder, M.S. Prospects of GWAS and predictive breeding for European winter wheat’s grain protein content, grain starch content, and grain hardness. Sci. Rep. 2020, 10, 1–17. [Google Scholar] [CrossRef]
  2. Giroux, M.J.; Morris, C.F. Wheat grain hardness results from highly conserved mutations in the friabilin components puroindoline a and b. Proc. Natl. Acad. Sci. USA 1998, 95, 6262–6266. [Google Scholar] [CrossRef] [Green Version]
  3. Bhave, M.; Morris, C.F. Molecular genetics of puroindolines and related genes: Allelic diversity in wheat and other grasses. Plant Mol. Biol. 2008, 66, 205–219. [Google Scholar] [CrossRef] [PubMed]
  4. Wang, G.; Leonard, J.M.; von Zitzewitz, J.; Peterson, C.J.; Ross, A.S.; Riera-Lizarazu, O. Marker–trait association analysis of kernel hardness and related agronomic traits in a core collection of wheat lines. Molec. Breeding. 2014, 34, 177–184. [Google Scholar] [CrossRef]
  5. Kiseleva, A.A.; Leonova, I.N.; Pshenichnikova, T.A.; Salina, E.A. Dissection of novel candidate genes for grain texture in Russian wheat varieties. Plant Mol. Biol. 2020, 104, 219–233. [Google Scholar] [CrossRef]
  6. IPCC. Climate Change Synthesis Report Contribution of Working Groups I. II and III to the Fifth Assessment Report of the Intergovernmental Panel on Climate Change; IPCC: Geneva, Switzerland, 2014; p. 151. [Google Scholar]
  7. Zandalinas, S.I.; Mittler, R.; Balfagón, D.; Arbona, V.; Gómez-Cadenas, A. Plant adaptations to the combination of drought and high temperatures. Physiol. Plant. 2018, 162, 2–12. [Google Scholar] [CrossRef] [Green Version]
  8. Ashraf, M. Stress-induced changes in wheat grain composition and quality. Crit. Rev. Food Sci. Nutr. 2014, 54, 1576–1583. [Google Scholar] [CrossRef] [PubMed]
  9. Sun, X.; Liu, T.; Ning, T.; Liu, K.; Duan, X.; Wang, X.; Wang, Q.; An, Y.; Guan, X.; Tian, J.-C.; et al. Genetic dissection of wheat kernel hardness using conditional QTL mapping of kernel size and protein-related traits. Plant Mol. Biol. Report. 2018, 36, 1–12. [Google Scholar] [CrossRef]
  10. Szabó, B.P.; Gyimes, E.; Véha, A.; Horváth, Z.H. Flour quality and kernel hardness connection in winter wheat. Acta Univ. Sapientiae Aliment. 2016, 9, 33–40. [Google Scholar] [CrossRef] [Green Version]
  11. Triboï, E.; Martre, P.; Triboï-Blondel, A.M. Environmentally-induced changes in protein composition in developing grains of wheat are related to changes in total protein content. J. Exp. Bot. 2003, 54, 1731–1742. [Google Scholar] [CrossRef]
  12. Pasha, I.; Anjum, F.M.; Morris, C.F. Grain hardness: A major determinant of wheat quality. Food Sci. Technol. Int. 2010, 16, 511–522. [Google Scholar] [CrossRef]
  13. Bordes, J.; Ravel, C.; Le Gouis, J.; Lapierre, A.; Charmet, G.; Balfourier, F. Use of a global wheat core collection for association analysis of flour and dough quality traits. J. Cereal Sci. 2011, 54, 137–147. [Google Scholar] [CrossRef]
  14. Wang, G.; Leonard, J.M.; Ross, A.S.; Peterson, C.J.; Zemetra, R.S.; Campbell, K.G.; Riera-Lizarazu, O. Identification of genetic factors controlling kernel hardness and related traits in a recombinant inbred population derived from a soft × ‘extra-soft’ wheat (Triticum aestivum L.) cross. Theor. Appl. Genet. 2012, 124, 207–221. [Google Scholar] [CrossRef]
  15. Chen, J.; Zhang, F.; Zhao, C.; Lv, G.; Sun, C.; Pan, Y.; Guo, X.; Chen, F. Genome-wide association study of six quality traits reveals the association of the TaRPP13L1 gene with flour colour in Chinese bread wheat. Plant Biotechnol. J. 2019, 17, 2106–2122. [Google Scholar] [CrossRef] [Green Version]
  16. Hernández-Espinosa, N.; Mondal, S.; Autrique, E.; Gonzalez-Santoyo, H.; Crossa, J.; Huerta-Espino, J.; Singh, R.P.; Guzmán, C. Milling, processing and end-use quality traits of CIMMYT spring bread wheat germplasm under drought and heat stress. Field Crop. Res. 2018, 215, 104–112. [Google Scholar] [CrossRef]
  17. Tomás, D.; Viegas, W.; Silva, M. Effects of post-anthesis heat waves on the grain quality of seven European wheat varieties. Agronomy 2020, 10, 268. [Google Scholar] [CrossRef] [Green Version]
  18. Gorafi, Y.S.A.; Kim, J.S.; Elbashir, A.A.E.; Tsujimoto, H. A population of wheat multiple synthetic derivatives: An effective platform to explore, harness and utilize genetic diversity of Aegilops tauschii for wheat improvement. Theor. Appl. Genet. 2018, 131, 1615–1626. [Google Scholar] [CrossRef]
  19. Elhadi, G.M.I.; Kamal, N.M.; Gorafi, Y.S.A.; Yamasaki, Y.; Takata, K.; Tahir, I.S.A.; Itam, M.O.; Tanaka, H.; Tsujimoto, H. Exploitation of tolerance of wheat kernel weight and shape-related traits from Aegilops tauschii under heat and combined heat-drought stresses. Int. J. Mol. Sci. 2021, 22, 1830. [Google Scholar] [CrossRef]
  20. Saito, H.; Tamura, M.; Ogawa, Y. Starch digestibility of various Japanese commercial noodles made from different starch sources. Food Chem. 2019, 283, 390–396. [Google Scholar] [CrossRef] [PubMed]
  21. Smith, S.E.; Kuehl, R.O.; Ray, I.M.; Hui, R.; Soleri, D. Evaluation of simple methods for estimating broad-sense heritability in stands of randomly planted genotypes. Crop Sci. 1998, 38, 1125–1129. [Google Scholar] [CrossRef]
  22. Bradbury, P.J.; Zhang, Z.; Kroon, D.E.; Casstevens, T.M.; Ramdoss, Y.; Buckler, E.S. TASSEL: Software for association mapping of complex traits in diverse samples. Bioinformatics 2007, 23, 2633–2635. [Google Scholar] [CrossRef]
  23. Borrill, P.; Ramirez-Gonzalez, R.; Uauy, C. expVIP: A customizable RNA-seq data analysis and visualization platform. Plant Physiol. 2016, 170, 2172–2186. [Google Scholar] [CrossRef] [Green Version]
  24. Gedye, K.R.; Morris, C.F.; Bettge, A.D. Determination and evaluation of the sequence and textural effects of the puroindoline a and puroindoline b genes in a population of synthetic hexaploid wheat. Theor. Appl. Genet. 2004, 109, 1597–1603. [Google Scholar] [CrossRef] [PubMed]
  25. Peterson, C.J.; Graybosch, R.A.; Shelton, D.R.; Baenziger, P.S. Baking quality of hard winter wheat: Response of cultivars to environment in the Great Plains. Euphytica 1997, 100, 157–162. [Google Scholar] [CrossRef]
  26. Ozturk, A.; Aydin, F. Effect of Water Stress at Various Growth stages on some quality characteristics of winter wheat. J. Agron. Crop Sci. 2004, 190, 93–99. [Google Scholar] [CrossRef]
  27. Ramya, K.T.; Jain, N.; Gandhi, N.; Arora, A.; Singh, P.K.; Singh, A.M.; Singh, G.P.; Prabhu, K.V. Assessing heat stress tolerance and genetic diversity among exotic and Indian wheat genotypes using simple sequence repeats and agro-physiological traits. Plant Genet. Resour. Characterisation Util. 2017, 15, 208–220. [Google Scholar] [CrossRef]
  28. Fleitas, M.C.; Mondal, S.; Gerard, G.S.; Hernández-Espinosa, N.; Singh, R.P.; Crossa, J.; Guzmán, C. Identification of CIMMYT spring bread wheat germplasm maintaining superior grain yield and quality under heat-stress. J. Cereal Sci. 2020, 93. [Google Scholar] [CrossRef]
  29. Prathap, V.; Tyagi, A. Correlation between expression and activity of ADP glucose pyrophosphorylase and starch synthase and their role in starch accumulation during grain filling under drought stress in rice. Plant Physiol. Biochem. 2020, 157, 239–243. [Google Scholar] [CrossRef]
  30. Simmonds, D.H.; Barlow, K.K.; Wrigley, C.W. Biochemical basis of grain hardness in wheat. Cereal Chem. 1973, 50, 553–562. [Google Scholar]
  31. Okada, M.; Ikeda, T.M.; Yoshida, K.; Takumi, S. Effect of the U genome on grain hardness in nascent synthetic hexaploids derived from interspecific hybrids between durum wheat and Aegilops umbellulata. J. Cereal Sci. 2018, 83, 153–161. [Google Scholar] [CrossRef] [Green Version]
  32. Peterson, C.J.; Graybosch, R.A.; Baenziger, P.S.; Grombacher, A.W. Genotype and environment effects on quality characteristics of hard red winter wheat. Crop Sci. 1992, 32, 98–103. [Google Scholar] [CrossRef]
  33. Deol, K.K.; Mukherjee, S.; Gao, F.; Brûlé-Babel, A.; Stasolla, C.; Ayele, B.T. Identification and characterization of the three homeologues of a new sucrose transporter in hexaploid wheat (Triticum aestivum L.). BMC Plant Biol. 2013, 13. [Google Scholar] [CrossRef] [Green Version]
  34. Mukherjee, S.; Liu, A.; Deol, K.K.; Kulichikhin, K.; Stasolla, C.; BrÛlé-Babel, A.; Ayele, B.T. Transcriptional coordination and abscisic acid mediated regulation of sucrose transport and sucrose-to-starch metabolism related genes during grain filling in wheat (Triticum aestivum L.). Plant Sci. 2015, 240, 143–160. [Google Scholar] [CrossRef]
  35. Al-Sheikh Ahmed, S.; Zhang, J.; Ma, W.; Dell, B. Contributions of TaSUTs to grain weight in wheat under drought. Plant Mol. Biol. 2018, 98, 333–347. [Google Scholar] [CrossRef] [PubMed]
  36. Van Ooijen, G.; Mayr, G.; Kasiem, M.M.A.; Albrecht, M.; Cornelissen, B.J.C.; Takken, F.L.W. Structure-function analysis of the NB-ARC domain of plant disease resistance proteins. J. Of Exp. Bot. 2008, 59, 1383–1397. [Google Scholar] [CrossRef] [PubMed] [Green Version]
  37. Belkhadir, Y.; Subramaniam, R.; Dangl, J.L. Plant disease resistance protein signaling: NBS-LRR proteins and their partners. Curr. Opin. In Plant Biol. 2004, 7, 391–399. [Google Scholar] [CrossRef] [PubMed]
  38. Giroux, M.J.; Sripo, T.; Gerhardt, S.; Sherwood, J. Puroindolines: Their role in grain hardness and plant defence. Biotechnol. Genet. Eng. Rev. 2003, 20, 277–290. [Google Scholar] [CrossRef] [Green Version]
  39. Agarwal, P.; Khurana, P. Characterization of a novel zinc finger transcription factor (TaZnF) from wheat conferring heat stress tolerance in Arabidopsis. Cell Stress Chaperones 2018, 23, 253–267. [Google Scholar] [CrossRef] [PubMed]
  40. Ribeiro, M.; Rodríguez-Quijano, M.; Giraldo, P.; Pinto, L.; Vázquez, J.F.; Carrillo, J.M.; Igrejas, G. Effect of allelic variation at glutenin and puroindoline loci on bread-making quality: Favorable combinations occur in less toxic varieties of wheat for celiac patients. Eur. Food Res. Technol. 2017, 243, 743–752. [Google Scholar] [CrossRef]
  41. Uauy, C.; Distelfeld, A.; Fahima, T.; Blechl, A.; Dubcovsky, J. A NAC gene regulating senescence improves grain protein, zinc, and iron content in wheat. Science 2006, 314, 1298–1301. [Google Scholar] [CrossRef] [Green Version]
  42. Wilkinson, M.; Wan, Y.; Tosi, P.; Leverington, M.; Snape, J.; Mitchell, R.A.C.; Shewry, P.R. Identification and genetic mapping of variant forms of puroindoline b expressed in developing wheat grain. J. Cereal Sci. 2008, 48, 722–728. [Google Scholar] [CrossRef]
  43. Wang, F.; Fu, L.; Kong, W.; Ye, Y.; Chen, X.; Zhou, Q.; Chen, B. Constitutive expression of StAATP, a potato plastidic ATP/ADP transporter gene, increases starch content in transgenic Arabidopsis. Biotechnol. Biotechnol. Equip. 2017, 312, 250–258. [Google Scholar] [CrossRef] [Green Version]
  44. Zhang, Z.; Xiong, S.; Wei, Y.; Meng, X.; Wang, X.; Ma, X. The role of glutamine synthetase isozymes in enhancing nitrogen use efficiency of N-efficient winter wheat. Sci. Rep. 2017, 7, 1–12. [Google Scholar] [CrossRef] [PubMed] [Green Version]
  45. Borrell, B.A.; Hammer, G.; Oosterom, E.V.A.N. Stay-green: A consequence of the balance between supply and demand for nitrogen during grain filling? Ann. Appl. Biol. 2001, 3902, 91–95. [Google Scholar] [CrossRef]
  46. Pinto, R.S.; Reynolds, M.P.; Mathews, K.L.; McIntyre, C.L.; Olivares-Villegas, J.J.; Chapman, S.C. Heat and drought adaptive QTL in a wheat population designed to minimize confounding agronomic effects. Theor. Appl. Genet. 2010, 121, 1001–1021. [Google Scholar] [CrossRef] [Green Version]
  47. Muhitch, M.J. Distribution of the glutamine synthetase isozyme GSp1 in maize (Zea mays). J. Plant Physiol. 2003, 160, 601–605. [Google Scholar] [CrossRef] [PubMed] [Green Version]
Figure 1. Frequency distribution of hardness and hardness indexes (a) Frequency distribution of hardness under optimum, heat and combined heat-drought (HD) environment and (b) Frequency distribution of hardness heat susceptibility index (HSI) and heat-drought susceptibility index (HDSI). ‘Norin 61’ is the background parent of the multiple synthetic derivative (MSD) lines.
Agronomy 11 01061 g001
Figure 2. Relationship between kernel weight and hardness heat susceptibility index (HSI) (a). And heat-drought susceptibility index (HDSI) (b). Tolerant lines with low change in kernel hardness are indicated with red dots and sensitive lines with a high change in kernel hardness are indicated with yellow dots. ‘Norin 61’ is the background parent of the multiple synthetic derivatives (MSD) and ‘Imam’ is a heat-tolerant Sudanese cultivar.
Agronomy 11 01061 g002
Figure 3. Relationship between hardness and kernel weight for the multiple synthetic derivative (MSD) lines tolerant (a) And sensitive (b) lines under optimum, heat and combined heat-drought (HD), ‘Norin 61’ is the background parent and ‘Imam’ is a heat-tolerant Sudanese cultivar.
Agronomy 11 01061 g003
Figure 4. Scanning electron microscope showing the internal structure of wheat endosperm for Imam, Norin 61, tolerant and sensitive lines MSD187, and MSD259, respectively, under optimum, heat and combined heat-drought (HD) conditions (a). Bars indicate 50 μm. Protein content (%) for the tolerant and sensitive lines, Norin 61 and Imam (b); different letters were significantly different at p < 0.05.
Agronomy 11 01061 g004
Figure 5. Manhattan for hardness (a) Under optimum environment, (b) Under heat environment, (c) Under combined heat-drought environment (HD), (df) Quantile–Quantile plots for hardness under optimum, heat, and HD.
Agronomy 11 01061 g005
Figure 6. Significant marker trait associations (MTAs) for hardness that were (a) Stable MTAs under all conditions, (b) Significant markers associated with stress environment heat and HD, (c) Significant marker associated with hardness stress index HI and HDI, (d) Significant markers associated with stress condition for both hardness and hardness indexes (e) Significant markers associated with certain environment.
Agronomy 11 01061 g006
Figure 7. Boxplot for the marker 3532985; the marker that encodes for SUT gene. (a) Allele contributes for the marker under optimum environment, (b) Allele contributes for the marker under heat environment, (c) Allele contribution for MSD108, MSD187; the tolerant lines, and MSD162, MSD259; the sensitive lines, and ‘Norin 61’ their parent, (df) Boxplot for the allele for marker 3,947,128 that encode for celiac disease under optimum, heat and HD.
Agronomy 11 01061 g007
Table 1. Analysis of variance and heritability for hardness under optimum, heat and HD environments for MSD lines.
Source of VariationMSD Range for Hardness (Index)Norin 61SED (±)p-ValueLSDHeritability
Optimum18.5–47.829.6-***--
S (S1 × S2)---ns--
G × S--4.77***9.200.90
Heat19.6–56.935.73.60***7.10-
HD25.5–60.235.26.40***12.70-
E---**--
G × E --3.59ns7.070.97
S1 and S2, seasons 1 and 2, respectively; G, genotype; E, environment (Heat and HD). SED (±), standard error of the difference; **, and ***, significant at p < 0.05, p < 0.01 and p < 0.001, respectively; ns, not significant.
Table 2. Marker trait associations of hardness grown under optimum, heat, and HD conditions.
Total Genome Contribution %ChromosomeMarker Position MarkerEnvironmentp-ValuePVE %
A genome (4.3%)1A441,1183947128HD8.28 × 10−48.5
4A173,725,6683025314Heat9.03 × 10−48.7
HD2.17 × 10−411.1
B genome (4.3%)5B4,332,6886030814|F|0-7Optimum1.30 × 10−413.5
Heat2.71 × 10−412.3
270,359,8351082888|F|0-18HD1.98 × 10−412.9
D genome (91.4%)1D59,530,8727351912|F|0-19Optimum2.32 × 10−415.2
2D17,717,3643021443|F|0-24HD9.06 × 10−48.3
3D36,431,5331082930Optimum8.81 × 10−48.7
4D799,8551078655Heat1.22 × 10−413.0
2,196,4581062681|F|0-26Heat2.71 × 10−620.5
HD2.77 × 10−517.3
3,354,0731665831Heat8.53 × 10−48.7
HD7.77 × 10−48.5
3,486,5931126556HD4.85 × 10−49.8
4,063,4284440031HD5.44 × 10−410.5
4,135,7163946288Heat4.03 × 10−515.3
HD6.79 × 10−410.2
4,676,0595332499Heat3.39 × 10−411.5
HD9.14 × 10−512.6
14,681,6643574405Heat1.69 × 10−515.6
HD6.69 × 10−513.1
27,756,4351001438|F|0-46Heat7.18 × 10−618.9
56,518,479998809|F|0-7Heat7.30 × 10−514.4
HD5.85 × 10−411.2
98,321,4621043872|F|0-49Heat5.61 × 10−411.7
113,875,4473950661|F|0-9Heat6.59 × 10−412.0
HD1.61 × 10−414.6
120,386,3881218881HD7.28 × 10−410.9
5D849,7011127970Optimum5.51 × 10−722.6
Heat4.69 × 10−618.9
HD9.94 × 10−514.5
1,268,7903957566Optimum7.99 × 10−514.1
1,465,9091090404Optimum1.44 × 10−515.0
2,351,2223532985Optimum1.33 × 10−516.1
Heat1.06 × 10−412.1
2,504,0125573281|F|0-7Optimum8.85 × 10−618.3
Heat3.46 × 10−516.2
3,757,0735573405Optimum5.94 × 10−513.0
6,987,7383948152Optimum2.14 × 10−411.0
14,328,4014540116Optimum8.32 × 10−48.3
14,984,3173944483Optimum7.40 × 10−513.9
Heat1.33 × 10−515.3
HD1.05 × 10−516.3
14,984,5561025407Optimum8.54 × 10−512.6
Heat7.17 × 10−512.3
HD7.29 × 10−512.1
17,157,8883021240|F|0-28Optimum3.77 × 10−412.0
Heat5.40 × 10−514.9
HD1.09 × 10−413.7
17,257,3692242137|F|0-66Heat4.28 × 10−412.8
34,818,0751093560|F|0-46Heat3.47 × 10−412.3
155,393,5753950421Heat4.14 × 10−513.6
HD1.52 × 10−411.9
156,123,9093936784Heat4.76 × 10−513.3
HD1.04 × 10−38.4
6D12,507,9711102905|F|0-25Optimum5.84 × 10−410.0
18,973,4463960692|F|0-32Heat4.25 × 10−412.0
19,795,2631074408|F|0-12Heat1.23 × 10−413.7
HD1.65 × 10−413.1
24,752,1415357783Heat5.89 × 10−512.8
HD2.62 × 10−410.4
26,576,8951073587|F|0-24Heat9.59 × 10−411.2
35,991,3492242479Optimum2.43 × 10−412.3
Heat1.19 × 10−412.1
HD1.02 × 10−412.3
99,107,0457348732Heat8.68 × 10−511.6
HD3.85 × 10−49.4
102,962,8175992592HD6.21 × 10−49.2
7D80,561,0203222372|F|0-27Heat6.97 × 10−619.8
105,476,7983944062Heat1.63 × 10−514.4
206,383,7431261369|F|0-13Optimum7.69 × 10−412.5
217,517,2661065454|F|0-13Heat3.28 × 10−49.5
HD3.27 × 10−49.5
Table 3. Candidate genes for hardness under optimum, heat, and combined heat-drought (HD) and hardness indexes (HI, HDI).
MarkerChromosome Trait
(Environment)
PVE (%)GeneProteinFunction
39471281AHD8.5TraesCS1A02G008000celiac diseaseGluten sensitivity
10998283BHDI12.0TraesCS3B02G533100No-apical-meristem (NAM) protein domain–containing proteinIncreased protein content
998809|F|0-74DHeat, HD, HI, HDI14.4TraesCS4D02G117900ATP/ADP carrier proteinNitrogen-use efficiency
1062681|F|0-264DHeat, HD, HI17.3TraesCS4D02G047400Glutamine synthetaseNitrogen-use efficiency
11279705DOptimum, Heat, HD22.6TraesCS5D02G004100Puroindoline-aKernel hardness
35329855DOptimum, Heat16.1TraesCS5D02G001200Sucrose transporter Starch accumulation
39444835DOptimum, Heat, HD16.3TraesCS5D02G037000NB-ARC domain–containing proteinBiotic stress
10254075DHeat, HD12.6TraesCS5D02G036300Zinc finger, RING-type domain–containing proteinAbiotic stress
Publisher’s Note: MDPI stays neutral with regard to jurisdictional claims in published maps and institutional affiliations.

