Article

Potassium and Elemental Sulfur as Factors Determining Nitrogen Management Indices of Soil and Faba Bean (Vicia faba L.)

by
Przemysław Barłóg
and
Remigiusz Łukowiak
*
Department of Agricultural Chemistry and Environmental Biogeochemistry, Poznan University of Life Sciences, Wojska Polskiego 71F, 60-625 Poznan, Poland
*
Author to whom correspondence should be addressed.
Agronomy 2021, 11(6), 1137; https://doi.org/10.3390/agronomy11061137
Submission received: 16 April 2021 / Revised: 18 May 2021 / Accepted: 28 May 2021 / Published: 2 June 2021
(This article belongs to the Section Soil and Plant Nutrition)

Abstract

:
Faba bean plays a significant role in nitrogen (N) cycling as they fix atmospheric N2 through biological symbiosis (SNF). It has been assumed that soil potential to supply plants with potassium (K) and sulfur (S) is crucial for plant and soil N management indices. The experimental factors were as follows: variable soil K availability content and fertilization (K1, K2, K3, and K4); and elemental S application (0, 25, and 50 kg S ha−1). K treatments had a positive impact on N accumulation in crop residues and SNF. The application of S increased the amount of N in grain and SNF. The most beneficial influence of S on these indices was registered on K-poor soil. The total N increase in soil (NgainT) was relatively constant across the years and ranged between 106 and 124 kg N ha−1. This parameter depended however, on the K and S treatments. The highest NgainT increase (52–54 kg N ha−1) was obtained in soil of a medium K content (K2, K3), and simultaneously fertilized with S. The results indicated that balanced fertilization with K and S guarantees not only a high grain yield but also improved soil potential to supply N to successive plants.

1. Introduction

Nitrogen is one of the most important yield forming factors in agriculture. The main sources of the nutrient in agricultural soils are mineral fertilizers, natural fertilizers, atmospheric deposition and biological N2 fixation (BNF). The global annual N flux for BNF in cropland is estimated at around 60 Tg N yr−1 [1]. N2 fixation through the symbiotic association between Rhizobia and crop legumes (SNF) ranges between 25 and 29 Tg yr−1 [2]. The inclusion of legumes in crop rotation not only increases the yield of the aftercrops, but also reduces the requirement for N in mineral fertilizers, which translates into a lower use of energy and greenhouse gas emissions into the atmosphere [3,4,5]. According to Herridge et al. [6], cultivation of legumes provides 20% of the worldwide N requirement for cereals and oilseeds. Their cultivation also positively effects the soil quality, through the improvement of organic C balance in soil, water retention, soil structure, microbiological activity, availability of nutrients, as well as a reduction of weeds and soil-borne diseases [7,8,9,10]. On the other hand, the input of N-rich residues increases the content of mineral N in soil (Nmin) and therefore the pool of reactive N in the form of ammonia and nitrates [11]. In moderate climates, for field grown plants, N leaching may be greater in the case of legumes, than non-legumes [12]. The situation becomes dangerous for the environment if the input of N is underestimated and the subsequent plant in the crop rotation is over fertilized with N. Hence, a correct assessment of the potential N input from crop legumes into soil is absolutely crucial in order to select appropriate species or N rates for the subsequent plants [13].
One of the world’s most important crop legumes is Faba bean (Vicia faba L.). According to the data from FAOSTAT [14], the area of faba bean cultivation globally in the years between 2009 and 2019 covered an average of 2.44 million ha. Among other crop legumes this gives faba bean the fourth place in the world in terms of acreage. The seeds of this species are a precious source of carbohydrates, protein with a high concentration of the exogenous amino acid—lysine, as well as vitamins and minerals [15]. Faba bean is also an L -Dopa-rich plant and can be incorporated into the dietary strategies of Parkinson patients [16]. In the EU, the cultivation area of faba bean reaches approximately 330,000 ha. Among its main producers in the EU are Germany, Great Britain, and France. In comparison to these countries, the cultivation area of faba bean in Poland is very small. Faba bean, grown for fodder, covers an area of approximately 7.2 thousand ha, and for human consumption (green seeds) about 1.5 thousand ha [17]. The main reasons for such a small cultivation acreage of faba bean in Poland are low and unstable yields that fluctuate from one year to the next, do not compensate the input costs, and a high susceptibility to diseases [18]. Faba bean, when compared to other crop legume species, demonstrates great sensitivity to water deficiency, which is, inter alia, due to a shallow root system [19]. Hence, in the case of rain fields, it is crucial that a grower provides the plants with adequate levels of nutrients, boosting their tolerance to water stress [20]. Potassium is particularly important in terms of its ability to enhance plant water stress tolerance [21]. K is also an essential nutrient that affects numerous biochemical and physiological processes that influence plant growth and N metabolism, including N2 fixation [22,23,24]. Unfortunately, in Polish soil conditions, K deficiency, in addition to water deprivation, is one of the most important environmental factors that limit plant yield [25].
The role of S in the biochemical and physiological processes of crop legumes is widely known [26,27,28]. Some of the major yield forming effects of a sufficient S supply into crop legumes include plant growth stimulation, increase of SNF and GY, and improved protein quality, in relation to the content of amino acids—cysteine and methionine [29,30,31,32]. In the past, the main source of S in Polish soils was atmospheric deposition [33]. Currently, due to the reduction of industrial pollution, an important source of S for plants can be found in its resources in the soil, shaped by fertilization [34]. From the chemical point of view, S in mineral fertilizers may be in the form of sulfates (SO42−) combined with cations, or as elemental sulfur (S0). The impact range of S0 on soil–plant interactions, particularly in systems with crop legumes, is much wider than in systems with non-legumes. On the one hand, the application of S0 causes a decrease in pH, which results in an increase in the mobility of certain nutrients, e.g., Mn and Zn [35], and on the other hand, an increase in the microbial activity of the soil and an improvement in the plant supply not only with S, but also with P and N and Fe will further enhance soil quality [36,37]. As far as this aspect is concerned, it is not yet known what impact an application of K and S0 exerts on faba bean N accumulation, SNF, N uptake efficiency, and soil N balance. While most of the N is removed in grain, the importance of the below-ground deposition of fixed N in maintaining the soil-N balance may not be ignored. A knowledge of the quantity of N input into the soil–plant system can be helpful while developing balances for both agronomical and environmental purposes. The assumption of the present study was that the optimal rate of S0 in the cultivation of faba bean for consumption purposes, in terms of the amount of N fixed and transformed into grain yield, depends on the content of plant available K in soil. In order to verify this hypothesis, the following main objectives were set: (i) determination of total N uptake and its distribution among faba bean parts, especially including grain and crop residues; (ii) evaluation of potential SNF and N uptake efficiency; (iii) determination of soil N balance in response to the application of S0 against various levels of plant available K in soil.

2. Materials and Methods

2.1. Experimental Design

Field trials with faba beans were carried out during 2012–2014 at the Brody Experimental Farm, which belongs to Poznan University of Life Sciences (52°44′ N; 16°28′ E). The studies were conducted as part of a long-term experiment (established in 1990), the main objective of which was to determine the influence of various K fertilization systems on plant yielding in crop rotation. There were two plots initially (−K, +K). In 2001, each of them was divided into a further two and fertilized with K doses of 50% and 25% of the total K requirement for plants. Consequently, a diversified content of plant available K in soil was obtained. The K content in soil (K1, K2, K3, and K4) and the K rates were the first factor of the experiment. The second experimental factor was the elemental sulfur rate. Summary experimental factors are shown in Table 1.
The K source in the soil was potassium chloride (fertilizer containing 49.8% of K). Elemental sulfur (S0) was applied, in the form of a granular fertilizer containing 90% of S. Potassium and S were applied by broadcasting 2 weeks before seed sowing, and then mixed with soil using a harrow. Prior to that, in autumn, phosphorus (P) had been applied after the forecrop harvest (winter wheat), at the rate of 26.2 kg P ha−1 (triple superphosphate, 17.4% of pure P). No nitrogen-based fertilizer was used in the experiment due to a high concentration of Nmin in the soil.
The experiment was set up as a randomized block design, with four replicates (blocks). The area of an individual plot was 22.4 m2 (2.8 m × 8 m). Faba bean seeds (Vicia faba L. var. major) of Bachus cultivar were hand sown at 30 pcs. per 1 m2, at a depth of 0.05 cm and an inter-row space of 0.25 m. The sowing dates were as follows: 1 April 2012, 17 April 2013, and 4 April 2014. The tested variety featured a traditional (indeterminate) type of growth. Before sowing, the seeds were treated with insecticide (carbosulfan) and inoculated with Rhizobium bacteria (commercial inoculant; Biofood, Wałcz, Poland). During vegetation, plant protection included the application of herbicides (active ingredients: linuron and/or chlomazon), fungicide (chlorothalonil), and insecticide (pirimicarb).

2.2. Soil and Meteorological Conditions

According to the World Reference Base for Soil Resources [38], classification system, soil in the experiment was classified as Haplic Luvisols. The topsoil was characterized by sandy loam, and the subsoil was characterized by loam texture. The basic soil chemical properties are listed in Table 2. As it shows, the soil pH at a depth of 0–0.3 m was slightly acidic. The content of plant available P within that soil layer was high, medium for magnesium, and low for calcium and sulfur (S-SO4). The long-standing, variable K fertilization significantly diversified the content of plant available K only. In treatment K1 the soil featured a low level of K content; K2 and K3—showed a medium K concentration level (however, the K2 had more K than the K3, especially in the 0.0–0.3 m soil depth); and treatment K4 obtained a high content of plant available K [39,40]. The total content of NO3-N and NH4-N at the soil depth of 0–0.9 m reached an average of 32.6 and 93.5 kg ha−1, while the sum of both forms of nitrogen (Nmin) was 126.1 kg ha−1. According to the Polish classification, the studied soil revealed a high content of Nmin [41].
The long-term average yearly precipitation and temperature in the study area are approximately 560 mm and 8.2 °C, respectively. The precipitation and mean daily air temperatures during the faba bean growing period, from sowing to harvest (April–July), are shown in Table 3. As it indicates, each year the sum of precipitation during the growing season exceeded the long-term average. In 2012 the difference almost doubled. At the same time, the mean air temperature during the growing season was also higher than for the long-term period. The contrasts across the years of the study related, first and foremost, to the distribution of precipitation over the growing season. Selyaninov’s Hydrothermal Coefficient (SHC) was used to compare the weather conditions across years and months [42]. As far as the development and yielding of faba bean are concerned, the worst weather conditions were recorded in 2014, due to relatively low SHC in June.

2.3. Plant Sampling and Chemical Analysis

Faba beans were harvested in order to obtain immature—green seeds. The harvest was carried out when nearly all pods had reached their final length and the seeds contained approximately 25% of dry matter. According to the BBCH scale (in German: Biologische Bundesanstalt, Bundessortenamt, and Chemical industry, [43]), the code of that stage was specified as 80–82 (the beginning of ripening). Faba bean samples were hand-harvested from an area of 4.88 m2 (0.75 m × 6.5 m). The harvested plant sample was partitioned into a sub-sample of grains, and post-harvest residues (leaves, stems, legumes, and roots). The root dry matter was analyzed from a depth of 0.20 m, through the rinsing of soil clods containing roots of 5 plants. All of the plant samples were dried at 55 °C for 3–6 days to determine dry matter (DM) content. Total dry matter (TDM) was calculated by summing up the dry matter of all analyzed parts of the plants: grains (= yield, GY) + leaves (LDM) + legumes (pods without grains, PDM) + stems (SDM) + roots (RDM). The harvest index (HI) was calculated as the share of GY in TDM. The following yield components were analyzed: (i) the number of plants per m2 (D); (ii) the number of pods per plant (PP); (iii) the number of grains per pod (GPd); (iv) the thousand grain weight (TGW, g).
Nitrogen contents were determined by the Kjeldahl method using a Kjeltec Auto 1031 Analyzer (Foss Tecator, Sweden). Total nitrogen uptake (TN) was calculated by summing up the amount of nitrogen accumulated in grains (GN) and in the all post-harvest residues, including roots (RN).
Table 3. Mean monthly air temperature (°C) and sum of precipitation (mm) during growing seasons of faba bean on the background of the long-term averages.
YearCharacteristicsAprilMayJuneJulyTotal/
Average 1
2012Precipitation22.977.2163.0197.6460.7
Temperature8.814.81619.214.7
SHC 20.871.683.403.32-
2013Precipitation15.469.8125.367.3277.8
Temperature8.014.417.320.115.0
SHC0.641.562.411.08-
2014Precipitation46.373.542.083.1244.9
Temperature10.513.116.121.515.3
SHC1.471.810.871.25-
1961–2011Precipitation37.257.164.181.2239.6
Temperature8.013.216.518.214.0
SHC1.551.401.291.44-
1 April–July; 2 Classification of droughts based on Selyaninov’s hydrothermal coefficient (SHC): >2.0—immoderately humid; 1.0–2.0—humidity is sufficient; <1.0—insufficient humidity; 1.0–0.7—dry; 0.7–0.4—very dry [44].

2.4. Soil Sampling and Analysis

Soil sampling was carried out twice: (i) in spring, before seed sowing and (ii) immediately after the harvest of faba bean. The soil samples were taken from three layers of soil (0–0.3, 0.3–0.6, and 0.6–0.9 m) using a soil auger by Eijkelkamp Agrisearch Equipment (Giesbeek, The Netherlands). From each plot, 4 single samples were taken, from which 1 mixed sample was made, separately for each soil depth. The soil content of NH4-N and NO3-N was determined in field-fresh soil samples. Twenty-gram soil samples were shaken for 1 h with 100 mL of 0.01 M CaCl2 solution (soil/solution ratio 5:1; m/v) [44]. Concentrations of NH4-N and NO3-N were determined by the colorimetric method using flow injection analyses (FIAstar5000, FOSS, Denmark). The total soil mineral nitrogen (Nmin) was calculated as the sum of NH4-N and NO3-N, and expressed in kg ha−1.

2.5. Indices of Faba Bean N Management

The amount of nitrogen fixed from air (SNF) was established based on the potential share of biologically fixed nitrogen (%SNF). Initially, the share index of biologically fixed N was calculated (%SNF1) using a regression equation with the variable representing the GY of faba bean [45]. Next, %SNF2 index was calculated, correcting the share of N fixed from air in relation to the variable content of Nmin in the soil. Both indices were multiplied in order to obtain the final %SNF value:
%SNF1 = 49 + 7.5 × GY
%SNF2 = (90 − 0.14 × (Nmin − 60))/100
%SNF = %SNF1 × %SNF2
where, %SNF—share of N from symbiotic fixation process, %; GY—grain yield, t ha−1; Nmin—content of mineral N at a depth of 0–0.3 m, kg ha−1.
In the final step, SNF was calculated according to the following algorithm:
SNF = (%SNF/lOO) × TN
where, SNF—potential symbiotic N fixation, kg ha−1; %SNF—potential share of N from air in the total N uptake, %; TN—total N in plants, kg ha−1.
Based on the amount of N in the respective parts of faba bean and SNF value, the following indices have been calculated:
NHI = (GN/TN) · 100%
NUE = GY/TN
UNA = TN/GY
where: NHI—N harvest index, %; GN—nitrogen in grain, kg ha−1; TN—total N in plants, kg ha−1; GY—grain yield, t ha−1; NUE—N uptake efficiency, kg kg−1; UNA—unit N accumulation, kg N t−1 of grain yield.

2.6. Indices of Soil N Balance

Based on the Nmin content in soil before seed sowing and after the harvest of faba bean, as well as N accumulation in separate parts of the plant, the following parameters and indices were calculated:
Nin = NminS + SNF
Nb = Nin − GN
Ngain = NminH − Nb
NinT = Nin + Ngain
NgainT = Ngain + (RN × %SNF)
NinE = GN/Nin × 100%
where, Nin—N input from soil (0–0.9 m) in Spring (NminS) and N2 from air (SNF), in kg N ha−1; Nb—N balance, kg ha−1; GN—amount of N in grains, kg ha−1; Ngain—increase of Nmin content in soil during the growing season, kg ha−1; NminH—the amount of Nmin in soil after harvest, kg ha−1; NinT—total N input into soil, kg ha−1; NgainT—total N increase in soil, kg ha−1; RN—amount of N in post-harvest residues, kg ha−1; %SNF—share of N from symbiotic fixation process,%; NinE—N input efficiency, %.

2.7. Statistical Analysis

In order to assess the influence of treatments on soil quality parameters, the three-way ANOVA was applied, evaluating the effects of individual research factors (year, K treatments, S fertilization) and their interactions. The distribution of the data (normality) was checked using the Shapiro–Wilk test. The homogeneity of variance was checked by the Bartlett test. Means were separated by honest significant difference (HSD) using Tukey’s method, when the F-test indicated significant factorial effects at the level of p < 0.05. The relationships between traits were analyzed using Pearson correlation and linear regression, and stepwise regression was applied to define an optimal set of variables for a given plant and soil characteristic. Statistica 13 software (TIBCO Software Inc., Palo Alto, CA, USA) was used for all statistical analyses [46].

3. Results

3.1. Yield and Plant Dry Matter

The total dry matter of faba bean (TDM) during harvest was on average 6.94 t ha−1. The average share of grains, leaves, legumes, stems, and roots was 32.1, 17.7, 13.2, 28.8, and 8.2%, respectively. The main factor differentiating the grain yield (GY) and DM of other parts of faba bean was the growing season (Supplementary Materials Tables S1 and S2). K fertilization treatments significantly affected the dry matter of plants’ vegetative parts, i.e., PDM, LDM, SDM, and RDM. In general, the influence of K treatments on these parameters was as follows: K1 < K3 < K2 < K4. This relationship is consistent with the K content in the soil. Nevertheless, no crucial impact of that factor on mean GY was proven, even though a clear trend emerged of improved faba bean yielding where higher K concentration in soil was confirmed (Figure 1). Unlike K application, S fertilization had a significant influence on the average GY. The GY increase after an application of 25 and 50 kg S ha−1 reached an average of 8.7% and 16.5%, respectively. K and S interaction did not have any significant effect on the GY. However, the highest increases of GY were noted in soil with the lowest content of plant available K (K1 and K3 treatments). In addition, S application on K4 treatment resulted in decreased GY (Figure 1).
In contrast to GY, the TDM depended significantly on the K and S interaction (Figure 2). In the K1 and K3 treatment plots, the TDM grew as the S application rate was increased. A significant increase in TDM was found after applying 50 kg S ha−1. However, in K4 treatment a tendency to reduce TDM was recorded after S application. Nevertheless, the highest mean TDM was obtained in the K4 treatment, which was considerably greater than in K1 and K3. The difference was 21.6% and 11.9%, respectively. TDM in the K2 treatment was also notably higher than on the control.
Sulfur fertilization had no significant effect on the harvest index. There was also no significant interaction between the K and S (Figure 3). Significant differences between HI values were found only between K treatments. The HI values in K1 and K3 were significantly higher than in the K4 treatment.

3.2. Yield Components

The growing season had a significant impact on most of the studied yield components (Tables S1 and S2). Both K and S positively affected the number of pods per plant (PP). On average, the influence of K treatments on PP was as follows: K1 < K3 < K4 < K2. Due to S application, the values of PP also increased. A significant difference was registered between treatment S0 and S50. The highest increases of PP were observed in the K1, K2 and K3 treatments. Nevertheless, no impact of relevant interaction between either elements on PP was proven (Figure 4). Fertilization with K and S also increased the number of grains per pod (GPd) and thousand grain weight (TGW). However, the differences between the levels of the factors were not significant (Table S3).

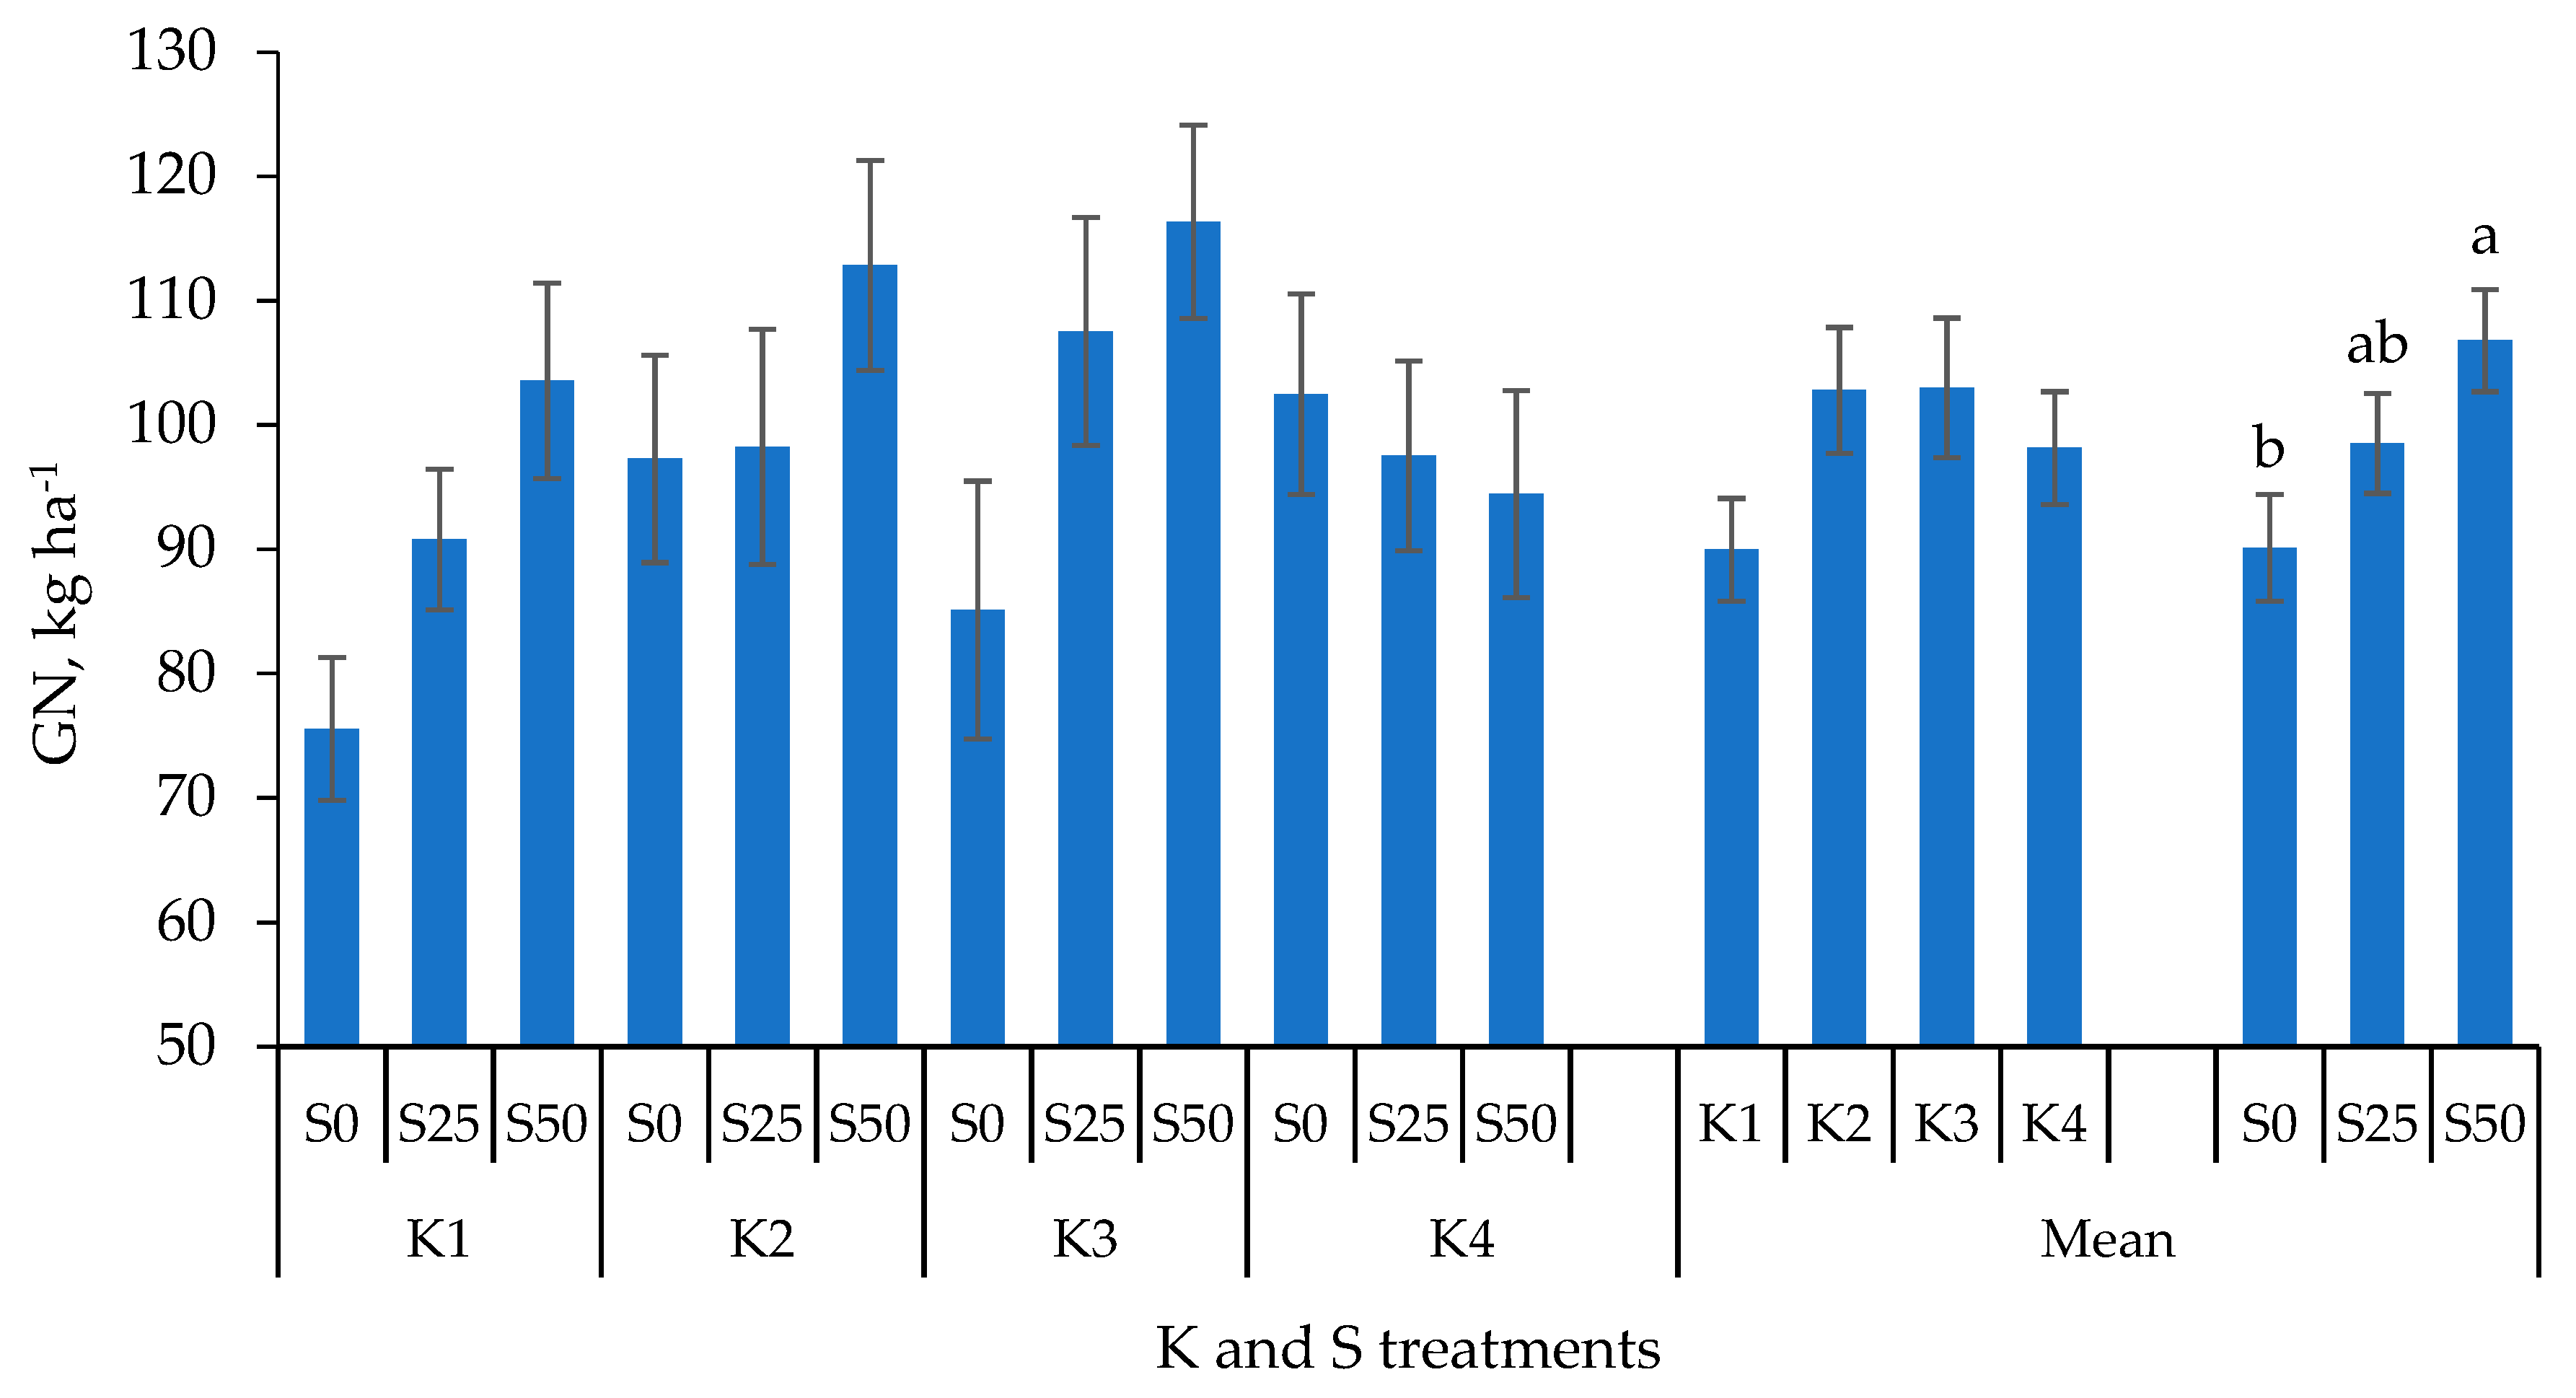
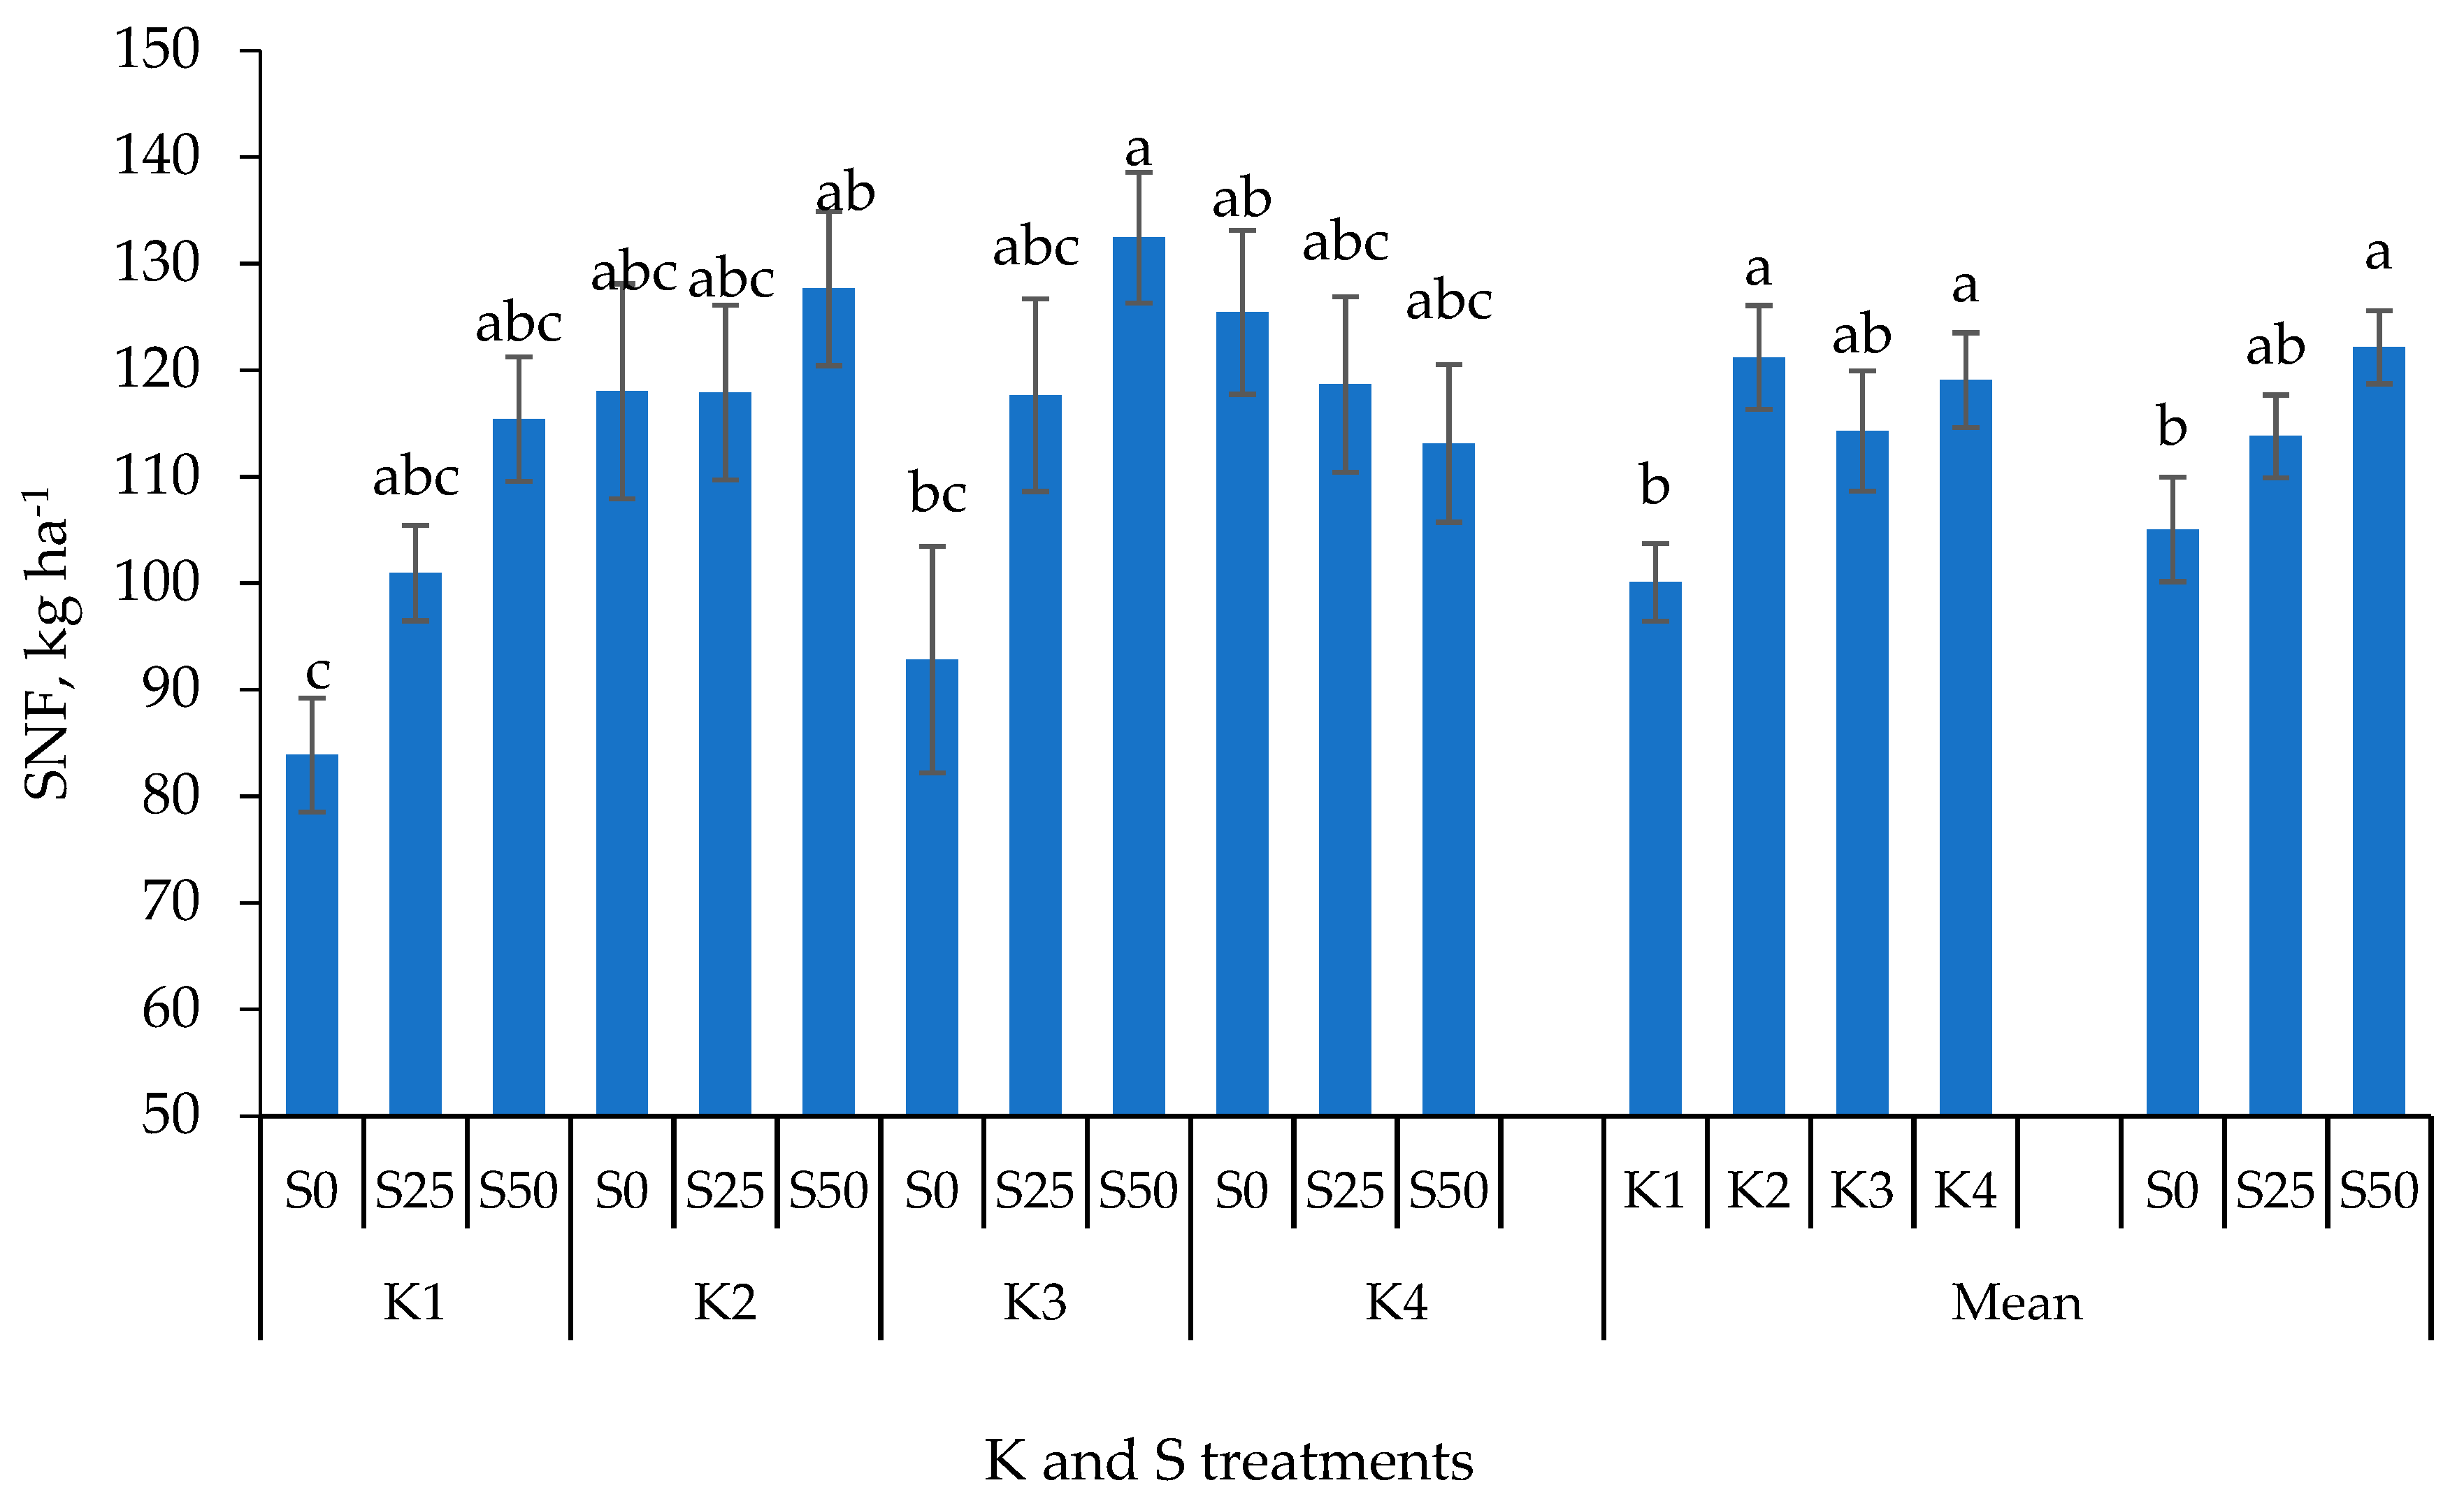
3.3. Indices of Plant N Management

The main factor differentiating the plant N management indices was the year (Tables S4 and S5). The highest N uptake in grains (GN index) was recorded in 2013, while the lowest was registered in 2014. The difference was significant and reached 29.6%. In 2012, GN was also higher than in 2014 (+18,6%). A similar interdependence between the years was recorded for TN. The differences between the years resulted more from the DM of the plants than their N concentration (Table S6). The effect of K and S on the plant N concentration depended on the growing season and investigated part. On average, K increased the N concentration in the roots but it decreased in the stems (dilution effect). Sulfur, in turn, increased the average N concentration in the grain.
The effect of K and S on the plant N concentration depended on the growing season and the investigated part. On average, K increased the N concentration in the roots but it decreased in the stems (dilution effect). Sulfur, in turn, increased the average N concentration in the grain (Table S1).
Potassium fertilization had no relative impact on GN (Figure 5). It did, however, influence the N accumulation in post-harvest residues. In K2 and K4 treatments significantly higher values of the RN were recorded than in K1 and K3 (Figure 6). The impact of various K fertilization treatments on SNF was similar to the previous parameter and sequenced as follows: K1 < K3 < K2 < K4 (Figure 7).
Sulfur application had a positive effect on GN (Figure 5). When the rate of 50 kg S ha−1 was applied, the GN increase in comparison to the control (without S) reached 18.5%. As long as S was being applied, RN and SNF values exhibited a simultaneous tendency to rise, together with a decrease of the UNA index (Figure 6 and Figure 7; Table S3).
The impact of S fertilization on RN, and SNF significantly depended on the K fertilization treatment. The highest S rate had a considerable effect on the above mentioned parameters as recorded for K3. In relation to RN, the rate of 25 kg S ha−1 was equally important. A clear upward trend of RN and SNF values was recorded for K1 after an application of S. Whereas, for K4 the RN and SNF values tended to decrease. The study did not confirm any significant influence of S, or of K × S interaction on the parameters determining N uptake effectiveness, i.e., N uptake efficiency (NUE) and unit N accumulation (UNA). The impact of various K fertilization treatments on mean NUE and UNA was similar to the RN and SNF parameters and sequenced as follows: K1 < K3 < K2 < K4 (Table S3).

3.4. Indices of Soil N Management

The growing season had a relevant impact on N input in the field (Nin) and soil N balance (Nb). The highest Nin and Nb was recorded for 2012. On the other hand, the highest efficiency of N input into the soil–plant system was registered in 2013 (Table S5). K fertilization treatments considerably differentiated the values of three parameters: Nin, Nb, and NinT (Table 4). In relation to the first two indices, a significant contrast was recorded between K1, K2, and K4. K treatments did not, however, have any relevant impact on the efficiency index of N input into soil (NinE). In contrast to K, fertilization with S applied at the rate of 50 kg S ha−1 substantially increased the NinE index by 11.1% in comparison to the control. S fertilization also surged the values of Nin index. The difference between treatments S0 and S50 reached 7.9%. S fertilization also had a positive effect on the remaining parameters, such as Ngain. In regard to that particular factor, the difference between treatments S0 and S50 was as high as 49.4% (Table 4).
A significant influence of the interaction of fertilization factors was confirmed for total N input (NinT). The highest NinT was obtained for K3 after an application of the highest rate of S. At the same time, for this K treatment, the best effect of S fertilization was recorded. The difference between S0 and S50 treatments was 28.7%. For comparison reasons, the greatest difference between the absolute control (K1/S0) and K3/S50 treatment was 35.1% (Table 4).

3.5. Relationships between Plant and Soil Indices

The analysis of the correlation coefficients between the examined parameters is presented in the Supplementary Materials. The grain yield (GY) significantly and positively correlated with LDM, RDM, and HI (Table S7). GY was also largely related to most of the yield components. The highest values of correlation coefficient were obtained for thousand grain weight. Among the features determining plant N management, the GY was closely related to TN. High values of correlation coefficient were also registered between GY and parameters, such as SNF and NinE. Nitrogen accumulation in grain (GN) positively correlated with such indices as TN, NHI, SNF, NUE, and NinE. The only negative correlation was recorded between GN and UNA. Soil N balance (Nb) positively corresponded with the nitrogen input (Nin), but negatively with NinE. The total net input of N into the soil–plant system (NgainT) correlated with parameters such as RN, SNF, Ngain, and NinT. However, the latter parameter exhibited a better correlation with RN and TN rather than with Nin (Table S8).
In order to determine features which directly influenced GY during the three years, a stepwise regression analysis was carried out. The analysis was performed in groups of independent variables. In the first group (grain yield and dry matter of the vegetative parts), LDM was the best explanatory variable of GY (Figure 8a). With regard to the group with yield components, all parameters were significant in the equation. Together they explained 76% of the GY variability:
GY = −6.358 + 0.099 D + 0.524 PP + 0.733 GPd + 0.002 TGW; R2 = 0.76; p < 0.001.
Among the yield components, the highest R2 coefficient was found for the TGW (Figure 8b). In respect to the plant N management indices, the stepwise regression analysis allowed us to establish two variables to provide an explanation for GN variability:
GY = −1.299 + 0.147 NUE + 0.015 SNF; R2 = 0.99; p < 0.001.
The highest R2 coefficient was found for the SNF (Figure 8c). No stepwise regression was performed for soil N indices due to the large autocorrelation. The Figure 8d shows the positive relationship between NgainT and RN, in terms of its importance for agricultural practice.

4. Discussion

The grain yield in 2012 and 2013 was considerably higher than in 2014. The difference resulted from the diverse weather conditions, relating mostly to the sum of precipitation. Other authors have also proved a positive impact of the sum of precipitation during a growing season on the yielding of faba bean grown under rain-fed field conditions [18]. In our studies, the greatest difference was recorded in June (Table 2). During that particular month in Poland, faba bean develops the most important components of grain yield, such as pods and the number of grains per pod [47]. In our studies, plants developed 2.6–3.2 pods, depending on the growing season. That accounted for only about 6.5% of the total number of flowers (40–50 units). According to the literature, faba bean can develop more flowers, between 50 and 80 units. The tested species, however, features a very poor flower:pod ratio, where a mere 10–30% of flowers develop into pods in field conditions [48]. In our investigation, the small number of pods per plant was one of the reasons for the lower GY than the potential GY, which was primarily determined by the cultivar’s breeding potential [49]. At the same time, the direct effect of PP on GY was negative. This was a result of the lower plant density in 2012 which was compensated by a higher PP and GPd. The number of pods per area unit (PD), nonetheless, remained at a similar level, regardless of the year of the study. The effect of the yield components compensation for faba bean has been fully and accurately described in many other papers [48,50]. The contrast in faba bean GY between 2013 and 2014 can be explained by differences in the TGW and LDM. According to Mwanamwenge et al. [51], an increased leaf area in the faba bean genotype contributed to an increase in the absorption of photosynthetically active radiation (PAR), which led to a higher TGW and GY. Our study confirms the above relationship (Figure 8b)
The authors’ own studies explicitly confirm that the DM of faba bean vegetative parts, including LDM, was positively developed due to the application of K. This was a direct result of the multifunctional influence of K on the metabolism and morphology of plants [52]. With respect to crop legumes, it is worth emphasizing that K has a positive impact on SNF. The mechanism of K interaction can be indirect, through a stimulation of plant DM, number of nodules and their dry matter [22], as well as direct, through the increase of nitrogenase activity [23,53]. Plants with an optimal K status may have translocated higher amounts of photosynthates from the leaves to the roots and root nodules, thus providing ATP and the electrons required for nitrogenase reduction.
Abd-Alla and Abdel Wahab [54] reported that faba bean nodulation and nitrogenase activity were significantly reduced by increasing drought stress. However, as the above mentioned authors established, harmful effects of water deficits can be alleviated by increasing K supplementation in the form of KCl. Simultaneously, K stimulates the transport of N from root nodules to the above-ground parts of plants [52]. Our studies can confirm those findings, as higher N accumulation in the vegetative parts (RN) and an increase of TN in plants grown on K-rich soil was recorded (treatments K2 and K4). A positive role of K was also apparent in relations to the PP. This occurrence can be explained by better plant hydration, more effective biosynthesis and transport of assimilates, as well as longer flowering time [23,48]. The competition phenomenon between the vegetative and reproductive stage can be, in turn, explained by a lack of significant influence of K on GY and GN. The phenomenon was fostered by the early harvest (BBCH 80–82), the stage when the vegetative biomass was still in the process of development. An argument which supports this statement is the lack of a real impact of K on the TGW. Earlier research has revealed such an effect of K on GY [55]. Those studies, however, were carried out during dry years, when the processes of N reutilization and leaf withering had occurred earlier. In our studies, a negative correlation was found between TGW and RN.
Unlike K, S fertilization increased GY and GN to a much greater degree than RN. The positive effect of S fertilization on SNF can be explained by many different functions [56]. It stimulates the biosynthesis and functionality of enzyme structures with molybdenum (Mo), including the most important enzyme responsible for N2 fixation—nitrogenase [26,57]. It has a positive effect on the number of nodules, nodule growth, and nitrogenase biosynthesis and activity [58,59]. The low nitrogenase activity observed in S-deficient plants is due to a limitation of the energy supply to the nodule, and of ferredoxin concentrations [27]. Additionally, it determines the plants’ nutritional status for K, Mo, iron, and copper—nutrients that take part indirectly (photosynthesis) and directly in the mechanism of N2 fixation, e.g., biosynthesis of leghemoglobin [60]. Moreover, the elemental S application stimulates the development of S-oxidizing microorganisms and modifies interactions among different groups of microorganisms in soil [53]. The roots of leguminous plants are colonized by numerous rhizospheric microorganisms and some of them (plant growth promoting rhizobacteria) have a positive effect on the survival and nodulation ability of rhizobia [61]. In our studies, the optimum S rate for GY was 50 kg ha−1. This level of fertilization fully corresponds with the data obtained by [62]. Other authors recommend lower rates of sulfur, 20–30 kg ha−1 [31,63]. However, the latter authors indicate that for the amount of N in the grain (protein yield), a rate of 60 kg S ha−1 is better. A higher S rate, in our studies, resulted from a low content of plant available S in soil (S-SO4). What requires emphasis here is the fact that an application of elemental S into soil causes its strong acidification, which consequently leads to the activation of some nutrients from the soil reserves, including K [35]. The best clarification for this is provided by the influence of S on plant DM on the soil of K1 and K3 treatments (low and/or medium plant available K content).
In our study, total N accumulation (TN) amounted to 176.3–189.4 kg N ha−1, depending on the year. According to Turpin et al. [64] faba bean accumulates a total of 209–275 kg N ha−1, while Allito et al. [65] reported values within the range of 194.7–309.6 kg N ha−1. Tripolskaja and Asakaviciute [66] reported TN accumulation by faba bean at a level similar to the one obtained in our studies, which was between 146.8 and 230.0 kg N ha−1. The considerable impact of K and S fertilization on TN was a direct result of a significant correlation of that feature with the GY and TDM. We found that the NHI level reached 55%, which is an average with regard to the range found in the literature of between 45% and 64% [64,66]. Fertilization with K and S had no significant effect on NHI. For comparison, Tripolskaja and Asakaviciute [66] reported an increase in NHI due to the use of P and K fertilizers.
In our research, SNF amounted to 103.6–123.2 kg ha−1, and the calculated %SNF value was 48.0–56.6%, depending on the year. The lowest average SNF value was obtained in 2014. The reason for this was not only the low faba bean DM and TN in that year, but also the highest content of Nmin in soil (Table S9). A high concentration of Nmin in soil decreases the number of formed nodules and their activity, simultaneously leading to a lower N2 fixation [44,67,68]. However, faba bean can maintain a high rate of SNF in the presence of high amounts of available N in the soil [5]. According to Hossain et al. [69] faba bean SNF oscillated at the level 49.5–107.7 kg N ha−1 and the %SNF, estimated by using the 15N isotope dilution method, was 54.3–79.7%. Denton et al. [70] reported SNF at the level of 32–272 kg N ha−1 and %SNF within the range of 25–72%, in relation to experimental sites and rhizobia inoculation treatments. In the study of Jensen et al. [9], SNF of faba bean was 135 kg ha−1, while Peoples et al. [8] showed the SNF at the level of 118 kg ha−1. In our studies, SNF was closely correlated with TN. This is in line with the report of Denton et al. [70].
SNF was significantly dependent on K and S interaction. The best results of S fertilization were achieved on low K content soil. Whereas, on high K available soil, which was additionally fertilized with a full dose of K, the SNF declined along with S application. It is worth noting that one of the investigated parameters—Ngain was also stimulated by S in the case of a poor K supply to the soil. This reaction of plants may indicate early disturbances in the SNF and other microbiological processes caused by (i) increase of soil salinity [71]; (ii) excess reduction of pH and activation of Al3+—toxic even for Rhizobium bacteria [72]; (iii) K imbalance in relation to other cations, such as magnesium [23]. Earlier research revealed that an excessive supply of both components propelled faba bean into intensive growth with a lower DM, or it intimidated the crop growth rate, depending on the growing season [55].
The conducted experiments confirm the decisive impact of a seasonal factor on soil N balance (Nb), which ranged from 153.2 to 218.8 kg N ha−1. According to the literature, Nb depends on the adopted methodology and the number of elements determining N input and output. As Turpin et al. [64] reported, soil N balance was within the range of 79–157 kg N ha−1 for faba bean. According to Allito et al. [65] soil N balances ranged from 15.5 to 143.6 kg N ha−1 when only grains were removed. At the same time, inoculation of rhizobium strains increased soil N balance. When not only grains but also crop residues were removed from the field, faba bean cultivation led to soil N mining, even up to -78.9 kg N ha−1. While Habtemichial et al. [30] obtained a balance of 12–52 kg N ha−1, Rochester et al. [73] presents much broader ranges of soil N balances, from -40 to 130 kg N ha−1 without below-ground N, and from 0 to 270 kg N ha−1 with below-ground N. In our studies, N output only accounted for N accumulated in grain. Nevertheless, contrary to the all the cited authors, the input also accounted for Nmin in soil (0–0.9 m) before the start of spring vegetation, not just fertilizer N and/or SNF. Hence, the higher values of Nb in the studies. Considering the methodology of the quoted authors, the N balance in soil would be RN × %SNF, which is about 46.4 kg N ha−1.
The total N input (NinT) in a soil–plant system is a sum of Nin and Ngain. In our study, the NinT was significantly dependent on the interaction of K and S. In general, S application increased NinT in the case of poor K supply to soil (K1 and K3 treatments). On average, the content of Nmin after harvest increased by 30.9 kg N ha−1 compared to spring. The highest increases were recorded on the plots fertilized with S, especially in the K1 and K3 treatments. In our research, explicit determination of the cause of soil N increase (Ngain) was not possible because isotopic analyses were not carried out. It probably resulted from a better mineralization of organic residue when elemental S was applied [36]. There was a trend towards an increase in the Nmin on the plots fertilized with S (Table S9).
With respect to total N gain in soil (NgainT) a trend similar to NinT was observed. This was a direct result of K and S clearly influencing the DM of post-harvest residues left out in the field. The highest NgainT was obtained on soil of a medium K content, fertilized with K rates ranging between 25 and 50% of full K requirement for faba bean, and with S applied at the rates of 25 or 50 kg S ha−1, respectively for K2 and K3. In comparison to the treatment without any fertilizers (K1/S0) NgainT in soil was 51.7 and 54.0 kg N ha−1. The inclusion of below-ground N in the soil N budgets is very important for crops in legume-based rotations [65]. According to Turpin et al. [64] N quantities in roots may constitute as much as 21% of the total SNF, while Khan et al. [56], found below-ground N constituted 24% of total plant N for faba bean. In our study, however, N accumulation in roots amounted to about 5% of TN (9.1 kg N ha−1). Therefore, RN contributed mainly to NgainT.

5. Conclusions

The effect of elemental sulfur fertilization on the grain yield of faba bean depended on the content of plant available K in soil and the existing K fertilization. The interaction of both components also determined the amount of symbiotic fixed N as well as the total N input in soil. The best values for both indices as a consequence of applying 50 kg S ha−1 were attained on soil of a medium content of plant available K, where additionally 66.6 kg K ha−1 in the form of KCl was used. Such a reaction clearly indicates that both components are indispensable in effective symbiotic N fixation, and their balanced fertilization K:S ratio at 1:0.75 guarantees not only high N accumulation in grains but also improved soil quality in relation to its increased potential to supply Nmin to succeeding crops. Adequate rates of K and S, adapted to their content in soil, allow N input into soil to increase by as much as 50 kg ha−1, therefore reducing the application of N mineral fertilizers in crop rotation to a greater extent than in an imbalanced system and/or without any K and S fertilization.

Supplementary Materials

The following are available online at https://www.mdpi.com/article/10.3390/agronomy11061137/s1, Table S1. The results of ANOVA analysis: yield, dry matter, and yield components (F ratios); Table S2. Effect of the year on faba bean yield, dry matter, and yield components; Table S3. Effect of K and S fertilization on selected plant parameters; Table S4. The results of ANOVA analysis: plant and soil N management indices (F ratios); Table S5. Effect of the year on plant and soil N management indices, Table S6. Effect of growing season, potassium treatments, and elemental sulfur fertilization on total nitrogen concentration of different parts of faba bean (% DM); Table S7. Matrix of Pearson’s correlation coefficients between faba bean grain yield (GY), dry matter of different plant parts, and yield components (n = 36); Table S8. Matrix of Pearson’s correlation coefficients between faba bean grain yield (GY) and indices of plant and soil N management (n = 36); Table S9. Effect of the years, K treatments and elemental S fertilization on the total soil content of mineral nitrogen (Nmin as a sum of NO3-N and NH4-N) depending on the season of sampling; soil depth 0–0.9 m (kg Nmin ha−1)

Author Contributions

Conceptualization, P.B. and R.Ł.; methodology, P.B.; validation, R.Ł.; formal analysis, R.Ł.; investigation, P.B. and R.Ł.; resources, P.B.; data curation, R.Ł.; writing—original draft preparation, R.Ł.; writing—review and editing, P.B. and R.Ł.; visualization, R.Ł.; project administration, P.B. All authors have read and agreed to the published version of the manuscript.

Funding

The study was financed by the National Science Centrum, Kraków, Poland, Grant no. N N310 026139.

Institutional Review Board Statement

Not applicable.

Informed Consent Statement

Not applicable.

Data Availability Statement

The study did not report any data.

Acknowledgments

The writing of the paper was supported by the Ministry of Science and Higher Education of Poland by project 005/RID/2018/19. The authors would like to thank the editor and reviewers for their valuable comments and suggestions, which substantially improved the manuscript.

Conflicts of Interest

The authors declare no conflict of interest.

References

  1. Fowler, D.; Coyle, M.; Skiba, U.; Sutton, M.A.; Cape, J.N.; Reis, S.; Sheppard, L.J.; Jenkins, A.; Grizzetti, B.; Galloway, J.N.; et al. The global nitrogen cycle in the twenty-first century. Philos. Trans. R. Soc. Lond. B Biol. Sci. 2013, 368, 20130164. [Google Scholar] [CrossRef] [PubMed]
  2. Islam, M.A.; Adjesiwor, A.T. Nitrogen Fixation and Transfer in Agricultural Production Systems. In Nitrogen in Agriculture—Updates; Amanullah, Fahad, S., Eds.; IntechOpen Limeted: London, UK, 2018. [Google Scholar] [CrossRef] [Green Version]
  3. Jensen, E.S.; Hauggaard-Nielsen, H. How can increased use of biological N2 fixation in agriculture benefit the environment? Plant Soil 2003, 252, 177–186. [Google Scholar] [CrossRef]
  4. Kirkegaard, J.; Christen, O.; Krupinsky, J.; Layzell, D. Break crop benefits in temperate wheat production. Field Crop Res. 2008, 107, 185–195. [Google Scholar] [CrossRef]
  5. Köpke, U.; Nemecek, T. Ecological services of Faba bean. Field Crop Res. 2010, 115, 217–233. [Google Scholar] [CrossRef]
  6. Herridge, D.F.; Peoples, M.B.; Boddey, R.M. Global inputs of biological nitrogen fixation in agricultural systems. Plant Soil 2008, 311, 1–18. [Google Scholar] [CrossRef]
  7. Lupwayi, N.Z.; Kennedy, A.C. Grain legumes in Northern Great Plains: Impacts on selected biological soil processes. Agron. J. 2007, 99, 1700–1709. [Google Scholar] [CrossRef]
  8. Peoples, M.B.; Brockwell, J.; Herridge, D.F.; Rochester, I.J.; Alves, B.J.R.; Urquiaga, S.; Boddey, R.M.; Dakora, F.D.; Bhattarai, S.; SMaskey, S.L.; et al. The contributions of nitrogen-fixing crop legumes to the productivity of agricultural systems. Symbiosis 2009, 48, 1–17. [Google Scholar] [CrossRef]
  9. Jensen, E.S.; Peples, M.B.; Hauggaard-Nielson, H. Faba bean in cropping systems. Field Crop Res. 2010, 115, 203–216. [Google Scholar] [CrossRef] [Green Version]
  10. Landry, E.J.; Coyne, C.J.; McGee, R.J.; Hu, J. Adaptation of autum-n-sown faba bean germplasm to southeastern Washington. Agron. J. 2016, 108, 301–308. [Google Scholar] [CrossRef] [Green Version]
  11. Rochester, I.J.; Peoples, M.B. Growing vetches (Vicia villosa Roth) in irrigated cotton systems: Inputs of fixed N, N fertilizer savings and cotton productivity. Plant Soil 2005, 271, 251–264. [Google Scholar] [CrossRef]
  12. Hauggaard-Nielsen, H.; Ambus, P.; Jensen, E.S. The comparison of nitrogen use and leaching in sole cropped versus intercropped pea and barley. Nutr. Cycl. Agroecosyst. 2003, 65, 289–300. [Google Scholar] [CrossRef]
  13. Peoples, M.B.; Bowman, A.M.; Gault, R.R.; Herridge, D.F.; McCallum, M.H.; McCormick, K.M.; Norton, R.M.; Rochester, I.J.; Scammell, G.J.; Schwenke, G.D. Factors regulating the contributions of fixed nitrogen by pasture and crop legumes to different farming systems of eastern. Australia Plant Soil 2001, 228, 29–41. [Google Scholar] [CrossRef]
  14. FAOSTAT. Broad Beans, Horse Beans, Dry. Food and Agriculture Organization of the United Nations (FAO). Available online: https://www.fao.org/faostat/en (accessed on 18 February 2021).
  15. Crépon, K.; Marget, P.; Peyronnet, C.; Carrouée, B.; Arese, P.; Duc, G. Nutritional value of faba bean (Vicia faba L.) seeds for feed and food. Field Crop Res. 2010, 115, 329–339. [Google Scholar] [CrossRef]
  16. Etemadi, F.; Hashemi, M.; Barker, A.V.; Zandvakili, O.R.; Liu, L. Agronomy, Nutritional Value, and Medicinal Application of Faba Bean (Vicia faba L.). Hortic. Plant J. 2019, 5, 170–182. [Google Scholar] [CrossRef]
  17. GUS—Central Statistical Office. Statistical Yearbook of the Republic of Poland. 2018. Available online: https://stat.gov.pl/en/topics/statistical-yearbooks/statistical-yearbooks/statistical-yearbook-of-the-republic-of-poland-2018,2,19.html (accessed on 18 February 2021).
  18. Pszczółkowska, A.; Okorski, A.; Fordonski, G.; Kotecki, A.; Kozak, M.; Dzienis, G. Effect of Weather Conditions on Yield and Health Status of Faba Bean Seeds in Poland. Agronomy 2020, 10, 48. [Google Scholar] [CrossRef] [Green Version]
  19. López-Bellido, F.J.; López-Bellido, L.; López-Bellido, R.J. Competition, growth and yield of faba bean (Vicia faba L.). Eur. J. Agron. 2005, 23, 359–378. [Google Scholar] [CrossRef]
  20. Kapoor, D.; Bhardwaj, S.; Landi, M.; Sharma, A.; Ramakrishnan, M.; Sharma, A. The Impact of Drought in Plant Metabolism: How to Exploit Tolerance Mechanisms to Increase Crop Production. Appl. Sci. 2020, 10, 5692. [Google Scholar] [CrossRef]
  21. Hasanuzzaman, M.; Bhuyan, M.H.M.; Nahar, K.; Hossain, M.; Mahmud, J.A.; Hossen, M.; Masud, A.A.C.; Fujita, M. Potassium: A Vital Regulator of Plant Responses and Tolerance to Abiotic Stresses. Agronomy 2018, 8, 31. [Google Scholar] [CrossRef] [Green Version]
  22. Kurdali, F.; Al-Ain, F.; Al-Shamma, M. Nodulation, dry matter production, and N2 fixation by faba bean and chickpea as affected by soil moisture and potassium fertilizer. J. Plant Nutr. 2002, 25, 355–368. [Google Scholar] [CrossRef]
  23. Römheld, V.; Kirkby, E.A. Research on potassium in agriculture: Needs and prospects. Plant Soil 2010, 335, 155–180. [Google Scholar] [CrossRef]
  24. Taha, A.A.; Omar, M.M.; Hadeer, K. Effect of different sources and levels of potassium on growth, yield and chemical composition of faba bean. J. Soil Sci. Agric. Eng. Mansoura Univ. 2016, 7, 243–248. [Google Scholar] [CrossRef]
  25. FAO. Fertilizer Use by Crop in Poland; The Food and Agriculture Organization (FAO): Rome, Italy, 2003; Available online: http://www.fao.org/tempref/agl/agll/docs/fertusepoland.pdf (accessed on 23 March 2021).
  26. Kaiser, B.N.; Gridley, K.L.; Brady, J.N.; Phillips, T.; Tyerman, S.D. The role of molybdenum in agricultural plant production. Ann. Bot. 2005, 96, 745–754. [Google Scholar] [CrossRef] [PubMed]
  27. Pacyna, S.; Schulz, M.; Scherer, H. Influence of sulphur supply on glucose and ATP concentrations of inoculated broad beans (Vicia faba minor L.). Biol. Fertil. Soils 2006, 42, 324–329. [Google Scholar] [CrossRef]
  28. Głowacka, A.; Gruszecki, T.; Szostak, B.; Michałek, S. The response of common bean to sulphur and molybdenum fertilization. Int. J. Agron. 2019, 2019, 3830712. [Google Scholar] [CrossRef]
  29. Scherer, H.W.; Pacyna, S.; Manthey, N.; Schulz, M. Sulphur supply to peas (Pisum Sativum L.) influences symbiotic N2 fixation. Plant Soil Environ. 2006, 52, 72–77. [Google Scholar] [CrossRef] [Green Version]
  30. Habtemichial, K.H.; Singh, B.R.; Aune, J.B. Wheat response to N2 fixed by faba bean (Vicia faba L.) as affected by sulfur fertilization and rhizobial inoculation in semi-arid Northern Ethiopia. J. Plant Nutr. Soil Sci. 2007, 170, 412–418. [Google Scholar] [CrossRef]
  31. Cazzato, E.; Tufarelli, V.; Ceci, E.; Stellacci, A.M.; Laudadio, V. Quality, yield and nitrogen fixation of faba bean seeds as affected by sulphur fertilization. Acta Agric. Scand. Sect. B 2012, 62, 732–738. [Google Scholar] [CrossRef]
  32. Barłóg, P.; Grzebisz, W.; Łukowiak, R. The Effect of Potassium and Sulfur Fertilization on Seed Quality of Faba Bean (Vicia faba L.). Agronomy 2019, 9, 209. [Google Scholar] [CrossRef] [Green Version]
  33. Vestreng, V.; Myhre, G.; Fagerli, H.; Reis, S.; Tarraśon, L. Twenty-five years of continuous sulphur dioxide emission reduction in Europe. Atmos. Chem. Phys. 2007, 7, 3663–3681. [Google Scholar] [CrossRef] [Green Version]
  34. Przygocka-Cyna, K.; Grzebisz, W. Sulphur balance in Poland—Regional analysis. Fragm. Agron. 2017, 34, 60–75. [Google Scholar]
  35. Zhou, L.I.; Cao, J.; Zhang, F.S.; Li, L. Rhizosphere acidification of faba bean, soybean and maize. Sci. Total Environ. 2009, 407, 4359–4362. [Google Scholar] [CrossRef]
  36. Yang, Y.; Haneklaus, S.; Singh, B.R.; Schnug, E. Effect of Repeated Applications of Elemental Sulfur on Microbial Population, Sulfate Concentration, and pH in Soils. Commun. Soil Sci. Plan. 2007, 39, 124–140. [Google Scholar] [CrossRef]
  37. Bouranis, D.L.; Venieraki, A.; Chorianopoulou, S.N.; Katinakis, P. Impact of Elemental Sulfur on the Rhizospheric Bacteria of Durum Wheat Crop Cultivated on a Calcareous Soil. Plants 2019, 8, 379. [Google Scholar] [CrossRef] [Green Version]
  38. WRB. World reference base for soil resources 2014. In Word Soil Resources Reports, 106; Food and Agriculture Organization of the United Nations: Rome, Italy, 2015; Available online: http://www.fao.org/3/i3794en/I3794en.pdf (accessed on 19 March 2021).
  39. Kęsik, K.; Jadczyszyn, T.; Lipiński, W.; Jurga, B. Adaptation of the Mehlich 3 procedure for routine determination of phosphorus, potassium and magnesium in soil. Przemysł Chem. 2015, 94, 973–976. (In Polish) [Google Scholar] [CrossRef]
  40. Motowicka-Terelak, T.; Terelak, H. Siarka w glebach i roślinach Polski. Folia Univ. Agric. Stetin. 204 Agric. 2000, 81, 7–16. (In Polish) [Google Scholar]
  41. Rutkowska, A.; Fotyma, M. Calibration of Soil Test for Mineral Nitrogen in Poland. Commun. Soil Sci. Plant Anal. 2009, 40, 987–998. [Google Scholar] [CrossRef]
  42. Pszółkowski, P.; Sawicka, B. Phenotopic variability of the yield and structure of mid-early potato cultivars. Acta Sci. Pol. Agric. 2017, 16, 147–161. [Google Scholar]
  43. Meier, U. Growth Stages of Mono- and Dicotyledonous Plants. BBCH Monograph.; Meier, U., Ed.; Julius Kühn-Institut (JKI): Quedlinbur, Germany, 2018; Available online: https://www.julius-kuehn.de/media/Veroeffentlichungen/bbch%20epaper%20en/page.pdf (accessed on 27 February 2021).
  44. Houba, V.J.G.; Temminghoff, E.J.M.; Gaikhorst, G.A.; van Vark, W. Soil analysis procedures using 0.01 M calcium chloride as extraction reagents. Commun. Soil Sci. Plant Anal. 2000, 31, 1299–1396. [Google Scholar] [CrossRef]
  45. Reining, E. Assessment tool for biological nitrogen fixation of Vicia faba cultivated as spring main crop. Eur. J. Agron. 2005, 23, 392–400. [Google Scholar] [CrossRef]
  46. TIBCO Software Inc. Data Science Textbook. 2020. Available online: https://docs.tibco.com/data-science/textbook (accessed on 7 February 2021).
  47. Podleśny, J. Effect of amount and distribution of precipitation during vegetation on growth, development and yielding of determinate and traditional faba bean varieties. Acta Agrophys. 2009, 14, 413–425. [Google Scholar]
  48. Najeeb, H.; Alharbi, A.B.; Adhikari, K.N. Factors of yield determination in faba bean (Vicia faba). Crop Pasture Sci. 2020, 71, 305–321. [Google Scholar] [CrossRef]
  49. Łabuda, H. Flowering and characteristics of useful traits of some faba bean (Vicia faba L. var.major Harz) cultivars and breeding lines. Acta Agrobot. 2012, 65, 139–148. [Google Scholar] [CrossRef]
  50. Neugschwandtner, R.W.; Ziegler, K.V.; Kriegner, S.; Kaul, H.-P. Limited winter survival and compensation mechanisms of yield components constrain winter faba bean production in Central Europe. Acta Agric. Scand. Sect. B Soil Plant Sci. 2015, 65, 496–505. [Google Scholar] [CrossRef]
  51. Mwanamwenge, J.; Loss, S.P.; Siddique, K.H.M.; Cocks, P.S. Effect of water stress during floral initiation, flowering and podding on the growth and yield of faba bean (Vicia faba L.). Eur. J. Agron. 1999, 9, 273–293. [Google Scholar] [CrossRef]
  52. Pettigrew, W.W. Potassium influences on yield and quality production for maize, wheat, soybean and cotton. Physiol. Plant. 2008, 133, 670–681. [Google Scholar] [CrossRef]
  53. Niewiadomska, A.; Barłóg, P.; Borowiak, K.; Wolna-Maruwka, A. The effect of sulphur and potassium fertilisation on the nitrogenase and microbial activity in soil under broad bean (Vicia faba L.) cultivation. Fresen. Environ. Bull. 2015, 24, 723–732. [Google Scholar]
  54. Abd-Alla, M.H.; Abdel Wahab, A.M. Response of nitrogen fixation, nodule activities, and growth to potassium supply in water-stressed broad bean. J. Plant Nutr. 1995, 18, 1391–1402. [Google Scholar] [CrossRef]
  55. Barłóg, P.; Grzebisz, W.; Łukowiak, R. Faba bean yield and growth dynamics in response to soil potassium availability and sulfur application. Field Crop Res. 2018, 219, 87–97. [Google Scholar] [CrossRef]
  56. Khan, T.A.; Mazid, M. Nutritional significance of sulphur in pulse cropping system. Biol. Med. 2011, 3, 114–133. [Google Scholar]
  57. Mendel, R.R.; Bittner, F. Cell biology of molybdenum. Biochim. Biophys. Acta Mol. Cell Res. 2006, 1763, 621–635. [Google Scholar] [CrossRef] [PubMed] [Green Version]
  58. Scherer, H.W. Impact of sulfur on N2 fixation of legumes. In Sulfur Assimilation and Abiotic Stress in Plants; Khan, N.A., Singh, S., Umar, S., Eds.; Springer: Berlin/Heidelberg, Germany, 2008; pp. 43–54. [Google Scholar] [CrossRef]
  59. Varin, S.; Cliquet, J.B.; Personeni, E.; Avice, J.C.; Lemauviel-Lavenant, S. How does sulphur availability modify N acquisition of white clover (Trifolium repens L.)? J. Exp. Bot. 2010, 61, 225–234. [Google Scholar] [CrossRef] [PubMed] [Green Version]
  60. Weisany, W.; Raei, Y.; Allahverdipoor, K.H. Role of Some of Mineral Nutrients in Biological Nitrogen Fixation. Bull. Environ. Pharmacol. Life Sci. 2013, 2, 77–84. [Google Scholar]
  61. Akhtar, A.; Hisamuddin, A.; Robab, M.I.; Abbasi, H.; Sharf, R. Plant growth promoting Rhizobacteria: An overview. J. Nat. Prod. Plant Resour. 2012, 2, 19–31. [Google Scholar]
  62. Elscheikh, E.A.E.; Elzidany, A.A. Effect of Rhizobium inoculation, organic and chemical fertilizers on proximate composition, in vitro protein digestibility, tannin and sulphur content of faba beans. Food Chem. 1997, 59, 41–45. [Google Scholar] [CrossRef]
  63. Ganeshamurthy, A.N.; Sammi Reddy, K. Effect of integrated used of farmyard Manure and Sulphur in a soyabean and wheat cropping systems on nodulation dry matter production and chlorophyll content of soyabean on swell-shrink soil in central India. J. Agron. Crop Sci. 2000, 185, 91–97. [Google Scholar] [CrossRef]
  64. Turpin, J.E.; Herridge, D.F.; Robertson, M.J. Nitrogen fixation and soil nitrate interactions in field-grown chickpea (Cicer arietinum) and faba bean (Vicia faba). Aust. J. Agric. Res. 2002, 53, 599–608. [Google Scholar] [CrossRef]
  65. Allito, B.B.; Ewusi-Mensah, N.; Alemneh, A.A. Rhizobia strain and host-legume interaction effects on nitrogen fixation and yield of grain legume: A review. Mol. Soil Biol. 2014, 6, 1–6. [Google Scholar] [CrossRef] [Green Version]
  66. Tripolskaja, L.; Asakaviciute, R. Effects of fertilisers on pulse crop productivity and nitrogen assimilation on acid soil. Plant Soil Environ. 2019, 65, 536–540. [Google Scholar] [CrossRef]
  67. Schipanski, M.E.; Drinkwater, L.E.; Russelle, M.P. Understanding the variability in soybean nitrogen fixation across agroecosystems. Plant Soil 2010, 329, 379–397. [Google Scholar] [CrossRef]
  68. Guinet, M.; Nicolardot, B.; Revellin, C.; Durey, V.; Carlsson, G.; Voisin, A.-S. Comparative effect of inorganic N on plant growth and N2 fixation of ten legume crops: Towards a better understanding of the differential response among species. Plant Soil 2018, 432, 207–227. [Google Scholar] [CrossRef]
  69. Hossain, Z.; Wang, X.; Hamel, C.; Knight, J.D.; Morrison, M.J.; Gan, Y. Biological nitrogen fixation by pulse crops on semiarid Canadian prairies. Can. J. Plant Sci. 2016, 97, 119–131. [Google Scholar] [CrossRef]
  70. Denton, M.D.; Pearce, D.J.; Peoples, M.B. Nitrogen contributions from faba bean (Vicia faba L.) reliant on soil rhizobia or inoculation. Plant Soil 2013, 365, 363–374. [Google Scholar] [CrossRef]
  71. Fahmi, A.I.; Nagaty, H.H.; Eissa, R.A.; Hassan, M.M. Effects of Salt Stress on Some Nitrogen Fixation Parameters in Faba Bean. Pak. J. Biol. Sci. 2011, 14, 385–391. [Google Scholar] [CrossRef] [PubMed]
  72. Jaiswal, S.K.; Naamala, J.; Dakora, F.D. Nature and mechanisms of aluminum toxicity, tolerance and amelioration in symbiotic legumes and rhizobia. Biol. Fert. Soils 2018, 54, 309–318. [Google Scholar] [CrossRef] [PubMed]
  73. Rochester, I.J.; Peoples, M.B.; Constable, G.A.; Gault, R.R. Faba beans and other legumes add nitrogen to irrigated cotton cropping systems. Aust. J. Exp. Agric. 1998, 38, 253–260. [Google Scholar] [CrossRef]
Figure 1. Effect of K treatments and S application on grain yield (GY) of faba bean. K1, K2, K3, and K4 refer to levels of soil K availability and fertilization; S0, S25, and S50 refer to sulfur application at rates of 0, 25, and 50 kg S ha−1, respectively. Means followed by the same letter are not statistically different (p < 0.05). Hatched bars represent 2 × standard error (SE) ranges.
Agronomy 11 01137 g001
Figure 2. Effect of K treatments and S application on total dry matter (TDM) of faba bean. K1, K2, K3, and K4 refer to levels of soil K availability and fertilization; S0, S25, and S50 refer to sulfur application at rates of 0, 25, and 50 kg S ha−1, respectively. Means followed by the same letter are not statistically different (p < 0.05). Hatched bars represent 2 × standard error (SE) ranges.
Agronomy 11 01137 g002
Figure 3. Effect of K treatments and S application on harvest index (HI) of faba bean. K1, K2, K3, and K4 refer to levels of soil K availability and fertilization; S0, S25, and S50 refer to sulfur application at rates of 0, 25, and 50 kg S ha−1, respectively. Means followed by the same letter are not statistically different (p < 0.05). Hatched bars represent 2 × standard error (SE) ranges.
Agronomy 11 01137 g003
Figure 4. Effect of K treatments and S application on the number of pods per plant (PP). K1, K2, K3, and K4 refer to levels of soil K availability and fertilization; S0, S25, and S50 refer to sulfur application at rates of 0, 25, and 50 kg S ha−1, respectively. Means followed by the same letter are not statistically different (p < 0.05). Hatched bars represent 2 × standard error (SE) ranges.
Agronomy 11 01137 g004
Figure 5. Effect of K treatments and S application on amount of N in grains (GN). K1, K2, K3, and K4 refer to levels of soil K availability and fertilization; S0, S25, and S50 refer to sulfur application at rates of 0, 25, and 50 kg S ha−1, respectively. Means followed by the same letter are not statistically different (p < 0.05). Hatched bars represent 2 × standard error (SE) ranges.
Agronomy 11 01137 g005
Figure 6. Effect of K treatments and S application on amount of N in crop residues (RN). K1, K2, K3, and K4 refer to levels of soil K availability and fertilization; S0, S25, and S50 refer to sulfur application at rates of 0, 25, and 50 kg S ha−1, respectively. Means followed by the same letter are not statistically different (p < 0.05). Hatched bars represent 2 × standard error (SE) ranges.
Agronomy 11 01137 g006
Figure 7. Effect of K treatments and S application on symbiotic N fixation (SNF). K1, K2, K3, and K4 refer to levels of soil K availability and fertilization; S0, S25, and S50 refer to sulfur application at rates of 0, 25, and 50 kg S ha−1, respectively. Means followed by the same letter are not statistically different (p < 0.05). Hatched bars represent 2 × standard error (SE) ranges.
Agronomy 11 01137 g007
Figure 8. Grain yield (GY) as a function of dry matter of leaves, LDM (a); thousand grain weight, TGW (b); amount of N fixed from atmosphere, SNF (c), and relationships between total soil N increase (NgainT) and the amount N in crop residues, RN (d).
Agronomy 11 01137 g008
Table 1. Experimental factors and their levels.
FactorAcronyms and Factor Levels
Potassium treatmentsK1—control, low K concentration in soil, without any K dose in crop rotation
K2—medium K concentration in soil + 33.3 kg K ha−1 (= 25% of the full K dose)
K3—medium K concentration in soil + 66.5 kg K ha−1 (= 50% of the full K dose)
K4—high K concentration in soil + 133.0 kg K ha−1 (= 100% of the nutrient requirement for faba bean)
Sulfur applicationS0—control, without S application
S25—25.0 kg S ha−1
S50—50.0 kg S ha−1
Table 2. Soil pH and plant available nutrients in early spring as a result of long-term experiments, varied K fertilization (mean for 2012–2014).
TreatmentpH 1P 2K 2Mg 2Ca 2SO4-S 3NH4-N 4NO3-N 4
mg kg−1kg ha−1
Soil depth: 0.0–0.3 m
K16.34157.3 H89.3 L60.4 M1184 L10.4 L11.729.0
K26.49165.9 H133.2 M60.0 M1089 L12.0 L15.030.4
K36.41167.8 H115.0 M57.4 M1132 L10.4 L11.434.6
K46.52163.6 H163.0 H62.4 M1021 L9.4 L10.233.8
Soil depth: 0.3–0.6 m
K15.9398.881.969.812898.411.528.8
K26.13110.2104.074.9137111.59.828.0
K35.97108.098.784.3130910.610.128.9
K46.14109.7112.779.212869.39.932.8
Soil depth: 0.6–0.9 m
K16.2539.287.090.5013908.59.335.5
K26.0348.797.084.00140111.19.733.4
K36.0933.295.4105.50129310.611.729.3
K46.2944.395.898.00132811.510.029.7
1 1.0 mol KCl; 2 Mehlich 3 method; 3 2% CH3COOH (1:10 w/v ratio); 4 0.01 mol CaCl2 (1:10 w/v ratio). Evaluation of plant available nutrient content: VL very low; L low; M medium; H high.
Table 4. Indices of nitrogen management in the soil–plant system (mean ± standard error).
FactorsNin
(kg ha−1)
Nb
(kg ha−1)
Ngain
(kg ha−1)
NinT
(kg ha−1)
NgainT
(kg ha−1)
NinE
(kg kg−1)
K treatments (K)
K1 274.7 ± 6.9 b184.7 ± 6.0 b27.7 ± 6.9302.4 ± 8.3 b102.2 ± 7.632.8 ± 1.3
K2 305.4 ± 9.7 a202.6 ± 6.5 a33.2 ± 8.5338.6 ± 10.7 a124.8 ± 10.133.4 ± 1.0
K3 292.9 ± 8.3 ab189.9 ± 6.8 ab36.2 ± 6.8329.1 ± 9.0 ab116.0 ± 7.234.9 ± 1.6
K4 303.5 ± 7.6 a205.3 ± 6.9 a26.7 ± 7.6330.1 ± 8.1 ab121.8 ± 7.932.4 ± 1.3
S treatments (S)
S0 282.8 ± 8.6 b192.7 ± 6.123.1 ± 6.8305.8 ± 9.0105.4 ± 7.731.6 ± 1.0 b
S25 294.5 ± 6.3 ab196.0 ± 5.535.2 ± 6.3329.7 ± 7.2120.9 ± 7.133.5 ± 1.2 ab
S50 305.0 ± 6.4 a198.2 ± 5.734.5 ± 6.0339.5 ± 7.1122.4 ± 6.135.1 ± 1.2 a
K × S interaction
K1S0254.1 ± 13.1178.6 ± 10.616.2 ± 8.5270.3 ± 11.4 c84.6 ± 7.929.9 ± 1.7
S25276.5 ± 8.9185.7 ± 10.425.0 ± 15.6301.4 ± 14.1 abc100.4 ± 17.833.2 ± 2.4
S50293.5 ± 11.4190.0 ± 10.841.9 ± 10.4335.4 ± 11.7 abc121.7 ± 10.735.4 ± 2.5
K2S0302.1 ± 19.9204.8 ± 13.429.8 ± 19.0331.8 ± 22.5 abc123.6 ± 21.432.0 ± 1.4
S25301.4 ± 15.7203.1 ± 10.444.2 ± 9.5345.5 ± 15.5 ab136.3 ± 12.232.2 ± 1.9
S50312.7 ± 15.7199.9 ± 10.625.6 ± 14.8338.3 ± 18.4 ab114.5 ± 18.636.0 ± 1.8
K3S0263.4 ± 16.1178.3 ± 11.620.3 ± 11.6283.7 ± 12.1 bc88.5 ± 10.931.8 ± 2.8
S25297.4 ± 12.7189.9 ± 11.841.1 ± 12.6338.5 ± 14.2 ab120.8 ± 11.636.2 ± 2.8
S50318.0 ± 9.8201.6 ± 11.747.1 ± 10.4365.1 ± 10.3 a138.6 ± 11.436.8 ± 2.6
K4S0311.6 ± 14.7209.1 ± 11.825.9 ± 15.0337.5 ± 16.9 ab124.8 ± 15.932.8 ± 2.0
S25302.8 ± 12.1205.3 ± 11.230.8 ± 13.2333.6 ± 11.6 abc125.9 ± 13.932.2 ± 2.2
S50296.0 ± 13.5201.5 ± 13.423.3 ± 12.2319.3 ± 13.5 abc114.7 ± 12.332.2 ± 2.7
Means followed by the same letter in superscript are not statistically different. Nin—N input in soil–plant system = soil + SNF; Nb—N balance; Ngain—soil N increase during the growing season; NinT—total N input = soil + SNF + Ngain; NgainT—total soil N increase as a result of the sum of Ngain and N from air in crop residues; NinE—N input efficiency.
Publisher’s Note: MDPI stays neutral with regard to jurisdictional claims in published maps and institutional affiliations.

