Article

Metabolic Responses of Two Contrasting Lentil Genotypes to PEG-Induced Drought Stress

by
Chrysanthi Foti
1,
Ioannis F. Kalampokis
2,
Konstantinos A. Aliferis
2,3 and
Ourania I. Pavli
1,*
1
Department of Agriculture Crop Production and Rural Environment, University of Thessaly, 38446 Volos, Greece
2
Department of Crop Science, Agricultural University of Athens, 11855 Athens, Greece
3
Department of Plant Science, McGill University, Macdonald Campus, Ste-Anne-de-Bellevue, QC H9X 3V9, Canada
*
Author to whom correspondence should be addressed.
Agronomy 2021, 11(6), 1190; https://doi.org/10.3390/agronomy11061190
Submission received: 28 April 2021 / Revised: 6 June 2021 / Accepted: 7 June 2021 / Published: 10 June 2021

Abstract

:
Among abiotic stresses, drought is undoubtedly one of the most severe environmental factors for a wide range of major crops, leading to considerable yield and economic losses. The adverse effects in crop yield reflect the result of a series of morphological and physiological changes but also changes in signaling pathways, transcriptional and post-transcriptional regulation of stress-responsive genes, and metabolic adaptations. Despite the exhausting studies elucidating plants’ metabolic response to drought, there is a knowledge gap in the biochemical mechanisms governing drought tolerance in lentil (Lens culinaris Medik.). The present study aimed to determine the fluctuations of the metabolite profiles of lentil genotypes with contrasting drought tolerance to discover possible biomarkers for screening tolerant genotypes at early growth stages. Lentil seedlings were subjected to osmotic drought stress, induced by polyethylene glycol, at two stress levels (2.5% and 5.0% PEG-6000) for a period of 20 days, while untreated plants were also included as controls. GC/ΕΙ/MS-mediated metabolic profiling was employed to monitor changes in response to osmotic drought stress. The data was subjected to OPLS-DA and OPLS-HCA for the discrimination between treatments and the discovery of trends and corresponding biomarkers. In total, the analysis yielded 150 metabolite features with highly reproducible patterns, of which the vast majority belonged to carbohydrates, carboxylic acids, and amino acids. Overall, findings highlight the differential accumulation of a series of compounds, and more importantly, the variable accumulation of certain metabolites, namely D-fructose, α,α-trehalose, myo-inositol, and L-tryptophan, in the contrasting genotypes, indicating that the adaptive metabolic responses to osmotic drought stress operate under strong genotypic dependency in lentil. Research findings provide insights into various aspects of lentil’s metabolism under drought and further offer the possibility of applying such knowledge towards effectively screening for drought-tolerant lentil germplasm at early growth stages.

1. Introduction

Plants constantly face a multitude of physical or chemical stress factors, collectively referred to as abiotic stresses, which pose severe threats to agriculture and the ecosystem. Among abiotic stresses, drought is one of the most important environmental factors for a wide range of major crops, accounting for substantial crop yield and economic losses worldwide [1]. The adverse effects on crop yield are the result of a series of morphological and physiological changes, such as inhibition of growth, reduced photosynthesis and transpiration rates, but also changes in signaling pathways, transcriptional and post-transcriptional regulation of stress-responsive genes, and metabolic adaptations mainly involving the accumulation of osmolytes or compatible solutes [1,2,3,4,5,6]. Osmolyte accumulation acts in favor of cell water uptake and cell turgor maintenance; stabilization of membranes, enzymes, and proteins; and protection against oxidative damage through reactive oxygen species (ROS) scavenging, thereby contributing to redox balance [1,3]. Among metabolites with osmoprotective functions under drought stress conditions, well known examples are proline, trehalose, fructans, glycine betaine, and polyols.
Lentil (Lens culinaris Medik.) is an important pulse crop with a moderate adaptation to drought-prone and marginal environments as its cultivation traditionally takes place in arid and semi-arid areas under low-input conditions. Despite its ability to survive drought, its growth and productivity are greatly impaired under water-deficit conditions, especially when drought stress occurs during germination, flowering, and pod filling stages [7,8,9,10]. More importantly, drought effects are aggravated by a combination of different abiotic stresses arising in lentil cultivation zones, as drought episodes are often interlinked with high temperatures [11,12]. Stress-attributed effects are manifested as reduced leaf area, total dry matter, flower production, number of pods and seeds, and increased flower drop and aborted pods [13]. Minimization of yield and quality losses under drought conditions primarily relies on the use of tolerant germplasm, therefore, placing the emphasis on deciphering mechanisms involved in drought tolerance and applying such knowledge for improving relevant traits.
Given that plants’ response to environmental stimuli may be different in the post-genomic era, the interest has been placed on practically exploiting system biology approaches for crop tolerance improvement. Plant metabolomics has undoubtedly become an indispensable system biology tool to gain in-depth understanding into complex biological phenomena governing growth and development in the context of adaptive metabolic responses to abiotic stress [14,15,16,17,18]. Understanding the global regulatory system involved in drought stress response through changes at the metabolome provides the possibility to pinpoint specific metabolites playing crucial roles in drought tolerance, which can be employed as biomarkers for future application in breeding and biotechnology [6,19,20]. Especially in view of the bottlenecks arising from assessing the performance of a large number of genotypes under water-deficient field environments, such biomarker-based screening is increasingly gaining credibility as an alternative approach to equip crops with drought tolerance. Despite the knowledge that has been acquired to date in a plethora of plant species, there is a gap in the molecular mechanisms governing drought tolerance in lentil, a crop whose narrow genetic base undoubtedly poses serious constraints to its stress tolerance improvement. Indeed, very few functional genomics approaches have been reported to investigate lentil responses to drought stress. In particular, metabolomics, along with analysis of phenotypic traits, has been employed to investigate the drought and salinity response of lentil genotypes at early growth stages and to pinpoint ornithine and asparagine as stress-specific indicators for drought stress [21]. In addition, recent studies determined the leaf transcriptional profile of contrasting lentil genotypes under drought conditions and identified genes and pathways associated with drought responses at the seedling stage [22,23]. Given the significant role of seedling growth in drought tolerance [24,25,26] and our previous findings related to the phenotypic drought responses of lentil germplasm [27], this study aimed at investigating the metabolic adjustments in two contrasting genotypes under drought stress at the seedling stage. The objective was to capture the genetic variation existing at early growth stages in order to identify the influencing metabolites to be exploited as candidate biomarkers for drought tolerance.

2. Materials and Methods

2.1. Plant Material

A comparative analysis of lentil metabolism under osmotic drought stress conditions was performed using two genotypes that were previously assessed as drought-tolerant (DT) and drought-sensitive (DS), based on results from laboratory evaluation [27]. Specifically, cultivar Elpida, a purebred line conventionally bred at ELGO-Demeter, Institute of Industrial and Fodder Plants (Larisa, Greece), served as DT genotype, while the cultivar Flip03-24L, an improved population imported from ICARDA, was used as DS genotype.

2.2. Osmotic Drought Stress Treatment and Experimental Design

The osmotic potential of the solution was decreased by polyethylene glycol (PEG-6000) (Sigma-Aldrich Chemie GmbH, Steinheim, Germany), a macromolecule well known for its ability to mimic drought stress [27,28,29,30]. To ensure constant aeration in roots, a hydroponic system supplemented with aquarium pumps was established. Seeds were surface-sterilized for 5 min in 20% sodium hypochlorite (EMPLURA, Merck KGaA, Darmstadt, Germany)/H2O solution, supplemented with Tween-20 while gently mixing and washed 4× with sterile dH2O. Sterilized seeds were allowed to germinate in plastic trays containing three different solutions: (i) sterile dH2O (control), (ii) 2.5% PEG-6000, and (iii) 5% PEG-6000. Trays were regularly monitored for the level of containing solution and H2O was added in order to retain PEG concentration at constant levels, when necessary. Plants were grown under controlled conditions (25/18 °C day/night temperature and 16/8 h light cycle, LED lighting with a Photosynthetic Photon Flux Density (PPFD) of 12 μmol m−2 s−1).
The experimental layout was that of a complete random design with four replications for each genotype-stress level combination. Each experimental plot (plastic tray) consisted of four rows and columns, of which the two middles were used to provide material for the analyses. Sampling was performed on lentil plants subjected to osmotic drought stress for a period of 20 days. Plants were dabbed on a filter paper to remove excess humidity. Leaf samples were snap frozen in liquid nitrogen and stored at −80 °C. All samples were collected at the same time. Each sample, considered as an independent biological replicate, consisted of a bulk of 4 individual plants.

2.3. Metabolite Extraction, Derivatization, and GC-MS Analysis

Leaf sample preparation and metabolite extraction was performed based on previously described protocols [31,32] with minor modifications. Briefly, leaves (50 mg) were pulverized under liquid nitrogen and homogenized tissues were transferred to Eppendorf tubes. Twenty μL of ribitol (20 mg mL−1 in methanol) (Sigma-Aldrich Ltd.; Steinheim, Germany) were added as an internal standard. Samples were extracted in ethyl acetate-methanol (50:50, v/v), under continuous agitation (200 rpm, 2 h, 24 °C) and filtered (0.2 μm PTFE filters). Finally, the extracts were dried using a vacuum concentrator (Labconco, Kansas City, MO, USA). For the derivatization of the dried extracts, a two-step protocol was employed: for methoxymation, the dried samples were resuspended in 80 μL methoxylamine-HCl (20 mg mL−1 in pyridine) under gentle agitation for 120 min at 30 °C. Silylation followed by adding 80 µL of N-methyl-N-(trimethylsilyl)-trifluoroacetamide (MSTFA), and samples were incubated at 37 °C for 90 min. Derivatized samples were transferred into autosampler vials (2 mL) and kept at room temperature in the dark for 24 h prior to analyses.
For GC/EI/MS metabolomics analysis, an Agilent 6890 MS platform (Agilent Technologies Inc.; Santa Clara, CA, USA) coupled with a 7683 inert mass selective detector (MSD) was employed. The analyzer was equipped with a HP-5MS column (30 m, i.d. 0.25 μm) and helium was used as the carrier gas (1 mL min−1). Samples (1 μL) were injected with a split ratio of 1/10. The temperature program was initially 70 °C for 5 min, followed by a 5 °C min−1 increase to 295 °C. Mass spectra were recorded at 4 scans s−1 in the range 50–800 Da in positive electron ionization (70 eV).
For each genotype-stress level combination, 4 pooled samples were analyzed, each consisting of 4 individual samples. To detect possible contamination from the reagents, the experimental protocol, or the instrument, blank samples were analyzed following the same extraction procedure.

2.4. Statistical Analysis

For GC/EI/MS data pre-processing, the software MSDIAL was used applying the recommended settings for GC/EI/MS data analysis [33]. Metabolite features present in less than 50% among replications of the same treatment were excluded from further analyses in order to strengthen data uniformity and validity. The obtained matrix was exported to MS excel® and further examined for inconsistencies. Data matrices were subjected to multivariate analyses using the SIMCA-P v.13.0 software (Umetrics, Sartorius Stedim Data Analytics AB, Umeå, Sweden) [31,34,35,36].
The discrimination between treatments was based on orthogonal partial least squares-discriminant analysis (OPLS-DA, p < 0.05) [37] and OPLS-hierarchical cluster analysis (OPLS-HCA), while the discovery of biomarkers was based on values of scaled and centered OPLS regression coefficients (p < 0.05). The performance of models was assessed by the cumulative fraction of the total variation of the X’s that could be predicted by the extracted components (Q2cum) and the fraction of the sum of squares of all X’s (R2X) and Y’s (R2Y). The Kyoto Encyclopedia of Genes and Genomes KEGG (http://www.genome.jp/kegg/, accessed on 22 January 2020) database was utilized to mine metabolic pathways and construct a metabolic map of significant metabolic compounds (coefficient values ≥ 2.5 and ≤−2.5). Additionally, heatmaps were constructed for the visualization of the data set, thus enabling biological interpretation of results [38].

3. Results

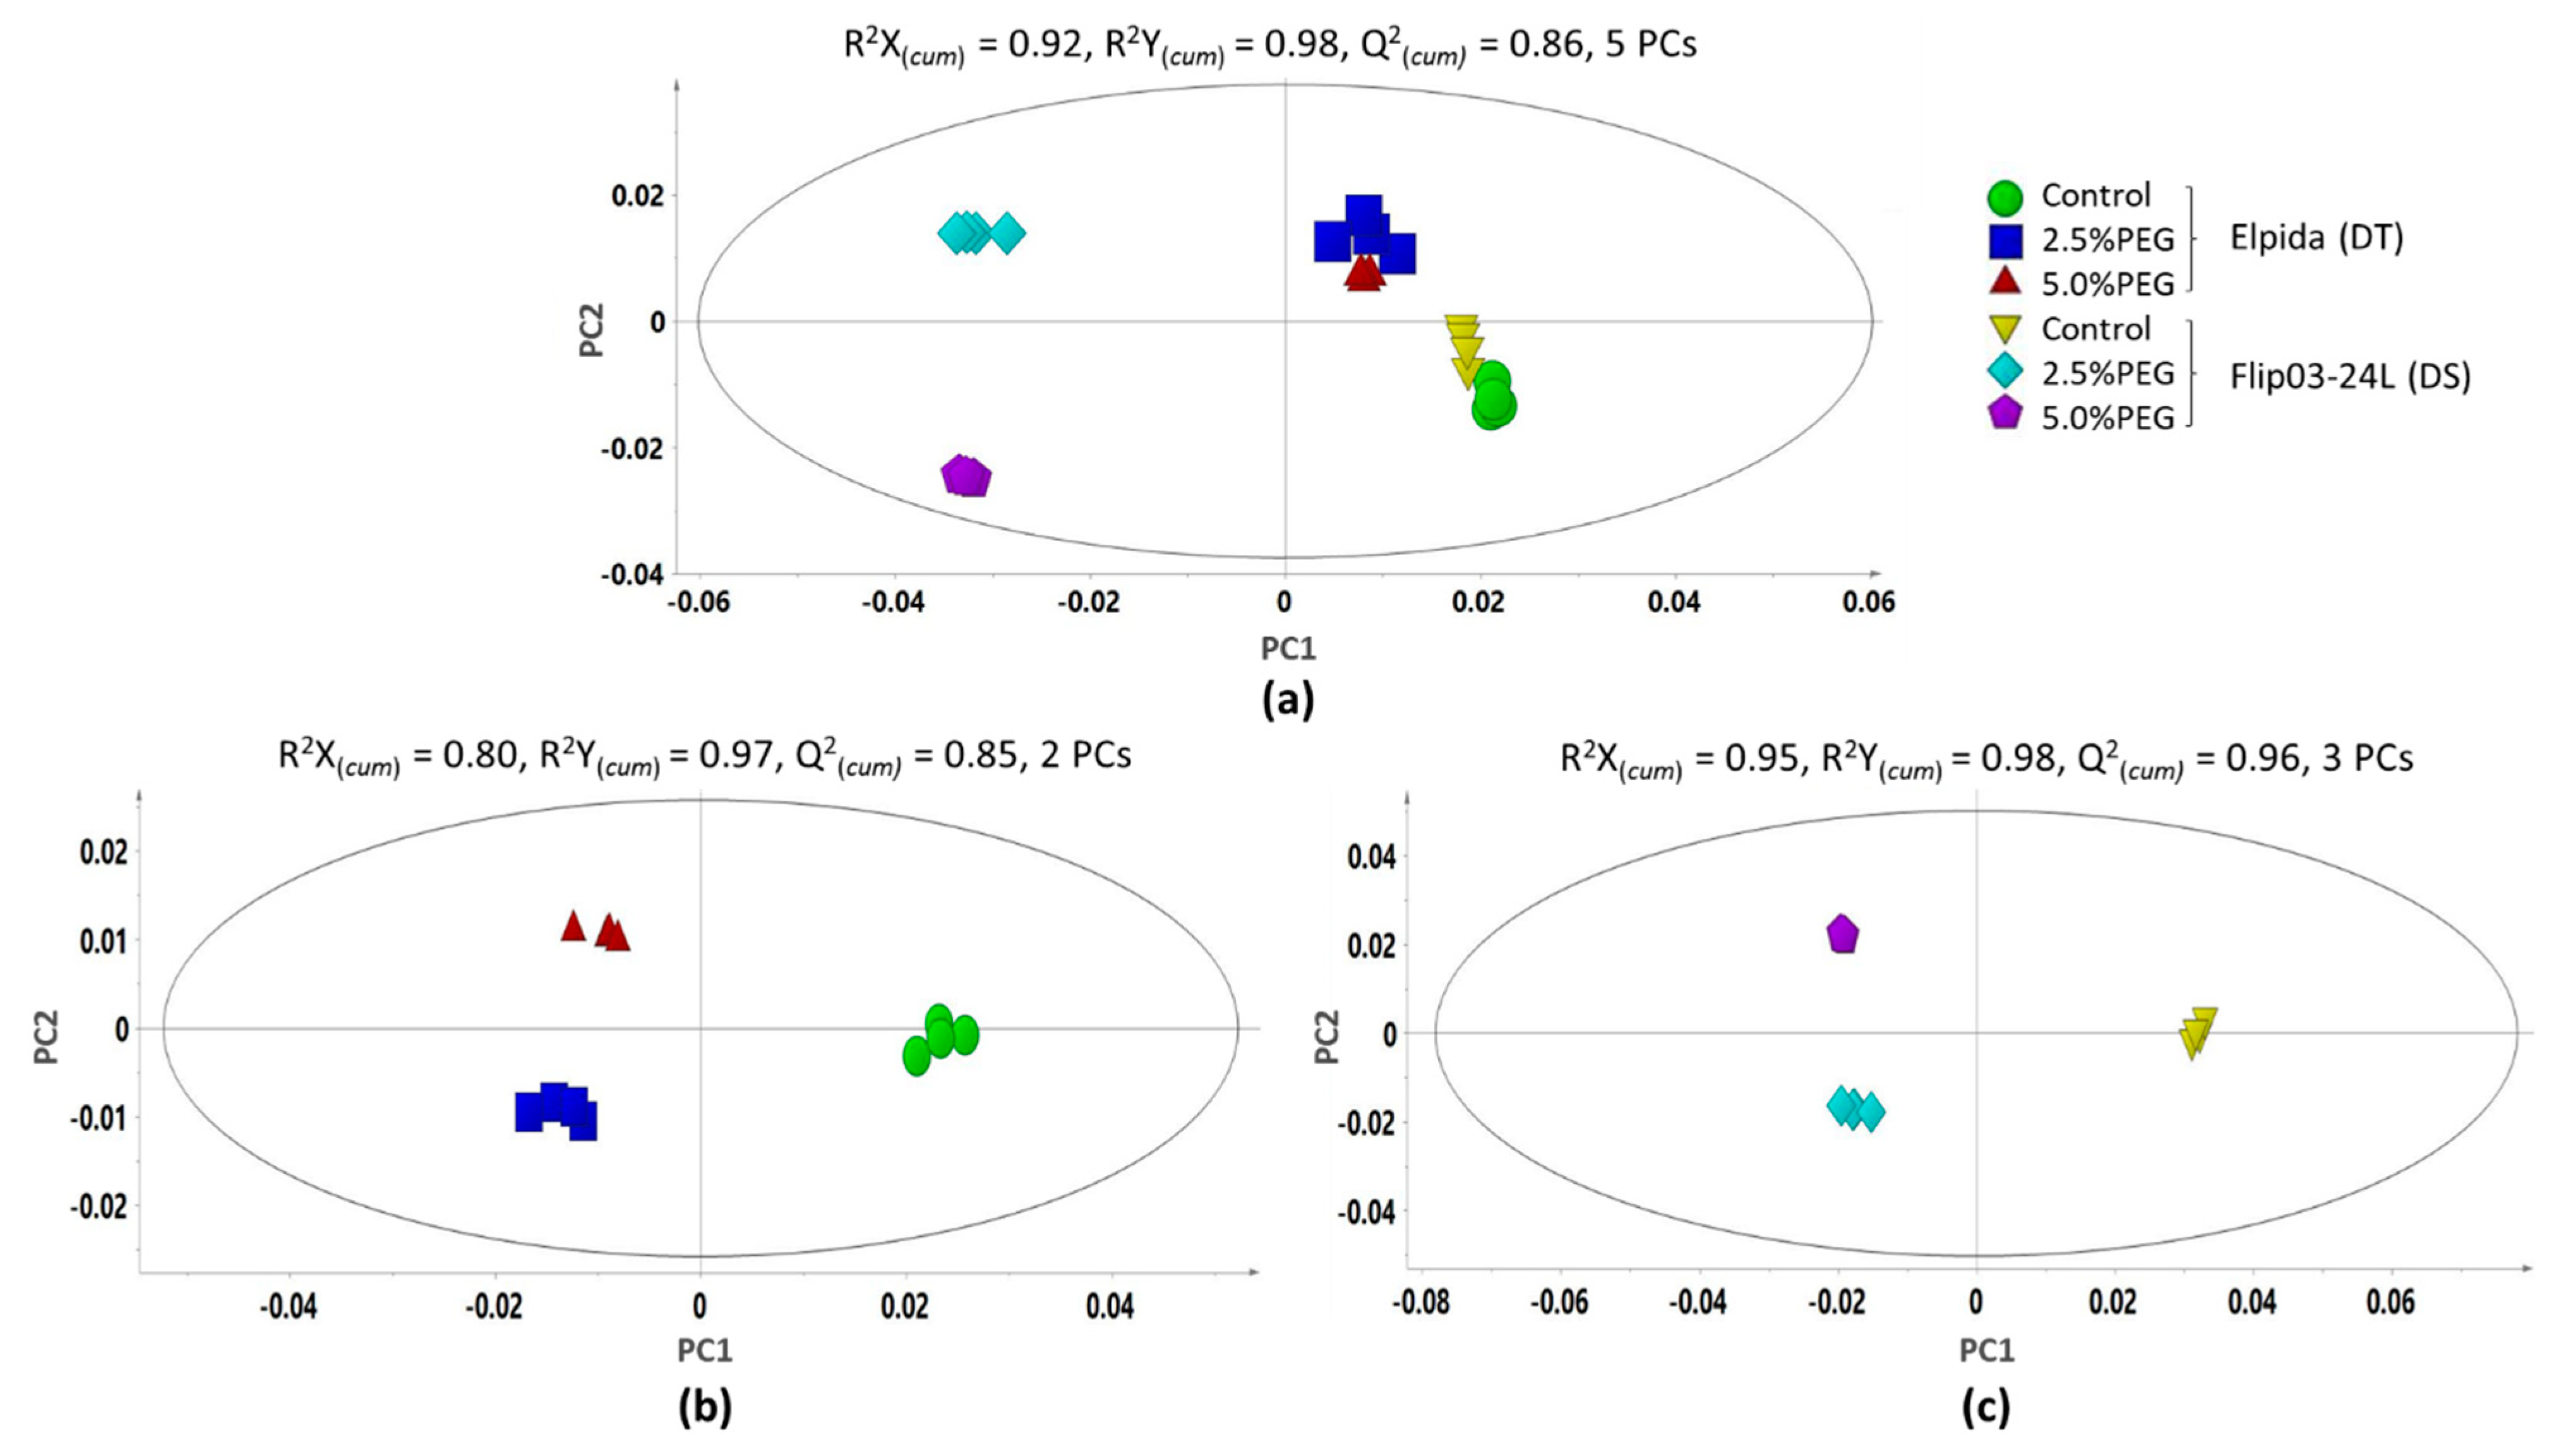
3.1. Comparative Metabolic Response of Drought-Tolerant and Drought-Sensitive Genotypes under Stress Conditions

Leaf metabolic profiles of two lentil genotypes, differing in terms of drought tolerance, were assessed under PEG-induced osmotic drought stress conditions at the early seedling stage. Changes in metabolite accumulation were expressed as a relative response ratio of controls versus stressed plants at the level of 2.5% and 5% PEG-6000. In total, the GC/EI/MS analyses yielded 150 metabolic features that were highly reproducible among biological replications (n = 4) per genotype-stress level combination. Representative GC/EI/MS total ion chromatograms (Lens culinaris Medik. (PMG-02-21)) can be found at the repository of the Pesticide Metabolomics Group of the Agricultural University of Athens (https://www.aua.gr/pesticide-metabolomicsgroup/Resources/default.html, accessed on 3 February 2021). Among them, 99 were identified, either absolutely or putatively, while 51 were not identified. The vast majority of the identified metabolites belonged to the group of carbohydrates (49%), carboxylic acids (18%), amino acids (17%), and fatty acids (5%), while a portion of them were classified in other chemical groups (11%), such as phosphoric acids, alcohols, glycerol lipids, heterocyclic compounds, quinones, and inorganic compounds (Figure 1).
Orthogonal partial least squares-discriminant analysis (OPLS-DA) revealed a strong discrimination between metabolic profiles of control and stressed plants (Figure 2a) but also between Elpida and Flip03-24L, thus suggesting the differential response of contrasting genotypes. As evidenced by the tight clustering among biological replications, the applied experimental protocols confirmed their suitability in terms of robustness and reproducibility. Furthermore, OPLS-DA score plots performed for each genotype separately revealed a strong discrimination among controls and plants subjected to 2.5% and 5% PEG, indicating the substantial effect of osmotic drought stress on lentil metabolism (Figure 2b,c).
Complementary to OPLS-DA, hierarchical cluster analysis (HCA) was performed to cluster samples into groups and estimate the cluster distances (Figure 3). In accordance with findings from OPLS-DA, the dendrogram revealed the separation between the analyzed samples both at the level of genotype and stress treatment. The plot divides samples into two groups: Group 1: Flip03-24L and Group 2: controls and Elpida, the latter being further divided into two subgroups. The similarity that was observed between the controls of Elpida and Flip03-24L was indicative of the significant effect of osmotic drought stress on lentil metabolism.

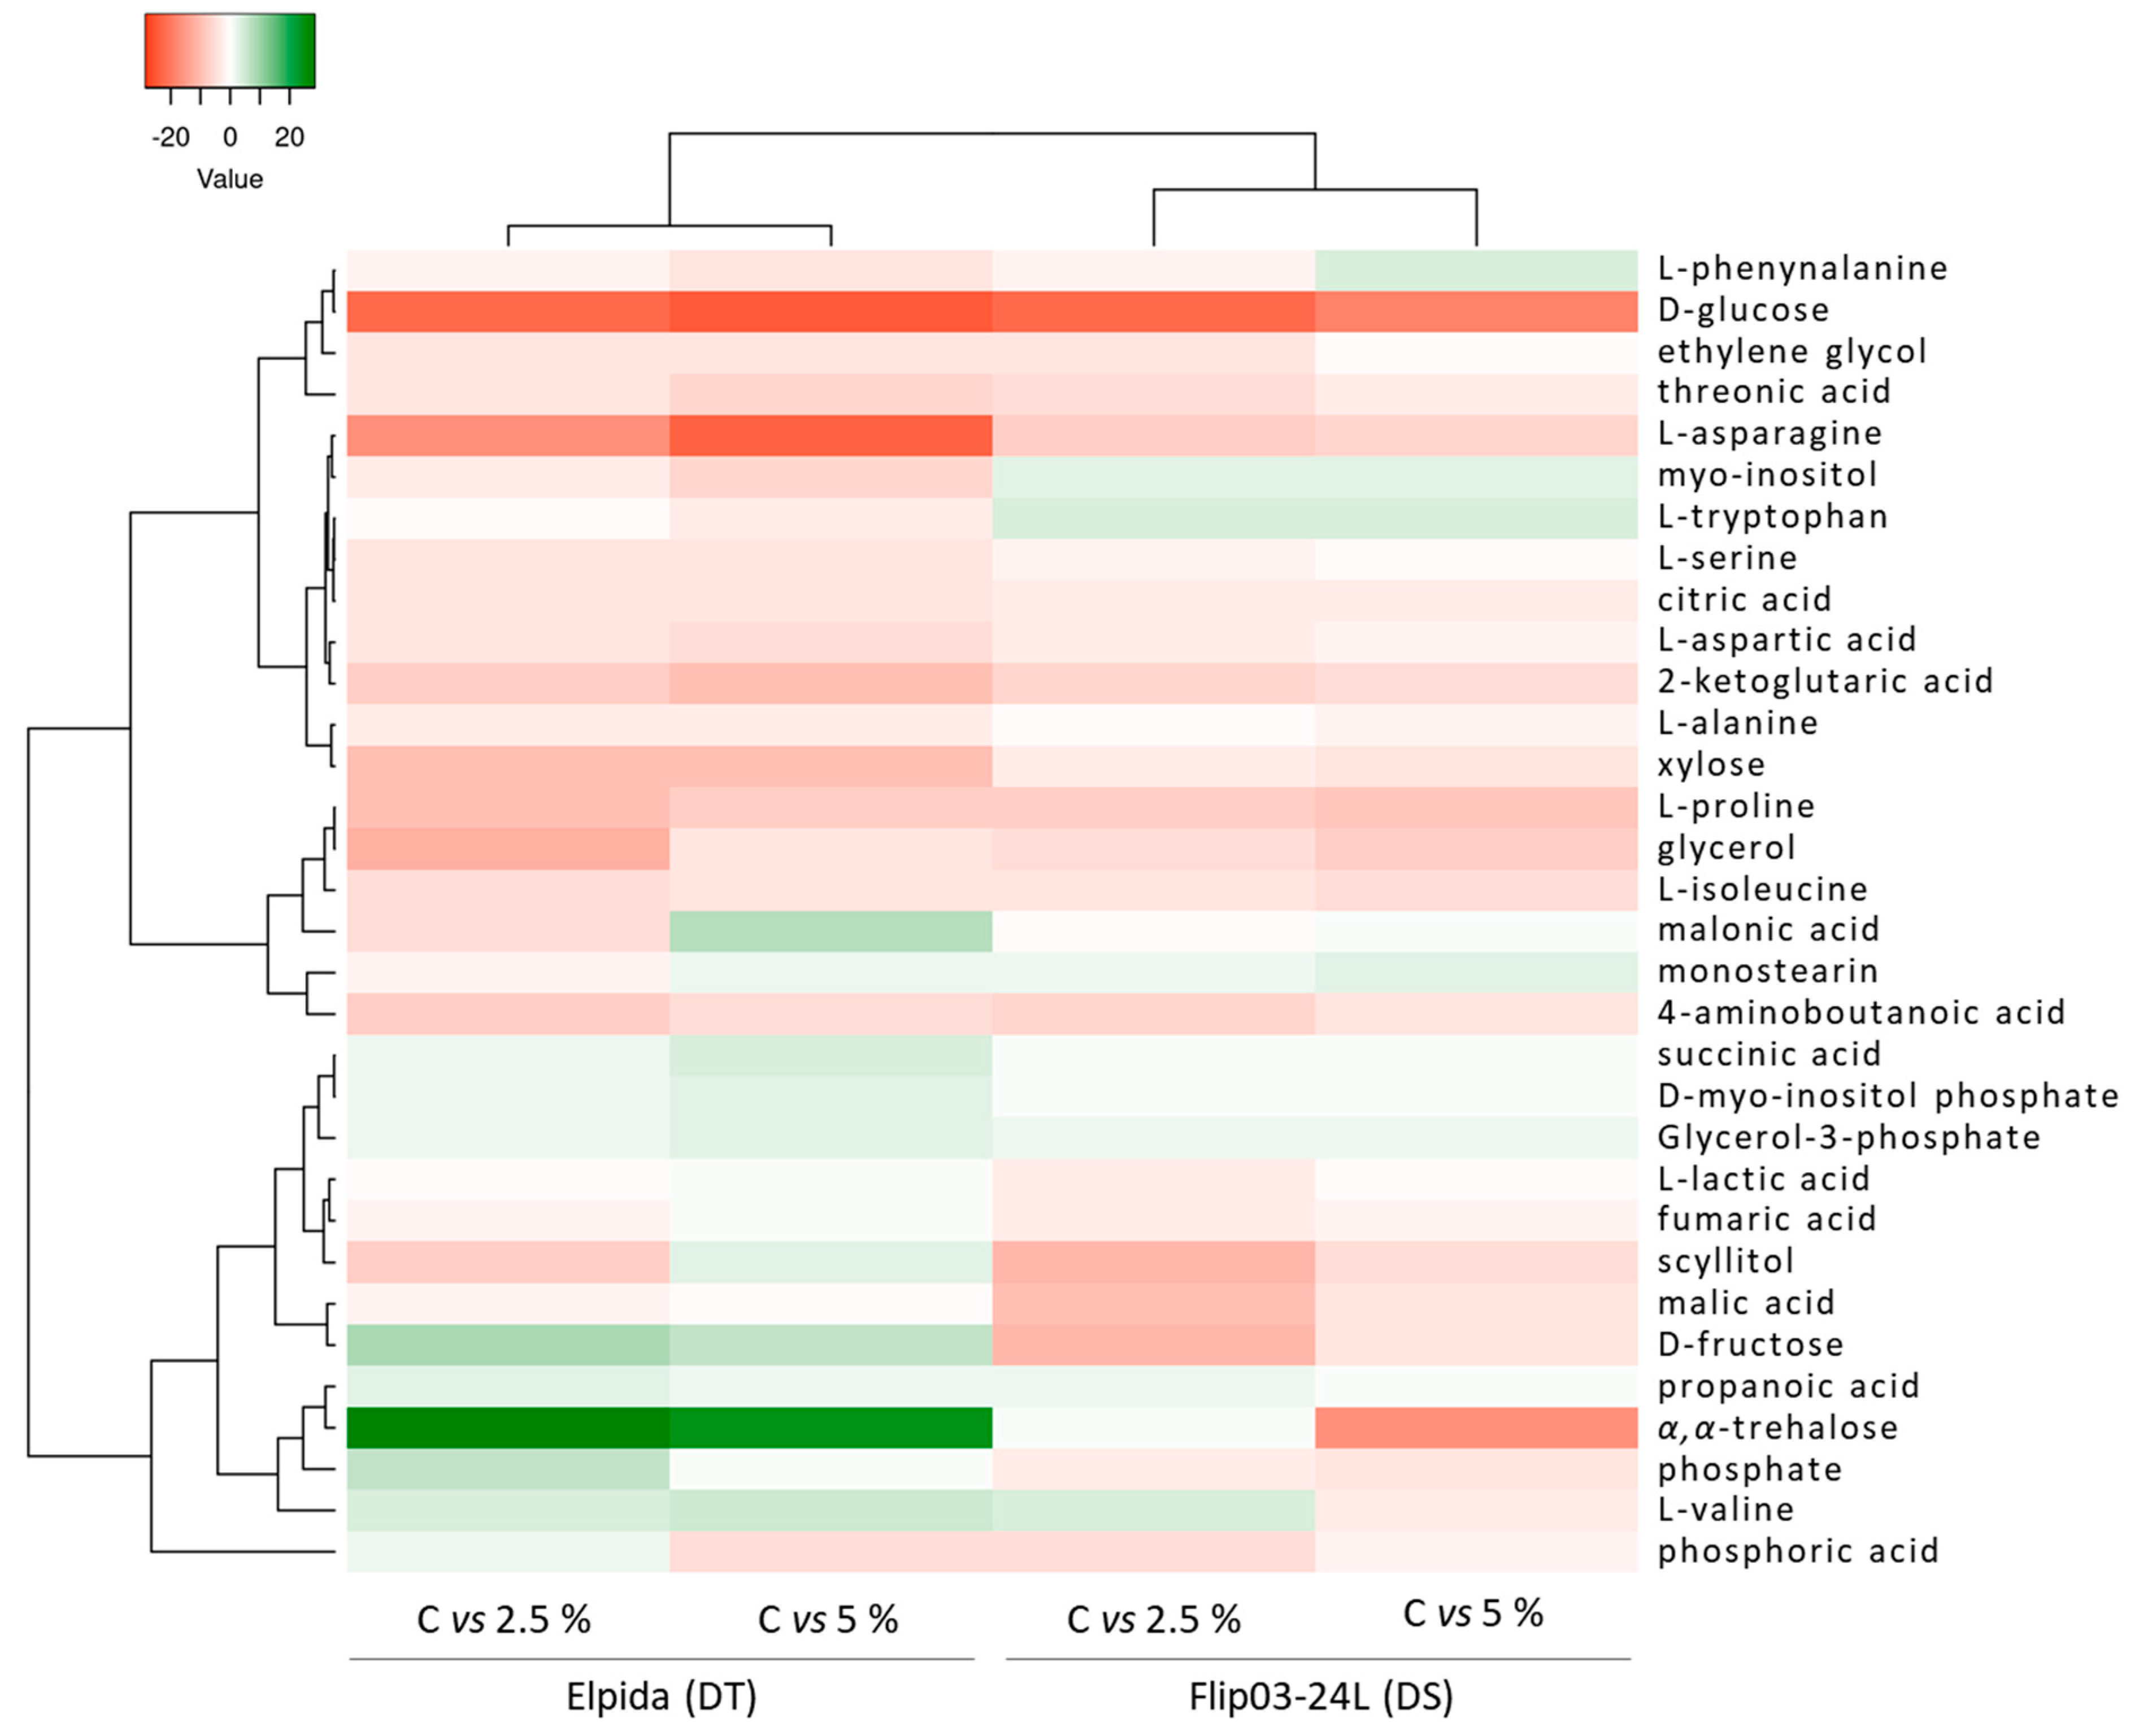
3.2. Overview of Fluctuations of Lentil Metabolome in Response to Osmotic Drought Stress

In response to osmotic drought stress, lentil’s metabolism was substantially affected in both tolerant and sensitive genotypes, as evidenced by the observed fluctuations in the recorded content in metabolites belonging to various chemical groups. The largest pool of compounds with altered metabolic content belong to the chemical groups of carbohydrates, carboxylic acids, and amino acids and are involved in carbohydrate and amino acid metabolism, biosynthesis of secondary metabolites, glycolysis, and the TCA cycle. Such findings are indicative of the fact that early seedlings directly respond to osmotic drought stress by mounting metabolic responses that involve compounds with divergent roles in primary and secondary metabolism. Most influential metabolites for the observed separation between the metabolomes of control and stressed plants of Elpida and Flip03-24L are listed in Table 1. The absolute values of metabolites reflect their contribution to the observed discrimination [36].
Below, lentil’s metabolic response to osmotic drought stress is described on the basis of the chemical groups of most influential metabolites (absolutely or putatively identified) for the observed separation between the metabolomes of control and stressed plants of Elpida and Flip03-24L.

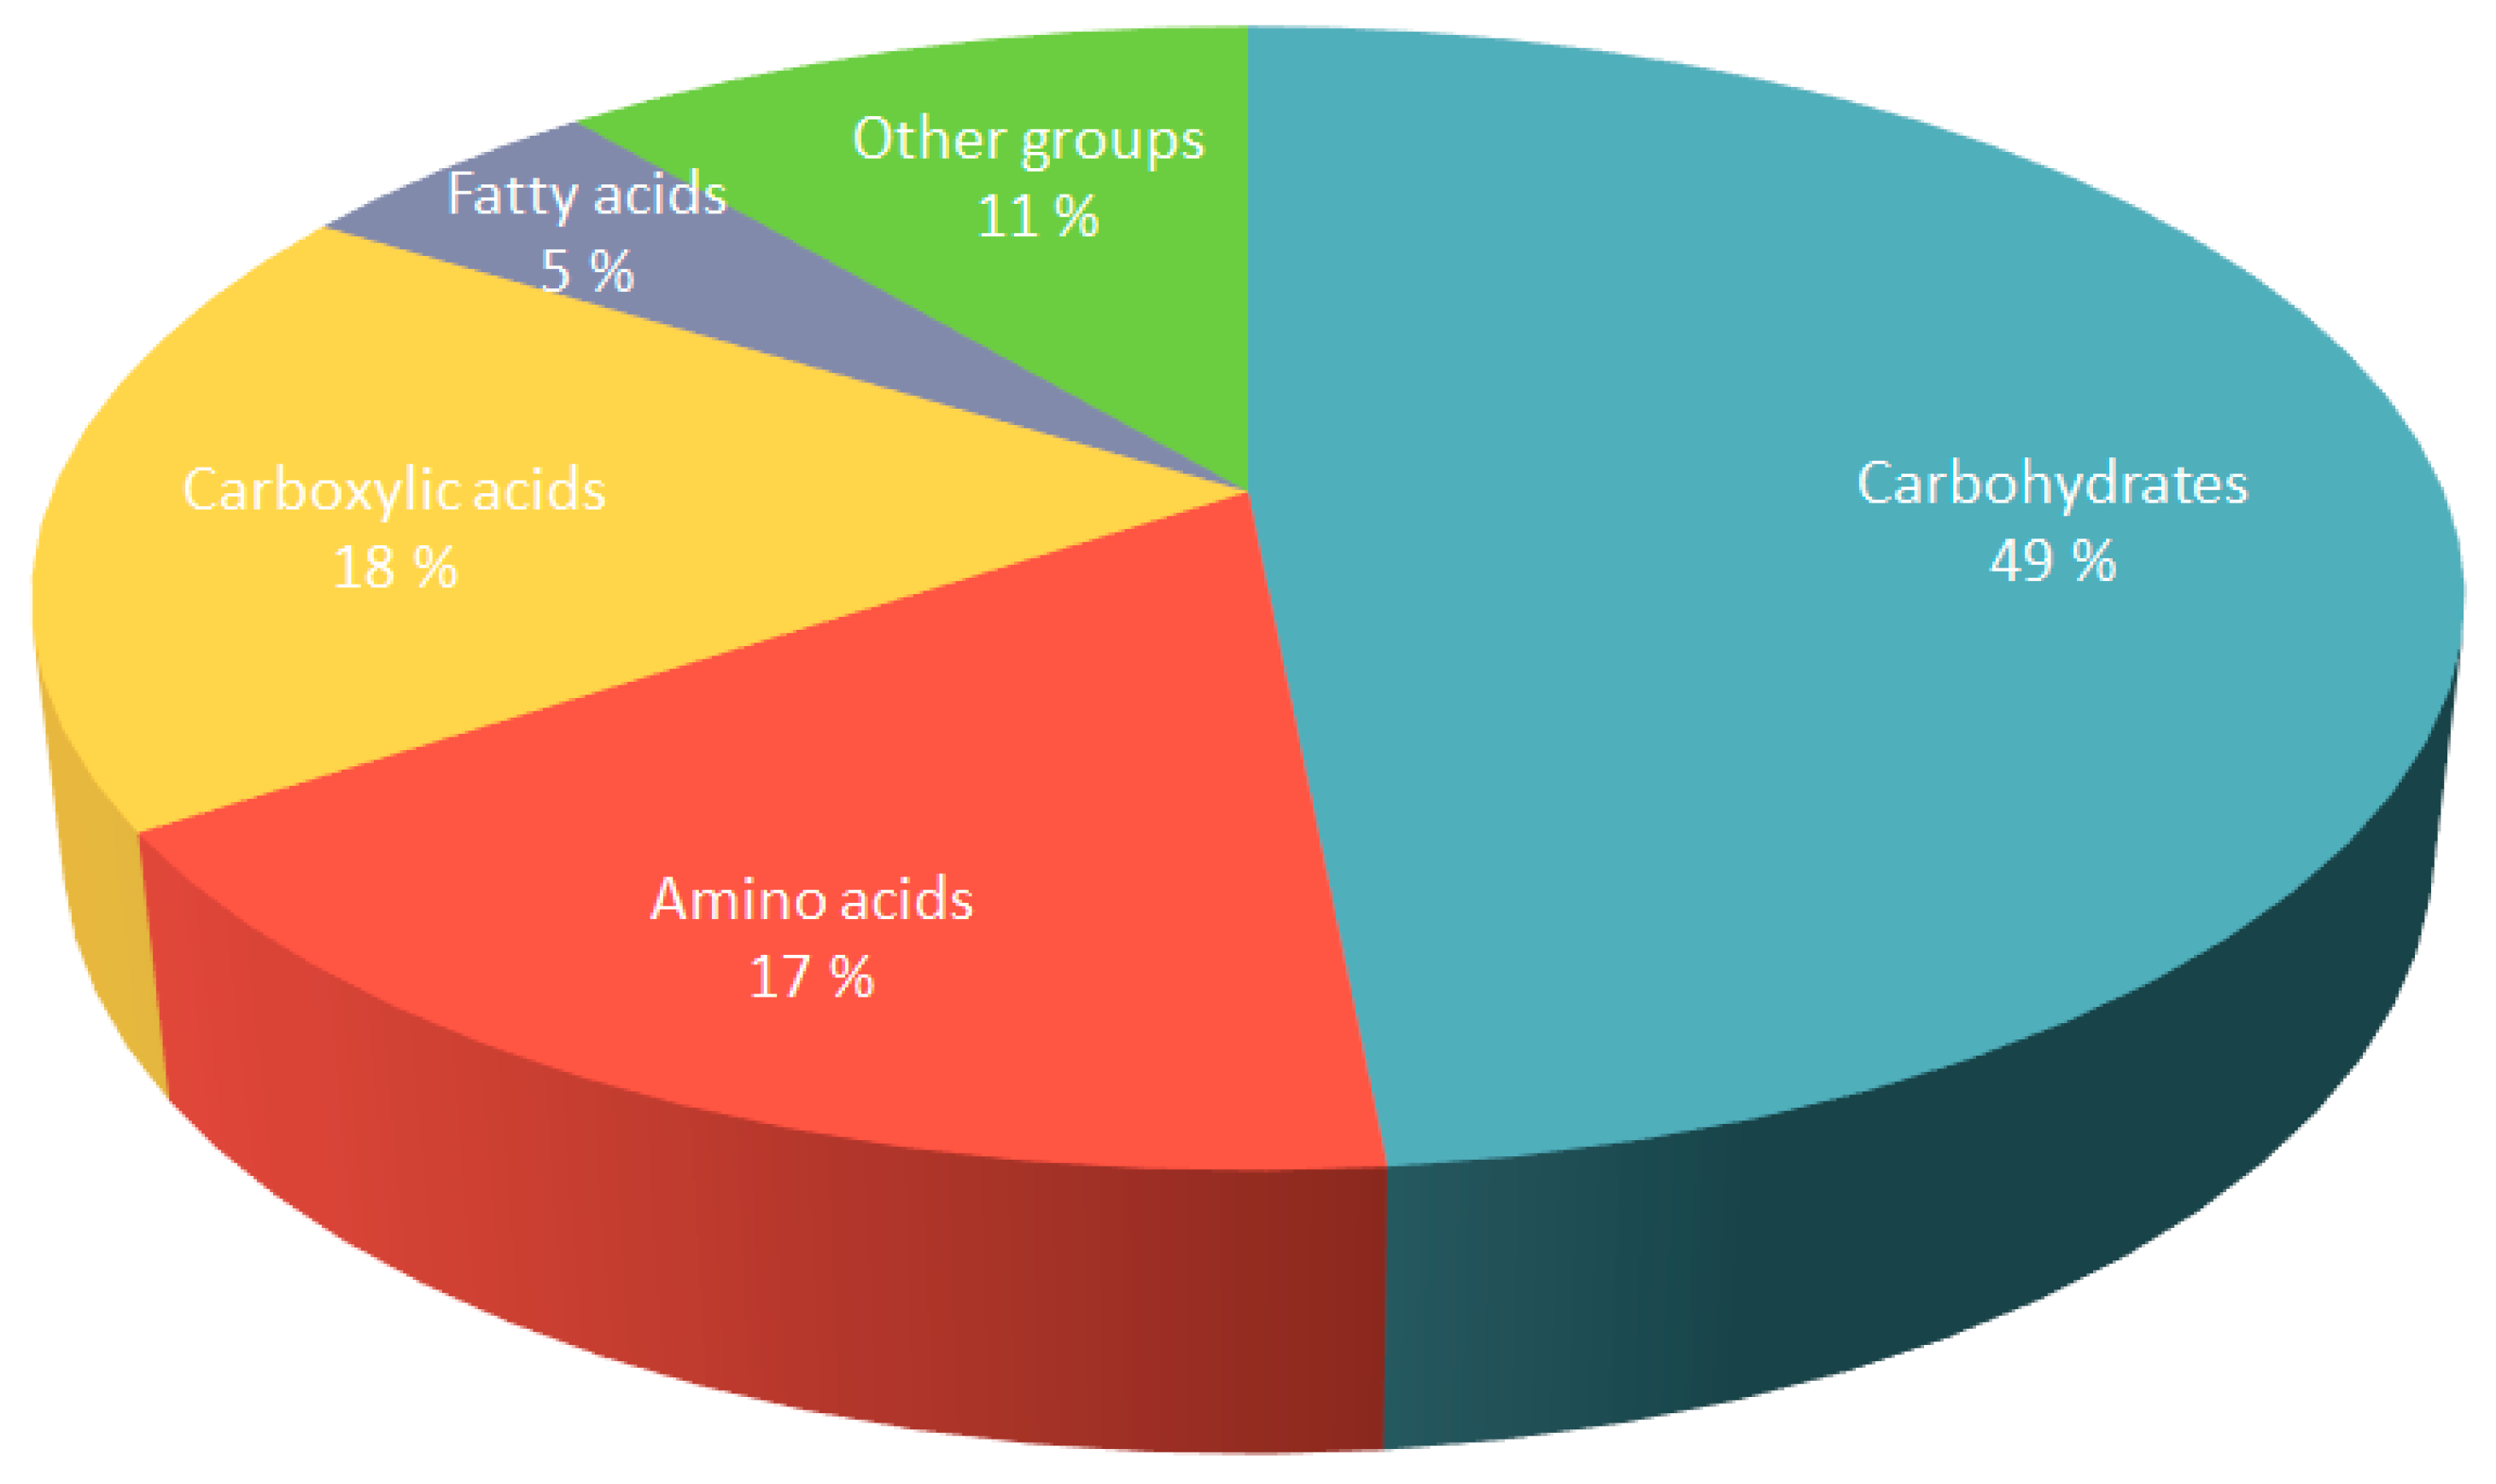
3.2.1. Carbohydrates

The metabolic response of carbohydrates was strongly affected by osmotic drought stress, as well as by the genotype. In total, 43 metabolic compounds were detected, of which 15 were identified, while substantial changes were noted in the accumulation of nine metabolites, namely D-fructose, D-glucose, α,α-trehalose, D-myo-inositol, phosphate, glycerol, glycerol-3-phosphate, myo-inositol, scyllitol, and xylose (Table 1). More importantly, D-fructose, α,α-trehalose, and D-myo-inositol showed opposite accumulation patterns in Elpida and Flip03-24L. In particular, the accumulation of D-fructose showed a substantial decrease in stressed plants of Elpida, while the respective plants of Flip03-24L showed an increasing accumulation trend which was inversely analogous to the stress level applied. Accordingly, the accumulation of α,α-trehalose was profoundly decreased in stressed plants of Elpida (up to ~28-fold), while Flip03-24L showed a drastic increase at 5% PEG (up to ~17-fold). Additionally, myo-inositol accumulated differently between the two genotypes, with Elpida showing an increased content, especially at 5% PEG, and Flip03-24L showing a decrease upon stress. A general cumulative metabolic response to drought was also observed in D-glucose, glycerol, and xylose. Finally, D-myo-inositol phosphate and glycerol-3-phosphate were decreased, with the decrease being significant only in 5% PEG-stressed plants of Elpida.

3.2.2. Carboxylic Acids

In the chemical group of carboxylic acids, 17 metabolic compounds were absolutely identified, while 8 were substantially altered upon stress: 2-ketoglutaric acid, citric acid, malonic acid, propanoic acid, succinic acid, malic acid, fumaric acid, and L-lactic acid (Table 1). A general increasing accumulation trend was observed in stressed plants, yet in several cases genotypes differed in their response to osmotic drought stress. As such, 2-ketoglutaric acid, citric acid, and malic acid were increased in both genotypes, with the former two being mostly increased in Elpida (up to ~10-fold) and the latter showing a drastic increase in Flip03-24L (up to ~10-fold). Accordingly, fumaric acid and L-lactic acid followed a general increasing trend upon stress, with the increase, however, being significant only in 2.5% PEG-stressed plants of Flip03-24L. Interestingly, the content of malonic acid differed at the stress level, especially in Elpida, which showed an increase at 2.5% PEG and a decrease at 5% PEG. In contrast to the abovementioned cumulative patterns, propanoic acid and succinic acid were decreased in stressed plants of both genotypes.

3.2.3. Amino Acids

The metabolic content of amino acids was drastically altered, exhibiting a general increasing accumulation pattern upon osmotic drought stress. In total, 17 compounds were detected, and substantial changes were noted in 10 metabolites, namely 4-aminobutanoic acid (GABA), L-alanine, L-asparagine, L-aspartic acid, L-isoleucine, L-phenylalanine, L-proline, L-serine, L-tryptophan, and L-valine (Table 1). Specifically, GABA, L-alanine, L-asparagine, L-aspartic acid, L-isoleucine, L-phenylalanine, L-proline, and L-serine were increased in stressed plants of both genotypes, with the exception of L-phenylalanine which showed a decrease in 5% PEG-stressed plants of Flip03-24L. It is worth noting, however, that L-asparagine showed a remarkable increase in Elpida (up to ~23-fold), which was analogous to the stress level applied. Accordingly, profoundly increased was the level of proline in Elpida (up to ~10-fold), with the increase being inversely proportional to the stress level. An exception to such a consistent increasing trend was noted for L-tryptophan and L-valine, which showed a differential response between genotypes. As such, L-tryptophan showed an increase and decrease in Elpida and Flip03-24L, respectively, with changes in both cases being analogous to the stress level. L-valine was decreased in stressed plants of both genotypes, with the exception of Flip03-24L which showed an increase that was not significant upon stress at 5% PEG.

3.2.4. Phosphoric Acids

In the group of phosphoric acids, drought-attributed fluctuations were noted in phosphate and phosphoric acid, whose content was genotype-specific as evidenced by the differential accumulation patterns of Elpida and Flip03-24L (Table 1). Specifically, phosphate was decreased in Elpida, especially at 2.5% PEG, while in Flip03-24L followed a trend of increasing accumulation as PEG increased. On the other hand, phosphoric acid increased at 2.5% and 5% PEG-stressed plants of Elpida and Flip03-24L, respectively.

3.2.5. Other Chemical Groups

In the group of fatty acids, five compounds were absolutely identified, of which only threonic acid was significantly altered due to osmotic drought stress. Specifically, threonic acid was increased in stressed plants of both genotypes, with Elpida and Flip03-24L showing a more profound increase at 5% and 2.5% PEG, respectively. Significantly increased content was recorded for ethylene glycol in stressed plants of both genotypes, with Flip03-24L showing its depletion at 5% PEG. Finally, monostearin, belonging to the group of glycerolipids, was decreased in stressed plants of both genotypes, with the exception of a slight increase that was noted in 2.5% PEG-stressed plants of Elpida (Table 1).
Metabolites whose relative concentration was substantially altered in response to drought were analyzed by hierarchical clustering with heat map in order to visualize the effects of drought in Elpida and Flip03-24L (Figure 4). The heatmap did not form major clusters with a consistent pattern of metabolite accumulation, yet it depicts the differential accumulation of specific metabolic compounds between contrasting genotypes. As such, myo-inositol, L-tryptophan, D-fructose, and α,α-trehalose showed opposing accumulation patterns in Elpida and Flip03-24L, thus suggesting their differential metabolic response to osmotic drought stress.

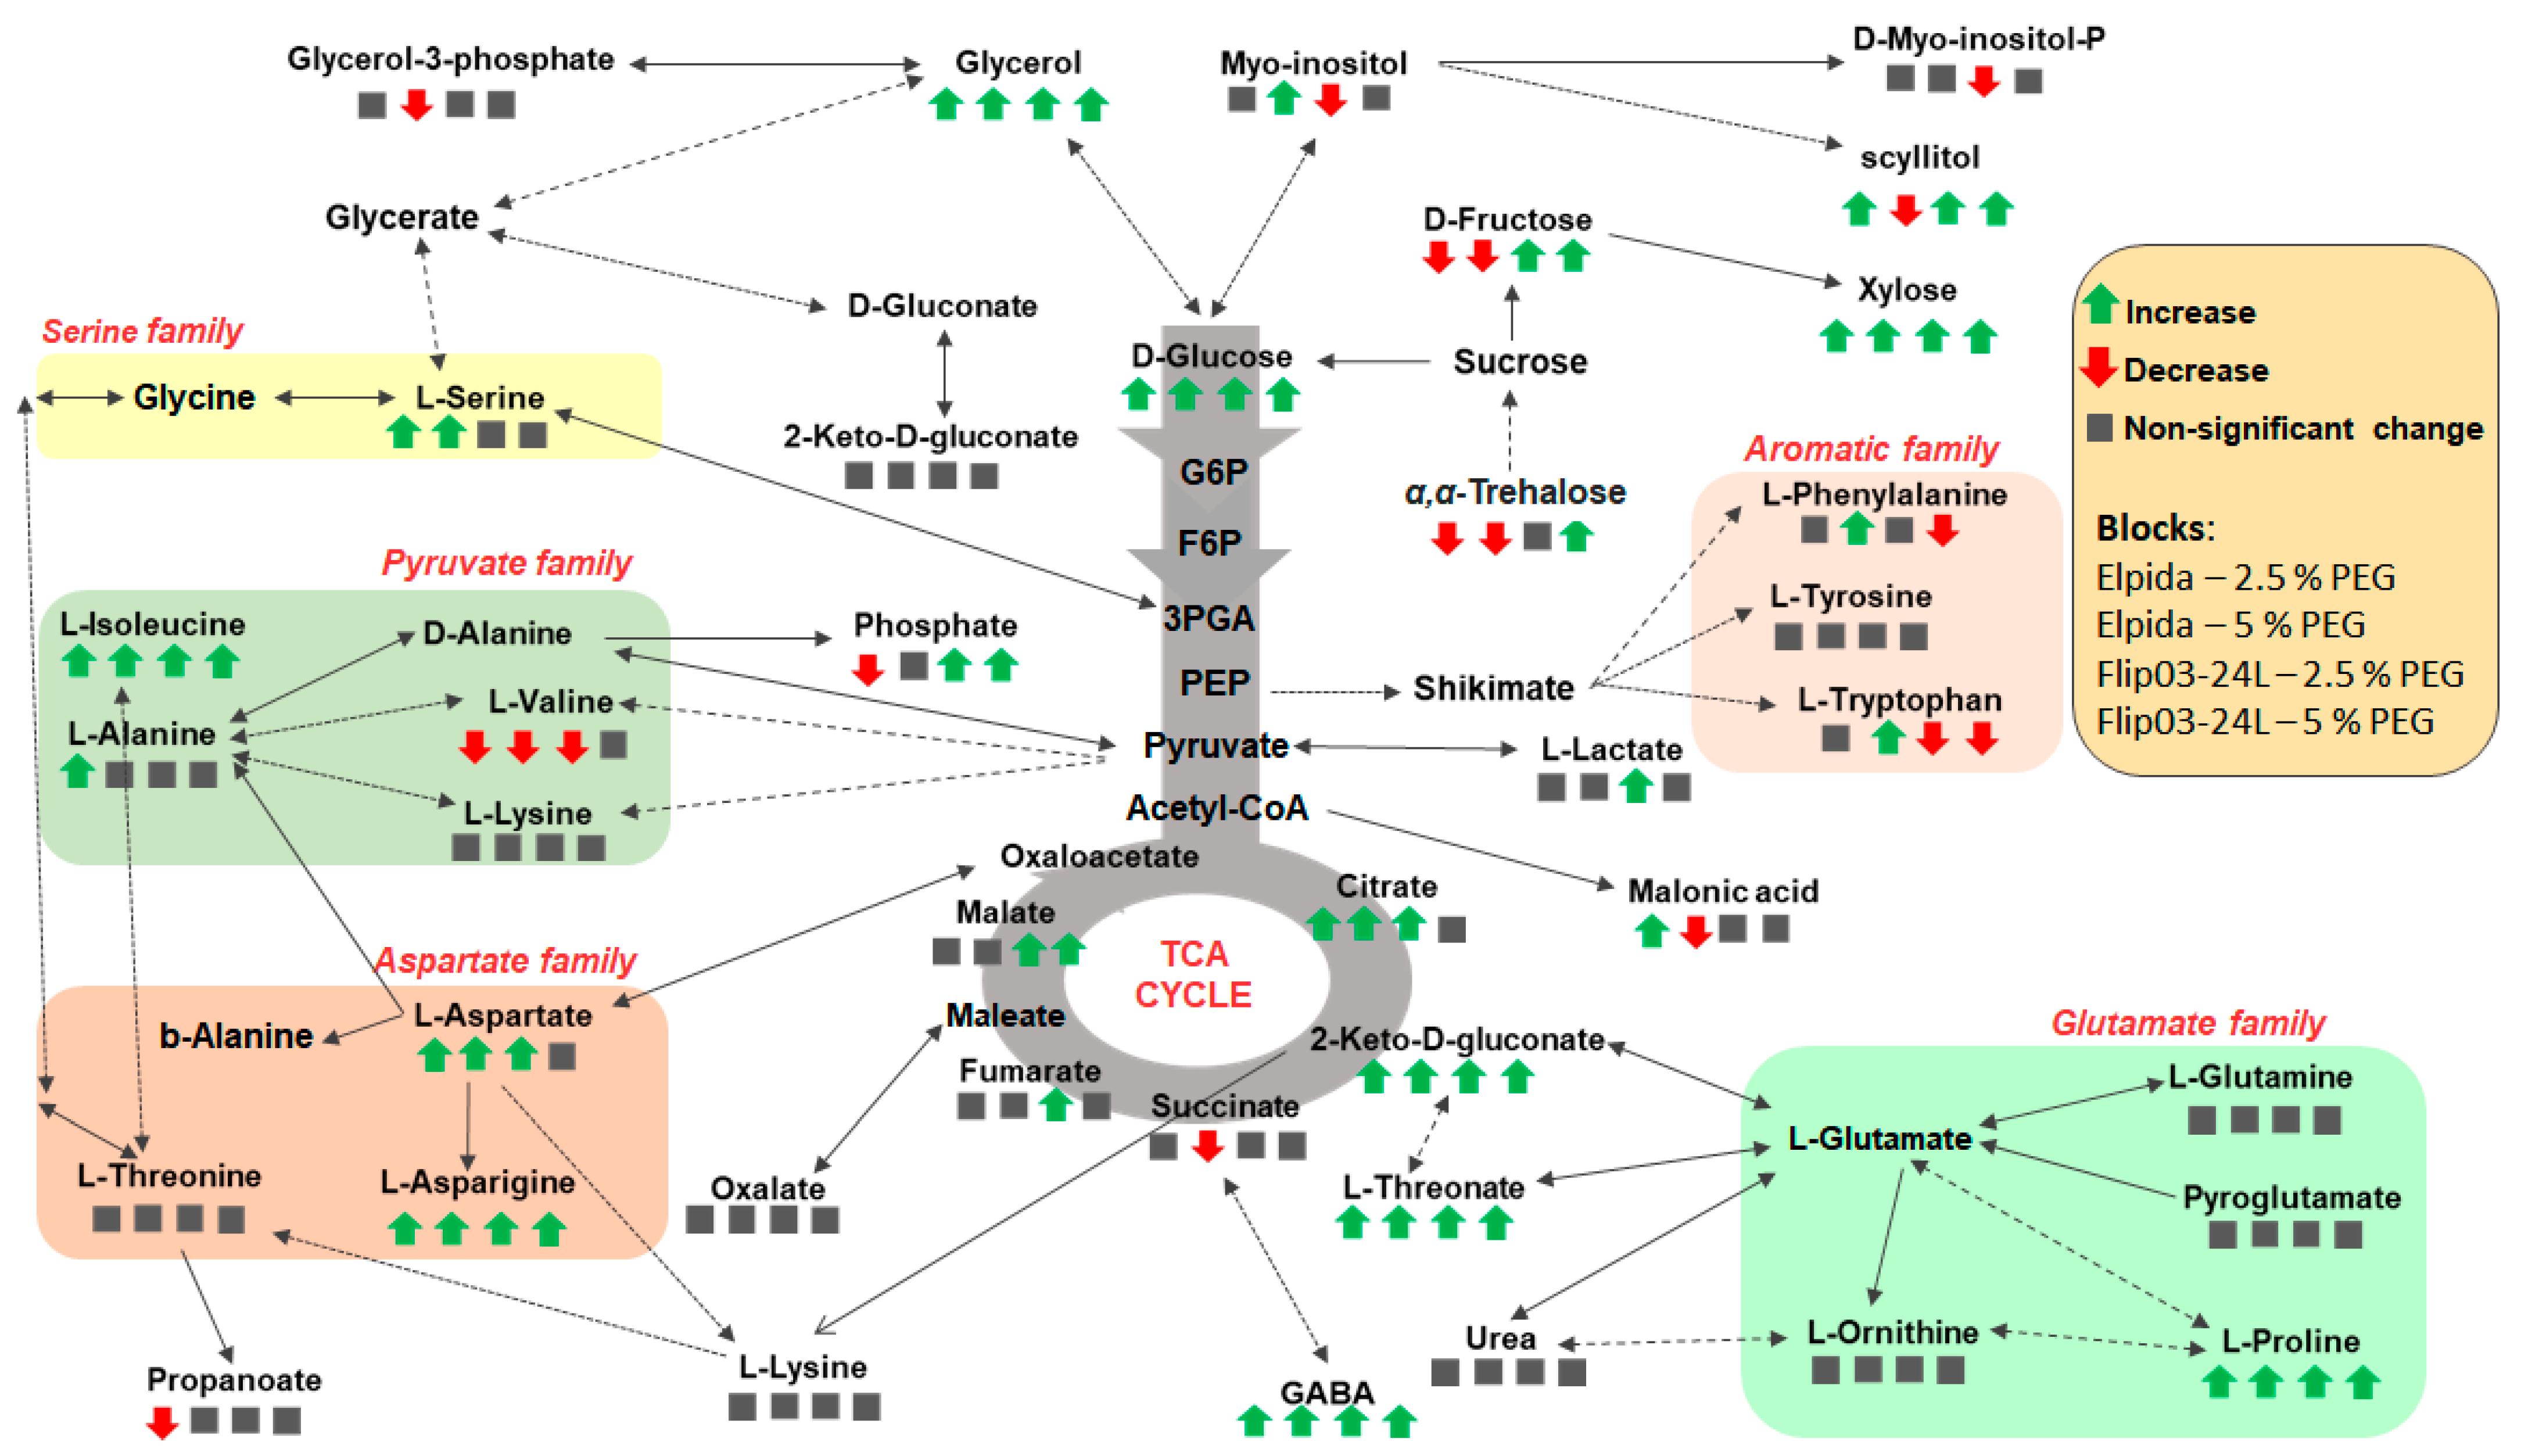
3.3. Regulatory Metabolic Networks in Osmotic Drought Stress Responses of Lentil

In order to gain a global overview of the fluctuation of lentil’s metabolome in response to osmotic drought stress, a metabolic network was constructed, highlighting perturbations in selected pathways and sub-networks involved in drought responses. Its construction was based on information retrieved from the KEGG database (Figure 5). Osmotic drought stress substantially altered the recorded lentil metabolomes, with the most important fluctuations observed for carbohydrates, carboxylic, and amino acids. The vast majority of metabolites were upregulated in the stressed plants of both Elpida and Flip03-24L, yet in several cases distinct accumulation patterns between genotypes were discovered. The majority of metabolites involved in the TCA cycle were either increased or not affected under stress conditions.

4. Discussion

4.1. Basic Aspects of Lentil Metabolism in Response to Osmotic Drought Stress

Over the past decade, “omics” technologies have facilitated the in-depth understanding of complex biological phenomena and provided further possibilities to upgrade the efficiency of relative breeding and biotechnological applications. Among “omics,” metabolomics play a central role as metabolites are more relevant to the plant phenotype compared to DNAs, RNAs, or proteins [39]. As such, metabolomics has dramatically contributed to our knowledge on the biological role of metabolic compounds, which reflect the endpoint of biological activities, as well as their implication in biochemical mechanisms regulating the stress adaptation responses [14,15,16,17,18]. The emphasis is placed on secondary metabolites which differ widely across plant species as they are burdened with the role of maintaining a delicate balance with the environment they live in [40,41]. In the context of exploiting the knowledge from stress metabolic responses as a foundation for improving abiotic stress tolerance, this study aimed to decipher the complex metabolic networks governing drought tolerance in lentil. Metabolic profiling in two lentil genotypes with contrasting ability to cope with drought stress was pursued as a means to gain insights into the key metabolic pathways and to pinpoint candidate metabolic biomarkers for screening drought tolerance at early growth stages. The contrasting drought response of Elpida and Flip03-24L was previously evidenced at the phenotypic level, with their differential performance particularly pertaining to the seedling growth potential [27].
From a general view, osmotic drought stress disturbed the metabolome of both DT and DS genotypes, as evidenced by the strong discrimination between metabolic profiles of control and stressed plants. However, genotypes differed in their response to stress, thus suggesting that mitigation to water deficit is subjected to distinct homeostasis mechanisms. Such findings substantiate that the stress levels applied were appropriate both in terms of revealing the drought-attributed fluctuations of lentil’s metabolome and capturing the genetic variation in the contrasting for tolerance genotypes.

4.2. Fluctuations in the Content of Carbohydrates in Stressed Plants

The overall fluctuation in the levels of carbohydrates in stressed plants is indicative of a general metabolic disturbance in response to osmotic drought stress. Carbohydrates serve as energy reserves to be exploited in periods of high energy demands or limited energy surpass [42] and are directly involved in the transcription, post-transcription, and post-translation processes while acting as signal molecules [43,44,45]. Under adverse environmental conditions, carbohydrates play a crucial role in plant adaptation [46,47], while under conditions of mild stress they restrict growth in favor of photosynthetic activity [48]. The observed decreased levels of α,α-trehalose in stressed plants of Elpida and its increased content in Flip03-24L probably reflects the high demands of the latter to cope with drought stress. Indeed, a similar cumulative pattern in DS genotypes has been previously reported in lentil upon drought and salinity stress and has been attributed to their greater need to protect the cellular structures from osmotic damage [21]. It is well known that under abiotic stress trehalose is upregulated, owing to its multi-level role ranging from osmoprotection to inhibition of photo-oxidation and stabilization of the cell membrane and proteins [34,49,50,51,52]. Particularly in response to drought stress, increased levels of α,α-trehalose have been reported in leaves of various plant species potentially due to its activity as a water trapping rather than a signal transduction molecule [53,54]. In this line, overexpression of TPP, which catalyzes the final step of trehalose synthesis, enhances abiotic stress tolerance in rice [55,56], while its exogenous application conferred drought resistance in Brassica plants [57]. Accordingly, the increased level of D-glucose in stressed plants of both genotypes further substantiates its essential role in adaptation and acclimatization mechanisms under environmental changes [58], acting as an osmoprotectant and contributor to maintenance of phospholipids in the liquid crystalline phase to prevent structural changes in soluble proteins [59]. It has been further evidenced that drought stress leads to distinct accumulation patterns of sugars, including sucrose, fructose, mannose, and tagatose, in DT and DS wheat germplasm, with tolerance being generally correlated with markedly increased levels [60].

4.3. Fluctuations in the Content of Carboxylic Acids in Stressed Plants

Carboxylic acids are versatile in their role in plant stress responses as they maintain cellular functions by providing energy for diverse biological activities and precursors involved in various biosynthetic pathways [61]. Organic acids balance the excess ions in cells and act as regulators of cellular pH and osmotic potential [62,63], while under drought stress conditions they enhance shoot tolerance by contributing to maintenance of cell integrity, ROS scavenging, and osmotic adjustment [64,65,66]. In agreement with previous reports on the accumulation of organic acids in response to drought stress probably due to perturbations of the TCA cycle [67,68,69], the majority of identified carboxylic acids increased in stressed plants of both cultivars. However, the metabolic profiles of Elpida and Flip03-24L differed notably, with the former showing a marked increase in 2-ketoglutaric acid, citric acid, and malonic acid and the latter exhibiting an increased content of malic acid. Although upregulation of these compounds has been associated with drought tolerance in various plant species [70,71,72], their relation to the drought response is not well elucidated due to the complexity of the metabolic pathways.

4.4. Fluctuations in the Content of Amino Acids in Stressed Plants

The increase in the amino acid pool of stressed plants of both genotypes is indicative of their important role in stress adaptation responses, although the extent of such an increase was significantly higher in Elpida than Flip03-24L. It is well established that exposure to abiotic stress is interlinked with increased content of specific amino acids which contribute to tolerance by acting as osmolytes, ROS scavengers, precursors for energy-associated metabolites as well as regulatory and signaling molecules [73,74,75,76,77,78,79,80]. The accumulation of amino acids under drought stress conditions is associated with the decreased water potential and has been reported in a plethora of plant species, including wheat [81], soybean [82], rice [83], maize [84], bean [85], and chickpea [86], as well as at various growth stages, thus highlighting their contribution to osmotic adjustment [87,88,89].
In this study, the pattern of stress-induced amino acid accumulation in Elpida substantiates that the corresponding metabolic pathways may regulate drought tolerance in lentil. The most profound increase was noted in the levels of proline and asparagine. Upregulation of proline under stress conditions, particularly drought, has been extensively reported and is attributed to its osmoprotective activity via mitigation of oxidative damages, protection of membrane integrity [90,91], radical scavenging [92], and signal transduction [93]. The observed upregulation of proline in leaves of Elpida and Flip03-24L is concomitant with the suggestion that its accumulation is tissue-dependent, with its increased content being mainly located in leaf tissues [94]. In this study, L-asparagine was pointed as a prominent metabolite in lentil leaves under drought stress, which showed a genotype-dependent accumulation in Elpida. Such findings agree with its hyper-accumulation in leaves of the DT genotype in wheat and sesame [67,95] but are opposed to its specific increase in the DS genotype in lentil [21]. L-asparagine plays an important role in the storage and transport of nitrogen, owing to its high C/N ratio in many plant species [96], while in legumes its increased accumulation relates to N2 stabilization [97] and up-take of nitrates under drought conditions [96,98,99]. It has been further suggested that drought stress-induced upregulation of asparagine in leaves allows its catabolism by asparaginase to supply nitrogen for the synthesis of other amino acids [100]. The metabolic response of amino acids to osmotic drought stress in our study, marked with an increased accumulation of asparagine and proline in Elpida, resembles the increased amino acid profiles of DT pearl millet genotype, further reinforcing the suggestion that at early stress such amino acids contribute to drought tolerance [101]. Finally, GABA showed a cumulative trend in stressed plants of both genotypes, which is consistent with its proposed involvement in the chain of events from perception of abiotic stress and signal transduction to timely adaptation responses [102,103]. Although several studies demonstrated a rapid upregulation of GABA in the occurrence of environmental stimuli, its precise role in stress mitigation still remains not well elucidated [104].

4.5. Genotypic-Dependent Metabolic Response to Osmotic Drought Stress: Opportunities for Biomarkers in Selection

Comparative leaf metabolite profiling of contrasting genotypes in relation to drought tolerance is viewed as a well-suited model to unravel the metabolic networks governing drought tolerance [105,106] and further provides possibilities of exploiting such knowledge as a foundation for the design of biomarkers to be employed in metabolomics-assisted breeding approaches [107,108,109]. Collectively, our analysis revealed a clear discrimination between stressed and non-stressed plants as well as a genotype-specific adaptive metabolic response. Such findings are further substantiated by recent reports related to the fact that transcriptional regulation, signal transduction, and secondary metabolism under drought stress exhibit strong genotypic dependency in lentil seedlings [22,23]. In this context, it was evidenced that upregulation of genes involved in TCA cycle, oxidation-reduction process, organ senescence, and reduction of stomatal conductance is more profound in DT genotypes, while genes involved in transcription binding, GABA synthesis, synthesis of cell wall protein and negative regulation of absicisic acid show a more drastic downregulation in DT than DS genotypes [22].
In our study, the genotype specificity was notably reflected by the opposite accumulation trend of D-fructose, α,α-trehalose, myo-inositol, and L-tryptophan. Interestingly, D-fructose and α,α-trehalose were substantially decreased in stressed plants of Elpida and exhibited an opposite accumulation pattern in Flip03-24L. Although these findings are opposed to the widely accepted role of soluble sugars as osmoregulation molecules, by contributing to regulation of water potential, ROS scavenging, protein stabilization, and cell membrane protection [89], they are in line with the genotype-dependent accumulation of sugars in sorghum, with the DT and DS showing high content constitutively and stress-induced accumulation, respectively [110]. Accordingly, the findings that upregulation of α,α-trehalose in DS genotypes compensates for their increased need for protection against cell osmotic damage structures are relative [21], while upregulation of fructose acts in favor of maintenance of photosynthesis and effective water management during drought [49,71,111].
The genotype-specific accumulation of myo-inositol, whose content increased in Elpida and decreased in Flip03-24L, is well fitted to the general upregulation of myo-inositol in DT genotypes, as well as its drastic decrease in DS soybean genotype subjected to drought stress at early growth stages [82]. Myo-inositol, concomitant with other cyclitols, acts as a multifunctional compound, thus playing a crucial role in signal transduction, stress response, cell wall formation, regulation of tissue growth, osmotic adjustment, and membrane transport [112,113,114,115]. As such, it has been evidenced that exogenous application as well as endogenous upregulation of myo-inositol, through ectopic expression of MIPS (myo-inositol phosphate synthase), provides amenable routes to improved stress adaptation responses [116,117]. Finally, the differential response between DT and DS genotypes was reflected in L-tryptophan, which showed an increasing and decreasing accumulation trend in Elpida and Flip03-24L, respectively. These observations are in line with its increased content in DS lentil genotype [21], yet they are opposed to the general hyper-accumulation trend of amino acids as a conserved biochemical process governing plant stress responses [77]; the latter being partly attributed to inhibition of protein synthesis and/or enhanced protein degradation as a result of stress-induced restriction of plant growth. Despite the genotype-specific stress response of certain compounds, the regulation of osmoprotectants, including amino acids and soluble sugars, is largely dependent on growth stage. In this context, the findings that soybean seedlings subjected to drought stress did not accumulate soluble sugars in the leaves of both DT and DS genotypes are relative, indicating that their osmoprotective role may not be active at early growth stages [82].
The challenging goal of practically exploiting the knowledge from stress metabolic responses in tolerance improvement routinely relies on identifying the pool of metabolites that are subjected to environmental fluctuations and, in particular, those that are associated with tolerance responses. In this context, it has been previously suggested that ornithine and asparagine may be employed as markers of drought stress in lentil [21]. In our study, the genotype-dependent accumulation of D-fructose, α,α-trehalose, myo-inositol, and L-tryptophan provides the ground for their exploitation as candidate biomarkers for incorporation into relative breeding and biotechnological approaches.

5. Conclusions

The analysis revealed an overall metabolic disturbance in lentil’s metabolome in response to osmotic drought stress and further provided the possibility to pinpoint the pool of most influential metabolites, as well as the pathways and metabolic networks involved in drought responses. The metabolic response of contrasting genotypes was marked by a genotype-specific accumulation of D-fructose, α,α-trehalose, myo-inositol, and L-tryptophan, thus providing evidence for their crucial role in drought response and their potential use as biomarkers for effectively selecting drought-tolerant germplasm. The role of metabolomics in lentil crop improvement will be progressively strengthened as the robustness of biomarkers, as they become available, is validated. Such a prospect is anticipated to significantly accelerate and upgrade the efficacy of selection procedures for drought tolerance, and more importantly, to enable early selection of tolerant germplasm to be directly released for cultivation or integrated into breeding programs as valuable germplasm material.

Author Contributions

Conceptualization, K.A.A. and O.I.P.; methodology, K.A.A. and O.I.P.; software, K.A.A. and O.I.P.; validation, C.F., K.A.A. and O.I.P.; formal analysis, C.F., I.F.K., K.A.A. and O.I.P.; investigation, C.F. and I.F.K.; resources, K.A.A. and O.I.P.; data curation, C.F., I.F.K., K.A.A. and O.I.P.; writing—original draft preparation, C.F. and O.I.P.; writing—review and editing, I.F.K., K.A.A. and O.I.P.; visualization, C.F., K.A.A. and O.I.P.; resources, K.A.A. and O.I.P.; supervision, K.A.A. and O.I.P.; project administration, O.I.P.; All authors have read and agreed to the published version of the manuscript.

Funding

This research received no external funding.

Institutional Review Board Statement

Not applicable.

Informed Consent Statement

Not applicable.

Data Availability Statement

Representative GC/EI/MS total ion chromatograms (Lens culinaris Medik. (PMG-02-21)) can be found at the repository of the Pesticide Metabolomics Group of the Agricultural University of Athens (https://www.aua.gr/pesticide-metabolomicsgroup/Resources/default.html, accessed on 3 February 2020).

Acknowledgments

The first author would like to acknowledge the Foundation of Research, Innovation and Excellence (DEKA), University of Thessaly, as well as Alexander S. Onassis Public Benefit Foundation for funding her studies, in the framework of which this research project was partly conducted. The authors wish to acknowledge D. Vlachostergios for providing the genetic material used in this study.

Conflicts of Interest

The authors declare no conflict of interest.

References

  1. Chaves, M.M.; Oliveira, M. Mechanisms underlying plant resilience to water deficits: Prospects for water-saving agriculture. J. Exp. Bot. 2004, 55, 2365–2384. [Google Scholar] [CrossRef] [Green Version]
  2. Chaves, M.M.; Pereira, J.S.; Maroco, J.; Rodrigues, M.L.; Ricardo, C.P.; Osório, M.L.; Carvalho, I.; Faria, T.; Pinheiro, C. How plants cope with water stress in the field? Photosynthesis and growth. Ann. Bot. 2002, 89, 907–916. [Google Scholar] [CrossRef] [Green Version]
  3. Chaves, M.M.; Maroco, J.P.; Pereira, J.S. Understanding plant responses to drought–From genes to the whole plant. Funct. Plant Biol. 2003, 30, 239–264. [Google Scholar] [CrossRef]
  4. Bray, E.A. Genes commonly regulated by water-deficit stress in Arabidopsis thaliana. J. Exp. Bot. 2004, 55, 2331–2341. [Google Scholar] [CrossRef] [PubMed]
  5. Slama, I.; Abdelly, C.; Bouchereau, A.; Flowers, T.; Savoure, A. Diversity, distribution and roles of osmoprotective compounds accumulated in halophytes under abiotic stress. Ann. Bot. 2015, 115, 433–447. [Google Scholar] [CrossRef] [Green Version]
  6. Mata, A.T.; Jorge, T.F.; Pires, M.V.; António, C. Drought stress tolerance in plants: Insights from metabolomics. In Drought Stress Tolerance in Plants; Hossain, M.A., Wani, S.H., Bhattacharjee, S., Burritt, D.J., Tran, L.S., Eds.; Springer: Cham, Switzerland, 2016; Volume 2, pp. 187–216. [Google Scholar]
  7. Saxena, M.C. The challenge of developing biotic and abiotic stress resistance in cool-season food legumes. In Breeding for Stress Tolerance in Cool-Season Food Legumes; Singh, K.B., Saxena, M.C., Eds.; Wiley: Chichester, UK; Oxford, UK, 1993; pp. 3–14. [Google Scholar]
  8. Johansen, C.; Baldev, B.; Brouwer, J.B.; Erskine, W.; Jermyn, W.A.; Li-Juan, L.; Malik, B.A.; Miah, A.A.; Silim, S.N. Biotic and abiotic stresses constraining productivity of cool season food legumes in Asia, Africa and Oceania. In Expanding the Production and Use of Cool Season Food Legumes; Muehlbauer, F.J., Kaiser, W.J., Eds.; Kluwer Academic Publishers: Dordrecht, The Netherlands, 1994; pp. 175–194. [Google Scholar]
  9. Allahmoradi, P.; Mansourifar, C.; Saiedi, M.; Jalali Honarmand, S. Effect of different water deficiency levels on some antioxidants at different growth stages of lentil (Lens culinaris L.). Adv. Environ. Biol. 2013, 7, 535–543. [Google Scholar]
  10. Babayeva, S.; Akparov, Z.; Damania, A.; Izzatullayeva, V.; Aslanova, G.; Abbasov, M. Genetic diversity for drought tolerance in lentils from Central Asia and the Caucasus: CACLentil. Albanian J. Agric. Sci. 2014, 13, 1–8. [Google Scholar]
  11. Siddique, K.H.M.; Loss, S.P.; Regan, K.L.; Jettner, R.L. Adaptation and seed yield of cool season grain legumes in Mediterranean environments of south-western Australia. Austr. J. Agric. Res. 1999, 50, 375–387. [Google Scholar] [CrossRef]
  12. Bhandari, K.; Siddique, K.H.; Turner, N.C.; Kaur, J.; Singh, S.; Agrawal, S.K.; Nayyar, H. Heat stress at reproductive stage disrupts leaf carbohydrate metabolism, impairs reproductive function, and severely reduces seed yield in lentil. J. Crop. Improv. 2016, 30, 118–151. [Google Scholar] [CrossRef]
  13. Shrestha, R.; Turner, N.C.; Siddique, K.H.; Turner, D.W.; Speijers, J. A water deficit during pod development in lentils reduces flower and pod numbers but not seed size. Aust. J. Agric. Res. 2006, 57, 427–438. [Google Scholar] [CrossRef]
  14. Fiehn, O.; Kopka, J.; Dörmann, P.; Trethewey, R.N.; Willmitzer, L. Metabolite profiling for plant functional genomics. Nat. Biotechnol. 2000, 18, 1157–1161. [Google Scholar] [CrossRef]
  15. Fiehn, O. Combining genomics, metabolome analysis and biochemical modelling to understand metabolic networks. Comp. Funct. Genom. 2001, 2, 155–168. [Google Scholar] [CrossRef] [Green Version]
  16. Fiehn, O. Metabolomics–the link between genotypes and phenotypes. Plant Mol. Biol. 2002, 48, 155–171. [Google Scholar] [CrossRef]
  17. Bino, R.J.; Hall, R.D.; Fiehn, O.; Kopka, J.; Saito, K.; Draper, J.; Nikolaus, B.J.; Mendes, P.; Roessner-Tunali, U.; Beale, M.H.; et al. Potential of metabolomics as a functional genomics tool. Trends Plant Sci. 2004, 9, 418–425. [Google Scholar] [CrossRef] [PubMed]
  18. Jorge, T.F.; António, C. Plant Metabolomics in a Changing world: Metabolite responses to abiotic stress combinations. In Plant, Abiotic Stress and Responses to Climate Change; Andjelkovic, V., Ed.; IntechOpen Limited: London, UK, 2017. [Google Scholar] [CrossRef] [Green Version]
  19. Urano, K.; Kurihara, Y.; Seki, M.; Shinozaki, K. ‘Omics’ analyses of regulatory networks in plant abiotic stress responses. Curr. Opin. Plant Biol. 2010, 13, 132–138. [Google Scholar] [CrossRef] [PubMed]
  20. Razzaq, A.; Sadia, B.; Raza, A.; Hameed, M.K.; Saleem, F. Metabolomics: A way forward for crop improvement. Metabolites 2019, 9, 303. [Google Scholar] [CrossRef] [PubMed] [Green Version]
  21. Muscolo, A.; Junker, A.; Klukas, C.; Weigelt-Fischer, K.; Riewe, D.; Altmann, T. Phenotypic and metabolic responses to drought and salinity of four contrasting lentil accessions. J. Exp. Bot. 2015, 18, 5467–5480. [Google Scholar] [CrossRef] [PubMed] [Green Version]
  22. Singh, D.; Singh, C.K.; Taunk, J.; Tomar, R.S.S.; Chaturvedi, A.K.; Gaikwad, K.; Pal, M. Transcriptome analysis of lentil (Lens culinaris Medikus) in response to seedling drought stress. BMC Genom. 2017, 18, 206. [Google Scholar] [CrossRef] [Green Version]
  23. Sinha, R.; Pal, A.K.; Singh, A.K. Physiological, biochemical and molecular responses of lentil (Lens culinaris Medik.) genotypes under drought stress. Ind. J. Plant Physiol. 2018, 23, 772–784. [Google Scholar]
  24. Mia, M.W.; Yamauchi, A.; Kono, Y. Root system structure of six food legume species: Inter- and intraspecific variations. Jpn. J. Crop Sci. 1996, 65, 131–140. [Google Scholar] [CrossRef] [Green Version]
  25. Kumar, J.; Basu, P.S.; Srivastava, E.; Chaturvedi, S.K.; Nadarajan, N.; Kumar, S. Phenotyping of traits imparting drought tolerance in lentil. Crop. Pasture Sci. 2012, 63, 547–554. [Google Scholar] [CrossRef]
  26. Idrissi, O.; Houasli, C.; Udupa, S.M.; De Keyser, E.; Van Damme, P.; De Riek, J. Genetic variability for root and shoot traits in a lentil (Lens culinaris Medik.) recombinant inbred line population and their association with drought tolerance. Euphytica 2015, 204, 693–709. [Google Scholar] [CrossRef]
  27. Foti, C.; Khah, E.M.; Pavli, O.I. Response of lentil genotypes under PEG-induced drought stress: Effect on germination and growth. Plant 2018, 6, 75–83. [Google Scholar]
  28. Steuter, A. Water potential of aqueous polyethylene glycol. Plant Physiol. 1981, 67, 64–67. [Google Scholar] [CrossRef] [PubMed] [Green Version]
  29. Kulkarni, M.; Deshpande, U. In vitro screening of tomato genotypes for drought resistance using polyethylene glycol. Afr. J. Biotechnol. 2007, 6, 691–696. [Google Scholar]
  30. Govindaraj, M.; Shanmugasundaram, P.; Sumathi, P.; Muthiah, A. Simple, rapid and cost effective screening method for drought resistant breeding in pearl millet. Electr. J. Plant Breed. 2010, 1, 590–599. [Google Scholar]
  31. Kalampokis, I.F.; Kapetanakis, G.C.; Aliferis, K.A.; Diallinas, G. Multiple nucleobase transporters contribute to boscalid sensitivity in Aspergillus nidulans. Fung. Gen. Biol. 2018, 115, 52–63. [Google Scholar] [CrossRef] [PubMed]
  32. Kostopoulou, K.; Ntatsi, G.; Arapis, G.; Aliferis, K.A. Assessment of the effects of metribuzin, glyphosate, and their mixtures on the metabolism of the model plant Lemna minor L. applying metabolomics. Chemosphere 2020, 239, 124582. [Google Scholar] [CrossRef]
  33. Tsugawa, H.; Cajka, T.; Kind, T.; Ma, Y.; Higgins, B.; Ikeda, K.; Kanazawa, M.; Vandergheynst, J.; Fiehn, O.; Arita, M. MS-DIAL: Data-independent MS/MS deconvolution for comprehensive metabolome analysis. Nat. Μethods 2015, 12, 523–526. [Google Scholar] [CrossRef]
  34. Aliferis, K.; Jabaji, S. 1H NMR and GC-MS metabolic fingerprinting of developmental stages of Rhizoctonia solani sclerotia. Metabolomics 2010, 6, 96–108. [Google Scholar] [CrossRef]
  35. Aliferis, K.A.; Chrysayi-Tokousbaliides, M. Metabolomics in pesticide research and development: Review and future perspectives. Metabolomics 2011, 7, 35–53. [Google Scholar] [CrossRef]
  36. Aliferis, K.A.; Faubert, D.; Jabaji, S. A metabolic profiling strategy for the dissection of plant defense against fungal pathogens. PLoS ONE 2014, 9, e111930. [Google Scholar] [CrossRef] [Green Version]
  37. Eriksson, L.; Byrne, T.; Johansson, E.; Trygg, J.; Vikström, C. Multi- and Megavariate Data Analysis. Principles and Applications; Umetrics Academy: Umeå, Sweden, 2001. [Google Scholar]
  38. Babicki, S.; Arndt, D.; Marcu, A.; Liang, Y.; Grant, J.R.; Maciejewski, A.; Wishart, D.S. Heatmapper: Web-enabled heat mapping for all. Nucleic Acids Res. 2016, 44, W147–W153. [Google Scholar] [CrossRef]
  39. Niederbacher, B.; Winkler, J.B.; Schnitzler, J.P. Volatile organic compounds as non-invasive markers for plant phenotyping. J. Exp. Bot. 2015, 66, 5403–5416. [Google Scholar] [CrossRef]
  40. Obata, T.; Fernie, A.R. The use of metabolomics to dissect plant responses to abiotic stresses. Cell Mol. Life Sci. 2012, 69, 3225–3243. [Google Scholar] [CrossRef] [Green Version]
  41. Scossa, F.; Brotman, Y.; de Abreu, E.L.F.; Willmitzer, L.; Nikoloski, Z.; Tohge, T.; Fernie, A.R. Genomics-based strategies for the use of natural variation in the improvement of crop metabolism. Plant Sci. 2016, 242, 47–64. [Google Scholar] [CrossRef] [PubMed]
  42. Krasensky, J.; Jonak, C. Drought, salt, and temperature stress-induced metabolic rearrangements and regulatory networks. J. Exp. Bot. 2012, 63, 1593–1608. [Google Scholar] [CrossRef] [PubMed] [Green Version]
  43. Koch, K.E. Carbohydrate-modulated gene expression in plants. Annu. Rev. Plant Physiol. Plant Mol. Biol. 1996, 47, 509–540. [Google Scholar] [CrossRef] [Green Version]
  44. Rolland, F.; Baena-Gonzalez, E.; Sheen, J. Sugar sensing and signaling in plants: Conserved and novel mechanisms. Ann. Rev. Plant Biol. 2006, 57, 675–709. [Google Scholar] [CrossRef] [PubMed] [Green Version]
  45. Muller, B.; Pantin, F.; Génard, M.; Turc, O.; Freixes, S.; Piques, M.; Gibon, Y. Water deficits uncouple growth from photosynthesis, increase C content, and modify the relationships between C and growth in sink organs. J. Exp. Bot. 2011, 62, 1715–1729. [Google Scholar] [CrossRef] [Green Version]
  46. Ramel, F.; Sulmon, C.; Bogard, M.; Couée, I.; Gouesbet, G. Differential dynamics of reactive oxygen species and antioxidative mechanisms during atrazine injury and sucrose-induced tolerance in Arabidopsis thaliana plantlets. BMC Plant Biol. 2009, 9, 28. [Google Scholar] [CrossRef] [Green Version]
  47. Ramel, F.; Sulmon, C.; Gouesbet, G.; Couée, I. Natural variation reveals relationships between pre-stress carbohydrate nutritional status and subsequent responses to xenobiotic and oxidative stress in Arabidopsis thaliana. Ann. Bot. 2009, 104, 1323–1337. [Google Scholar] [CrossRef] [Green Version]
  48. Peshev, D.; Van den Ende, W. Sugars as antioxidants in plants. In Crop Improvement under Adverse Conditions; Tuteja, N., Gill, S.S., Eds.; Springer: Berlin/Heidelberg, Germany, 2013; pp. 285–308. [Google Scholar]
  49. Garg, A.K.; Kim, J.K.; Owens, T.G.; Ranwala, A.P.; Choi, Y.D.; Kochian, L.V.; Wu, R.J. Trehalose accumulation in rice plants confers high tolerance levels to different abiotic stresses. Proc. Natl. Acad. Sci. USA 2002, 99, 15898–15903. [Google Scholar] [CrossRef] [Green Version]
  50. Paul, M.J.; Primavesi, L.F.; Jhurreea, D.; Zhang, Y.H. Trehalose metabolism and signaling. Ann. Rev. Plant Biol. 2008, 59, 417–441. [Google Scholar] [CrossRef] [PubMed] [Green Version]
  51. Lunn, J.E.; Delorge, Ι.; Figueroa, C.M.; Van Dijck, P.; Stitt, Μ. Trehalose metabolism in plants. Plant J. 2014, 79, 544–567. [Google Scholar] [CrossRef] [PubMed]
  52. Rivero, R.M.; Mestre, T.C.; Mittler, R.; Rubio, F.; Garcia-Sanchez, F.; Martinez, V. The combined effect of salinity and heat reveals a specific physiological, biochemical and molecular response in tomato plants. Plant Cell Environ. 2014, 37, 1059–1073. [Google Scholar] [CrossRef]
  53. Ilhan, S.; Ozdemir, F.; Bor, M. Contribution of trehalose biosynthetic pathway to drought stress tolerance of Capparis ovata Desf. Plant Biol. 2014, 17, 402–407. [Google Scholar] [CrossRef]
  54. Sadak, M.S.; El-Bassiouny, H.M.S.; Dawood, M.G. Role of trehalose on antioxidant defense system and some osmolytes of quinoa plants under water deficit. Bull. Natl. Res. Cent. 2019, 43, 5. [Google Scholar] [CrossRef]
  55. Ge, L.F.; Chao, D.Y.; Shi, M.; Zhu, M.Z.; Gao, J.P.; Lin, H.X. Overexpression of the trehalose-6-phosphate phosphatase gene OsTPP1 confers stress tolerance in rice and results in the activation of stress responsive genes. Planta 2008, 228, 191–201. [Google Scholar] [CrossRef] [PubMed]
  56. Krasensky, J.; Broyart, C.; Rabanal, F.A.; Jonak, C. The redox-sensitive chloroplast trehalose-6-phosphate phosphatase AtTPPD regulates salt stress tolerance. Antioxid. Redox Signal. 2014, 21, 1289–1304. [Google Scholar] [CrossRef] [Green Version]
  57. Mahabub, A.; Mirza, H.; Kamrun, N.; Masayuki, F. Exogenous salicylic acid ameliorates short-term drought stress in mustard (Brassica juncea L.) seedlings by up-regulating the antioxidant defense and glyoxalase system. Aust. J. Crop Sci. 2013, 7, 1053–1063. [Google Scholar]
  58. McKersie, B.D.; Leshema, Y.Y. Stress and Stress Coping in Cultivated Plants; Kluwer Academic Publisher: London, UK, 1994. [Google Scholar]
  59. Solomon, K.F.; Labuschagne, M.T. Differences in the level of D-glucose and sucrose among durum wheat (Triticum turgidum var durum L.) genotypes differing in their responses to drought stress. S. Afr. J. Plant Soil 2005, 22, 122–126. [Google Scholar] [CrossRef] [Green Version]
  60. Guo, R.; Shi, L.; Jiao, Y.; Li, M.; Zhong, X.; Gu, F.; Liu, Q.; Xia, X.; Li, H. Metabolic responses to drought stress in the tissues of drought-tolerant and drought-sensitive wheat genotype seedlings. AoB Plants 2018, 10, ply016. [Google Scholar] [CrossRef] [Green Version]
  61. Farooq, M.; Wahid, A.; Kobayashi, N.; Fujita, D.; Basra, S.M.A. Plant drought stress: Effects, mechanisms and management. Agron. Sustain. Dev. 2009, 29, 185–212. [Google Scholar] [CrossRef] [Green Version]
  62. López-Bucio, J.; De la Vega, O.M.; Guevara-García, A.; Herrera-Estrella, L. Enhanced phosphorus uptake in transgenic tobacco plants that overproduce citrate. Nat. Biotechnol. 2000, 18, 450–453. [Google Scholar] [CrossRef]
  63. Hinsinger, P.; Plassard, C.; Tang, C.; Jaillard, B. Origins of root mediated pH changes in the rhizosphere and their responses to environmental constraints: A review. Plant Soil 2003, 248, 43–59. [Google Scholar] [CrossRef]
  64. Iqbal, N.; Ashraf, Y.; Ashraf, M. Modulation of endogenous levels of some key organic metabolites by exogenous application of glycine betaine in drought stressed plants of sunflower (Helianthus annuus L.). Plant Growth Regul. 2011, 63, 7–12. [Google Scholar] [CrossRef]
  65. Loutfy, N.; El-Tayeb, M.A.; Hassanen, A.M.; Moustafa, M.F.; Sakuma, Y.; Inouhe, M. Changes in the water status and osmotic solute contents in response to drought and salicylic acid treatments in four different cultivars of wheat (Triticum aestivum). J. Plant Res. 2012, 125, 173–184. [Google Scholar] [CrossRef] [PubMed]
  66. Marcin′ska, I.; Czyczyło-Mysza, I.; Skrzypek, E.; Filek, M.; Grzesiak, S.; Grzesiak, M.T.; Janowiak, F.; Hura, T.; Dziurka, M.; Dziurka, K.; et al. Impact of osmotic stress on physiological and biochemical characteristics in drought-susceptible and drought-resistant wheat genotypes. Acta Physiol. Plant. 2013, 35, 451–461. [Google Scholar] [CrossRef] [Green Version]
  67. Bowne, J.B.; Erwin, Τ.A.; Juttner, J.; Schnurbusch, T.; Langridge, P.; Bacic, A.; Roessner, U. Drought responses of leaf tissues from wheat cultivars of differing drought tolerance at the metabolite level. Mol. Plant 2012, 5, 418–429. [Google Scholar] [CrossRef] [PubMed] [Green Version]
  68. Gregorová, Z.; Kováčik, J.; Klejdus, B.; Maglovski, M.; Kuna, R.; Hauptvogel, P.; Matušíková, Ι. Drought-induced responses of physiology, metabolites, and pr proteins in Triticum aestivum. J. Agric. Food Chem. 2015, 63, 8125–8133. [Google Scholar] [CrossRef] [PubMed]
  69. Michaletti, A.; Naghavi, M.R.; Toorchi, M.; Zolla, L.; Rinalducci, S. Metabolomics and proteomics reveal drought-stress responses of leaf tissues from spring-wheat. Sci. Rep. 2018, 8, 5710. [Google Scholar] [CrossRef] [PubMed] [Green Version]
  70. Levi, A.; Paterson, A.H.; Cakmak, I.; Saranga, Y. Metabolite and mineral analyses of cotton near-isogenic lines introgressed with QTLs for productivity and drought-related traits. Physiol. Plant 2011, 141, 265–275. [Google Scholar] [CrossRef] [PubMed]
  71. Merewitz, E.B.; Du, H.; Yu, W.; Liu, Y.; Gianfagna, T.; Huang, B. Elevated cytokinin content in ipt transgenic creeping bentgrass promotes drought tolerance through regulating metabolite accumulation. J. Exp. Bot. 2011, 63, 1315–1328. [Google Scholar] [CrossRef] [Green Version]
  72. El-Tohamy, W.A.; El-Abagy, H.M.; Badr, M.A.; Gruda, N. Drought tolerance and water status of bean plants (Phaseolus vulgaris L.) as affected by citric acid application. J. Appl. Bot. Food Qual. 2013, 86, 212–216. [Google Scholar]
  73. Kaplan, F.; Kopka, J.; Haskell, D.W.; Zhao, W.; Schiller, K.C.; Gatzke, N.; Sung, D.Y.; Guy, C.L. Exploring the temperature-stress metabolome of Arabidopsis. Plant Physiol. 2004, 136, 4159–4168. [Google Scholar] [CrossRef] [PubMed] [Green Version]
  74. Brosche, M.; Vinocur, B.; Alatalo, E.R.; Lamminmaki, A.; Teichmann, T.; Otow, E.A.; Djilianov, D.; Afif, D.; Bogeat-Triboulot, M.; Altman, A.; et al. Gene expression and metabolite profiling of Populus euphratica growing in the Negev desert. Genome Biol. 2005, 6, R101. [Google Scholar] [CrossRef] [Green Version]
  75. Zuther, E.; Koehl, K.; Kopka, J. Comparative metabolome analysis of the salt response in breeding cultivars of rice. In Advances in Molecular Breeding toward Drought and Salt Tolerant Crops; Jenks, M.A., Hasegawa, P.M., Jain, S.M., Eds.; Springer: Dordrecht, The Netherlands, 2007; pp. 285–315. [Google Scholar]
  76. Kempa, S.; Krasensky, J.; Dal Santo, S.; Kopka, J.; Jonak, C. A central role of abscisic acid in stress-regulated carbohydrate metabolism. PLoS ONE 2008, 3, e3935. [Google Scholar] [CrossRef] [Green Version]
  77. Sanchez, D.H.; Lippold, F.; Redestig, H.; Hannah, A.M.; Erban, A.; Kramer, U.; Kopka, J.; Udvardi, K.M. Integrative functional genomics of salt acclimatization in the model legume Lotus japonicus. Plant 2008, 53, 973–987. [Google Scholar] [CrossRef]
  78. Usadel, B.; Blasing, O.E.; Gibon, Y.; Poree, F.; Hohne, M.; Gunter, M.; Trethewey, R.; Kamlage, B.; Poorter, H.; Stitt, M. Multilevel genomic analysis of the response of transcripts, enzyme activities and metabolites in Arabidopsis rosettes to a progressive decrease of temperature in the non-freezing range. Plant Cell Environ. 2008, 31, 518–547. [Google Scholar] [CrossRef]
  79. Lugan, R.; Niogret, M.F.; Leport, L.; Guegan, J.P.; Larher, F.R.; Savoure, A.; Kopka, J.; Bouchereau, A. Metabolome and water homeostasis analysis of Thellungiella salsuginea suggests that dehydration tolerance is a key response to osmotic stress in this halophyte. Plant J. 2010, 64, 215–229. [Google Scholar] [CrossRef]
  80. Bayram, Ö.; Feussner, K.; Dumkow, M.; Herrfurth, C.; Feussner, I.; Braus, G.H. Changes of global gene expression and secondary metabolite accumulation during light-dependent Aspergillus nidulans development. Fungal Genet. Biol. 2016, 87, 30–53. [Google Scholar] [CrossRef] [Green Version]
  81. Rahman, M.; Akond, M.; Babar, M.A.; Beecher, C.; Erickson, J.; Thomason, K.; De Jong, F.A.; Manson, R.E. LC-HRMS based non-targeted metabolomic profiling of wheat (Triticum aestivum L.) under post-anthesis drought stress. Am. J. Plant Sci. 2017, 8, 3024–3061. [Google Scholar] [CrossRef] [Green Version]
  82. Silvente, S.; Sobolev, A.P.; Lara, M. Metabolite adjustments in drought tolerant and sensitive soybean genotypes in response to water stress. PLoS ONE 2012, 7, e38554. [Google Scholar] [CrossRef] [Green Version]
  83. Ma, X.; Xia, H.; Liu, Y.; Wei, H.; Zheng, X.; Song, C.; Chen, L.; Liu, H.; Luo, L. Transcriptomic and metabolomic studies disclose key metabolism pathways contributing to well-maintained photosynthesis under the drought and the consequent drought-tolerance in rice. Front. Plant Sci. 2016, 7, 1886. [Google Scholar] [CrossRef] [PubMed] [Green Version]
  84. Obata, T.; Witt, S.; Lisec, J.; Palacios-Rojas, N.; Florez-Sarasa, I.; Yousfi, S.; Araus, J.L.; Cairns, J.E.; Fernie, A.R. Metabolite profiles of maize leaves in drought, heat, and combined stress field trials reveal the relationship between metabolism and grain yield. Plant Physiol. 2015, 169, 2665–2683. [Google Scholar] [CrossRef] [PubMed] [Green Version]
  85. Sassi, S.; Aydi, S.; Hessini, K.; Gonzalez, E.M.; Arrese-Igor, C. Long-term mannitol-induced osmotic stress leads to stomatal closure, carbohydrate accumulation and changes in leaf elasticity in Phaseolus vulgaris leaves. Afr. J. Biotechnol. 2010, 9, 6061–6069. [Google Scholar]
  86. Khan, N.; Bano, A.; Rahman, M.A.; Rathinasabapathi, B.; Babar, M.A. UPLC-HRMS-based untargeted metabolic profiling reveals changes in chickpea (Cicer arietinum) metabolome following long-term drought stress. Plant Cell Environ. 2018, 42, 1–18. [Google Scholar] [CrossRef] [Green Version]
  87. Morgan, J.M. Osmoregulation and water stress in higher plants. Ann. Rev. Plant Biol. 1984, 35, 299–319. [Google Scholar] [CrossRef]
  88. Yadav, S.K.; Jyothi Lakshmi, N.; Maheswari, M.; Vanaja, M.; Venkateswarlu, B. Influence of water deficit at vegetative, anthesis and grain filling stages on water relation and grain yield in sorghum. Indian J. Plant Physiol. 2005, 10, 20–24. [Google Scholar]
  89. Abid, M.; Ali, S.; Qi, L.K.; Zahoor, R.; Tian, Z.; Jiang, D.; Snider, J.L.; Dai, T. Physiological and biochemical changes during drought and recovery periods at tillering and jointing stages in wheat (Triticum aestivum L.). Sci. Rep. 2018, 8, 4615. [Google Scholar] [CrossRef] [PubMed]
  90. Matysik, J.B.; Bhal, B.; Mohanty, P. Molecular mechanisms of quenching of reactive oxygen species by proline under stress in plants. Curr. Sci. 2002, 82, 525–532. [Google Scholar]
  91. Mahajan, S.; Tuteja, N. Cold, salinity and drought stresses: An overview. Arch. Biochem. Biophys. 2005, 444, 139–158. [Google Scholar] [CrossRef]
  92. Verbruggen, N.; Hermans, C. Proline accumulation in plants: A review. J. Amino Acids 2008, 35, 753–759. [Google Scholar] [CrossRef] [PubMed]
  93. Hayat, S.; Hayat, Q.; Alyemeni, M.N.; Wani, A.S.; Pichtel, J.; Ahmad, A. Role of proline under changing environments: A review. Plant Signal. Behav. 2012, 7, 1456–1466. [Google Scholar] [CrossRef] [PubMed] [Green Version]
  94. Szabados, L.; Savouré, A. Proline: A multifunctional amino acid. Trends Plant Sci. 2010, 15, 89–97. [Google Scholar] [CrossRef]
  95. You, J.; Zhang, Y.; Liu, A.; Li, D.; Wang, X.; Dossa, K.; Zhou, R.; Yu, J.; Zhang, Y.; Wang, L.; et al. Transcriptomic and metabolomic profiling of drought-tolerant and susceptible sesame genotypes in response to drought stress. BMC Plant Biol. 2019, 19, 267. [Google Scholar] [CrossRef] [Green Version]
  96. Lea, P.J.; Sodek, L.; Parry, M.A.; Shewry, P.R.; Halford, N.G. Asparagine in plants. Ann. Appl. Biol. 2007, 150, 1–26. [Google Scholar] [CrossRef]
  97. Sulieman, S.; Tran, L.S.P. Asparagine: An amide of particular distinction in the regulation of symbiotic nitrogen fixation of legumes. Crit. Rev. Biotechnol. 2013, 33, 309–327. [Google Scholar] [CrossRef]
  98. King, G.A.; Woollard, D.C.; Irving, D.E.; Borst, W.M. Physiological changes in asparagus spear tips after harvest. Plant Physiol. 1990, 80, 393–400. [Google Scholar] [CrossRef]
  99. Xu, G.; Fan, X.; Miller, A.J. Plant nitrogen assimilation and use efficiency. Ann. Rev. Plant Biol. 2012, 63, 153–182. [Google Scholar] [CrossRef] [PubMed] [Green Version]
  100. Sotero-Martins, A.; da Silva Bon, E.P.; Carvajal, E. Asparaginase II-GFP fusion as a tool for studying the secretion of the enzyme under nitrogen starvation. Braz. J. Microb. 2003, 34, 373–377. [Google Scholar] [CrossRef] [Green Version]
  101. Kusaka, M.; Ohta, M.; Fujimura, T. Contribution of inorganic components to osmotic adjustment and leaf folding for drought tolerance in pearl millet. Physiol. Planta. 2005, 125, 474–489. [Google Scholar] [CrossRef]
  102. Kinnersley, A.M.; Turano, F.J. Gamma aminobutyric acid (GABA) and plant responses to stress. Crit. Rev. Plant Sci. 2000, 9, 479–509. [Google Scholar] [CrossRef]
  103. Bouché, Ν. Fromm, N. GABA in plants: Just a metabolite? Trends Plant Sci. 2004, 9, 110–115. [Google Scholar] [CrossRef]
  104. Bown, A.W.; Shelp, B.J. Plant GABA: Not Just a Metabolite. Trends Plant Sci. 2016, 21, 10. [Google Scholar] [CrossRef]
  105. Abebe, T.; Guenzi, A.C.; Martin, B.; Cushman, J.C. Tolerance of mannitol-accumulating transgenic wheat to water stress and salinity. Plant Physiol. 2003, 131, 1748–1755. [Google Scholar] [CrossRef] [Green Version]
  106. Miller, G.; Suzuki, N.; Ciftci-Yilmaz, S.; Mittler, R. Reactive oxygen species homeostasis and signalling during drought and salinity stresses. Plant Cell Environ. 2010, 33, 453–467. [Google Scholar] [CrossRef]
  107. Shulaev, V.; Cortes, D.; Miller, G.; Mittler, R. Metabolomics for plant stress response. Physiol. Plant. 2008, 132, 199–2018. [Google Scholar] [CrossRef]
  108. Fernie, A.R.; Schauer, N. Metabolomics-assisted breeding: A viable option for crop improvement? Trends Genet. 2009, 25, 39–48. [Google Scholar] [CrossRef]
  109. Arbona, V.; Manzi, Μ.; Ollas, C.D.; Gómez-Cadenas, A. Metabolomics as a tool to investigate abiotic stress tolerance in plants. Int. J. Mol. Sci. 2013, 14, 4885–4911. [Google Scholar] [CrossRef]
  110. Ogbaga, C.C.; Stepien, P.; Dyson, B.C.; Rattray, N.J.W.; Ellis, D.I.; Goodacre, R.; Johnson, G.N. Biochemical analyses of sorghum varieties reveal differential responses to drought. PLoS ONE 2016, 11, e0154423. [Google Scholar] [CrossRef]
  111. Massacci, A.; Battistelli, A.; Loreto, F. Effect of drought stress on photosynthetic characteristics, growth and sugar accumulation of field-grown sweet sorghum. Funct. Plant Biol. 1996, 23, 331–340. [Google Scholar] [CrossRef]
  112. Loewus, F.A.; Murthy, P.P.N. myo-Inositol metabolism in plants. Plant Sci. 2000, 1, 1–19. [Google Scholar] [CrossRef]
  113. Stevenson-Paulik, J.; Bastidas, R.J.; Chiou, S.T.; Frye, R.A.; York, J.D. Generation of phytate-free seeds in Arabidopsis through disruption of inositol polyphosphate kinases. Proc. Natl. Acad. Sci. USA 2005, 102, 12612–12617. [Google Scholar] [CrossRef] [Green Version]
  114. Perera, I.Y.; Hung, C.Y.; Moore, C.; Stevenson-Paulik, J.; Bossa, W.F. Transgenic Arabidopsis plants expressing the type 1 inositol 5-phosphatase and altered abscisic acid signalling. Plant Cell 2008, 20, 2876–2893. [Google Scholar] [CrossRef] [PubMed] [Green Version]
  115. Zhai, S.; Jinxi, H.; Lei, X.; Yanyan, A.; Shaozhen, H.; Quingchang, L. A myo-inositol-1-phosphate synthase gene, IbMIPS1, enhances salt and drought tolerance and stem nematode resistance in transgenic sweet potato. Plant Biotechnol. J. 2016, 14, 592–602. [Google Scholar] [CrossRef]
  116. Yildizli, A.; Çevik, S.; Ünyayar, S. Effects of exogenous myo-inositol on leaf water status and oxidative stress of Capsicum annuum under drought stress. Acta Physiolog. Plant 2018, 40, 122. [Google Scholar] [CrossRef]
  117. Sharma, N.; Chaudhary, C.; Khurana, P. Wheat Myo-inositol phosphate synthase influences plant growth and stress responses via ethylene mediated signaling. Sci. Rep. 2020, 10, 10766. [Google Scholar] [CrossRef] [PubMed]
Figure 1. Classification of identified lentil metabolites applying GC/EI/MS metabolomics analysis.
Agronomy 11 01190 g001
Figure 2. Orthogonal partial least squares-discriminant analysis (OPLS-DA) PC1/PC2 score plots for the recorded GC/EI/MS metabolic profiles of lentil. (a) Control and stressed plants (2.5% and 5% PEG-6000) of Elpida (DT) and Flip03-24L (DS); (b) control and stressed plants of Elpida; (c) control and stressed plants of Flip03-24L. The ellipse represents the Hoteling’s T2 at 95.0% confidence interval. Four pooled samples were used for each genotype-stress level combination (n = 4) and one quality control sample (QC) (Q2(cum); cumulative fraction of the total variation of the X’s that can be predicted by the extracted components, R2X and R2Y; the fraction of the sum of squares of all X’s and Y’s explained by the current component, respectively. PCs; principal components).
Agronomy 11 01190 g002
Figure 3. Hierarchical cluster analysis (HCA) for the recorded GC/EI/MS metabolic profiles of Elpida and Flip03-24L. Cluster distances were calculated using the Ward’s method. The plot divides samples into two groups: Group 1: Flip03-24L (DS) and Group 2: controls and Elpida (DT), the latter showing a division into two subgroups.
Agronomy 11 01190 g003
Figure 4. Heatmap illustrating fluctuations of the most significant metabolites based on PLS-DA (coefficient ≥2.5 and ≤−2.5) scores under control and drought conditions using a color scale. The heatmap was generated using “Pearson” for distance measure and clustering was performed using the average linkage. Hierarchical clustering was performed on metabolites to reveal trends within genotypes and stress treatments. Negative values of coefficients denote metabolites with higher relative concentration in stressed plants, whereas positive values denote compounds with higher relative concentration in control plants (C; Control, 2.5% and 5.0% correspond to PEG-induced drought stress treatments).
Agronomy 11 01190 g004
Figure 5. Color-coded fluctuation of lentil’s metabolic network in response to PEG-induced osmotic drought stress. Metabolic response of Elpida and Flip03-24L at 2.5% and 5% PEG-6000 is displayed, including portions of the carbohydrate and amino acid metabolism, biosynthesis of secondary metabolites, glycolysis, and the TCA cycle, which were detected as important components of lentil’s drought-response mechanism. For metabolic network construction, information was retrieved by the Kyoto Encyclopedia of Genes and Genomes (KEGG). Fluctuations in metabolite relative concentration are coded using a color code based on the means of scaled and centered OPLS regression coefficients (CoeffCS) from four biological replications and a quality control sample per treatment. From left to right, blocks refer to fluctuations in metabolite relative concentration of Elpida at 2.5% and 5% PEG-6000 and Flip03-24L at 2.5% and 5% PEG-6000. Metabolites with green arrows denote substantial increase, while those with red ones denote substantial decrease. Grey boxes denote no substantial change under stress conditions (p < 0.05). Dashed lines symbolize multi-step or not fully elucidated reactions, and solid lines refer to one-step reactions.
Agronomy 11 01190 g005
Table 1. Lentil’s response to osmotic drought stress at early growth stages based on the chemical groups of the most influential metabolites. Metabolites marked with asterisk (*) denote the most substantial metabolic fluctuations based on values of scaled and centered OPLS regression coefficient scores (CoeffCS) (≥2.5 and ≤−2.5). Negative values of coefficients denote metabolites with higher relative concentration in stressed plants, whereas positive values denote compounds with higher relative concentration in control plants (C; Control, 2.5% and 5.0% correspond to PEG-induced drought stress treatments).
Chemical GroupMetaboliteElpida (DT)Flip03-24L (DS)
C vs. 2.5%C vs. 5%C vs. 2.5%C vs. 5%
CarbohydratesD-fructose8.3 *6.2 *−11.1 *−3.5 *
D-glucose−22.2 *−23.9 *−22.1 *−18.7 *
α,α-trehalose28.4 *24.2 *0.7−17 *
D-myo-inositol phosphate1.42.7 *0.60.8
glycerol−11.4 *−3.6 *−5.0 *−7.0 *
glycerol-3-phosphate23.2 *1.91.3
myo-inositol−2.3−6.7 *2.9 *2.3
scyllitol−7.6 *3.4 *−11.2 *−5.5 *
xylose−9.9 *−9.6 *−2.5 *−4.0 *
Carboxylic acids2-ketoglutaric acid−7.3 *−9.6 *−5.8 *−4.8 *
citric acid−3.8 *−4.1 *−2.6 *−2.3
malonic acid−4.6 *6.9 *−0.60.3
propanoic acid2.5 *2.11.70.4
succinic acid2.23.9 *11.1
fumaric acid−1.40.9−3.3 *−1.9
malic acid−1.2−1.1−9.7 *−4.1 *
L-lactic acid−0.80.9−3.1 *−1
Amino acids4-aminobutanoic acid−7.9 *−5.2 *−6.3 *−4.2 *
L-alanine−2.6 *−2.3−1−1.5
L-asparagine−16.8 *−22.9 *−7.6 *−6.0 *
L-aspartic acid−3.8 *−4.6 *−2.6 *−1.7
L-isoleucine−5.3 *−4.3 *−4.5 *−5.0 *
L-phenynalanine−1.2−4.2 *−1.93.5 *
L-proline−9.9 *−7.0 *−7.4 *−8.1 *
L-serine−3.8 *−4.2 *−1.2−1.1
L-tryptophan−1.1−2.6 *3.9 *4.2 *
L-valine3.9 *4.6 *4.5 *−2.3
Phosphoric acidsphosphate5.9 *0.8−2.8 *−3.5 *
phosphoric acid1.6−4.8 *−5.1 *−2.2
Fatty acidsthreonic acid−4.0 *−6.2 *−5.5 *−3.0 *
Alcoholsethylene glycol−4.1 *−4.2 *−3.7 *0
Glycerolipidsmonostearin−1.71.92.22.5 *
Publisher’s Note: MDPI stays neutral with regard to jurisdictional claims in published maps and institutional affiliations.

