Article

Mixed Growth with Weeds Promotes Mycorrhizal Colonization and Increases the Plant-Availability of Phosphorus under Maize (Zea mays L.)

1
Soil Science, University of Rostock, Justus-von-Liebig Weg 6, D-18059 Rostock, Germany
2
Crop Health, University of Rostock, Satower Str. 48, D-18059 Rostock, Germany
3
Leibniz Institute of Plant Genetics and Crop Plant Research (IPK), Parkweg 3a, D-18190 Gross Luesewitz, Germany
*
Author to whom correspondence should be addressed.
Agronomy 2021, 11(7), 1304; https://doi.org/10.3390/agronomy11071304
Submission received: 26 May 2021 / Revised: 24 June 2021 / Accepted: 25 June 2021 / Published: 27 June 2021
(This article belongs to the Section Soil and Plant Nutrition)

Abstract

:
(1) Background: Weed control decreases the competition for nutrients, but also the potential of increased phosphorus (P) mobilization in soils caused by higher plant diversity. (2) Methods: Impacts of weed species under maize on mycorrhizal colonization and plant-availability of P were investigated in two pot experiments. Plant traits and P mobilization were tested in weed-free maize and in mixed growth with six annual weed species. (3) Results: Growth of maize decreased in treatments with weeds, while P concentrations in its shoots increased in mixed growth with C. album, E. crus-galli and P. convolvulus. Mycorrhizal colonization of maize without weeds was low (<20% of root length), but increased in mixed growth with C. album, E. crus-galli and V. arvensis up to 40%. The activities of Pmobilizing hydrolytic enzymes (phosphatases, ß-glucosidase) and plant-availability of P were occasionally higher under mixed growth with weeds. The dimension of weed impacts on P cycling under maize differed significantly between both experiments. (4) Conclusions: Weeds potentially promote P mobilization and mycorrhizal colonization under maize, but this impact is not guaranteed. The weed-based improved P supply of maize should be defined under field conditions to allow a controlled weed tolerance in maize cropping systems.

1. Introduction

Phosphorus (P) is an essential component of all living organisms. At present, the P supply of arable crops is mainly covered via mineral fertilizer supply. However, mineable P is limited [1,2,3] and a sustainable P supply to crop plants is becoming a significant challenge for agricultural production [4,5].
Therefore, increased attention is directed on the selection of P efficient management strategies for agricultural production. One option to overcome P deficiency is to use the existing soil P reserves more efficiently. Most of central European soils can be considered as rich in P, but only a small proportion of it is directly plant available [6]. Plants and microorganisms have various strategies to improve P acquisition from different soil P pools. The P supply to plants can be improved by an increased colonization of plant roots with arbuscular mycorrhizal fungi, which can serve as the main P supplier of their host plants [7]. Phosphatases also play an essential role in plant nutrition and growth of microorganisms [8]. They mineralize organic P compounds in soil by hydrolyzing organic phosphate esters into plant available inorganic phosphate. While acid phosphomonoesterase and phosphodiesterase activity originate from many sources including plant roots [9], mycorrhizal fungi [10], and bacteria [11], soil microorganisms and soil fauna [11] only produce the alkaline phosphomonoesterases. The activity of phosphatases is related to soil and vegetation conditions [12,13]. More diverse plant communities increase the activity of phosphatases in the soil [14]. Weed species-specific mycorrhizal colonization and its impact on the P mobilization in soils are hardly known.
As producers of phosphatases, microorganisms play an essential role in enhancing P availability in the soil, but they are also important as a P source in the soil themselves. Microbial biomass P, as a form of organic P, is assigned to the labile P pools in the soil [15]. It plays a major role in the P cycle and in P availability to organisms [16]. The intermediate storage of P as microbial biomass P, which can be converted quickly by plants and microorganisms [17], can increase P availability [18,19] and P uptake efficiency [20] of plants. Microbial biomass P is highly dynamic in soil because microorganisms react quickly on changing soil conditions like temperature, humidity, and C availability [4]. Furthermore, the diversity of plants is likely to determine the microbial biomass in the soil [17], but the contributions of weeds in crop plant populations are unknown.
Plants enhance P availability in the soil by using diverse strategies. These include increased root growth, the use of rhizosphere and root associated microorganisms and increased rhizodeposition. Crop plant-specific P mobilization in the rhizosphere was evaluated by several authors (e.g., [21,22,23]). To the best of our knowledge, weed plant-specific effects on P in the rhizosphere and soil were analyzed for the first time. Weeds primarily constitute competitors to crops not only for water but also for nutrients [24]. They are also characterized by fast growth along with efficient nutrient mobilizing and uptake. Increased pant diversity can promote the P mobilization from organic matter in soil [25], but possible contributions of weed plants remain to be studied.
Therefore, the objective of the present study was to investigate weed species-specific impacts on P mobilization and mycorrhizal colonization of maize as a crop plant. We hypothesize that mixed growth with weeds can improve P supply to maize. Furthermore, we assume that the magnitude of this impact differs between weed species, caused e.g., by different mycorrhizal colonization and exudation of enzymes into the soil. A temporary weed tolerance might contribute to an increased P use efficiency in crop production.

2. Materials and Methods

2.1. Experimental Design

The pot experiments were established under semi-field conditions in two growth seasons in 2015 and 2016. The test site Rostock (Northern Germany) is located about 15 km from the Baltic Sea (54°3′41.47″ N; 12°5′5.59″ E). The mean annual precipitation is 600 mm and the average annual temperature is 8.1 °C. The experiment was established in a randomized block design with seven treatments in six replicates (42 pots in total). Maize (Zea mays L.) was selected as the model crop because of its high P demand in combination with usually strict, soil-ecologically disadvantageous since erosion-promoting weed control in the production system [26]. Maize cv. Vitally was grown weed-free as sole crop (control (C)) and mixed with annual weed species: Chenopodium album L. (white goosefoot), Echinochloa crus-galli (L.) P. Beauv.; syn.: Panicum crus-galli L. (barnyard millet), Tripleurospermum perforatum (Mérat) M. Laínz syn. T. inodorum (L.) Sch. Bip. (scentless false mayweed), Polygonum convolvulus L.; syn. Fallopia convolvulus (L.) Á. Löve (black bindweed), Solanum nigrum L. (European black nightshade) and Viola arvensis Murray (field pansy). Plants were grown in pots with 20 cm diameter and a height of 21 cm (volume approximately 6.5 L) containing 6 kg of a P deficient soil (Pt = 114 mg kg−1, pH = 5.7). The soil utilized was loamy sand originating from a long-term field experiment from a treatment without P fertilization (since 1998) close to Rostock (Northern Germany). The dominating soil type at this field site was a stagnic cambisol. The soil was taken from the topsoil (upper 30 cm) under agricultural grass and stored for one year before use.
In each pot, two seeds of maize and 1000 seeds of the regarding weed were sown. After emergence of the weeds they were thinned out to an equal number plants per pot within a treatment (C. album: 30, E. crus-galli: 25, T. perforatum: 25, P. convolvulus: 15, S. nigrum: 15, V. arvensis: 20 plants per pot) in the respective treatments in 2015 and 2016. The seeds of maize and weeds were of the same origin and seed lots in both years. Irrigation was performed on demand once a day.

2.2. Soil Sampling and Analyses

Rhizosphere soil samples were taken 4, 8 and 12 weeks after weed germination. After 4 and 8 weeks, rhizosphere soil of weeds was taken by digging out some weed plants from the pots. The weeds were shaken slightly and soil adhering to roots after this was designated as rhizosphere soil. Additionally, all weeds were removed from the pots 8 weeks after weed germination. At the last sampling, the rhizosphere soil of maize was taken analogously. Soil samples were stored at −20 °C until analysis.
The activity of the following extracellular enzymes was determined: acid (ACP) and alkaline (ALP) phosphomonoesterases [27,28], phosphodiesterase (PDE) [29], and beta-glucosidase (BGL) [30,31]. Activities were measured in µg p-nitrophenol (pnp) released from pregiven p-nitrophenolphosphate for ACP and ALP, bis-p-nitrophenolphosphate for PDE and p-nitrophenolglucoside for BGL in 1 g fresh (thawed from frozen bulk sample) soil sample in 1 h at 37 °C (µg pnp g−1 h−1). The concentration of the released pnp was determined photometrically (CADAS 100, Hach Lange GmbH, 40,549 Duesseldorf, Germany) at 400 nm for ACP, ALP, and PDE, and at 430 nm for BGL.
Microbial biomass P (Pmic) was estimated by the modified chloroform-fumigation-extraction method of Brookes et al. (1982). A total of 2.5 g of a fresh soil sample was fumigated with chloroform at room temperature for 24 h while another 2.5 g of the same sample was incubated without chloroform (non-fumigated). Fumigated and non-fumigated soil samples were shaken in 0.5 M NaHCO3 (pH 8.5) for 30 min and and filtrated. P concentration in the filtrates was measured at 213.617 nm wavelength by using inductively coupled plasma optical emission spectrometry (ICP-OES; Optima 8300, Perkin Elmer Inc., Waltham, MA 02451, USA). Pmic resulted from the difference between P concentrations in fumigated and non-fumigated soil samples and a conversion factor (kP) of 0.4 [32].
Double lactate soluble P (PDL) as a measure of plant available P was determined according to [33], modified by [34], in a 1:50 soil to solution ratio. P concentrations in the extracts were measured at 213.617 nm by using ICP-OES.

2.3. Plant Harvest and Analyses

Weed roots were collected 4 and 8 weeks after weed germination. Furthermore, roots and shoots of maize were harvested 12 weeks after weed germination and fresh weights were recorded. The roots and shoots were dried and milled for elementary analyses. In total, 0.1 g of dry biomass of shoots and roots were digested in 5 mL HNO3 and 3 mL H2O2 in the microwave (MarsXpress, CEM GmbH, Kamp-Lintfort, Germany). P concentrations were measured in the digests with the ICP-OES at 213.617 nm.
Contents of total carbon, nitrogen and sulphur (Ct, Nt, St) were determined in a 10 µg subsample using the CNS-analyser (Vario EL cube, Elementar Analysensysteme GmbH, Hanau, Germany).
The colonization by arbuscular mycorrhizal fungi (AMF) in roots of weeds and maize was detected via staining according to [35]. Roots were washed gently and cut into 1 cm pieces. Roots were bleached with 10% KOH for 24 h, acidified with 1% HCl for 15 min and stained in chlorazol black E solution for 24 h. Roots were then washed and stored in lactoglycerol solution (lactic acid/glycerol/water, v/v/v = 1/1/1). The microscopic examination (Primo Star, Carl Zeiss Microscopy GmbH, Jena, Germany) of stained roots was performed according to [36]. A total of 200 root segments were counted for colonization with AMF at 100× magnification. AM colonization was assumed when arbuscles, intracellular or intercellular hyphae were present.

2.4. Statistical Analyses

Data were tested for normal distribution using the Shapiro–Wilk test. In the case of normal distribution, significance of weed specific effects was tested using one-way analysis of variance (ANOVA, Tukey test). Non-normal distributed data were analysed with the Kruskal–Wallis-test. Differences were considered significant when p ≤ 0.05. Correlations between the soil properties and plant traits were tested by Spearman’s rank correlation test. Statistical analyses were performed with R [37] and R package agricolae version 2.13.1 [38].

3. Results

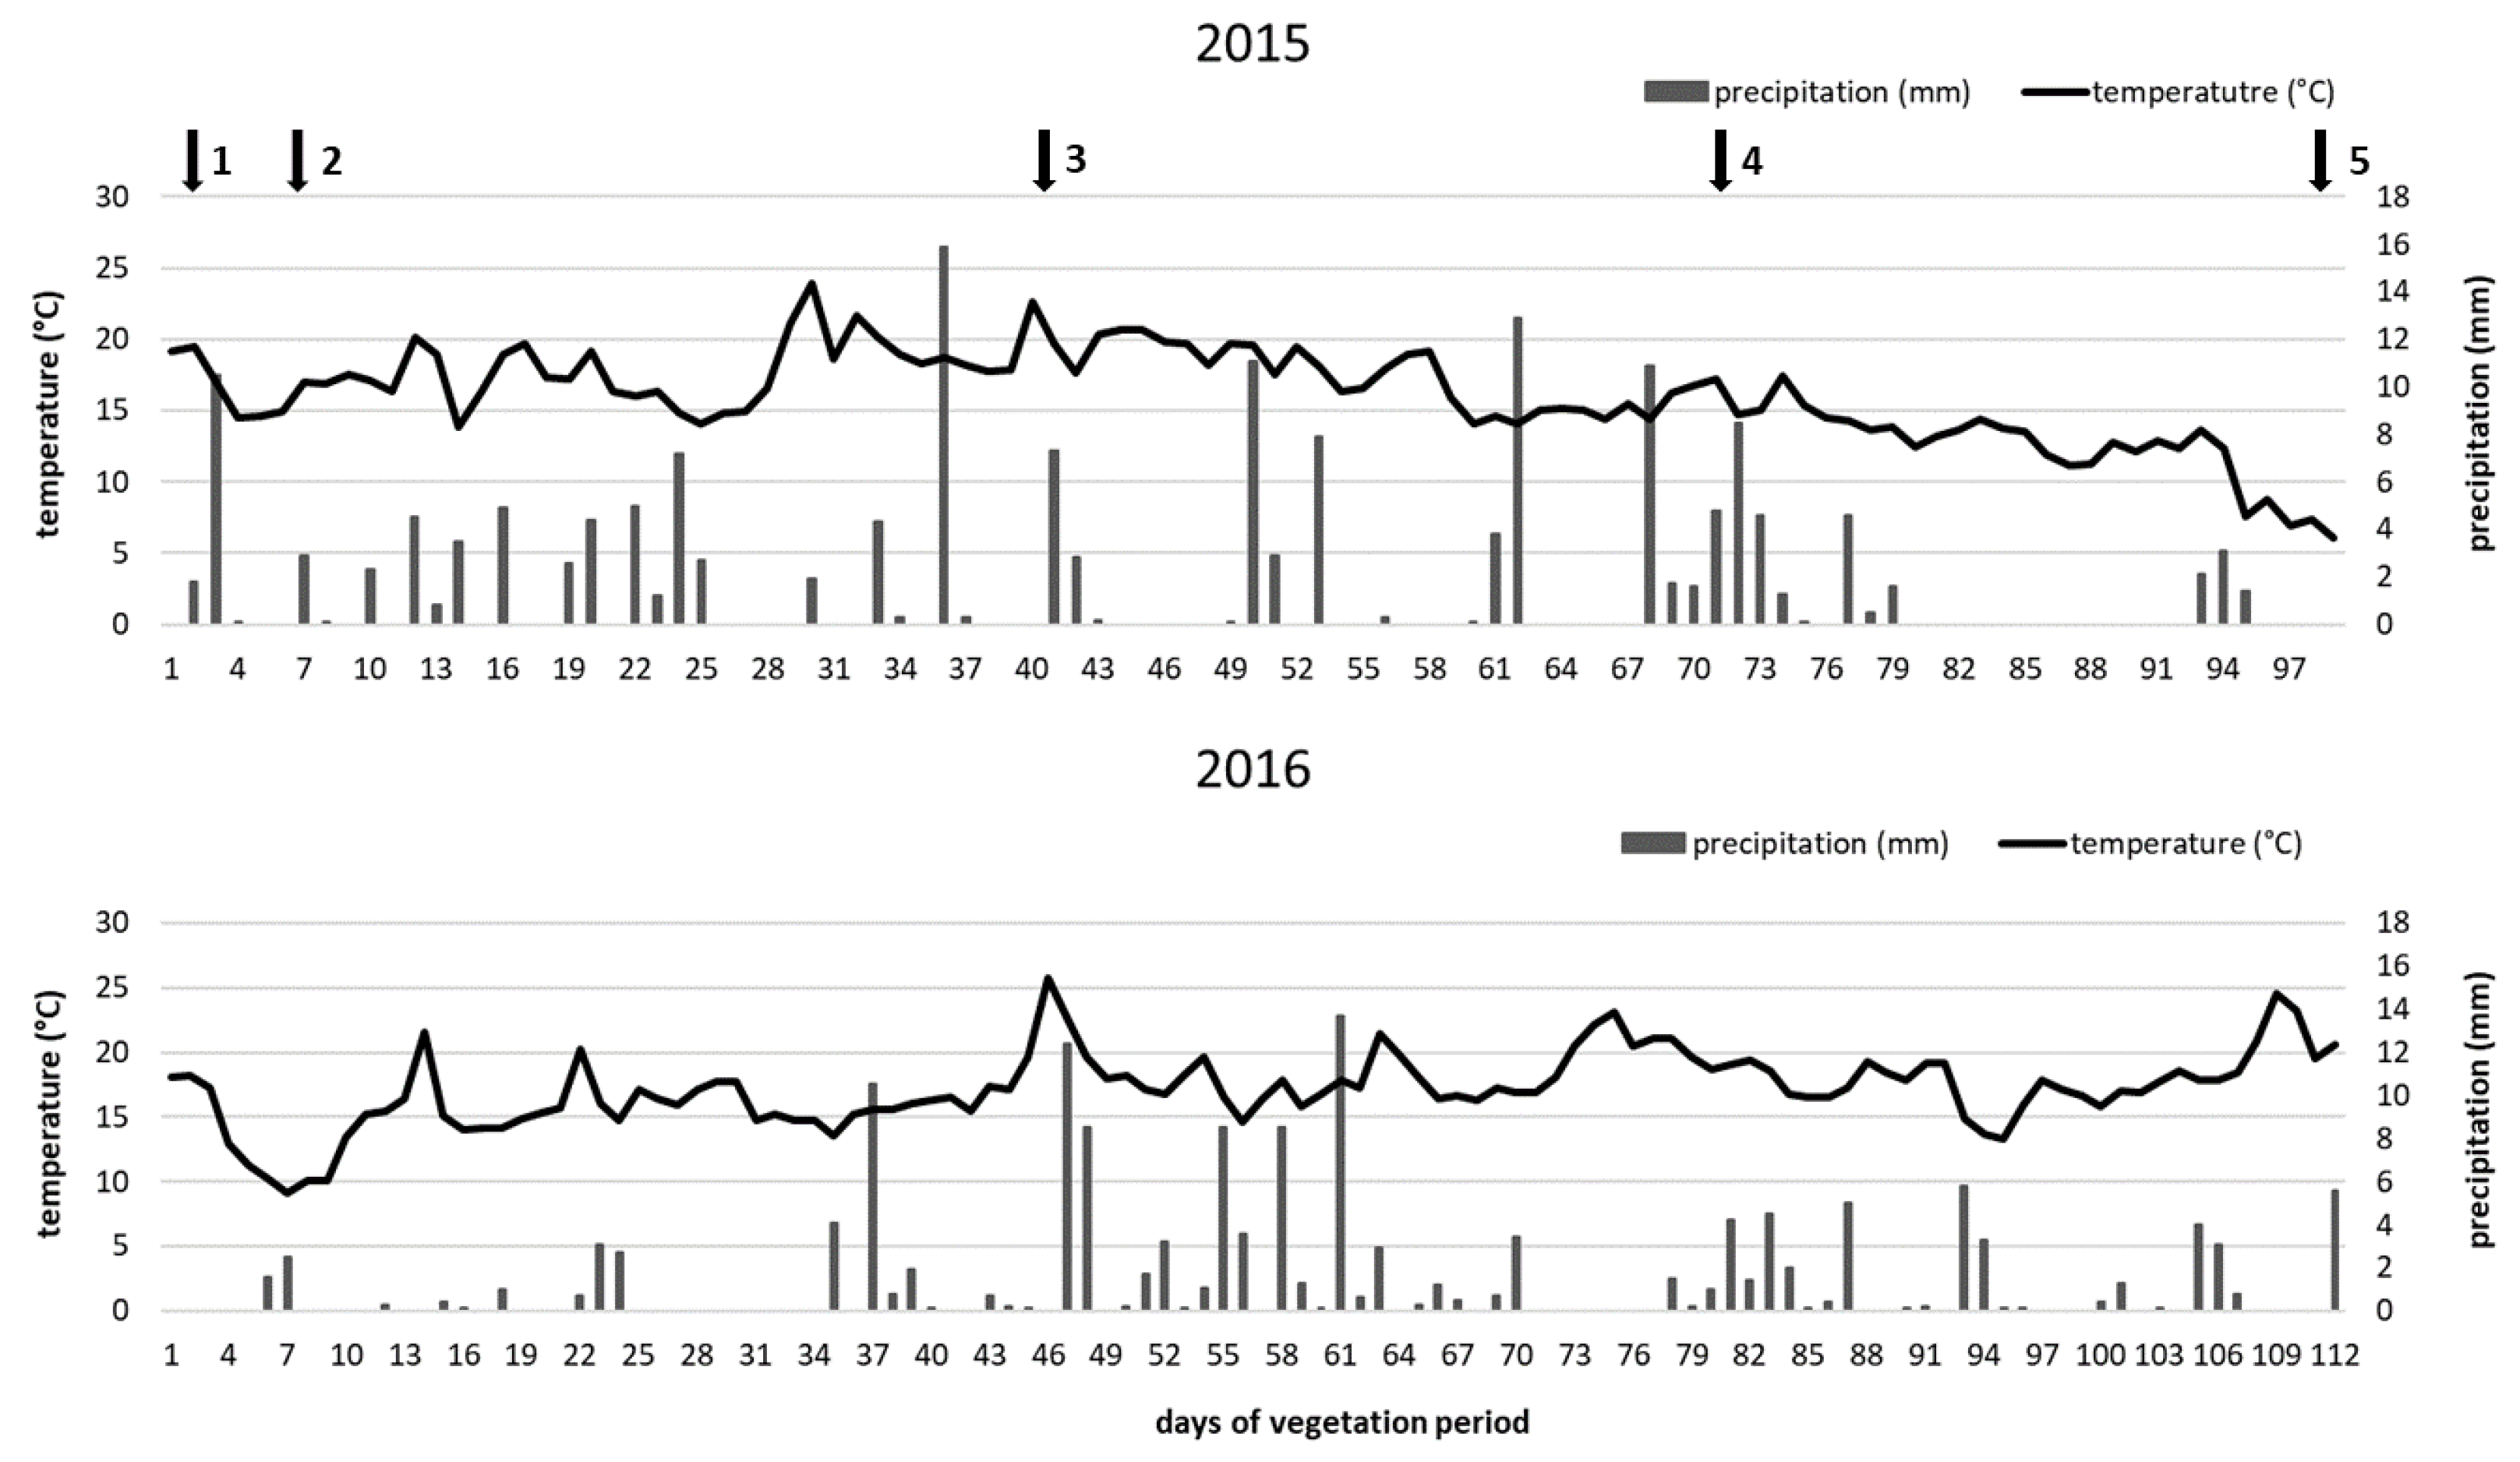
3.1. Weather Conditions

The weather conditions differed between the two test years (Figure 1). In 2015, the temperature during the test period was slightly lower than in 2016. In the first test year, there were more rainy days in the time range between weed germination and the first sampling than in the second year. On the contrary, in the remaining time of the experiments more rainy days were observed in 2016 than in 2015.

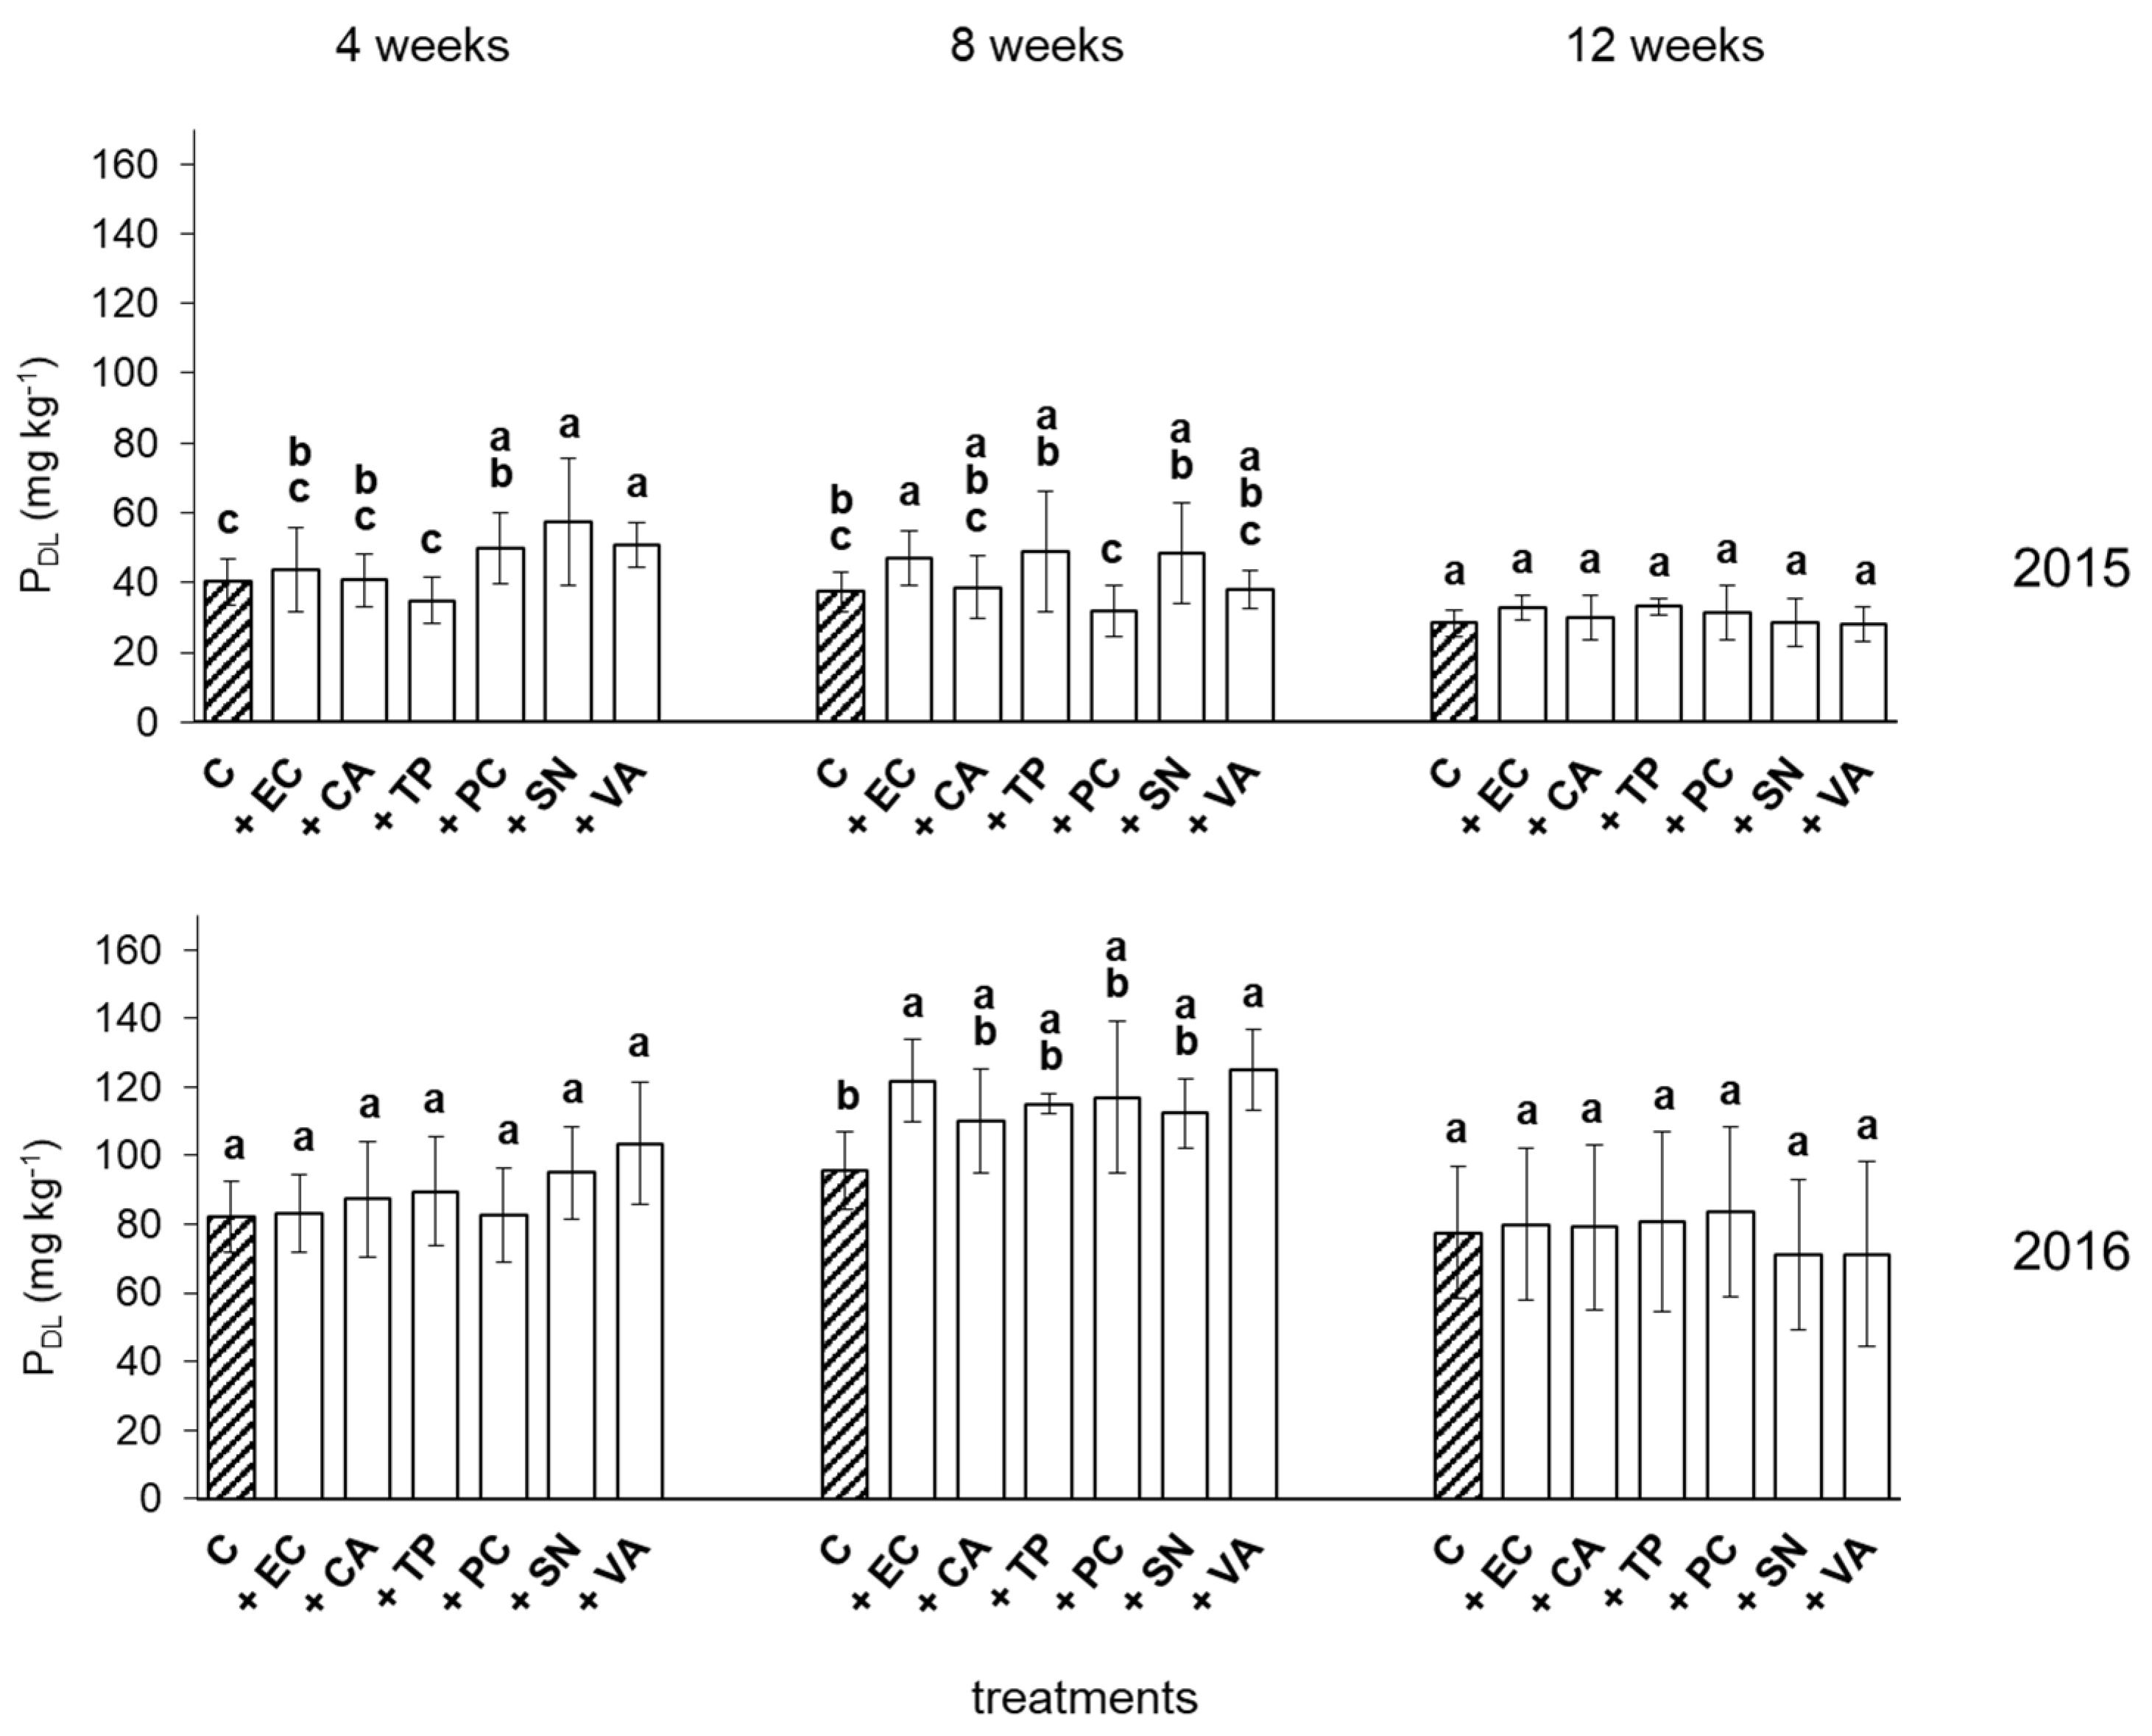
3.2. Plant-Available P

The concentrations of PDL varied temporally and with treatment-specific between 19 and 89 mg kg−1 (mean 39 mg−1) in 2015 and between 41 and 152 mg kg−1 (mean 93 mg kg−1) in 2016 (Figure 2). In the first year mixed growth of maize with S. nigrum and V. arvensis resulted in higher PDL concentrations after 4 weeks and with E. crus-galli 8 weeks after weed germination compared to the control, while in the second test year this was only the case for the treatments with E. crus-galli and V. arvensis 8 weeks after weed germination.

3.3. Microbial Biomass P in the Soil

The Pmic values in the soil ranged from 0 to 46 mg kg−1 (mean 7 mg kg−1) in 2015, and from 0 to 31 mg kg−1 (mean 5 mg kg−1) in 2016. No significant differences between the control and the treatments of mixed growth with weeds were observed in both test years (Figure 3).

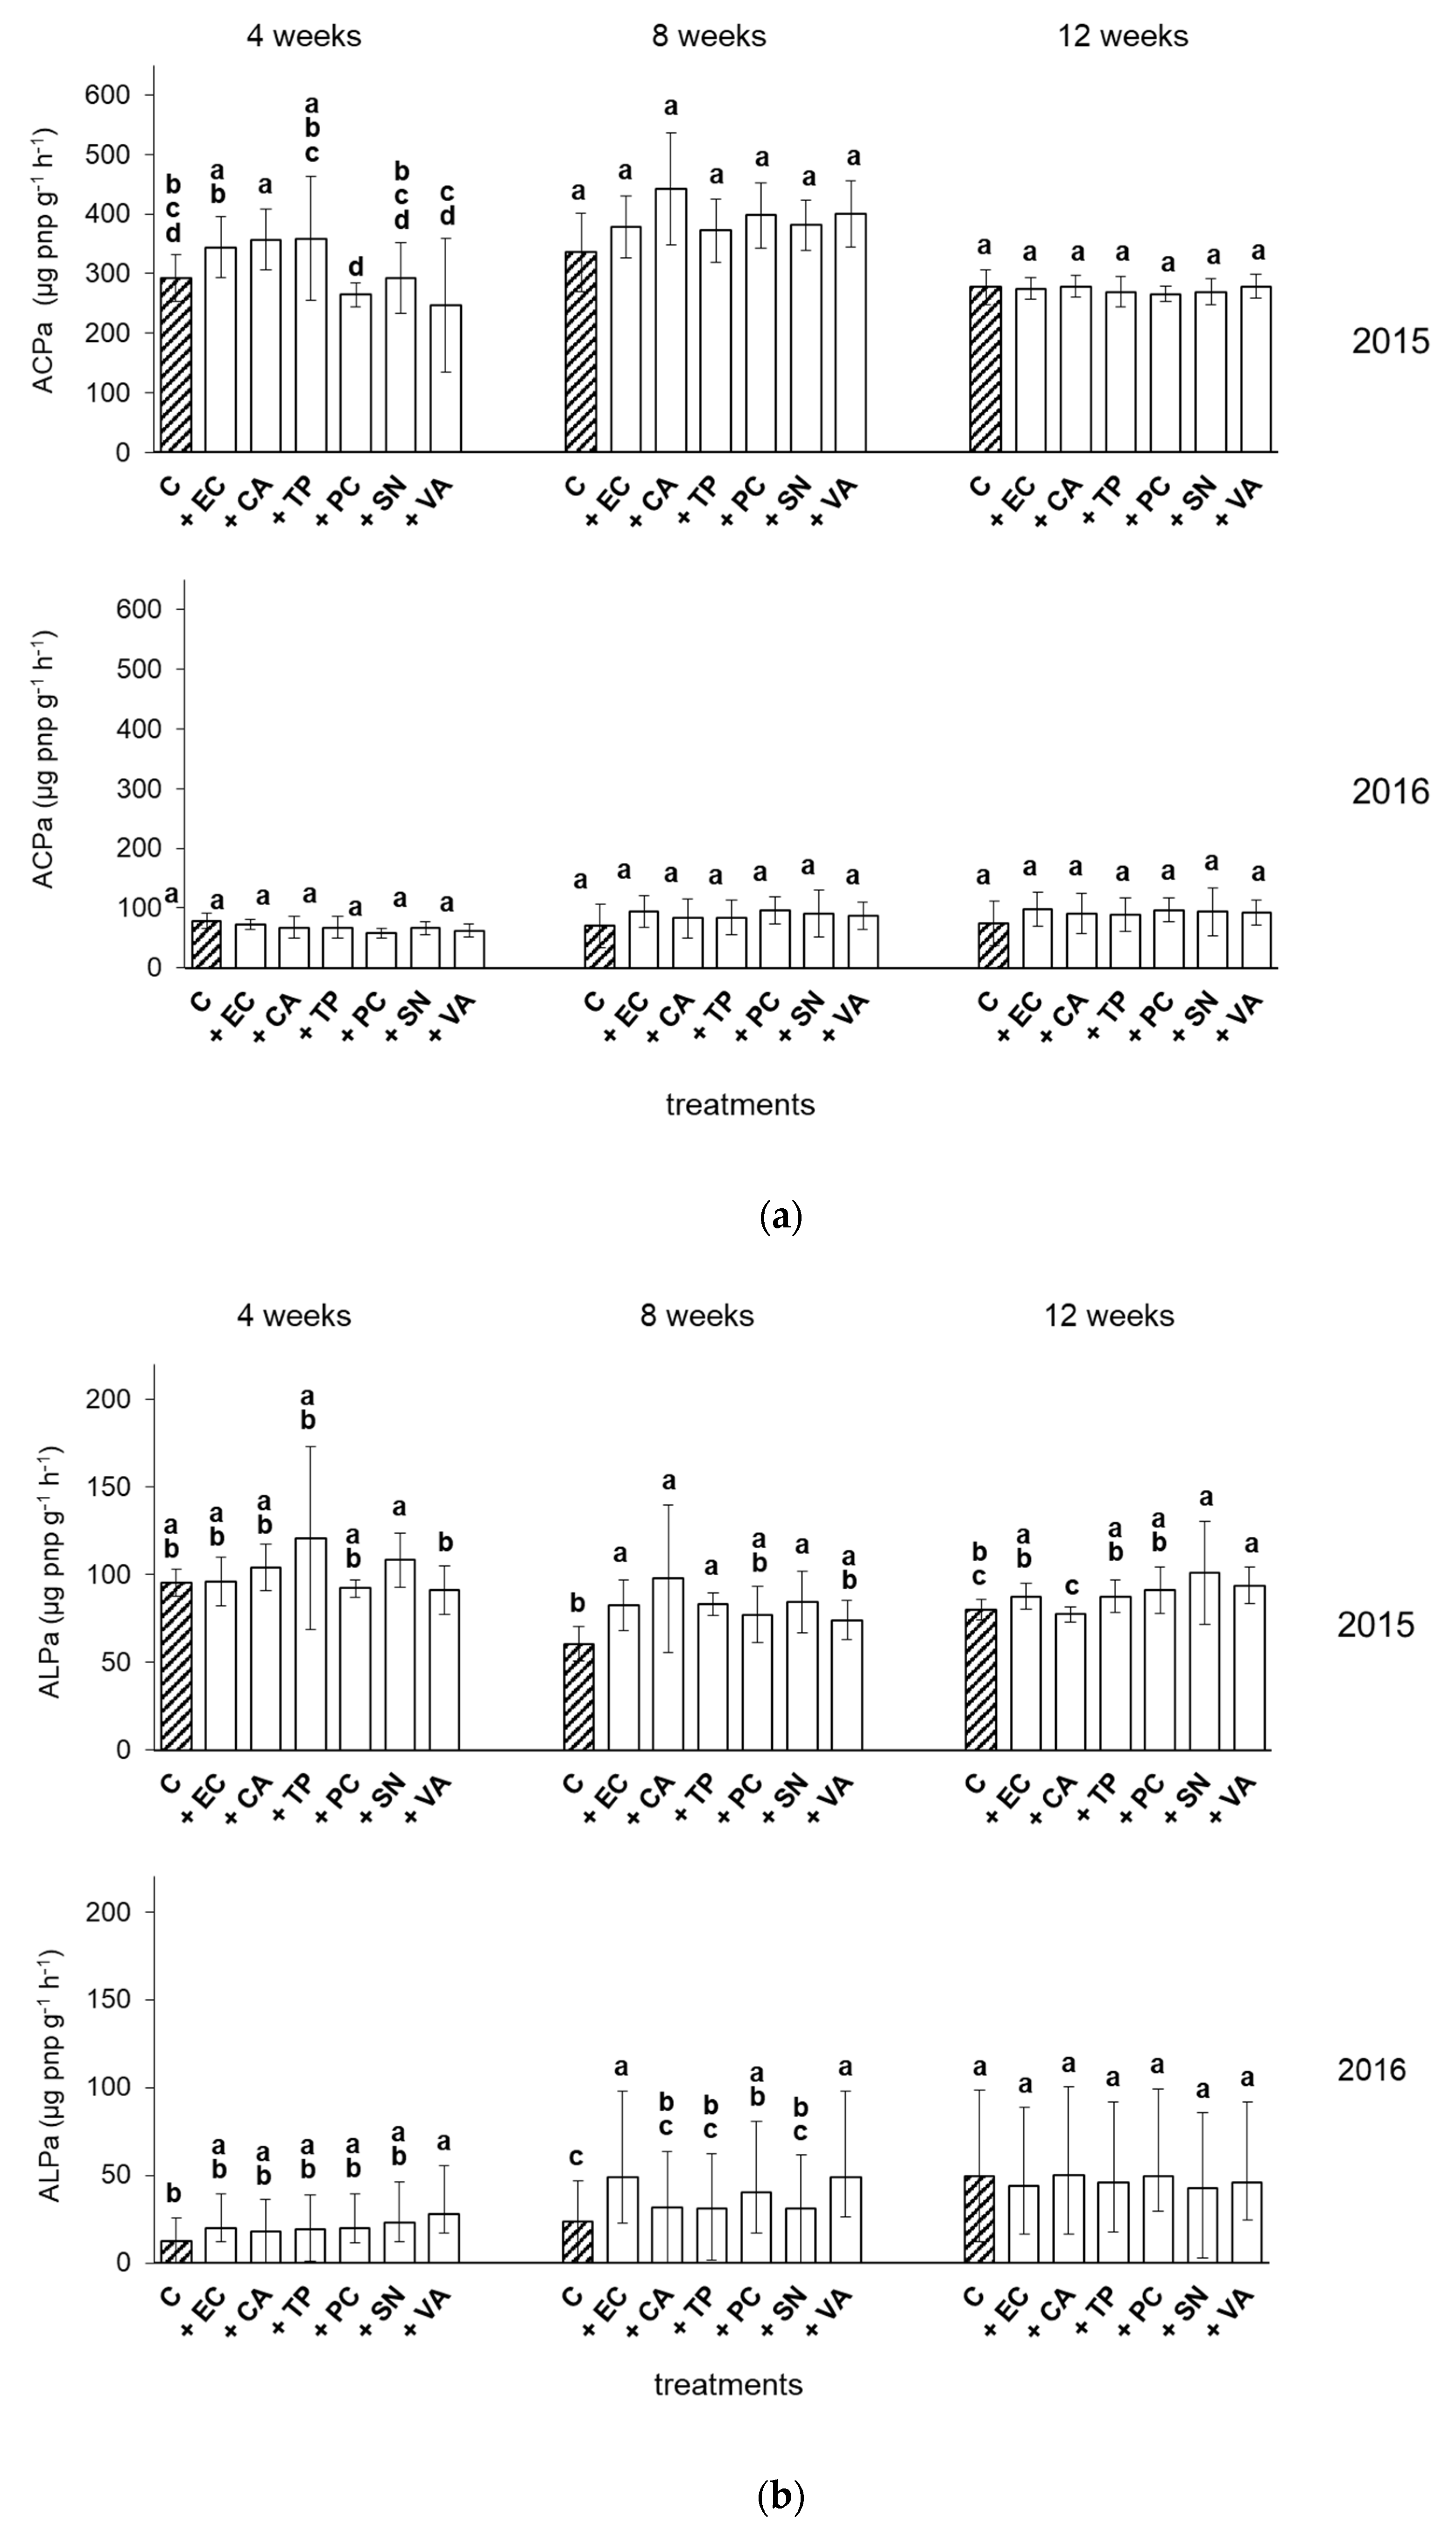
3.4. Soil Enzyme Activities

The ACP activities ranged from 27 to 568 µg pnp g−1 h−1 (mean 322 µg pnp g−1 h−1) in 2015 and from 21 to 158 µg pnp g−1 h−1 (mean 82 µg pnp g−1 h−1) in 2016 (Figure 4a). Mixed growth of maize with C. album led to increased ACP activities compared to the control in the first sampling in 2015.
ALP activities (Figure 4b) were affected by the presence of weeds in both experimental years. The values ranged between 43 and 226 µg pnp g−1 h−1 (mean 90 µg pnp g−1 h−1) in 2015. Higher activities were measured in the soil under mixed growth with C. album, E. crus-galli, T. perforatum, and S. nigrum than in the control after 8 weeks and with S. nigrum and V. arvensis 12 weeks after weed germination. In 2016, the ALP activities ranged from 8 to 82 µg pnp g−1 h−1 (mean 34 µg pnp g−1 h−1). Mixed growth with E. crus-galli increased activities 4 and 8 weeks after weed germination, whereas mixed growth with V. arvensis revealed higher activities than the control after 8 weeks.
In 2015, there were no significant differences in PDE activities between control and weed treatments. In this year, the values ranged from 9 to 34 µg pnp g−1 h−1 (mean 17 µg pnp g−1 h−1) (Figure 4c). In 2016, values ranged from 4 to 23 µg pnp g−1 h−1 (mean 11 µg pnp g−1 h−1). Mixed growth with V. arvensis significantly increased the PDE activities 8 weeks after weed germination compared to the control.
The BGL activities in 2015 ranged from 8 to 134 µg pnp g−1 h−1 (mean 64 µg pnp g−1 h−1) and were significantly increased under mixed growth with C. album in comparison to the control 8 weeks after weed germination. In contrast, in 2016 the BGL activities were significantly lower in the treatment with P. convolvulus than in the control 4 weeks after weed germination (Figure 4d). The range of BGL activities was 22 to 62 µg pnp g−1 h−1 (mean 35 µg pnp g−1 h−1).

3.5. Mycorrhizal Colonization of Weeds

The mycorrhizal colonization of weed roots was similar in both years and mainly below 30% of the total fine root length (Table 1). The highest mycorrhizal colonization was observed on E. crus-galli (mean 16 to 26% of the root length) and on T. perforatum (mean 10 to 33% of the root length). Mycorrhizal colonization of S. nigrum (mean 0.3 to 5%), V. arvensis (mean 1 and 5%) and C. album (mean 0 to 5%) were in the intermediate range, while P. convolvulus (0 to 0.6% of the root length) showed the lowest values.

3.6. Plant Traits of Maize

Biomass of maize shoots (3.5 to 34.2 g plant−1, mean 14.6 g plant−1) and roots (2.9 to 27.8 g plant−1, mean 11.8 g plant−1) were significantly lower in coculture with weeds than in monoculture in 2015 (Table 2). C. album increased the root to shoot ratio (0.5 to 2.7, mean 0.9) significantly, while S. nigrum decreased root length density (0.4 to 2.0 cm cm−3, mean 1.1 cm cm−3). In contrast, shoot biomass in 2016 (8.2 to 207.8 g plant−1, mean 64.8 g plant−1) was higher in the presence of E. crus-galli, P. convolvulus and V. arvensis than in the control, and T. perforatum decreased root biomass significantly (3.6 to 71.3 g plant−1, mean 19.9 g plant−1). Root to shoot ratio (0.1 to 0.9, mean 0.4) was higher in the control than in the treatments with E. crus-galli, P. convolvulus, S. nigrum, and V. arvensis. Presence of weeds did not affect the root length density of maize (1.2 to 7.8 cm cm−3, mean 3.4 cm cm−3).

3.7. Nutrient Concentrations in the Shoots of Maize

In 2015, N concentration in the shoots varied from 7.0 to 14.3 g kg−1 (mean 9.0 g kg−1) and was insignificantly higher in the presence of weeds than in the control (Table 3). E. crus-galli, C. album, P. convolvulus and V. arvensis increased the P concentration of maize shoots (1.8 to 3.5 g kg−1, mean 2.4 g kg−1) significantly in comparison to the control. S. nigrum and V. arvensis affected K concentration (12.7 to 21.3 g kg−1) in the shoots of maize, while no weeds had a significant impact on Ca (1.6 to 3.7 g kg−1, mean 2.5 g kg−1) and Mg (1.7 to 2.4 g kg−1) concentrations. Higher Zn concentrations in maize shoots were revealed (0.01 to 0.12 g kg−1, mean 0.02 g kg−1) in mixed growth with weeds. In 2016, the shoot concentrations of N (5.2 to 10.9 g kg−1, mean 7.2 g kg−1), K (7.6 to 12.7 g kg−1, mean 10.4 g kg−1), Ca (1.1 to 3.6 g kg−1, mean 2.2 g kg−1), and Mg (1.0 to 2.2 g kg−1, mean 1.6 g kg−1) did not differ significantly among the treatments in maize. Mixed growth with E. crus-galli, C. album and P. convolvulus increased the P concentrations in shoots of maize significantly (1.6 to 3.7 g kg−1, mean 2.4 g kg−1). Higher Zn concentrations in maize shoots (0.01 to 0.03 g kg−1, mean 0.02 g kg−1) were revealed in mixed growth with C. album than in the control.

3.8. Mycorrhizal Colonization of Maize

Arbuscular mycorrhizal colonization of maize ranged from 4 to 28% (mean 13%) of the root length and was significantly increased in mixed growth with E. crus-galli, C. album and V. arvensis in 2015 (Figure 5). In 2016, the mycorrhizal colonization of maize was generally higher than in 2015 (8 to 40%, mean 23%) without significant differences between species.

3.9. Weed Species-Specific Mycorrhizal Dependency of Maize

In both test years, no significant correlation between the weed species-specific mycorrhizal colonization and the mycorrhizal colonization of maize was observed. (2015: r = 0.12, p = 0.15; 2016: r = −0.21, p = 0.08).

3.10. Correlation of Plant Available P and Soil Enzyme Activities

Plant available P (PDL) decreased with decreasing activity of beta glucosidase in both test years (2015: r = −0.31, p = 0.0004; 2016: r = −030, p = 0.0008). Only in 2016 PDL was positively impacted by the activity of acid phosphomonoesterases (r = 0.21, p = 0.0174).

4. Discussion

In the present study, weed effects on response variables in P cycling were species-specific, inconsistent across years, and partly transient within years. Especially the effect of the experimental year was important on the weeds effects on the P mobilization and maize growth. The contents of plant available P (Figure 1) indicated a P deficiency in 2015 (mean 39 mg kg−1), but a sufficient P supply in 2016 (mean 93 mg kg−1) [34]. This is explained by a larger P solubility caused by more continuous water supply by precipitation in 2016 than in 2015 (Figure 1). The range of Pmic values was low in both experimental years and very similar to Khan and Joergensen [39] in their “no P” treatment in a greenhouse pot experiment. According to Blume and Leinweber, 2009 [40], ACP activities were in a medium range in the first experimental year and in a rather low range in the second year (Figure 4). In contrast to 2015 ACP activities increased plant available P (PDL) in 2016. ALP and BGL activities were generally low but still somewhat larger than in a pot experiment by Eichler et al. [41] (approximately. 27 µg pnp g−1 h−1). These authors reported similar ACP activities under weed-free maize (227 µg pnp g−1 h−1). PDE and BGL activities of the present study (Figure 3) were much lower than average values (PDE: 45 μg pNP g−1 h−1, BGL: 100 μg pNP g−1 h−1) reported by Trasar-Cepeda et al., 2008 [42] for maize rhizosphere soil samples. These differences can be explained by differences in soil properties and the general complexity in the behaviour of soil enzymes [42].
The mycorrhizal colonization, which is one impact factor of P supply to maize [43], ranged from 15 to 30% of the root length in the present experiment (Figure 5) and lies within the medium level of other maize genotypes [44]. The increased mycorrhizal colonization of maize in the presence of weeds (Figure 4), together with increased hydrolytic mobilization and P concentrations in the shoot of maize (Table 3), is in agreement with results by Treseder [7]. She reported an increased P content in plant biomass resulting from increased mycorrhizal colonization of roots. Compared to other taxa, maize as a C4 monocotyledonous plant is particularly suitable for significant effects on plant P uptake by increased ratio of AM root length [7]. Therefore, the promotion of mycorrhiza formation, as it was achieved in mixed growth with weeds in the present study, corresponds to the promotion of maize growth in inoculation experiments [45,46]. E. crus-galli, which also belongs to the commonly mycorrhized C4 grasses, was most efficient in promoting the mycorrhizal colonization of maize (Figure 5) and the P mobilization in the soil (Figure 2 and Figure 4b). However, this weed species is known to be highly competitive and might take up to 60–80% of the available nitrogen from the soil [47]. It is therefore plausible that E. crus-galli did not promote but repress maize growth despite its promotion of mycorrhiza formation in maize (Table 2). AM colonization also plays an important role in Zn accumulation of plants. Lehmann et al. [48] indicated increasing Zn concentrations in various plant tissues with increasing AM colonization of roots. Zahng et al. [49] also showed positive relations between shoot Zn accumulation and AM colonization. These findings confirm the results of the present study, in which higher AM colonization not only increased P- but also Zn-uptake by maize.
In summary, the weed-specific mycorrhizal dependency was no general indicator of the magnitude of its impact on the mycorrhizal colonization of maize in mixed growth. Thus, rather plant diversity in general rather than the degree of plant-specific mycorrhizal colonization might have promoted the AM fungi (Figure 5). Increased mycorrhizal colonization of maize was associated with an increased P mobilization in the soil. This confirms similar data by Treseder [7] on increased root colonization densities, resulting in an improved P supply to plants. Significantly increased hydrolytic P mobilization (Figure 4) in soil linked with increased P availability (Figure 2), mycorrhizal colonization (Figure 5), and P uptake of maize (Table 3) were revealed in mixed growth with C. album, E. crus-galli, T. perforatum, P. convolvulus, S. nigrum and V. arvensis. This confirms results of [25], who assumed that increased plant diversity generally leads to increased P mobilization and P supply to plants. The improved P supply of maize even under nutrient competition by the weeds (Table 3), points to a P mobilization by the weed plants that exceeds their own P uptake.
Although the general impact of mixed growth with weeds was similar between the investigated species, the magnitude of weed impact differed partly significantly between the plant species (Figure 2, Figure 3 and Figure 4). This confirms that species-specific differences exist in the efficiency of P mobilization, but also that different combinations differ in their joint efficiency of P use from soil as described. The authors of [50] revealed this e.g., for intercropping arable crop species.
To our knowledge, the presented results are the first indication of improved P supply of maize in association with weeds. However, the improved P supply was connected with N competition and differed weed species-specifically (Table 3). Therefore, we also confirmed the expected growth reduction of maize in association with weeds [50] in the majority of the combinations tested.
In the The present approach involving determinations of chemical, microbial and enzymatic soil parameters, mycorrhizal colonization and P uptake by the field crop maize was suitable to examine weed-species-specific impacts on the P mobilization in the rhizosphere and the agronomically important P supply to maize.
Growing maize together with weeds can increase the P supply to the crop, but the impact is affected by environmental conditions, especially weather. Adverse effects of weeds, like competition for water and nitrogen, can exceed the advantages of mycorrhizal colonization and P mobilization, in particular, under dryer conditions. This pronounced impact of weather conditions strongly demands a repetition of the study over a longer period of time.
In addition, the limited root growth in pots and the artificial weed populations used in the present study indicates the need to evaluate weed impacts on nutrient supply and maize growth under less artificial conditions. Moreover, future investigations should be scaled up to field experiments, which in a subsequent step, take established weed communities into account. In the long run, this will allow the screening of weed communities occurring under field conditions and the evaluation of their benefits and risks in efficiently exploring the soil P reserves.

Author Contributions

Conceived and designed the experiments, A.Z., C.B., and F.d.M.; provided guidance in the whole experimental process, C.B., K.J.D., and B.G.; performed the experiment and analysed the data, A.Z. and F.d.M. All authors have read and agreed to the published version of the manuscript.

Funding

This research was funded by the Leibniz Association within the frame of the Leibniz Science Campus Phosphorus Research Rostock (www.sciencecampus-rostock.de, accessed on 25 June 2021).

Acknowledgments

The authors acknowledge the valuable technical assistance of B. Balz, E. Heilmann (Soil Science, University of Rostock) as well as of J. Bremer, Friederike Bischof and J. Bertram. The authors gratefully acknowledge the Leibniz Association within the frame of the Leibniz Science Campus Phosphorus Research Rostock (www.sciencecampus-rostock.de, accessed on 25 June 2021) for the funding.

Conflicts of Interest

The authors declare no conflict of interest.

References

  1. Cordell, D.; Drangert, J.-O.; White, S. The story of phosphorus: Global food security and food for thought. Glob. Environ. Chang. 2009, 19, 292–305. [Google Scholar] [CrossRef]
  2. Dawson, C.J.; Hilton, J. Fertiliser availability in a resource-limited world: Production and recycling of nitrogen and phosphorus. Food Policy 2011, 36, 14–22. [Google Scholar] [CrossRef]
  3. Heckenmüller, M.; Narita, D.; Klepper, G. Global Availability of Phosphorus and Its Implications for Global Food Supply: An Economic Overview; EconStor, Kiel Working Papers 1897; Kiel Institute for the World Economy: Kiel, Germany, 2014. [Google Scholar]
  4. Simpson, R.J.; Oberson, A.; Culvenor, R.A.; Ryan, M.H.; Veneklaas, E.J.; Lambers, H.; Lynch, J.P.; Ryan, P.R.; Delhaize, E.; Smith, F.A.; et al. Strategies and agronomic interventions to improve the phosphorus-use efficiency of farming systems. J. Plant Nutr. Soil Sci. 2011, 349, 89–120. [Google Scholar] [CrossRef]
  5. Roberts, T.L.; Johnston, A.E. Phosphorus use efficiency and management in agriculture. Resour. Conserv. Recycl. 2015, 105, 275–281. [Google Scholar] [CrossRef]
  6. Brümmer, G.W. Phosphor. In Scheffer Schachtschabel Lehrbuch der Bodenkunde, 16th ed.; Blume, H.P., Brümmer, G.W., Horn, R., Kandeler, E., Kögel-Knabner, I., Kretzschmar, R., Stahr, K., Wilke, B.-M., Eds.; Spektrum Akademischer Verlag: Heidelberg, Germany, 2009; pp. 412–421. [Google Scholar]
  7. Treseder, K.K. The extent of mycorrhizal colonization of roots and its influence on plant growth and phosphorus content. Plant Soil 2013, 371, 1–13. [Google Scholar] [CrossRef] [Green Version]
  8. Nannipieri, P.; Giagnoni, L.; Landi, L.; Renella, G. Role of phosphatase enzymes in soil. In Phosphorus in Action; Bünemann, E.K., Oberson, A., Frossard, E., Eds.; Soil Biology; Springer: Berlin/Heidelberg, Germany, 2011; Volume 26, pp. 215–243. [Google Scholar]
  9. Dinkelaker, B.; Marschner, H. In vivo demonstration of acid phosphatase activity in the rhizosphere of soil-grown plants. Plant Soil 1992, 144, 199–205. [Google Scholar] [CrossRef]
  10. Tarafdar, J.C.; Marschner, H. Phosphatase activity in the rhizosphere of VA-mycorrhizal wheat supplied with inorganic and organic phosphorous. Soil Biol. Biochem. 1994, 26, 387–395. [Google Scholar] [CrossRef]
  11. Tarafdar, J.C.; Claassen, N. Organic phosphorus compounds as a phosphorus source for higher plants through the activity of phosphatases produced by plant roots and microorganisms. Biol. Fertil. Soils 1988, 5, 308–312. [Google Scholar] [CrossRef]
  12. Ho, I. Acid phosphatase activity in forest soil. For. Sci. 1979, 25, 567–568. [Google Scholar]
  13. Herbien, S.A.; Neal, J.L. Soil pH and phosphatase activity. Commun. Soil Sci. Plant Anal. 1990, 21, 439–456. [Google Scholar] [CrossRef]
  14. Li, L.; Tilman, D.; Lambers, H. Plant diversity and overyielding: Insights from belowground facilitation of intercropping in agriculture. New Phytol. 2014, 203, 63–69. [Google Scholar] [CrossRef]
  15. Kruse, J.; Abraham, M.; Amelung, W.; Baum, C.; Bol, R.; Kühn, O.; Lewandowski, H.; Niederberger, J.; Oelmann, Y.; Rüger, C.; et al. Innovative methods in soil phosphorus research: A review. J. Plant Nutr. Soil Sci. 2015, 178, 43–88. [Google Scholar] [CrossRef] [Green Version]
  16. Richardson, A.E.; Simpson, R.J. Soil microorganisms mediating phosphorus availability update on microbial phosphorus. Plant Physiol. 2011, 156, 989–996. [Google Scholar] [CrossRef] [Green Version]
  17. Johnson, N.C.; Rowland, D.L.; Corkidi, L.; Egerton-Warburton, L.M.; Allen, E.B. Nitrogen enrichment alters mycorrhizal allocation at five mesic to semiarid grasslands. Ecology 2003, 84, 1895–1908. [Google Scholar] [CrossRef]
  18. Khan, K.S.; Joergensen, R.G. Changes in microbial biomass and P fractions in biogenic household waste compost amended with inorganic P fertilizers. Biores. Technol. 2009, 100, 303–309. [Google Scholar] [CrossRef] [PubMed]
  19. Sugito, T.; Yoshida, K.; Takebe, M.; Shinano, T.; Toyota, K. Soil microbial biomass phosphorus as an indicator of phosphorus availability in a Gleyic Andosol. Soil Sci. Plant Nutr. 2010, 56, 390–398. [Google Scholar] [CrossRef]
  20. Kouno, K.; Wu, J.; Brookes, P.C. Turnover of biomass C and P in soil following incorporation of glucose or ryegrass. Soil Biol. Biochem. 2001, 34, 617–622. [Google Scholar] [CrossRef]
  21. Palomo, L.; Claassen, N.; Jones, D.L. Differential mobilization of P in the maize rhizosphere by citric acid and potassium citrate. Soil Biol. Biochem. 2006, 38, 683–692. [Google Scholar] [CrossRef]
  22. Mat Hassan, H.; Marschner, P.; Mc Neill, A. Growth, P uptake in grain legumes and changes in rhizosphere soil P pools. Biol. Fertil. Soils 2012, 48, 151–159. [Google Scholar] [CrossRef]
  23. Maltais-Landry, G.; Scow, K.; Brennan, E. Soil phosphorus mobilization in the rhizosphere of cover crops has little effect on phosphorus cycling in California agricultural soils. Soil Biol. Biochem. 2014, 78, 255–262. [Google Scholar] [CrossRef]
  24. Zimdahl, R.L. Weed-Crop Competition: A Review, 2nd ed.; Blackwell Publishing: Hoboken, NJ, USA, 2008. [Google Scholar]
  25. Hacker, N.; Ebeling, A.; Gessler, A.; Gleixner, G.; González Macé, O.; de Kroon, H.; Lange, M.; Kommer, L.; Eisenhauer, N.; Ravenek, J.; et al. Plant diversity shapes microbe-rhizosphere effects on P mobilisation from organic matter in soil. Ecol. Lett. 2015, 18, 1356–1365. [Google Scholar] [CrossRef]
  26. Weil, R.R. Maize-weed competition and soil erosion in unweeded maize. Trop. Agric. 1982, 59, 207–213. [Google Scholar]
  27. Tabatabai, M.A.; Bremner, J.M. Use of p-nitrophenyl phosphate for assay of soil phosphatase activity. Soil Biol. Biochem. 1969, 1, 301–307. [Google Scholar] [CrossRef]
  28. Eivazi, F.; Tabatabai, M.A. Phosphatases in soils. Soil Biol. Biochem. 1977, 9, 167–172. [Google Scholar] [CrossRef]
  29. Browman, M.G.; Tabatabai, M.A. Phosphodiesterase activity of soils. Soil Sci. Soc. Am. J. 1978, 42, 284–290. [Google Scholar] [CrossRef]
  30. Tabatabai, M.A. Soil enzymes. In Methods of Soil Analysis; Page, A.L., Miller, R.H., Keeney, D.R., Eds.; Part 2; American Society of Agronomy: Madison, WI, USA, 1982; pp. 903–948. [Google Scholar]
  31. Eivazi, F.; Tabatabai, M.A. Glucosidases and galactosidases in soils. Soil Biol. Biochem. 1988, 20, 601–606. [Google Scholar] [CrossRef]
  32. Brookes, P.C.; Powelson, D.S.; Jenkinson, D.S. Measurement of microbial biomass phosphorus in soil. Soil Biol. Biochem. 1982, 14, 319–329. [Google Scholar] [CrossRef]
  33. Riehm, H. Arbeitsvorschrift zur Bestimmung der Phosphorsäure und des Kaliums nach Lactatverfahren. J. Plant Nutr. Soil Sci. 1948, 40, 61–74. [Google Scholar]
  34. VDLUFA. Methodenbuch des Verbandes Deutscher Landwirtschaftlicher Untersuchungs-und Forschungsanstalten 2002/5; VDLUFA-V: Darmstadt, Germany, 2005. [Google Scholar]
  35. Brundrett, M.C.; Piche, Y.; Peterson, R.L. A new method for observing the morphology of vesicular–arbuscular mycorrhizae. Can. J. Bot. 1984, 62, 2128–2134. [Google Scholar] [CrossRef]
  36. McGonigle, T.P.; Miller, M.H.; Evans, D.G.; Fairchild, G.L.; Swan, J.A. A new method which gives an objective measure of colonization of roots by vesicular—arbuscular mycorrhizal fungi. New Phytol. 1990, 115, 495–501. [Google Scholar] [CrossRef]
  37. R Core Team. R: A language and environment for statistical computing. In R-Foundation for Statistical Computing; Version 3.3.2.; R Core Team: Vienna, Austria, 2016. [Google Scholar]
  38. De Mendiburu, F. Agricolae: Statistical Procedures for Agricultural Research, R Package Version 1.2-4; 2016. Available online: https://CRAN.R-project.org/package=agricolae (accessed on 25 June 2021).
  39. Khan, K.S.; Joergensen, R.G. Compost and phosphorus amendments for stimulating microorganisms and growth of ryegrass in a Ferrasol und a Luvisol. J. Plant Nutr. Soil Sci. 2012, 175, 108–114. [Google Scholar] [CrossRef]
  40. Blume, H.P.; Leinweber, P. Beurteilung des Bodens als Wurzel- und Lebensraum. In Bodenkundliches Praktikum, 3rd ed.; Blume, H.P., Stahr, K., Leinweber, P., Eds.; Spektrum Akademischer Verlag: Heidelberg, Germany, 2009; p. 221. [Google Scholar]
  41. Eichler, B.; Caus, M.; Schnug, E.; Köppen, D. Soil acid and alkaline phosphatase activities in regulation to crop species and fungal treatment. Landbauforsch. Volkenrode 2004, 54, 1–5. [Google Scholar]
  42. Trasar-Cepeda, C.; Leirós, M.C.; Gil-Sotres, F. Hydrolytic enzyme activities in agricultural and forest soils. Some implications for their use as indicators of soil quality. Soil Biol. Biochem. 2008, 40, 2146–2155. [Google Scholar] [CrossRef] [Green Version]
  43. Gavito, M.E.; Miller, M.H. Early phosphorus nutrition, mycorrhizae development, dry matter partitioning and yield of maize. Plant Soil 1998, 199, 177–186. [Google Scholar] [CrossRef]
  44. Chu, Q.; Wang, X.; Yang, Y.; Chen, F.; Zhang, F.; Feng, G. Mycorrhizal responsiveness of maize (Zea mays L.) genotypes as related to releasing date and available P content in soil. Mycorrhiza 2013, 23, 497–505. [Google Scholar] [CrossRef] [PubMed]
  45. Zhao, R.; Guo, W.; Bi, N.; Guo, J.; Wang, L.; Zhao, J.; Zhang, J. Arbuscular mycorrhizal fungi affect the growth, nutrient uptake and water status of maize (Zea mays L.) grown in two types of coal mine spoils under drought stress. Appl. Soil Ecol. 2014, 88, 41–49. [Google Scholar] [CrossRef]
  46. Hao, X.J.; Hong, J.P.; Zhang, T.Q.; Li, R.; Gao, W.J.; Zheng, Z.M. Effects of arbuscular mycorrhizal fungal inoculation and phosphorus (P) addition on maize P utilization and growth in reclaimed soil of a mining area. Commun. Soil Sci. Plant Anal. 2014, 45, 2413–2428. [Google Scholar] [CrossRef]
  47. Holm, L.G.; Plucknett, D.L.; Pancho, J.V.; Herberger, J.P. The World’s Worst Weeds: Distribution and Biology; University Press of Hawaii: Honolulu, HI, USA, 1977. [Google Scholar]
  48. Lehmann, A.; Veresoglou, S.D.; Leifheit, E.F.; Rillig, M.C. Arbuscular mycorrhizal influence on zinc nutrition in crop plants-a meta-analysis. Soil Biol. Biochem. 2014, 69, 123–131. [Google Scholar] [CrossRef]
  49. Zhang, W.; Chen, X.X.; Liu, Y.M.; Liu, D.Y.; Chen, X.P.; Zou, C.Q. Zinc uptake by roots and accumulation in maize plants as affected by phosphorus application and arbuscular mycorrhizal colonization. Plant Soil. 2017, 413, 59–71. [Google Scholar] [CrossRef]
  50. Hinsinger, P.; Betencourt, E.; Bernard, L.; Brauman, A.; Plassard, C.; Shen, J.; Tang, X.; Zhang, F. P for two, sharing a scarce resource: Soil phosphorus acquisition in the rhizosphere of intercropping species. Plant Physiol. 2011, 156, 1078–1086. [Google Scholar] [CrossRef] [Green Version]
Figure 1. Daily temperature (°C) and precipitation (mm) during the pot experiments (6 kg of a P deficient loamy sand per pot) under semi field conditions in 2015 and 2016. (Arrow 1: sowing, 2: weed germination, 3: 1st sampling, 4: 2nd sampling, 5: 3rd sampling).
Agronomy 11 01304 g001
Figure 2. Content of plant available P (PDL) in rhizosphere soil (mg kg−1) in weed-free growth (C) and mixed growth with weeds in dependence of the growth stage in a pot experiment (6 kg of a P deficient loamy sand per pot) under semi field conditions in 2015 and 2016. Values are expressed as means ± SD. Lower letters indicate significant differences (p < 0.05, Kruskal-Wallis test in 2015, Tukey test in 2016, n = 42) (C: control, +EC: maize + Echinochloa crus-galli, +CA: maize + Chenopodium album, +TP: maize + Tripleurospermum perforatum, +PC: maize + Polygonum convolvulus, +SN: maize + Solanum nigrum, +VA: maize + Viola arvensis).
Agronomy 11 01304 g002
Figure 3. Content of microbial biomass P (Pmic) in soil (mg kg−1) in weed-free growth (C) and mixed growth with weeds in dependence of the growth stage in a pot experiment (6 kg of a P deficient loamy sand per pot) under semi field conditions in 2015 and 2016. Values are expressed as means ± SD. Lower letters indicate significant differences (p < 0.05, Kruskal-Wallis test, n = 42). (C: control, +EC: maize + Echinochloa crus-galli, +CA: maize + Chenopodium album, +TP: maize + Tripleurospermum perforatum, +PC: maize + Polygonum convolvulus, +SN: maize + Solanum nigrum, +VA: maize + Viola arvensis, * below level of detection).
Agronomy 11 01304 g003
Figure 4. Activity of acid (ACPa, a), alkaline phosphomonoesterases (ALPa, b), phosphodiesterase (PDEa, c) and beta glucosidase (BGLa, d) in soil (µg pnp g−1 h−1) in weed-free growth (c) and mixed growth with weeds in dependence of the growth stage in a pot experiment (6 kg of a P deficient loamy sand per pot) under semi field conditions in 2015 and 2016. Values are expressed as means ± SD. Lower letters indicate significant differences (p < 0.05, Tukey test, n = 42). (C: control, +EC: maize + Echinochloa crus-galli, +CA: maize + Chenopodium album, +TP: maize + Tripleurospermum perforatum, +PC: maize + Polygonum convolvulus, +SN: maize + Solanum nigrum, +VA: maize + Viola arvensis).
Agronomy 11 01304 g004aAgronomy 11 01304 g004b
Figure 5. Colonization of maize roots with arbuscular mycorrhizal fungi (%) in weed-free growth (C) and mixed growth with weeds in a pot experiment (6 kg of a P deficient loamy sand per pot) under semi field conditions in 2015 and 2016. Values are expressed as means ± SD. Lower letters indicate significant differences (p < 0.05, Tukey test, n = 42). (C: control, +EC: maize + Echinochloa crus-galli, +CA: maize + Chenopodium album, +TP: maize + Tripleurospermum perforatum, + PC: maize + Polygonum convolvulus, + SN: maize + Solanum nigrum, + VA: maize + Viola arvensis).
Agronomy 11 01304 g005
Table 1. Colonization of weed roots with arbuscular mycorrhizal fungi (%) in a pot experiment (6 kg of a P deficient loamy sand per pot) under semi field conditions in 2015 and 2016. Values are expressed as means ± (SD). Lower letters indicate significant differences (p < 0.05, Kruskal-Wallis test, n = 42). (EC: Echinochloa crus-galli, CA: Chenopodium album, TP: Tripleurospermum perforatum, PC: Polygonum convolvulus, SN: Solanum nigrum, VA: Viola arvensis).
YearSampling
(Weeks of Growth)
TreatmentMycorrhizal Root Length (%)
20154 weeksEC25.7 (7.7)a
CA0.0 (0)c
TP33.3 (15.2)a
PC0.0 (0)c
SN5.4 (1.4)b
VA5.1 (1.2)b
8 weeksEC17.3 (6.4)b
CA4.4 (2.3)b
TP14.7 (6.9)a
PC0.6 (0.9)c
SN4.7 (4.0)b
VA4.4 (2.8)b
20164 weeksEC20.3 (4.2)a
CA5.2 (3.9)b
TP19.3 (2.4)a
PC0.3 (0.6)c
SN0.3 (0.8)b
VA1.4 (1.0)b
8 weeksEC16.4 (2.6)a
CA1.3 (1.0)c
TP10.0 (1.9)b
PC0.0 (0)d
SN1.0 (1.8)cd
VA1.8 (1.5)c
Table 2. Maize growth parameters (mean with standard deviation in parentheses) in weed-free growth (C) and mixed growth with weeds (+EC, +CA, +TP, +PC, +SN, +VA) in a pot experiment under semi-field conditions for 12 weeks at a P deficient soil in Northern Germany in 2015 and 2016. Lower letters indicate significant differences (p < 0.05, Kruskal Wallis test, n = 42). (C: control, +EC: maize + Echinochloa crus-galli, +CA: maize + Chenopodium album, +TP: maize + Tripleurospermum perforatum, +PC: maize + Polygonum convolvulus, +SN: maize + Solanum nigrum, +VA: maize + Viola arvensis).
YearTreatmentShoot
Dry Matter
Root
Dry Matter
Root to Shoot Ratio Root Length Density
(g) (g) (cm cm−3)
2015C11.27 (3.33) a8.80 (1.78)a0.82 (0.26)b1.41 (0.40)ab
+EC7.41 (5.94)d6.62 (4.08)bc1.03 (0.84)b1.57 (0.36)ab
+CA3.73 (0.87)e4.05 (0.57)c1.09 (0.13)a0.99 (0.25)abc
+TP5.87 (1.31)d6.10 (2.81)bc1.10 (0.66)ab0.96 (0.33)bc
+PC7.13 (4.20)cd4.56 (1.90)bc0.78 (0.23)b0.92 (0.33)bc
+SN8.09 (2.41)bc5.57 (1.16)b0.74 (0.17)b0.65 (0.21)c
+VA8.41 (1.91)ab5.71 (1.05)b0.70 (0.19)b1.20 (0.36)abc
2016C26.52 (25.91)ab12.50 (6.40)a0.58 (0.21)a3.46 (1.03)ab
+ EC37.38 (36.29)b9.42 (5.06)ab0.29 (0.06)bc4.00 (1.05)ab
+CA26.67 (30.53)c12.31 (13.97)ab0.49 (0.12)a2.27 (0.99)b
+TP18.17 (23.15)bc6.43 (4.96)b0.41 (0.13)ab3.35 (0.90)ab
+PC34.86 (37.54)b10.19 (6.01)ab0.34 (0.12)b2.26 (0.99)b
+SN29.59 (25.23)ab8.04 (2.66)ab0.32 (0.11)b4.01 (0.96)a
+VA53.45 (35.97)a10.98 (4.63)ab0.21 (0.05)c4.07 (2.10)a
Table 3. Nutrient concentrations (N (g kg−1), P, K, C, Mg, Zn (mg kg−1)) of maize shoots in weed-free growth (C) and mixed growth with weeds (+ EC, +CA, +TP, +PC, +SN, +VA) in a pot experiment (6 kg of a P deficient loamy sand per pot) under semi field conditions in 2015 and 2016. Values are expressed as means ± SD. Lower letters indicate significant differences (p < 0.05, Kruskal-Wallis test, n = 42). (C: control, +EC: maize + Echinochloa crus-galli, +CA: maize + Chenopodium album, +TP: maize + Tripleurospermum perforatum, +PC: maize + Polygonum convolvulus, +SN: maize + Solanum nigrum, +VA: maize + Viola arvensis).
YearTreatmentNutrient Concentration in Maize Shoots
NPKCaMgZn
(g kg−1)
2015C8.74(0.86)abc2.13(0.38)d18.33(1.58)a2.95(0.45)a2.11(0.20)ab0.018(0.005)c
+EC9.64(1.96)a2.49(0.49)bc18.88(1.88)ab2.61(0.77)a2.07(0.32)ab0.020(0.003)b
+CA9.65(1.26)a2.95(0.36)a18.06(1.51)a2.57(0.54)a2.17(0.25)a0.042(0.036)a
+TP9.11(0.76)ab2.31(0.29)bcd18.35(2.16)a2.65(0.39)a2.12(0.21)ab0.020(0.001)b
+PC8.96(1.55)abc2.57(0.39)b17.29(2.18)abc2.44(0.58)a2.11(0.22)ab0.022(0.003)b
+SN8.46(1.01)bc2.20(0.30)cd16.05(1.84)bc2.32(0.56)a1.90(0.22)ab0.018(0.001)b
+VA8.42(1.06)c2.11(0.22)c15.54(1.62)c2.40(0.65)a1.87(0.16)b0.018(0.002)b
2016C6.89(0.87)a2.25(0.52)c10.46(1.66)a2.22(0.88)a1.56(0.51)ab0.020(0.003)b
+EC7.28(1.43)a2.65(0.60)ab10.03(1.40)a2.42(0.68)a1.71(0.46)a0.022(0.008)ab
+CA7.38(1.06)a2.37(0.59)a10.49(1.16)a1.98(0.68)a1.62(0.49)a0.019(0.006)a
+TP6.99(1.93)a2.34(0.38)bc9.86(1.03)a2.23(0.32)a1.69(0.36)a0.019(0.003)ab
+PC7.14(1.42)a2.46(0.35)ab11.62(1.64)a2.03(0.60)a1.55(0.43)ab0.017(0.002)b
+SN7.11(1.44)a2.32(0.51)bc9.97(1.73)a2.36(0.50)a1.53(0.35)ab0.019(0.004)ab
+VA7.90(1.38)a2.42(0.56)c10.44(1.63)a2.01(0.57)a1.35(0.39)b0.020(0.003)ab
Publisher’s Note: MDPI stays neutral with regard to jurisdictional claims in published maps and institutional affiliations.

