Article

The Effect of Alfalfa Mineral Fertilization and Times of Soil Sampling on Enzymatic Activity

1
Institute of Agriculture and Horticulture, Faculty of Agrobioengineering and Animal Husbandry, Siedlce University of Natural Sciences and Humanities, B. Prusa 14, 08-110 Siedlce, Poland
2
JARS S.A., Kościelna 2a, 05-119 Legionowo, Poland
*
Author to whom correspondence should be addressed.
Agronomy 2021, 11(7), 1335; https://doi.org/10.3390/agronomy11071335
Submission received: 12 May 2021 / Revised: 20 June 2021 / Accepted: 28 June 2021 / Published: 30 June 2021
(This article belongs to the Section Grassland and Pasture Science)

Abstract

:
This study examined changes in soil enzymatic activity caused by constant mineral fertilization with NPK and diversified fertilization with Fe and Mo micronutrients. A field experiment was conducted in a completely randomized design with four replications in Siedlce (central-eastern Poland) between 2012 and 2014. Alfalfa (Medicago sativa L.) was used as the test plant. The first factor consisted of fertilization treatments: control; NPK; NPKFe1; NPKMo1; NPKFe1Mo1; NPKFe2; NPKMo2, and NPKFe2Mo2. The second factor was composed of the time of soil sampling (15 August 2012, 20 September 2012, 17 June 2013, and 20 July 2014). Mineral fertilization was applied: N-20; P-22; K-124.5; Fe1-0.5; Mo1-0.5; Fe2-1.0; Mo2-1.0 kg ha−1. Application of molybdenum (Mo2-1.0 kg ha−1) in alfalfa fertilized with NPK was optimal for obtaining the beneficial nitrogenase activity. The applied NPKFe1Mo1 fertilization in alfalfa cultivation was optimized to achieve high dehydrogenases activity, alkaline phosphatase activity, and acid phosphatase activity. The highest of soil urease activity was determined in soil fertilized with NPKFe2Mo2. The biochemical index (BCHI) of soil fertility reached its highest mean value (254.9) after applying the NPKFe1Mo1. A high BCHI soil fertility index indicates the possibility of generating high alfalfa yields and maintaining good soil culture.

1. Introduction

In recent years, there has been an increasing interest in growing legumes as cultivated plants. Mineral fertilization of leguminous plants significantly differentiates the enzymatic activity of soil as well as the quality and quantity of the yield [1,2,3].
Iron and molybdenum are micronutrients, having a decisive effect on the amount of nitrogen fixed by legume plants [4]. Those nutrients are mainly necessary in the synthesis of nitrogenase, consisting of two protein complexes. The Mo-Fe protein is an enzyme responsible for N2 fixation, whereas the Fe protein provides electrons necessary for this process. Iron application is important for alfalfa because this chemical element turns into unavailable forms in soils with a higher pH and high calcium content. Applied in alfalfa cultivation, iron affects soil enzymatic activity and thus the potential viability of plants to grow [5,6,7]. According Siczek et al. [8], soil enzymes are similar to enzymes in other living organisms (e.g., in plants). Enzymes catalyze reactions breaking down organic matter, and their presence in soil is an indicator of its biochemical and microbial soil activity [9,10,11]. Garbuz et al. [12] points out that the diversification of enzymatic activity depends on the physical condition, and it is higher in moist soil. The moist soil was characterized by higher enzymatic activity. According to many authors, the tillage system influences the increase in the activity of soil enzymes [13,14]. Additionally, the level of enzymatic activity depends on the time when soil is sampled [9,15]. Plant species and long-term effects of fertilizer treatment may cause qualitative variability of soil microorganisms [7]. Many studies have proved that increasing soil organic matter content by the addition of organic manures can increase the biological activity in soil. Ploughed-in crop residues affect the diversity and abundance of soil fungal and bacterial communities and enzymatic activity [8].
According to Adetunji et al. [1], urease and phosphatase activities were stimulated by all crop species. Unlike urease, all crop residues had a positive impact on phosphatase activity at one year. The above authors found that at the end of the growing season, the activity of phosphatase and N concentration were higher than during the flowering phase. Harvesting methods had no effect on soil N, urease and phosphatase activity. According to Harasim et al. [10], conservation tillage stimulated significantly increased dehydrogenase and urease activity in topsoil and in deeper soil layers [10]. In the studies, Piotrowska-Długosz and Wilczewski [15], the activities of soil enzymes specifically related to the cycles of C, N and P responded in different ways to the rates of mineral N fertilizer applied along with green manure. Positive correlations between dehydrogenases activity and urease activity were observed by Harasim et al., Lauber et al., and Radulov et al. [10,16,17].
Balanced and complete fertilizer treatment of alfalfa is poorly investigated and to our knowledge, no studies on the impact of mineral fertilization on the enzymatic activity have been conducted yet.
The objective of this study was to determine the impact of NPKFeMo fertilization applied to alfalfa (Medicago sativa L.) on the activity of selected soil enzymes, and biochemical index of soil fertility.

2. Materials and Methods

2.1. Experimental Site and Treatments

The experiment was conducted on a Hortic Anthrosol (according to the IUSS World Reference of Soil Resources) [18] in Siedlce, Poland (52°17′ N, 22°28′ E). Developed from loamy sand, the soil had the granulometric composition of sand, silt, and clay: 79, 13, and 8%, respectively. Its chemical composition was optimal for the growth and development of alfalfa (Table 1). The experiment was conducted in a completely randomized design with four replications composed of two factors. The first factor consisted of the following treatments: control; NPK; NPKFe1; NPKMo1; NPKFe1Mo1; NPKFe2; NPKMo2, and NPKFe2Mo2. The second factor was the time of soil sampling: (15 August 2012, 20 September 2012, 17 June 2013, and 20 July 2014). Mineral fertilizers were applied each year at the following doses (kg ha−1): N-20, P-22, and K-124.5. Nitrogen was applied in the early spring as 34% ammonium nitrate; phosphorus in autumn as 46% triple superphosphate, and potassium as 60% potassium chloride in two doses, (the first in the early spring at 80 kg ha−1, the other after the first harvest at 44.5 kg ha−1). The application of Mo and Fe as FeSO4 7H2O (20.2% Fe) and (NH4)6Mo7O24 4H2O (54% Mo) was split into two doses (0.5 and 1.0 kg ha−1). At a seeding rate of 30 kg ha−1, alfalfa cv. Verko was sown in experimental plots of 3 m2 according to the recommended date in 2012. Bacterial vaccine Nitragina containing Rhizobium meliloti was introduced to soil together with the seeds. Alfalfa is cultivated in Poland to be used in the form of dried biomass as a protein supplement for animals.

2.2. Soil Sampling and Analyses

Soil samples were collected at the following times: August 2012, September 2012, June 2013, and July 2014 from a depth of 0–30 cm. The total carbon and nitrogen content in the soil was determined with a Perkin Elmer (Waltham, MA, USA) CHNS/O 2400 auto analyzer coupled with a thermal conductivity detector (TCD), and by using acetanilide as the reference material. Organic carbon was measured by applying oxidation-titrimetric method according to Kalembasa [19]. In this method, potassium dichromate and an acid mixture (sulphuric acid and phosphoric acid—5:1) were added to soil. In the presence of N-phenyl antranilic acid as indicator, the suspension in the flask was titrated with Mohr’s salt until the color changed to green. The content of available phosphorus and potassium in the soil was determined with the Egner–Riehm method (DL), magnesium with the Schatschabel method, available iron and molybdenum using 1M HCl, and available forms P, K, Mg, Fe, and Mo with the ICP-AES method, with an inductively excited plasma atomic emission spectrometer (Optima 3200 RL, PerkinElmer, Waltham, MA, USA). Soil pH was determined with the potentiometric method in 1 M KCl. The air-dry soil to solution ratio was 1:2.5 (m/v).
Measurements of the activity of all enzymes (nitrogenase, urease, dehydrogenases, alkaline phosphatase, and acid phosphatase) were performed in triplicate.
The intensity of the biological nitrogen fixation was assessed on the basis of the intensity of acetylene to ethylene reduction. Soil was incubated with C2H2 for 24 h. Soil nitrogenase activity was measured by an acetylene to ethylene reduction assay, using a CSI gas chromatographer with an FID (Flame Ionization Detector) in the Department of Agricultural Microbiology of the Institute of Soil Science and Plant Cultivation, State Research Institute in Puławy (Poland).
Urease activity was determined by the colorimetric method, according to Alef and Nannipieri [20]. Soil was incubated with an aqueous urea solution. After incubation, citrate buffer was added and urease activity was determined.
Dehydrogenases activity was determined by the colorimetric method according to Casida et al. [21] and Wolińska et al. [22]. During the incubation, TTC (2,3,5-triphenol tetrazolium chloride) was applied as a substrate reduced to TPF (triphenyl formazan) during incubation. All colorimetric compounds were determined with a spectrophotometer UV-VIS Lambda 25 (PerkinElmer, Waltham, MA, USA).
The activity of acid phosphatase and alkaline phosphatase was determined by incubating a reactive mixture containing soil and substrate. With disodium 4-nitrophenol phosphate hexahydrate in modified universal buffer (MUB) as a substrate, the Page [23] method was used for determination of acid phosphatase activity (at pH 6.5) and alkaline phosphatase activity (at pH 11). The color intensity (yellow) as an effect of released p-nitrophenol was then measured spectrophotometrically.

2.3. Biochemical Index of Soil Fertility

The biochemical index of soil fertility (BCHI) was calculated according to Kucharski et al. [24]: BCHI = (nitrogenase 10−1 + urease 10−1 + dehydrogenases + alkaline phosphatase + acid phosphatase) organic carbon content (%).

2.4. Weather Conditions

Data on hydrological and meteorological conditions were provided by the Institute of Meteorology and Water Management in Warsaw, the Hydrological and Meteorological Station in Siedlce (Table 2). In the years of research in individual months, average temperatures in the growing seasons coincided with the average values of multi-annual temperatures. The months with the highest average temperatures were July (19.9 °C) and August (18 °C). The lowest temperatures in the growing seasons were recorded in April (the average of 8.7 °C). An analysis of the sums of atmospheric precipitation showed that they were significantly varied across growing periods. The lowest amount of rainfall was recorded in 2012 (mean 543.7 mm), and the highest in 2013 (the average of 682.4 mm). Average values of precipitation in the years of the experiment were lower than the average multi-annual rainfall (the mean of 765 mm).
Sielianinov’s hydrothermal coefficient (K) for individual years is presented in Table 2 [25]. To calculate it, the following formula was applied:
K = (Mo · 10)/(Dt · days)
where K—hydrothermal coefficient for individual months; Mo—total monthly precipitation; Dt—mean daily temperatures in a particular month.

2.5. Statistical Analysis

The results were statistically analyzed using the analysis of variance for a two-factor experiment, available in the ANOVA program. The least significant differences (LSD) were determined using the Tukey’s test at the significance level of p ≤ 0.05. Linear regression equations and correlation coefficients between selected parameters were determined by using Statistica 13.1 software package (StatSoft Inc., Tulsa, OK, USA) for calculations.

3. Results

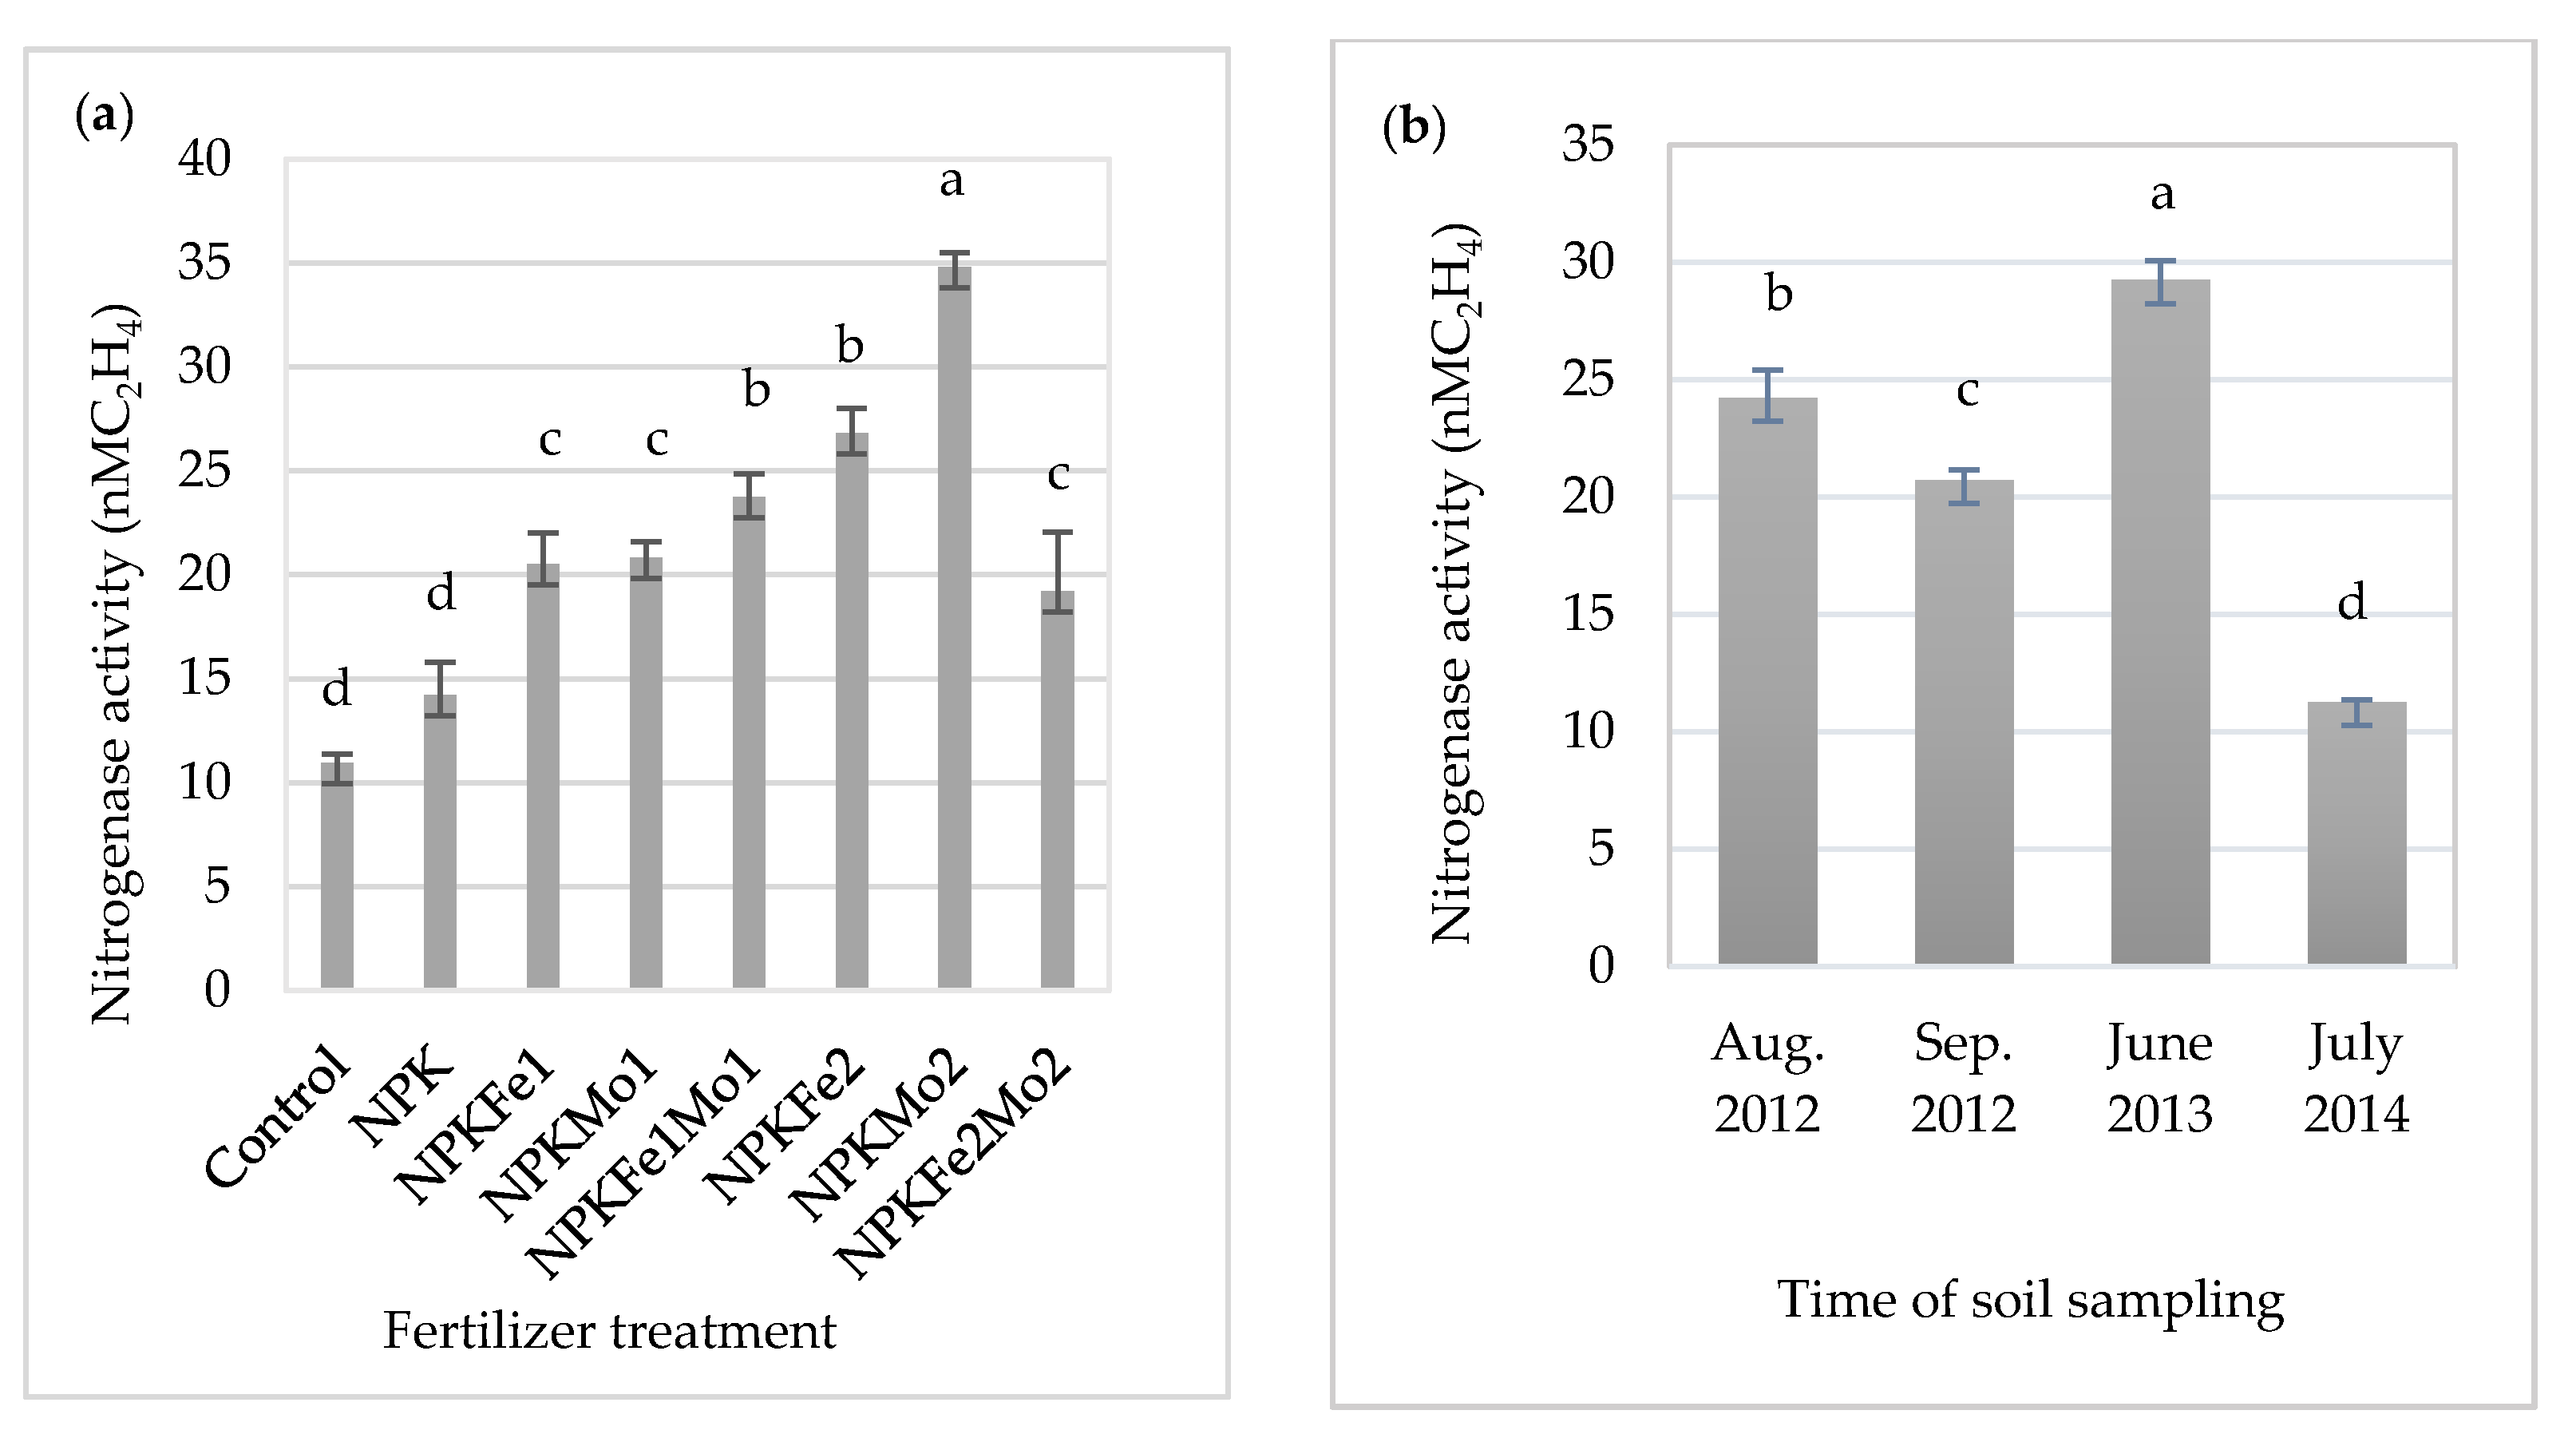
3.1. Nitrogenase Activity

Statistical analysis showed a significant effect of alfalfa fertilizer treatment, the time of soil sampling, and the interaction of the experimental factors on the activity of nitrogenase (Table 3).
The significantly highest mean of nitrogenase activity was recorded in soil fertilized with NPKMo2 (20-22-124.5-1.0 kg ha−1). It was about 3.2-fold more higher than in soil collected from the control plot (Figure 1a). The lowest value (11.28 nM C2H4) was observed in July 2014 (Figure 1b). The effect of soil sampling time on the activity of nitrogenase was dependent on weather conditions during the research year (Table 1).

3.2. Urease Activity

It was found that mineral fertilizer treatment and time of soil sampling significantly differentiated urease activity (Table 4).
In the fertilized soil, it increased significantly in relation to the control plot (without fertilizer treatment). Mineral fertilizer treatment with NPKFe2Mo2 (20-22-124.5-1.0-1.0 kg ha−1) increased urease activity in soil (by 12.8%), which is the highest in relation to control (Table 4, Figure 2a). However, statistical analysis showed no significant differences between enzymatic activity in the soil collected from different fertilized plots (349.5–353.6 mg N-NH4 h−1 kg−1 DM). Soil collected in September 2012 had the highest mean urease activity, with 350.1 mg N-NH4 h−1 kg−1 dry matter (DM) (Figure 2b). A significantly lower value was recorded in soil collected from the control plot (Table 4, Figure 2a,b).

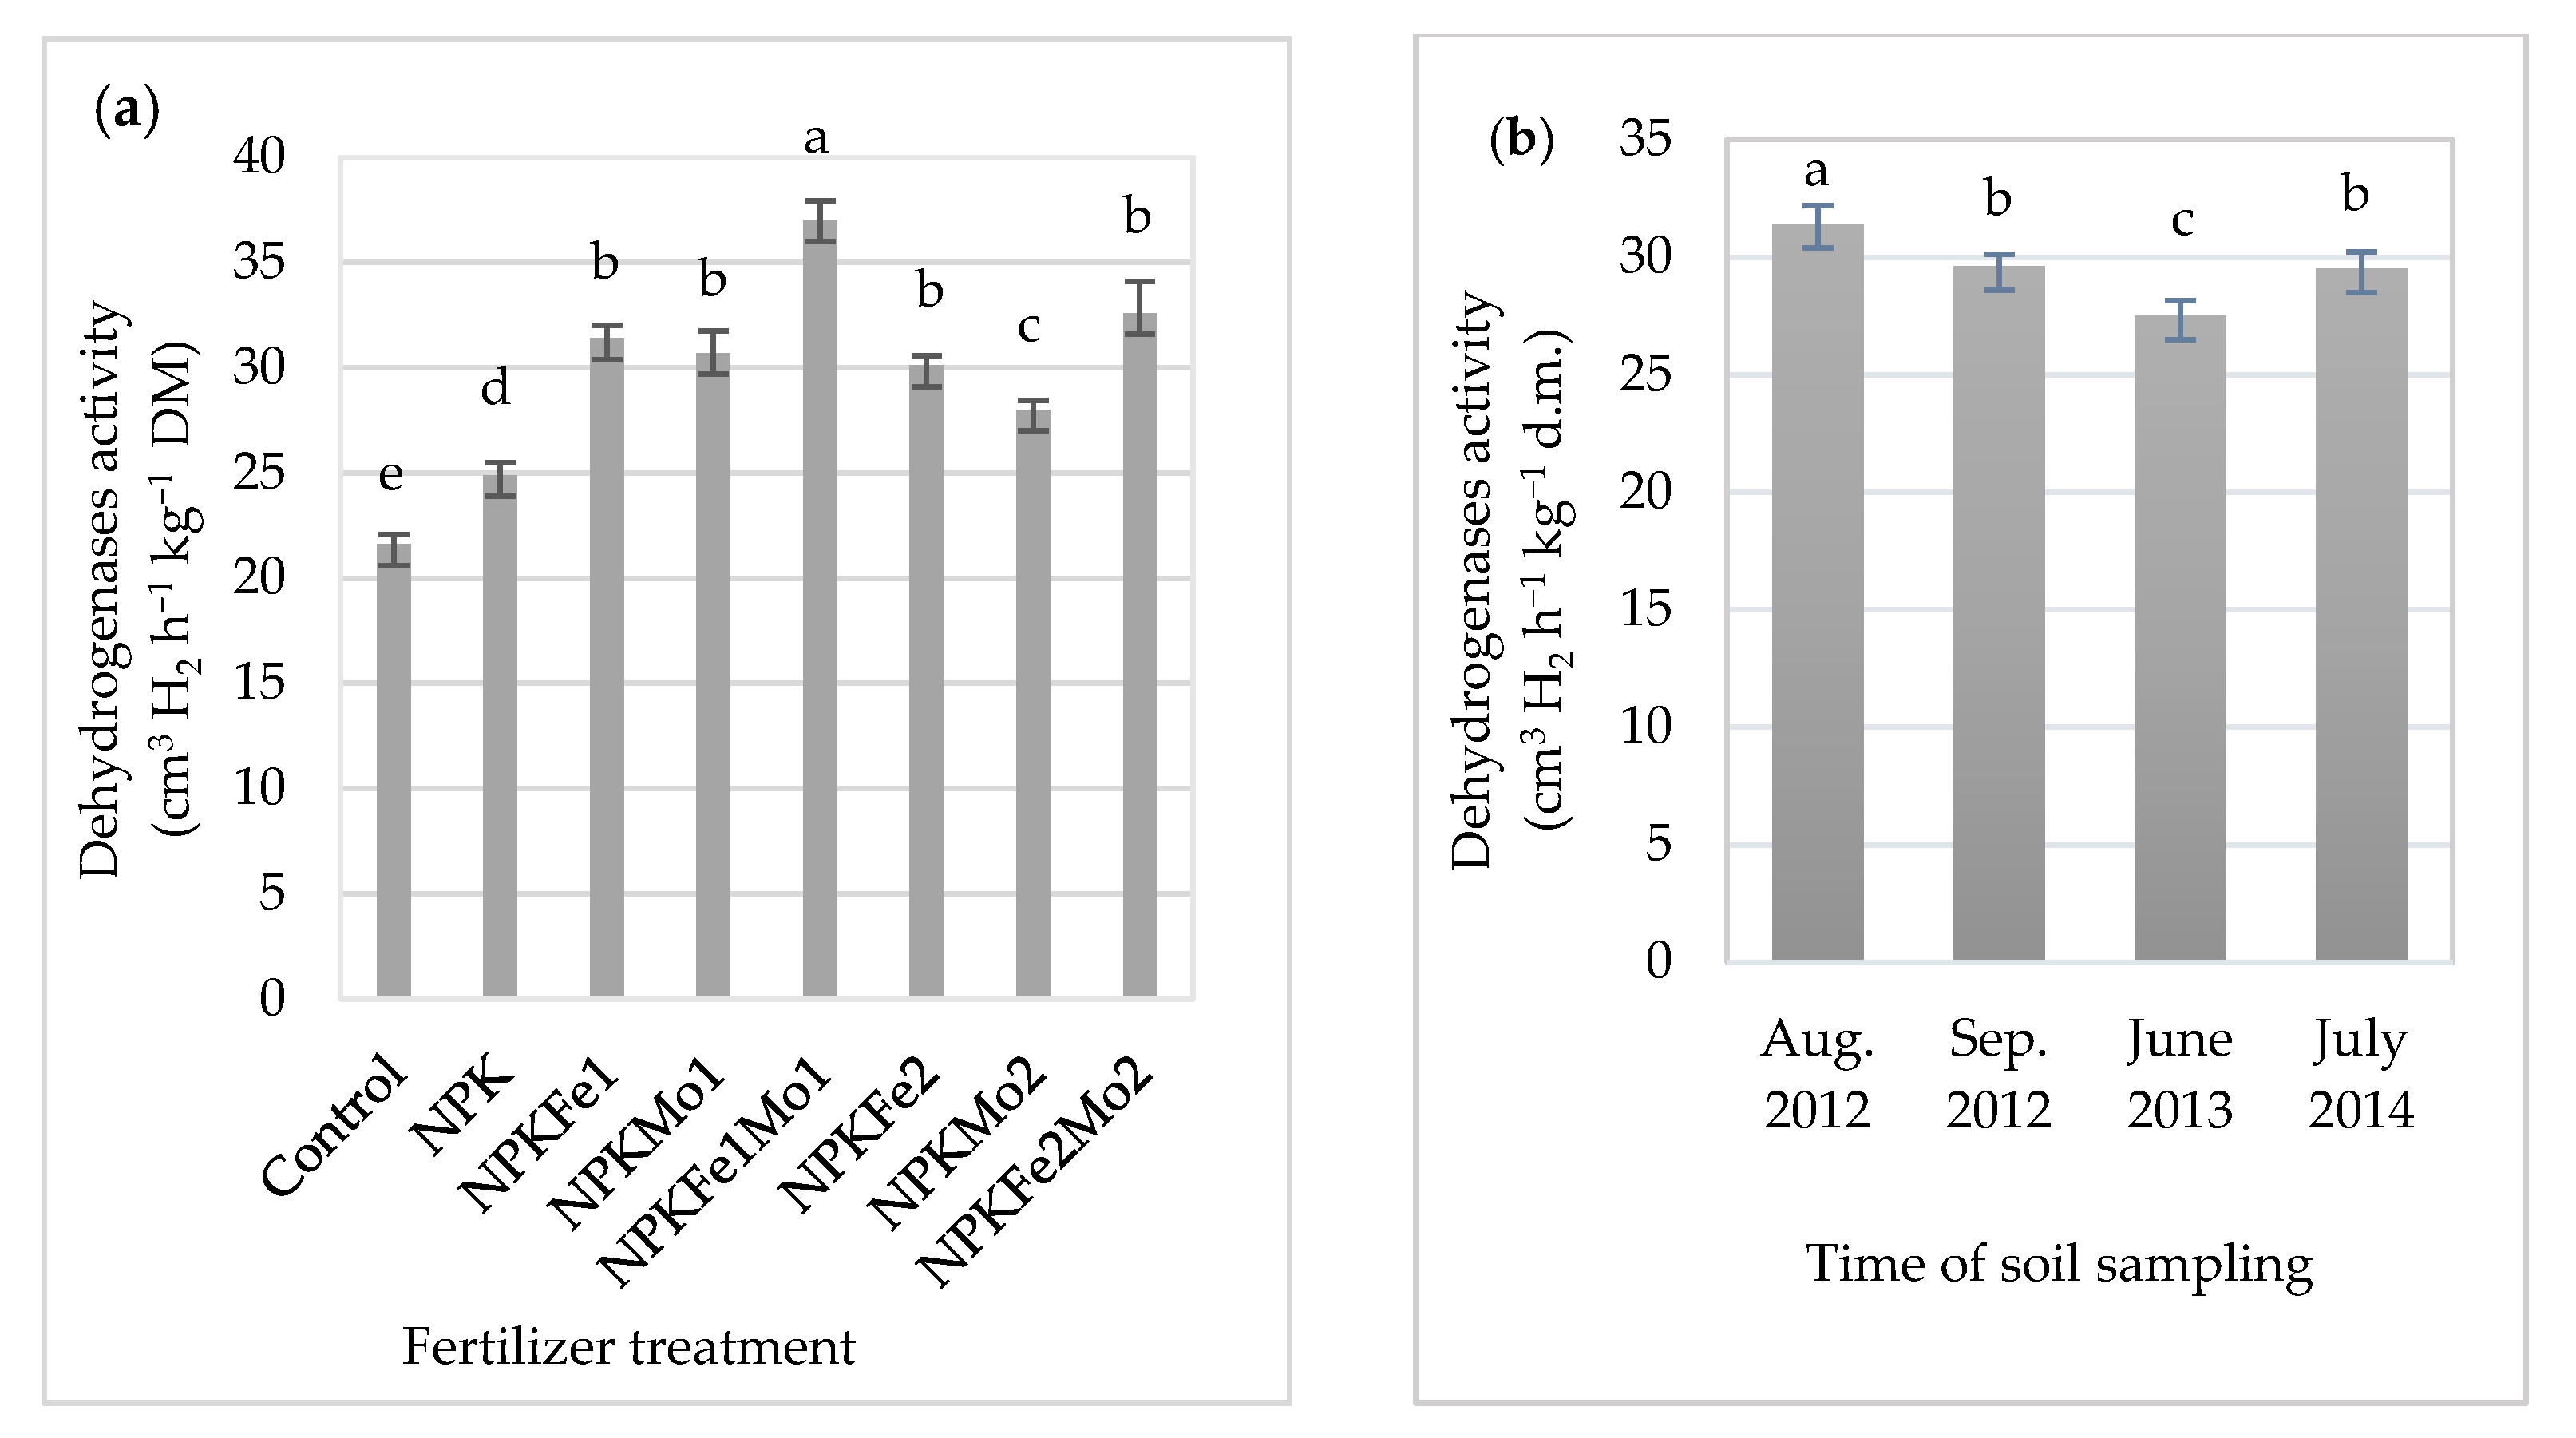
3.3. Dehydrogenases Activity

The statistical analysis showed a significant effect of the applied fertilizers and the time of soil sampling on the activity of dehydrogenases (Table 5).
Soil fertilized with NPKFe1Mo1 was characterized by its highest average activity (Table 5, Figure 3a). It was 71% higher than in soil collected from the control plot. The highest value was recorded in soil collected in August 2012 (31.4 cm3 H2 h−1 kg−1 DM). Considering the interaction of mineral fertilizers and time of soil sampling (Table 5, Figure 3b), it was found that soil fertilized with NPKFe1Mo1 (20-22-124.5-0.5-0.5 kg ha−1) and collected in 2013, July 2014, August 2012, and September 2012 was characterized by the highest activity dehydrogenases, with 35.6, 38.2, 38.3, and 35.9 cm3 H2 h−1 kg−1 DM, respectively (Table 5).

3.4. Alkaline Phosphatase Activity

The mineral fertilizer dose NPKFe1Mo1 (20-22-124.5-0.5-0.5 kg ha−1) applied to alfalfa (Medicago sativa L.) significantly increased the activity of alkaline phosphatase (Table 6 and Figure 4a). However, the use of additional fertilization with iron and molybdenum reduced it.
Its highest (0.71 mmol PNP h−1 kg−1 DM) activity in soil was recorded in September 2012 (Figure 4b). Due to interaction of mineral fertilizers and time of soil sampling, the highest activity of alkaline phosphatase (0.82 mmol PNP h−1 kg−1 DM) was recorded in soil treated with NPKFe1Mo1 and collected in September 2012 (Table 6).

3.5. Acid Phosphatase Activity

The applied mineral fertilizer treatment and the time of soil sampling as well as the interaction of the experimental factors significantly differentiated acid phosphatase activity (Table 7 and Figure 5a,b).
The average acid phosphatase activity was at the level of 0.49 PNP h−1 kg−1 DM. Its highest activity (0.56 mmol PNP h−1 kg−1 DM) was in soil fertilized with NPKFe1Mo1 (20-22-124.5-0.5-0.5 kg ha−1). It was 9.8% higher than the activity of this enzyme in soil with NPKFe2 (20-22-124.5-1.0 kg ha−1). Acid phosphatase activity was at the same level in soil collected in June 2013 and July 2014 (0.48 mmol PNP h−1 kg−1 DM). Its significant increase was recorded in August 2012 (Figure 5b).

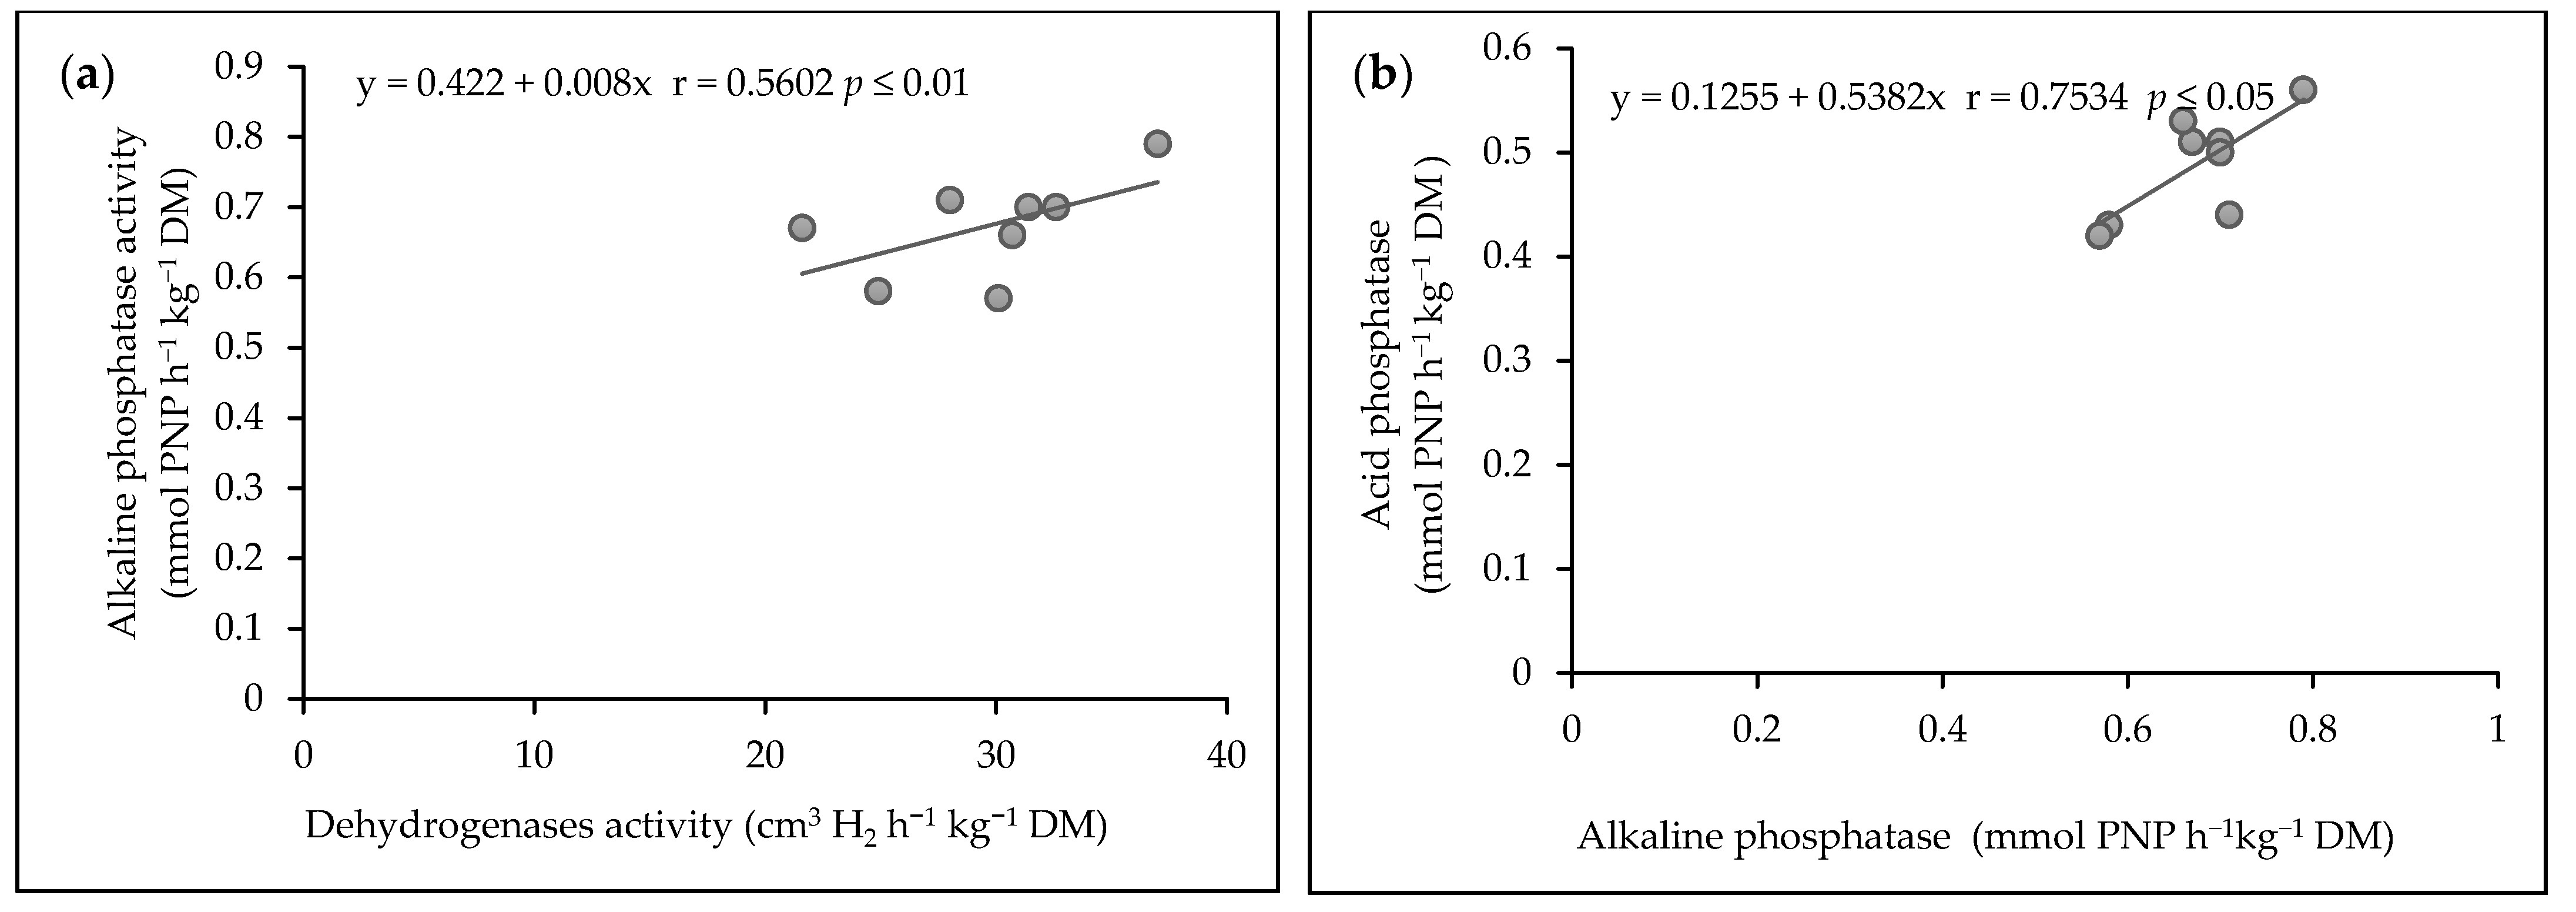
3.6. Correlation between Soil Enzyme Activities

On the basis of the conducted research, significant relationships were found between the activity of the enzymes at p ≤ 0.05 and p ≤ 0.01 (Figure 6). The values of the dehydrogenases activity was correlated with alkaline phosphatase activity in soil (r = 0.5602, p ≤ 0.01). Figure 6a presents this correlation with simple regression equation y = 0.422 + 0.008x (Figure 6a). Acid phosphatase was significantly correlated with alkaline phosphatase activity in the soil (r = 0.7534, p ≤ 0.05). This correlation was confirmed by the linear regression equation: y = 0.1255 + 0.5382x (Figure 6b).

3.7. Total Organic Carbon in Soil

Considering the three-year results, no significant impact of the experimental factors (fertilizer treatment and time of soil sampling) on total organic carbon in soil was found (Table 8). According to the mean values, the highest organic carbon content (3.44%) was in control soil. Across the times of samplings, its highest content was in soil sampled in August (3.32%).
The statistical analysis demonstrated significant differences in organic carbon content in response to different fertilizer treatment and different times of soil sampling The significantly highest value of 3.92% was recorded on the plot with NPKMo1 in June.

3.8. Biochemical Index (BCHI) of Soil Fertility

The biochemical index of soil fertility based on the experiment results (Table 9) was at a high level (ranging on average from 189.9 to 254.9). The mineral fertilizer treatment of NPK Fe1Mo1 resulted in its high values, with the mean of 254.9.
The same tendency in the changes of biochemical index of soil fertility was found for August 2012, September 2012, and July 2014 soil sampling. Its mean value was statistically the highest for the soil sampled in August 2012. Moreover, a significant correlation was observed between index values in August 2012, September 2012, June 2013, and July 2014, and the content of organic carbon.

4. Discussion

The paper presents results of soil enzymatic activities across selected months in different years. Many authors report that mineral fertilizer treatment affects soil enzymatic activities, and yields of legumes [26,27]. Iron and molybdenum are elements necessary for an increase in the activity of nitrogenase [28]. Additional molybdenum treatment in the present experiment resulted from the low content of its available forms (Table 1). Similarly, iron treatment was aimed at increasing its available amount in soil.
Mineral and organic fertilizers significantly affect the quantity and quality alfalfa yields [27] as well as soil enzymatic activity [3,5,9,29]. High soil nitrogenase and urease activity is related to the amounts of biologically fixed nitrogen [30]. Additionally, the activity of other enzymes determined in the present research proved the intensive mineralization of organic compounds in soil. This finding has been confirmed by other studies [1,7,31,32,33]. Enzymatic activity in soil is related to its high content of organic carbon (Table 1), total and mineral nitrogen [6,13,34]. In order to increase nitrogenase activity in the cultivation of alfalfa, and thus the amount of nitrogen fixed from the air, mineral fertilizers should be enriched with molybdenum, the deficiencies of which are common in soils of Poland [6,35]. Many studies [11,14,36,37] indicate a significant effect of the timing of soil sampling on the level of enzymatic activity. According to Siczek et al. [8], the activity of urease in soil with faba bean was higher than the activity of this enzyme in soil with wheat. A similar response was noted for dehydrogenases, which is an intracellular enzyme of microorganisms, connected with C-cycle [8]. Mineral fertilizers applied in the present studies and in the studies of other authors [3,5] significantly increased urease activity in soil. It should be added that these studies used soils with optimal chemical properties (pH, Ctot content, content of available forms of nitrogen, phosphorus, potassium, and magnesium). Urease and phosphatase activity decreased over time with no significant differences between chemical composition of soil residues and the control [1]. Despite the applied mineral fertilizer treatment, Harasim et al. [10] recorded urease and dehydrogenases activity many times lower. It should be added that in the present studies, basic soil parameters were at a low level (pH, organic matter content). High dehydrogenases activity recorded in the present experiment was confirmed by other studies [8,22], also in which the time of taking soil samples significantly differentiated the activity of this enzyme. According to Pan et al. [38] and Antonkiewicz et al. [39], the activity of enzymes increases with the introduction of fertilizers into soil and with the increase of carbon substrates in the soil, which was confirmed in the present experiment.
The level of alkaline phosphatase and acid phosphatase activity largely depends on soil pH [17,40] and mineral fertilizer treatment [10,41]. In the studies of Lemanowicz [41], KMgCaS and PKMgCa fertilizer treatment applied to soil with a pH of 5.2–5.9 resulted in a 2-fold increase in the level of acid phosphatase activity, compared to the activity determined in the soil not fertilized with potassium (PMgCaS). Additionally, Radulov et al. [17] recorded the highest activity of acid phosphatase (1.53 mmol PNP h−1 kg−1 DM) in soil treated with nitrogen at the dose of 120 kg−1. Such results were also observed in the studies of Li et al. [42]. According Mndzebele et al. [11], cowpea and amaranth plants grown without fertilizer treatment or 25% of recommended NPK amounts had the highest rhizosphere phosphatase activity, while the lowest was recorded at 100% NPK application. In the present experiment, an increase in alkaline phosphatase activity (by 41%) in relation to acid phosphatase activity as a response to NPKFe1Mo1 fertilization was largely due to soil pH.
A significant correlation between the enzymatic activity in soils was reported by other authors [13,17,41]. The diversity of microorganisms in the soil is related to the pH of the soil [16,42,43]. Correlations between soil enzymes’ content and pH was observed by other authors [44,45,46,47].
The optimal chemical properties of soil favored high enzymatic activity (Table 1) and positively affected correlation between activity of alkaline phosphatase and acid phosphatase. A significant correlation between enzymatic activity and organic matter was reported by Lemanowicz [41]. The biochemical index of soil fertility of the present experiment was higher than that reported by Kucharski et al. [24] and Iovieno et al. [40], who carried out the studies under laboratory conditions.
The present experiment showed a significant effect of mineral fertilizer treatment with NPKFeMo on the increase in the activity of nitrogenase, urease, and dehydrogenases. At the same time NPKFeMo treatment showed that anthropogenic soils can be used for alfalfa cultivation. The high activity of enzymes in these soils resulted in an increase in the biochemical fertility index, indicating potentials for higher yields.

5. Conclusions

The fertilized soil was characterized by high enzymatic activity. Mineral fertilizer treatment with NPKMo2 (20-22-124.5-1.0 kg ha−1) was optimal for obtaining favorable nitrogenase activity, while NPKFe2Mo2 (20-22-124.5-1.0-1.0 kg ha−1) contributed to the high urease activity. The highest dehydrogenases activity, alkaline phosphatase activity, and acid phosphatase activity were recorded in soil fertilized with NPKFe1Mo1 (20-22-124.5-0.5-0.5 kg ha−1). The biochemical index (BCHI) of soil fertility reached its highest mean value (254.9) after applying NPKFe1Mo1. The present experiment demonstrated a significant effect of soil enzyme activity and organic carbon on the biochemical soil fertility index. Its high value indicated the possibility of generating high alfalfa yields and maintaining good soil culture.

Author Contributions

Conceptualization, B.S. and W.S.; methodology and formal analysis, B.S., W.S., M.B., D.J. and S.K.; investigation, B.S. and W.S.; writing—original draft preparation, B.S., W.S. and S.K.; writing—review and editing, B.S. All authors have read and agreed to the published version of the manuscript.

Funding

This research was financed from the science grant by the Polish Ministry of Education and Science, research task number 36/20/B.

Institutional Review Board Statement

Not applicable.

Informed Consent Statement

Not applicable.

Data Availability Statement

Not applicable.

Conflicts of Interest

The authors declare no conflict of interest.

References

  1. Adetunji, A.T.; Ncube, B.; Meyer, A.H.; Olatunji, O.S.; Mulidzi, R.; Lewu, F.B. Soil pH, nitrogen, phosphatase and urease activities in reponse to cover crop species, termination stage and termination method. Heliyon 2021, 7, eo5980. [Google Scholar] [CrossRef] [PubMed]
  2. Faligowska, A.; Szymańska, G.; Panasiewicz, K.; Szukała, J.; Koziara, W.; Ratajczak, K. The long-term effect of legumes as forecrops on the productivity of rotation (winter rape-winter wheat-winter wheat) with nitrogen fertilization. Plant Soil Environ. 2019, 65, 138–144. [Google Scholar] [CrossRef]
  3. Yang, L.; Li, T.; Li, F.; Lemcoff, J.H.; Cohen, S. Fertilization regulates soil enzymatic activity and fertility dynamics in cucumber field. Sci. Horticult. 2008, 116, 21–26. [Google Scholar] [CrossRef]
  4. Rutkowska, B.; Szulc, W.; Spychaj-Fabisiak, E.; Pior, N. Prediction of molybdenum availability to plants in differentiated soil conditions. Plant Soil Environ. 2017, 63, 491–497. [Google Scholar] [CrossRef] [Green Version]
  5. Zhao, Y.; Wang, P.; Li, T.; Chen, Y.; Ying, X.; Liu, S. Tee effect of two organic manures on soil properties and crop yields on a temperate calcareous soil under a wheat-maize cropping system. Eur. J. Agron. 2009, 31, 36–42. [Google Scholar] [CrossRef]
  6. Kalembasa, S.; Symanowicz, B. Quantitative abilities of biological nitrogen reduction for Rhizobium galegae cultures by goat’s rue. Ecol. Chem. Eng. 2010, 17, 757–764. [Google Scholar]
  7. Shao, X.; Zheng, J. Soil organic carbon, black carbon, and enzyme activity under long-term fertilization. J. Integr. Agric. 2014, 13, 517–524. [Google Scholar] [CrossRef]
  8. Siczek, A.; Frąc, M.; Gryta, A. Forecrop effects abundance and diversity of soil microorganisms during the growth of the subsequent crop. Agronomy 2020, 10, 1971. [Google Scholar] [CrossRef]
  9. Symanowicz, B.; Kalembasa, S.; Niedbała, M.; Toczko, M.; Skwarek, K. Fertilisation of pea (Pisum sativum L.) with nitrogen and potassium and its effect on soil enzymatic activity. J. Elem. 2018, 23, 57–67. [Google Scholar] [CrossRef]
  10. Harasim, E.; Antonkiewicz, J.; Kwiatkowski, C.A. The effects of catch crops and tillage systems on selected physical properties and enzymatic activity of loess soil in a spring wheat monoculture. Agronomy 2020, 10, 334. [Google Scholar] [CrossRef] [Green Version]
  11. Mndzebele, B.; Ncube, B.; Fessehazion, M.; Mabhaudhi, T.; Amoo, S.; Plooy, C.; Venter, S.; Modi, A. Effects of cowpea-amaranth intercropping and fertilizer application on soil phosphatase activities, available soil phosphorus, and crop growth response. Agronomy 2020, 10, 79. [Google Scholar] [CrossRef] [Green Version]
  12. Garbuz, S.A.; Yaroslavtseva, N.V.; Kholodov, V.A. Enzymatic activity inside and outside of water-stable aggregates in soil under different land use. Eurasian Soil Sci. 2016, 49, 367–375. [Google Scholar] [CrossRef]
  13. Swędrzyńska, D.; Grześ, S. Microbiological parameters of soil under sugar beet as a response to the long-term application of different tillage systems. Pol. J. Environ. Stud. 2015, 24, 285–294. [Google Scholar] [CrossRef] [Green Version]
  14. Qin, Y.; Niu, D.; Kang, J.; Zhou, Y.; Li, X. Effects of livestock exclusion on soil physical and biochemical properties of a desert rangeland. Pol. J. Environ. Stud. 2015, 24, 2587–2595. [Google Scholar] [CrossRef]
  15. Piotrowska-Długosz, A.; Wilczewski, E. Soil phosphatase activity and phosphorus content as influenced by catch crops cultivated as green manure. Pol. J. Environ. Stud. 2014, 23, 157–165. [Google Scholar]
  16. Lauber, C.I.; Hamady, M.; Knight, R.; Fierer, N. Pyrosequencing-based assessment of soil pH as a predictor of soil bacterial community structure at the continental scale. App. Environ. Microbiol. 2009, 75, 5111–5120. [Google Scholar] [CrossRef] [PubMed] [Green Version]
  17. Radulov, I.; Berbecea, A.; Sala, F.; Crista, F.; Lato, A. Mineral fertilization influence on soil pH, cationic exchange capacity and nutrient content. Res. J. Agric. Sci. 2011, 43, 160–165. [Google Scholar]
  18. IUSS Working Group WRB. World Reference Base for Soil Resources 2014. International Soil Classification System for Naming Soils and Creating Legends for Soil Maps; World Soil Resources Reports 106; FAO: Rome, Italy, 2015. [Google Scholar]
  19. Kalembasa, S. Quick method of determination of organic carbon in soil. Pol. J. Soil Sci. 1991, 24, 17–22. [Google Scholar]
  20. Alef, K.; Nannipieri, P. Methods in Applied Soil Microbiology and Biochemistry; Alef, K., Nannipieri, P., Eds.; Academic Press: Cambridge, MA, USA; Harcourt Brace & Company: London, UK, 1998; p. 576. [Google Scholar]
  21. Casida, L.E., Jr.; Klein, D.D.A.; Santoro, T. Soil dehydrogenase activity. Soil Sci. 1964, 98, 371–376. [Google Scholar] [CrossRef]
  22. Wolińska, A.; Zapasek, M.; Stępniewska, Z. The optimal TTC dose and its chemical reduction level during soil dehydrogenase activity assay. Acta Agroph. 2016, 23, 303–314. [Google Scholar]
  23. Page, A.L. Methods of Soil Analysis. Part 2. Chemical and Microbiological Properties; Book Series: Agronomy Monographs; American Society of Agronomy, Inc.: Madison, WI, USA; Soil Science Society of America, Inc.: Madison, WI, USA, 1983. [Google Scholar] [CrossRef] [Green Version]
  24. Kucharski, J.; Boros, E.; Wyszkowska, J. Biochemical activity of nickel—Contaminated soil. Pol. J. Environ. Stud. 2009, 18, 1039–1044. [Google Scholar]
  25. Skowera, B. Changes of conditions in the Polish area (1971–2010). Fragm. Agron. 2014, 31, 74–87. (In Polish) [Google Scholar]
  26. Symanowicz, B.; Skorupka, W. Effect of mineral fertilization on nitrogenase activity, yield, nitrogen content and uptake with alfalfa (Medicago sativa L.) yield. J. Elem. 2019, 24, 181–191. [Google Scholar] [CrossRef]
  27. Haki, J.; Kunzová, E.; Tocauerová, Š.; Menšik, L.; Mrázková, M.; Pozdišek, J. Impact of long-term manure and mineral fertilization on yield and nutritive value of Lucerne (Medicago sativa) in relation to changes in canopy structure. Eur. J. Agron. 2021, 123, 126219. [Google Scholar] [CrossRef]
  28. Symanowicz, B.; Kalembasa, S. Effect of iron, molybdenum and cobalt on the amount of nitrogen, biologically reduced by Rhizobium galegae. Ecol. Chem. Eng. 2012, 19, 1311–1320. [Google Scholar] [CrossRef]
  29. Symanowicz, B.; Kalembasa, S.; Skorupka, W.; Niedbała, M. The changes of enzymatic activity of soil under eastern galega (Galega orientalis Lam.) after NPKCa fertilization. Plant Soil Environ. 2014, 60, 123–128. [Google Scholar] [CrossRef] [Green Version]
  30. Kalembasa, D.; Szukała, J.; Symanowicz, B.; Kalembasa, S.; Faligowska, S.; Becher, M. Amount of biologically nitrogen fixed by faba bean and its uptake by winter wheat determined by 15N ID method. Arch. Agron. Soil Sci. 2020. [Google Scholar] [CrossRef]
  31. Mocek-Płóciniak, A.; Niewiadomska, A.; Głuchowska, K. Effect of the culturing density of the Sinorhizobium meliloti Bp on the development of lucerne (Medicago sativa L.) and nitrogenase activity. Acta Sci. Pol. Agric. 2008, 7, 39–45. [Google Scholar]
  32. Swędrzyńska, D.; Małecka, I.; Blecharczyk, A.; Swędrzyński, A.; Starzyk, J. Effects of various long-term tillage systems on some chemical and biological properties of soil. Pol. J. Environ. Stud. 2013, 22, 1835–1844. [Google Scholar]
  33. Adetunji, A.T.; Lewu, F.B.; Mulidzi, R.; Ncube, B. The biological activities of β-glucosidase, phosphatase and urease as soil quality indicators. A review. J. Soil Sci. Plant Nutr. 2017, 17, 794–807. [Google Scholar] [CrossRef] [Green Version]
  34. Sołek-Podwika, K.; Ciarkowska, K. Urease activity in soils anthropogenically enriched in sulphur compounds. Soil Sci. Ann. 2008, 59, 196–200. (In Polish) [Google Scholar]
  35. Kalembasa, S.; Symanowicz, B. The changes of molybdenum and cobalt contents in biomass of goat’s rue (Galega orientalis Lam.). Fres. Environ. Bull. 2009, 18, 1150–1153. [Google Scholar]
  36. Li, F.; Kautz, T.; Pude, R.; Köpke, U. Nodulation of lucerne (Medicago sativa L.) roots: Depth distribution and temporal variation. Plant Soil Environ. 2012, 58, 424–428. [Google Scholar] [CrossRef] [Green Version]
  37. Piotrowska, A.; Wilczewski, E. Effects of catch crops cultivated for green manure and mineral nitrogen fertilization on soil enzyme activities and chemical properties. Geoderma 2012, 189–190, 72–80. [Google Scholar] [CrossRef]
  38. Pan, C.; Liu, C.; Zhao, H.; Wang, Y. Changes of soil physico-chemical properties and enzyme activities in relation to grassland salinization. Eur. J. Soil Biol. 2012, 55, 13–19. [Google Scholar] [CrossRef]
  39. Antonkiewicz, J.; Kołodziej, B.; Bielińska, E.J. The use of reed canary grass and giant miscanthus in the phytoremediation of municipal sewage sludge. Environ. Sci. Pollut. Res. 2016, 23, 9505–9517. [Google Scholar] [CrossRef]
  40. Iovieno, P.; Morra, L.; Leone, A.; Pagano, L.; Alfani, A. Effect of organic and mineral fertilizers on soil respiration and enzyme activities of two Mediterranean horticultural soils. Biol. Fertil. Soils 2009, 45, 555–561. [Google Scholar] [CrossRef]
  41. Lemanowicz, J. Mineral fertilization as a factor determining selected sorption properties of soil against the activity of phosphatases. Plant Soil Environ. 2013, 59, 439–445. [Google Scholar] [CrossRef] [Green Version]
  42. Li, Y.; Nie, C.; Liu, Y.; Du, W.; He, P. Soil microbial community composition closely associates with specific enzyme activities and soil carbon chemistry in a long-term nitrogen fertilized grassland. Sci. Total Environ. 2019, 654, 264–274. [Google Scholar] [CrossRef]
  43. Biederbeck, V.O.; Zentner, R.P.; Campbell, C.A. Soil microbial populations and activities as influenced by legume green fallow in a semiarid climate. Soil Biol. Biochem. 2005, 37, 1775–1784. [Google Scholar] [CrossRef]
  44. Makoi, J.H.; Chimphango, S.B.; Dakora, F.D. Elevated levels of acid and alkaline phosphatase activity in roots and rhizosphere of cowpea (Vigna unguiculata L. Walp.) genotypes grown in mixed culture and at different densities with sorghum (Sorghum bicolor L.). Crop. Pasture Sci. 2010, 61, 279–286. [Google Scholar] [CrossRef]
  45. Tang, X.; Placella, S.A.; Daydé, F.; Bernard, L.; Robin, A.; Journet, E.P.; Hinsinger, P. Phosphorus availability and microbial community in the rhizosphere of intercropped cereal and legume along a P-fertiliser gradient. Plant Soil 2016, 407, 119–134. [Google Scholar] [CrossRef]
  46. Fraser, T.D.; Lynch, D.H.; Gaiero, J.; Khosla, K.; Dunfield, K.E. Quantification of bacterial non-specific acid (phoC) and alkaline (phoD) phosphatase genes in bulk and rhizosphere soil from organically managed soybean fields. Appl. Soil Ecol. 2017, 111, 48–56. [Google Scholar] [CrossRef]
  47. Bhavya, G.; Shaker, K.C.; Jayasree, G.; Reddy, M.M. Effect of integrate use of phosphorus, PSB and vermicompost on acid and alkaline phosphatase activity and yield of green gram (Vigna radiata L.). Int. J. Curr. Microbial. Appl. Sci. 2018, 7, 1465–1468. [Google Scholar] [CrossRef]
Figure 1. The effects of mineral fertilizer treatment (a) and the time of soil sampling (b) on nitrogenase activity. Each bar represents the mean ± SE. The same letters mark no significantly different values (p ≤ 0.05).
Agronomy 11 01335 g001
Figure 2. The effects of mineral fertilizer treatment (a) and time of soil sampling (b) on urease activity. Each bar represents the mean ± SE. The same letters mark no significantly different values (p ≤ 0.05).
Agronomy 11 01335 g002
Figure 3. The effects of mineral fertilizer treatment (a) and time of soil sampling (b) on dehydrogenases activity. Each bar represents the mean ± SE. The same letters mark no significantly different values (p ≤ 0.05).
Agronomy 11 01335 g003
Figure 4. The effects of mineral fertilizer treatment (a) and time of soil sampling (b) on alkaline phosphatase activity. Each bar represents the mean ± SE. The same letters mark no significantly different values (p ≤ 0.05).
Agronomy 11 01335 g004
Figure 5. The effects of mineral fertilizer treatment (a) and time of soil sampling (b) on acid phosphatase activity. Each bar represents the mean ± SE. The same letters mark no significantly different values (p ≤ 0.05).
Agronomy 11 01335 g005
Figure 6. (a) The correlations between dehydrogenases activity and alkaline phosphatase activity, (b) alkaline phosphatase activity and acid phosphatase activity.
Agronomy 11 01335 g006
Table 1. Basic soil characteristics.
Chemical PropertiesYears
201220132014
Ctot g kg−135.6 ± 0.834.1 ± 0.933.8 ± 0.7
Ntot g kg−12.3 ± 0.12.2 ± 0.12.4 ± 0.2
P * mg kg−1264.8 ± 3.8258.6 ± 2.1249.9 ± 3.5
K * mg kg−188.7 ± 2.792.6 ± 2.591.1 ± 3.3
Mg * mg kg−191.3 ± 2.282.3 ± 1.978.2 ± 1.7
Fe * mg kg−11391.5 ± 7.91349.7 ± 8.31356.8 ± 9.0
Mo * mg kg−10.018 ± 0.0030.021 ± 0.0010.020 ± 0.001
pH6.826.716.65
* Available forms; ±SD.
Table 2. Characteristics of hydrothermal conditions, on the basis of data provided by the Institute of Meteorology and Water Management in Warsaw, the Hydrological and Meteorological Station in Siedlce (Poland).
Months
YearsIIIIIIIVVVIVIIVIIIIXXXIXIIMean/Sum
Temperature (°C)
2012−2.0−7.84.09.014.516.420.418.014.27.55.4−4.18.0
2013−4.2−8.0−2.57.515.317.718.818.311.49.65.21.77.6
2014−3.51.15.99.713.715.120.517.813.78.43.7−1.08.8
Precipitation (mm)
201241.618.826.740.359.7118.741.464.130.841.621.933.6543.7
201345.837.734.857.6145.811.949.144.186.618.035.515.5682.4
201441.329.536.339.579.574.237.5105.726.33.032.590.4595.7
Hydrothermal index Sielianinov K (mm/°C)
2012−6.93−0.862.221.491.372.410.681.190.721.851.35−2.64
2013−3.63−1.32−4.492.563.182.110.870.802.530.622.272.94
2014−3.939.581.991.361.931.640.611.980.640.122.93−2.92
K: <0.5—drought; 0.5–1.0—semi-drought; 1.0–1.5—optimal moisture; >1.5—excessive moisture [25].
Table 3. Nitrogenase activity in soil incubated with C2H2 for 24 h (in nM C2H4).
Fertilizer TreatmentTime of Soil Sampling
August 2012September 2012 June 2013July 2014
Control *9.18 ± 1.36 eB9.39 ± 1.28 dB14.66 ± 1.19 cA10.51 ± 1.48 bB
NPK10.81 ± 2.14 eB12.37 ± 0.71 dB24.65 ± 4.78 bA9.03 ± 0.89 bB
NPKFe118.73 ± 2.35 dB17.03 ± 2.23 cB40.51 ± 5.20 aA5.76 ± 0.40 cC
NPKMo122.24 ± 1.42 cB19.54 ± 1.28 cB29.16 ± 1.27 bA11.69 ± 0.24 bC
NPKFe1Mo141.78 ± 2.03 bA16.57 ± 0.33 cC27.97 ± 2.82 bB8.64 ± 1.03 bD
NPKFe225.90 ± 3.76 cB24.98 ± 3.19 bB36.74 ± 5.09 aA19.61 ± 1.96 aB
NPKMo251.47 ± 5.38 aA39.55 ± 1.69 aB40.19 ± 2.26 aB8.05 ± 1.39 bC
NPKFe2Mo213.81 ± 4.35 dB26.44 ± 2.53 bA19.58 ± 3.38 cB16.97 ± 2.74 aB
* Control—0; N—20; P—22; K—124.5; Fe1—0.5; Mo1—0.5; Fe2—1.0; Mo2—1.0 kg ha−1. Different lowercase letters within a column for fertilizer treatments and different uppercase letters within a line for times of soil sampling indicate significant differences (p ≤ 0.05).
Table 4. Urease activity in soil (in mg NH4-N h−1 kg−1 DM).
Fertilizer TreatmentTime of Soil Sampling
August 2012September 2012June 2013July 2014
Control *315.5 ± 2.70 bA319.4 ± 1.00 cA306.5 ± 1.15 cB312.4 ± 2.01 bA
NPK357.0 ± 1.77 aA358.9 ± 2,06 aA340.8 ± 5.30 bC351.0 ± 2.26 aB
NPKFe1348.4 ± 1.51 aB359.1 ± 7.19 aA343.5 ± 3.29 aB347.1 ± 2.40 aB
NPKMo1352.4 ± 0.94 aA353.1 ± 1.23 bA347.7 ± 2.36 aB353.3 ± 5.77 aA
NPKFe1Mo1353.7 ± 3.10 aA353.4 ± 1.92 bA347.7 ± 2.18 aB351.2 ± 1.08 aA
NPKFe2351.9 ± 1.81 aA351.3 ± 0.46 bA347.5 ± 0.93 aA349.6 ± 0.36 aA
NPKMo2352.6 ± 1.11 aA351.8 ± 1.60 bA348.7 ± 0.51 aA351.5 ± 1.32 aA
NPKFe2Mo2356.6 ± 0.71 aA354.1 ± 0.40 bA350.2 ± 1.01 aB353.7 ± 0.95 aA
* Control—0; N—20; P—22; K—124.5; Fe1—0.5; Mo1—0.5; Fe2—1.0; Mo2—1.0 kg ha−1. Different lowercase letters within a column for fertilizer treatments and different uppercase letters within a line for times of soil sampling indicate significant differences (p ≤ 0.05).
Table 5. Dehydrogenases activity in soil (in cm3 H2 h−1 kg−1 DM).
Fertilizer TreatmentTime of Soil Sampling
August 2012September 2012 June 2013July 2014
Control *23.2 ± 1.48 eA21.0 ± 0.46 dA20.9 ± 0.25 eB21.2 ± 0.79 eA
NPK26.5 ± 1.07 dA24.2 ± 0.30 cA23.6 ± 1.10 dB25.5 ± 1.07 dA
NPKFe133.4 ± 1.03 bA32.5 ± 1.19 bA29.0 ± 0.60 bA30.8 ± 0.38 cA
NPKMo133.6 ± 2.74 bA32.7 ± 0.85 bA27.1 ± 0.40 cB29.2 ± 0.70 cB
NPKFe1Mo138.3 ± 1.11 aA35.9 ± 0.89 aB35.6 ± 1.06 aB38.2 ± 1.37 aA
NPKFe232.4 ± 0.87 bA30.8 ± 0.56 bA27.5 ± 0.86 cB29.8 ± 1.04 cA
NPKMo229.1 ± 0.40 cA28.2 ± 0.42 bA26.5 ± 0.98 cA28.3 ± 0.92 cA
NPKFe2Mo235.1 ± 2.33 bA31.7 ± 1.04 bB30.2 ± 0.76 bB33.4 ± 2.10 bA
* Control—0; N—20; P—22; K—124.5; Fe1—0.5; Mo1—0.5; Fe2—1.0; Mo2—1.0 kg ha−1. Different lowercase letters within a column for fertilizer treatments and different uppercase letters within a line for times of soil sampling indicate significant differences (p ≤ 0.05).
Table 6. Alkaline phosphatase activity in soil (in mmol PNP h−1 kg−1 DM).
Fertilizer TreatmentTime of Soil Sampling
August 2012September 2012June 2013July 2014
Control *0.67 ± 0.02 aB0.69 ± 0.01 bA0.67 ± 0.03 bB0.63 ± 0.02 cC
NPK0.60 ± 0.01 bB0.66 ± 0.02 bA0.52 ± 0.01 cD0.55 ± 0.02 cC
NPKFe10.76 ± 0.04 aA0.71 ± 0.01 bB0.64 ± 0.03 bD0.69 ± 0.01 bC
NPKMo10.69 ± 0.01 aB0.72 ± 0.01 bA0.61 ± 0.04 bD0.63 ± 0.02 cC
NPKFe1Mo10.80 ± 0.01 aB0.82 ± 0.02 aA0.77 ± 0.02 aC0.78 ± 0.01 aC
NPKFe20.60 ± 0.01 bB0.63 ± 0.02 bA0.52 ± 0.02 cD0.56 ± 0.01 dC
NPKMo20.72 ± 0.02 aB0.74 ± 0.04 bA0.66 ± 0.03 bC0.71 ± 0.02 bB
NPKFe2Mo20.71 ± 0.01 aB0.74 ± 0.03 bA0.67 ± 0.02 bC0.70 ± 0.01 bB
* Control—0; N—20; P—22; K—124.5; Fe1—0.5; Mo1—0.5; Fe2—1.0; Mo2—1.0 kg ha−1. Different lowercase letters within a column for fertilizer treatments and different uppercase letters within a line for times of soil sampling indicate significant differences (p ≤ 0.05).
Table 7. Acid phosphatase activity in soil (in mmol PNP h−1 kg−1 DM).
Fertilizer TreatmentTime of Soil Sampling
August 2012September 2012June 2013July 2014
Control *0.54 ± 0.02 aA0.51 ± 0.01 aB0.49 ± 0.03 bC0.49 ± 0.01 bC
NPK0.47 ± 0.01 cA0.44 ± 0.02 bB0.40 ± 0.01 dD0.41 ± 0.01 cC
NPKFe10.52 ± 0.01 bB0.53 ± 0.01 aA0.48 ± 0.02 bC0.52 ± 0.01 bB
NPKMo10.52 ± 0.02 bB0.53 ± 0.01 aA0.53 ± 0.02 aA0.53 ± 0.03 aA
NPKFe1Mo10.57 ± 0.01 aA0.56 ± 0.02 aB0.56 ± 0.02 aB0.56 ± 0.02 aB
NPKFe20.43 ± 0.01 dB0.44 ± 0.01 bA0.40 ± 0.02 dD0.41 ± 0.01 cC
NPKMo20.45 ± 0.01 cB0.43 ± 0.01 bD0.46 ± 0.01 cA0.44 ± 0.02 cC
NPKFe2Mo20.51 ± 0.01 bA0.49 ± 0.01 aC0.50 ± 0.01 bB0.51 ± 0.01 bA
* Control—0; N—20; P—22; K—124.5; Fe1—0.5; Mo1—0.5; Fe2—1.0; Mo2—1.0 kg ha−1. Different lowercase letters within a column for fertilizer treatments and different uppercase letters within a line for times of soil sampling indicate significant differences (p ≤ 0.05).
Table 8. Total organic carbon in soil (in %).
Fertilizer TreatmentTime of Soil SamplingMean
August 2012September 2012June 2013July 2014
Control *3.47 ± 0.31 aA3.43 ± 0.21 aA3.34 ± 0.25 bA3.50 ± 0.23 aA3.44 a
NPK3.45 ± 0.18 aA3.24 ± 0.23 aB3.06 ± 0.23 cB3.20 ± 0.11 cB3.24 a
NPKFe13.30 ± 0.22 bB3.26 ± 0.24 aB3.40 ± 0.19 bA3.07 ± 0.21 cB3.24 a
NPKMo13.22 ± 0.13 bC3.42 ± 0.20 aB3.92 ± 0.17 aA3.13 ± 0.21 bC3.42 a
NPKFe1Mo13.43 ± 0.19 aA3.36 ± 0.14 aA3.10 ± 0.15 cB3.54 ± 0.11 aA3.36 a
NPKFe23.14 ± 0.11 bC3.34 ± 0.15 aB3.72 ± 0.19 aA3.15 ± 0.13 cC3.34 a
NPKMo23.22 ± 0.13 bA2.91 ± 0.11 bA2.48 ± 0.11 aB3.02 ± 0.12 cA2.91 a
NPKFe2Mo23.38 ± 0.15 aA3.08 ± 0.12 bB2.52 ± 0.14 dC3.34 ± 0.13 bA3.08 a
Mean3.32 A3.25 A3.32 A3.19 A3.08 a
* Control—0; N—20; P—22; K—124.5; Fe1—0.5; Mo1—0.5; Fe2—1.0; Mo2—1.0 kg ha−1. Different lowercase letters within a column for fertilizer treatments and different uppercase letters within a line for times of soil sampling indicate significant differences (p ≤ 0.05).
Table 9. Biochemical index (BCHI) of soil fertility.
Fertilizer TreatmentTime of Soil SamplingMean
August 2012September 2012June 2013July 2014
Control *197.4 ± 4.2 fA189.5 ± 2.5 dA180.9 ± 5.1 cB191.1 ± 3.8 eA189.9 d
NPK222.0 ± 3.1 eA202.3 ± 3.3 dB186.8 ± 4.3 cC199.9 ± 4.3 eB202.6 d
NPKFe1235.6 ± 2.9 cA232.6 ± 2.7 bA233.0 ± 2.8 bA206.6 ± 2.1 dB225.3 c
NPKMo1232.7 ± 3.1 cC243.5 ± 1.9 aB258.7 ± 1.6 aA209.3 ± 1.8 dD236.4 b
NPKFe1Mo1271.7 ± 2.7 aA249.6 ± 2.3 aB230.9 ± 3.7 bC267.3 ± 3.1 aA254.9 a
NPKFe2223.6 ± 2.5 eC232.1 ± 1.8 bB248.6 ± 4.2 aA213.2 ± 2.4 cD229.7 c
NPKMo2227.6 ± 3.7 dA199.3 ± 2.1 dB164.9 ± 5.3 dC197.5 ± 2.1 eB197.1 d
NPKFe2Mo2247.2 ± 3.2 bA218 ± 2.0 cC172.2 ± 7.2 dD239.4 ± 3.3 bB218.9 c
Mean231.9 A220.6 B209.6 C215.1 C219.2
* Control—0; N—20; P—22; K—124.5; Fe1—0.5; Mo1—0.5; Fe2—1.0; Mo2—1.0 kg ha−1. Different lowercase letters within a column for fertilizer treatments and different uppercase letters within a line for times of soil sampling indicate significant differences (p ≤ 0.05).
Publisher’s Note: MDPI stays neutral with regard to jurisdictional claims in published maps and institutional affiliations.

