Article

Deficit Irrigation Strategies on Tree Physiological and Chemical Properties: Treatment Effects, Prediction Based Model Analyses and Inter-Correlations

1
Department of Horticulture, Faculty of Agriculture, Kafrelshaikh University, Kafr El-Sheikh 33511, Egypt
2
Institute of Horticulture, University of Debrecen, Böszörményi út 138, H-4032 Debrecen, Hungary
3
Physiology and Breeding of Horticultural Crops Lab (PBHC), Faculty of Agriculture, Kafrelsheikh University, Kafr El-Sheikh 33511, Egypt
4
Department of Physical Geography and Geoinformatics, University of Debrecen, H-4032 Debrecen, Hungary
5
Department of Horticulture, College of Agricultural Engineering Sciences, Salahaddin University-Erbil, Erbil 46010, Kurdistan Region, Iraq
6
Eötvös Loránd Research Network (ELKH), Centre for Agricultural Research, Plant Protection Institute, Herman Ottó út 15, H-1022 Budapest, Hungary
*
Author to whom correspondence should be addressed.
Agronomy 2021, 11(7), 1361; https://doi.org/10.3390/agronomy11071361
Submission received: 27 May 2021 / Revised: 30 June 2021 / Accepted: 1 July 2021 / Published: 3 July 2021

Abstract

:
Irrigation is a key factor for different physiological aspects of fruit trees. Therefore, such irrigation protocols that can save water consumption during irrigation and maintain fruit trees productivity are an essential goal especially under semiarid climate conditions. The aim of this 3-year apricot study was to investigate the effect of four deficit irrigation (DI) treatments (control, moderate regulated deficit irrigation: RDIm, severe RDI: RDIs and continuous DI: CDI) on 15 tree physiological properties (chilling requirement—CR, heat requirement—HR, days from end—dormancy until fruit harvest—DEDFH, sum of growing degree days—sGDD, total number of buds—TNB, number of flower buds—NFB, number of vegetative buds—NVB, starting date of flowering—SDF, number of opened flower buds—NOFB, flower bud abscission—FBA, fruit set—FS, seasonal vegetative growth—SVG, fruit number per tree—FNT, fruit weight—FW, fruit yield—FY), and on two tree chemical properties (total soluble carbohydrates—TSC and total proline content—TPC) on apricot cultivars ‘Ninfa’ and ‘Canino’ in Egypt. Results showed that both DI treatments and cultivars significantly influenced the values of CR, HR, TNB, SDF, NOFB, FS, SVG, FNT, FY, TSC, and TPC. Values of FBA were significantly affected by years and DI treatments, while sGDD by years and cultivars. Values of DEDFH, NFB, and FW were significantly influenced only by cultivars, while NVB only by DI treatments. The RDIm treatment gave the most acceptable values for most measured properties compared to the fully irrigated control treatment. Prediction based model analysis demonstrated that generalized linear models (GLMs) can be predictors for the measured tree properties in the DI treatments. The best goodness-of-fit of the predicted GLMs was reached for HR, NOFB, FS, SVG, FNT, TSC, and TPC. In all the four DI treatments, 22 pair-variables (TNB versus (vs.) NFB, TNB vs. NOFB, TNB vs. NOFB, NFB vs. NOFB, NFB vs. FNT, NFB vs. FY, NFB vs. FW, NOFB vs. SVG, NOFB vs. FNT, NOFB vs. FY, FS vs. FNT, FS vs. FY, SVG vs. FNT, SVG vs. FY, SVG vs. TSC, FNT vs. FY, FY vs. FW, CR vs. TSC, HR vs. TNB, HR vs. NFB, HR vs. FNT, HR vs. FY, and NOFB vs. FBA) correlated significantly in Pearson correlation and regression analyses. Principal component analyses explained 82% of the total variance and PC1, PC2, and PC3 explained 23, 21, and 15% of the total variance and correlated with the HR, TNB, FS, FNT and FY; FBA, SVG, TSC, and TPC; and NFB, NVB and NOFB, respectively, indicating strong connections among tree physiological and chemical properties. In conclusion, DI techniques using moderate water deficits can be managed successfully in apricot production under semiarid Mediterranean climate conditions such as the one in Egypt.

1. Introduction

Apricot (Prunus armeniaca L.) is one of the fundamental species of deciduous trees grown all over the world. Mediterranean countries produce more than 60% of the global apricot production [1]. Water is a natural resource and it is increasingly scarce and expensive especially in the Mediterranean regions. Therefore, water management is a key element for environmental sustainability especially in those countries that depends on agriculture activities and/or have limited water resources [2]. Limited water resources in Egypt are current and future challenges for Egyptian agriculture as about 13.5 BCM/year is the gap between the needs and availability of water [3]. Therefore, the optimization of irrigation strategies and improving the water use efficiency are hot research topics in the arid and semiarid regions of the world [4,5].
For improving the water use efficiency, a suggested irrigation strategy for fruit trees is the deficit irrigation (DI) practice especially in the arid and semiarid regions [4,5,6]. The DI practice is based on the knowledge of tree phenological stages and their responses to DI [2,7]. In order to study the benefits of DI, the crop water productivity (CWP) was proposed, which is the ratio of the yield and the consumed water by the crop [4]. Previous studies evaluated the effects of DI on tree vegetative growth, flowering, and fruit yield of various fruit tree species such as apples [7], peaches and pears [6,8,9,10], plums [11,12], apricot [13,14,15,16,17,18,19], mango [20], and orange [21,22]. In these previous studies, the use of DI practices improved water use efficacy, maintained the fruit yield and decreased the cost of tree pruning, vegetative growth, as well as irrigation times and quantities. The sensitivity of apricot to DI depended upon the phenological stages of the trees [2]. The most sensitive phonological stages to DI were the rapid fruit growth (S3) and the early postharvest (S4) stages [2]. Water restrictions negatively affected fruit sizes during the S3 stage while the lack of water reduced the floral bud initiation and differentiation during the S4 stage [23,24]. On the other hand, Intrigliolo and Castel [11] found no effect of DI during pit-hardening (S2) stage and postharvest stage on flowering or fruit set. Therefore, a regulated deficit irrigation (RDI) was proposed during S2 stage of fruit trees e.g., [5,8,23]. Applications of an RDI during the intensive shoot growth stages reduced vegetative growth by decreasing shoot length and trunk diameter [7,11,17]. Therefore, a separation between shoot and fruit growth stages was proposed for applying the RDI strategies without or with minor negative effects on fruit yield [5,8,23]. As a consequence, a DI strategy has to reduce water use during the insensitive shoot growth stages while irrigating the trees well during the critical fruit growth periods. Although several studies evaluated DI treatments on fruit trees including apricot, an overall evaluation of various DI treatments on the measures of tree physiological and chemical properties coupled with prediction based model analyses, and the inter-correlations among these properties are limited under semiarid Mediterranean climate conditions. Providing the best inter-connections among tree properties and suitable prediction based models can help to clarify the background physiological processes of the apricot trees under DI conditions.
Therefore, the aim of this 3-year study was to investigate the effect of four DI treatments (control, moderate RDI: RDIm, severe RDI: RDIs and continuous DI: CDI) on 15 measures of tree physiological properties (chilling requirement—CR, heat requirement—HR, days from end-dormancy until fruit harvest—DEDFH, sum of growing degree days—sGDD, total number of buds—TNB, number of flower buds—NFB, number of vegetative buds—NVB, starting date of flowering—SDF, number of opened flower buds—NOFB, flower bud abscission—FBA, fruit set—FS, seasonal vegetative growth—SVG, fruit number per tree—FNT, fruit weight—FW, fruit yield—FY), and on two tree chemical properties (total soluble carbohydrates—TSC and total proline content—TPC) for apricot cultivars (cvs) ‘Ninfa’ and ‘Canino’ under Egyptian climate conditions. Moreover, prediction based model analyses (Generalized Linear Models—GLMs) and inter-correlations (Pearson correlation, regression analyses and principal component analyses) were performed among the 17 measures of tree physiological and chemical properties in order to propose the best relationships of the correlated measures and provide suitable prediction based models under various DI practice.

2. Materials and Methods

2.1. Plant Material and Experimental Site

The study was conducted during the tree growing periods of three consecutive years from 2016 to 2018 on two apricot cvs ‘Ninfa’ and ‘Canino’ in a commercial apricot orchard at Wadi El Natrun (30.583° N 30.333° E), El Beheira Governorate, Northern Egypt (Figure 1). The orchard is located under semiarid Mediterranean climate conditions and it is 23 and 38 m below sea and Nile River levels, respectively. The soil of the orchard is sandy loam and the soil physical and chemical characteristics are listed in Table 1.
The orchard was established in 2009 and trees were grafted on apricot rootstocks and planted with a distance between and within rows of 4 and 4 m, respectively. The two examined apricot cultivars are the most commonly grown cultivars in the Egyptian region and they are reference cultivars for apricot growing. Mean tree height, mean trunk diameter, ground cover at the beginning and ground cover at the end of the study were 2.8 m, 17 cm, 47 and 55%, respectively. Eight trees replicated four times were selected for each cultivar and each irrigation treatment with nearly similar tree growth vigor and tree fruiting. The same trees were used for sampling during the three consecutive seasons. All treatments and both cultivars in all years received the same orchard management practices according to standard fruit farming practices. The trees had received 158 kg N, 769 kg P2O5 and 110 kg K2O ha−1 year−1 in all irrigation treatments and for both cultivars.

2.2. Estimation of Irrigation Requirements for Apricot Tree

Irrigation water requirements for apricot trees were calculated according to data obtained from the local agrometeorological station at Al-Beharia Governorate, Central Laboratory for Agricultural Climate (C.L.A.C.), Ministry of Agriculture and Land Reclamation by using the following equation:
IR = ((ETc × A × CF)/Ea) + LR
where IR = irrigation water requirements (m3 ha−1 day−1), ETc = the water requirement of a given crop (mm day−1), A = area irrigated (m2), Ea = application efficiency (%) under 90% drip irrigation, CF = covering factor (for peach trees 45%), and LR = leaching requirements. The crop evapotranspiration (ETc) was calculated by using the following equation:
ETc = kc × ETo
where kc = crop coefficient factor. The kc varies among growth stages of the given crop. Normally four growth stages are considered: (i) the initial stage, when the crop uses little water; (ii) the crop development stage, when the water consumption increases; (iii) the mid-season stage, when water consumption reaches a peak; and (iv) the late-season stage, when the maturing crop once again requires less water. Crop coefficient factors of apricot were: 0.5 February, 0.75 March, 0.8 April, 0.9 May, 0.6 June, and 0.5 July–November [25]. ETo is the reference crop evapotranspiration (mm day−1). ETo was calculated as:
ETo = Epan × Kpan
where Epan = pan evaporation and Kpan = pan coefficient (values of Kpan vary between 0.35 and 0.85, with an average of 0.70).

2.3. Deficit Irrigation Treatments

For the DI treatments, four periods of phenological growth stages of apricot trees were determined from early February until late September according to the study of Ruiz-Sánchez et al. [23]. The four periods were: (i) stage 1 from early February to early March (swelling and opening of flower buds and flowering and fruit set), (ii) stage 2 from mid March to early May (fruit growth stages I and II), stage 3 from mid May to mid June (fruit growth stage III and fruit harvest), and stage 4 from end June to end September (fruit harvest and postharvest) (Figure 2). All irrigation treatments were calculated up to the seasonal ETc as follows: (i) control, in which trees were irrigated at 100% of seasonal ETc for all phenological growth stages of the trees, (ii) moderate regular deficit irrigation (RDIm), in which trees were irrigated at 100% of ETc from mid-April to the end of July (from fruit growth stages II to fruit harvest), which defined as critical periods (CPs) according to the study of Ruiz-Sánchez et al. [23]; and trees were irrigated at 50% of ETc during the rest of the season (before mid-April and after the end of July), (iii) a severe regular deficit irrigation (RDIs), in which trees were irrigated at 100% of ETc during the CPs and trees were irrigated at 25% of ETc during the rest of the growing season, and (iv) a continuous deficit irrigation (CDI), in which trees were irrigated at 50% of ETc during the whole season at all physiological stages (Figure 2). The amount of irrigated water in each month (L tree-1) and the annual amount of water irrigated (L tree−1, m3 ha−1) for each DI treatment were presented in Table 2.

2.4. Measures of Tree Physiological Properties

2.4.1. General Measures

Calculation of chilling requirement (CR) was based on chilling unit accumulation. According to Razavi et al. [26], a fixed starting date for chilling accumulation was set up. This date was a day in autumn (mid-October) when chilling accumulation become consistent and a negative effect of ambient temperature was scarce. From this date, 30 apricot branches (in three replicates, 10 branches per replicate) were taken randomly from similar positions of six randomly selected trees for each year, treatment and cultivar. The branches had a length of 40 cm and a diameter of 4.8–5.2 cm. Then each branch was immersed in a fungicide solution for 5 min and then wrapped with wetted papers then placed into plastic bags under cold conditions at temperature of 3 ± 1 °C. The artificial chilling treatments included 100, 200, 300, 400, 500, 600, and 700 h. After chilling treatments, the branches were placed from the proximal end in 0.5 L pots that were filled with 5% of sucrose solution and forced to grow in the laboratory at constant temperature 25 ± 1 °C and 65% RH for 16 h in light and 8 h in dark photoperiods. The water of pots was renewed every 3 days and the base of the branches was re-cut every 3 days. When 50% of the cuttings was sprouted, it was considered as the bud dormancy was released. Chilling requirements were defined by accumulating the chill hours below 7.2 °C according to the study of Weinberger [27] and Razavi et al. [26].
For evaluating heat requirement (HR), the growing degree hours (GDH) were estimated for each treatment and cultivar. The accumulation of GDH, as heat requirements, was considered under room temperature when 50% of the buds of the branches were sprouted after moving cooled branches from the refrigerator [28]. In addition, days from end-dormancy until fruit harvest (DEDFH) was calculated from the date of the end-dormancy (when 5% of the flower buds opened) until the date of fruit harvest for each year, treatment and cultivar. The sum of growing degree days (sGDD) was also calculated during the period from the date of end-dormancy until the date of fruit harvest for each year, treatment and cultivar. The sGDD calculation was based on the equation for growing degree day (GDD) according to the study of Mohamed et al. [29]:
GDD = ((Tmax − Tmin)/2) − Tbase
where, Tmax = maximum temperature, Tmin = minimum temperature and Tbase is base temperature, 4.4 °C. Then sGDD was calculated by summing up each GDD from the date of the end-dormancy until the date of fruit harvest for each year, treatment and cultivar.

2.4.2. Bud Related Measures

In five trees, four × four branches were selected randomly in each tree and then labeled for each year, treatment and cultivar; and the total number of buds (TNB), the number of flower buds (NFB) and the number of vegetative buds (NVB) were counted. When 5% of the flower buds opened, the starting date of flowering (SDF) was determined for each year, treatment, and cultivar. When all flower buds opened, the same labeled branches were used to count the number of opened flower buds (NOFB) for each year, treatment and cultivar. After this, the percentage of flower bud abscission (FBA) was calculated as (TNB − NOFB) × 100 for each year, treatment and cultivar.

2.4.3. Measures for Yield Related Attributes

Fruit set (FS) was calculated as the percentage of the number of fruits to the number of flowers per branch. For SVG (cm), the vegetative growth of shoots, was measured with a veriner caliper at the date of end-dormancy (SVGed) and measured again at fruit harvest (SVDh) for each year, treatment, and cultivar. Then SVG was calculated as SVDh − SVGed. At harvest, the fruit number per tree (FNT) was counted for each selected tree of experiment for each year, treatment and cultivar. The individual fruit weight (FW, g) was measured for 4 × 50 fruit samples. Yield per tree (FY) was measured with a balance for each selected tree of experiment for each year, treatment and cultivar.

2.5. Measures of Tree Chemical Properties

2.5.1. The Total Soluble Carbohydrates Content

For measuring the total soluble carbohydrate (TSC) content (i.e., sum of the glucose, fructose, and sucrose) of the tree was determined according to the method of Ranganna [30] with a slight modification. Apricot tree branches in four replicates were collected at 25, 27, and 24 November in 2016, 2017, and 2018, respectively. The collected samples were transported to laboratory and dried at 75 °C until constant weight. The dried samples were grinded and then powdered. A mixture of 0.1 g powdered sample and 13 mL ethanol (90%) were homogenized and then centrifuged at 4000 rpm for 15 min. The supernatant was used to measure the soluble sugar content. A mixture of 1 mL supernatant, 5 mL phenol (5%) and 5 mL sulfuric acid was vortexed for 30 s. Then the solution was adjusted to room temperature and the absorption of the solution was measured spectrophotometrically (BioTek Instruments Inc., VT 05404-0998, Winooski, VT, USA) at the wavelength of 490 nm. The standard curve was determined for a glucose standard solution. The total sugar content was measured as mg soluble carbohydrates g−1 dry weight.

2.5.2. Total Proline Content in Leaf

Total proline content (TPC) in apricot leaves was measured with the method described by the study of Bates and Teare [31]. Apricot leaves in four replicates were collected on 30, 28, and 29 September in 2016, 2017 and 2018, respectively, and frozen immediately and stored at −20 °C. A mixture of frozen leaves (1 g) and sulfosalicylic acid (3%) was homogenized then the tubes were centrifuged at 12,000× g for 10 min. 1 mL of supernatant was mixed with 1 mL of 1:1 (v/v) ratio of glacial acetic acid and ninhydrin reagent. The mixture solution was placed in water bath at 100 °C for 1 h. Then the samples were extracted with toluene. The absorption of the solution was measured by a spectrophotometer (BioTek Instruments Inc., VT 05404-0998, Winooski, VT, USA) at 520nm wavelength. The proline concentration was determined from a standard curve and the proline content was expressed as (μg g−1) of fresh matter.

2.6. Statistical Analysis

2.6.1. ANOVA

A randomized complete block design (RCBD) was used to prepare the treatments. ANOVA was performed to analyze data set using an SPSS program (SPSS Inc., Chicago, IL, USA). The effects of DI treatments (control, RDIm, RDIs, and CDI), cultivars (‘Ninfa’ and ‘Canino’), growing season i.e., year (2016, 2017, and 2018) and their two- and three-way interactions were evaluated on all the 17 measures of tree physiological and chemical properties. Duncan’s multiple range tests were used to separate means at P = 0.05 levels.

2.6.2. Prediction Based Model Analysis

GLMs (Generalized Linear Models) were conducted, as a 3-way factorial ANOVA [32]. We used the models to predict all the 17 measures of tree physiological and chemical properties as the dependent variables (biological parameters), the independent variables were the factorial variables of irrigation treatment, cultivar and growing season i.e., year. A model for each measure (i.e., for all the 17 measures) was determined. The dataset were separated into a training and a testing part in 50–50%. Models were trained with the k-fold cross-validation method: we applied five folds with five repetitions using the training data. k-fold cross-validation starts with splitting randomly the input data into k-folds; in our case it was a split into five folds where four folds were used to train the models and one was used for testing. In the next step, other four folds were considered as training data and another one for testing. The procedure stops when all folds had been used as testing data. The whole procedure was repeated five times with new randomly selected folds [33,34]. Thus, we were able to exclude the possibility to gain a favorable or an inappropriate model by chance, we had 25 repetitions, with 25 R2, Mean Absolute Error (MAE), and Root Mean Square Error (RMSE). The great advantage of the k-fold cross-validation is that all models are applied on independent data (i.e., on a fold which was not included in the training), and the several model solutions provide a feedback on data reliability: if ranges of model fit parameters are in a narrow range, all models tend to justify the usability of a model.
Then, we applied the model on the independent part of the dataset, i.e., testing data. Predictions (modelled data) were compared to the observed data, and differences were plotted on the combination of a violin plot vs. boxplot using the factors of cultivars, irrigation deficit, and the years of measurements. This approach ensured to report effectiveness of the factors as predictors. ANOVA usually reveals the efficiency of a factor with justifying the H0: group means do not differ significantly. Our approach used the model and the result showed, beside the group differences, more importantly, how accurate predictions can be gained with the factors. If a GLM model was accurate, differences between observed and predicted values were around 0, while large deviations indicated issues in the predictors. The satisfactory model efficiency was evaluated using the relationship between RMSE of the models and the standard deviation (SD) of the observed data. Then the criterion for goodness-of-fit of the models was determined by the calculation of Nash–Sutcliffe efficiency (NSE) coefficient [35]. An NSE coefficient value above 0.65 indicated acceptable model fit to the observed data.
Modelling, prediction and model evaluation, was conducted in R 4.04 [36] with the caret and ggplot2packages [37,38].

2.6.3. Correlation and Linear Regression Analyses among Parameters

In order to quantify relationships among the 17 measures of the tree physiological and chemical properties, Pearson’s correlation coefficients were determined for the relationships of the measures in all combinations (136 variable pairs). Correlation analyses were done for the total data of DI treatments and also separately for each DI treatment. Pearson’s correlation analyses were performed by using Genstat 5 Release 4.1 (Lawes Agricultural Trust, IACR, Rothamsted, UK). Then, the best-correlated variable pairs were further analyzed by linear regression analyses using the equation of f(x) = ax + b. Then, a t-test was used for comparing regression slopes in order to quantify the differences among the four DI treatments (control, RDIm, RDIs, and CDI) at P = 0.05.

2.6.4. Principal Component Analysis

A standardized Principal Component Analysis (PCA) was prepared based on the correlation matrix with the CR, HR, DEDFH, sGDD, TNB, NFB, NVB, SDF, NOFB, FBA, FS, SVG, FNT, FW, FY, TSC, and TPC variables. A standardization of all variables was prepared transforming the values to z-scores. Model fit had been tested with the Root Mean Square Residual (RMSR) [39]. Principal Components (PCs) were plotted in biplot diagrams. PCA was performed in R 4.04 [36] with the psych [40], FactoMiner [41] and factoextra [42] packages.

3. Results

3.1. The Effect of Treatment Factors on Tree Physiological and Chemical Properties

3.1.1. General Measures for Tree Physiological Properties

Analysis of variance (ANOVA) on CR showed that there was a significant (P < 0.05) effect for irrigation treatments and cultivars, while the year variable was non-significant. There were no significant two- or three-way interactions for the treatments’ effects (Table 3). According to ANOVA, the data were presented as the average of 3 years (Figure 3A).
The lowest CR value was 307.9 h in the control irrigation treatment for cv. ‘Canino’, while the highest one was 391.8 h in the CDI treatments for cv. ‘Ninfa’ (Figure 3A). Cultivar ‘Canino’ showed significantly lower mean CR values compared to cv. ‘Ninfa’ (means were 326.06 and 364.4 h, respectively). The two cultivars showed different effect of the DI treatments on CR. Treatments of RDIm and RDIs resulted in significant reduction in CR compared to control or CDI treatments for cv. ‘Ninfa’. On the other hand, treatments of RDIs and CDI resulted in significant increase in CR compared to control or RDIm treatments for cv. ‘Canino’. For this cultivar, treatments of RDIs and CDI as well as treatments of control and RDIm did not differ from each other at P < 0.05.
ANOVA on HR showed that there was a significant (P < 0.05) effect for irrigation treatment and cultivar, while the year variable was non-significant. There were no significant two- or three-way interactions for the treatments’ effects (Table 3). According to ANOVA, the data were presented as the average of 3 years (Figure 3B). The lowest HR value was 4542.2 h in the CDI treatment for cv. ‘Ninfa’, while the highest one was 5518.9 h in the RDIm treatment for cv. ‘Canino’ (Figure 3B). Cultivar ‘Ninfa’ showed significantly lower mean HR values compared to cv. ‘Canino’ (means were 4623.4 and 5418.2 h, respectively). The two cultivars showed different effect of the DI treatments on HR. Treatments of RDIm, RDIs and CDI resulted in significant reduction in HR compared to control for cv. ‘Ninfa’ but the three DI treatments did not differ significantly from each other. Treatments of RDIm and CDI resulted in significant increase in HR compared to control or RDIs treatments for cv. ‘Canino’. For this cultivar, treatments of RDIm and CDI as well as treatments of control and RDIs did not differ from each other at P < 0.05.
ANOVA on DEDFH showed that there was a significant (P < 0.05) effect for cultivar, while the irrigation treatment and the year variable were non-significant. There were no significant two- or three-way interactions for the treatments’ effects (Table 3). Therefore, data were discussed only for the two cultivars as the average of 3 years and four irrigation treatments. The DEDEH value of cv. ‘Ninfa’ (63.6 days) was significantly lower than that of cv. ‘Canino’ (71.1 days).
ANOVA on sGDD showed that there were significant (P < 0.05) effects for year and cultivar, while the irrigation treatment was non-significant. There were no significant two- or three-way interactions for the treatments’ effects (Table 3). According to ANOVA, the data were presented as the average of the four irrigation treatments (Figure 4). The lowest sGDD value was 1101.6 days in 2016 for cv. ‘Ninfa’, while the highest one was 1368.6 days in 2018 for cv. ‘Canino’ (Figure 4). Cultivar ‘Ninfa’ showed significantly lower mean sGDD values compared to cv. ‘Canino’ (means were 1170.5 and 1315.8 days, respectively). Values of sGDD was significantly higher in 2017 and 2018 than in 2016 for cv. ‘Ninfa’ while the years of 2018 and 2016 differed significantly for cv. ‘Canino’.

3.1.2. Bud Related Measures for Tree Physiological Properties

ANOVA on TNB showed that there was a significant (P < 0.05) effect for irrigation treatment and cultivar, while the year variable was non-significant (Table 4). There were no significant two- or three-way interactions for the treatments’ effects. According to ANOVA, the data were presented as the average of 3 years for TNB (Figure 5A). The lowest TNB value was 104.6 buds in CDI treatment for cv. ‘Canino’, while the highest one was 128.9 buds in the control treatments for cv. ‘Ninfa’ (Figure 5A). Cultivar ‘Ninfa’ showed significantly higher mean TNB values compared to cv. ‘Canino’ (means were 120.9 and 109.8 buds, respectively). The two cultivars showed different effect of the DI treatments on TNB. Treatments of RDIm, RDIs and CDI resulted in significant reduction in TNB compared to control treatments for cv. ‘Ninfa’ but the three DI treatments did not differ significantly from each other. Treatments of RDIs resulted in a significant increase in TNB compared to control or CDI treatments for cv. ‘Canino’.
ANOVA on NFB showed a significant effect for cultivar, while the year variable and irrigation treatment were non-significant (Table 4). There were no significant two- or three-way interactions for the treatments’ effects. Therefore, data were discussed only for the two cultivars as the average of 3 years and four irrigation treatments. The NFB value of cv. ‘Ninfa’ (86.3 buds) was significantly higher than that of cv. ‘Canino’ (77.9 buds).
ANOVA on NVB showed a significant effect for irrigation treatment, while the year variable and cultivar were non-significant (Table 4). There were no significant two- or three-way interactions for the treatments’ effects. According to ANOVA, the data were presented as the average of 3 years and two cultivars for NVB (Figure 5B). The NVB value of CDI treatment (29.3 buds) was significantly lower than that of the RDIs or control treatments (34.0 and 36.7 buds, respectively).
ANOVA on SDF showed a significant effect for year, irrigation treatment and cultivar (Table 4). There were no significant two- or three-way interactions for the treatments’ effects. Therefore, SDF data set were shown separately for years, cultivars, and irrigation treatments (Table 5). The lowest SDF value was 66.0 in RDIm treatment for cv. ‘Canino’ in 2017, while the highest one was 79.0 in the RDIs treatments for cv. ‘Canino’ in 2016 (Table 5). Mean SDF values for cultivars showed that cv. ‘Ninfa’ showed significantly higher mean SDF values in 2017 compared to cv. ‘Canino’ (73.5 and 67.9, respectively). The significance of SDF values within irrigation treatments greatly varied among years and cultivar. Consistent significant differences (at P < 0.05) among SDF values were found between RDIm and CDI treatments in the overall year analyses for cv. ‘Ninfa’ but this effect was significant only in 2017 for cv. ‘Canino’.
ANOVA on NOFB showed that there was a significant (P < 0.05) effect for irrigation treatment and cultivar, while the year variable was non-significant (Table 4). There were no significant two- or three-way interactions for the treatments’ effects. According to ANOVA, the data were presented as the average of 3 years for NOFB (Figure 5C). The lowest NOFB value was 52.3 buds in CDI treatment for cv. ‘Canino’, while the highest one was 68.3 buds in the control treatments for cv. ‘Ninfa’ (Figure 5C). Cultivar ‘Ninfa’ showed significantly higher mean NOFB values compared to cv. ‘Canino’ (means were 64.1 and 56.4 buds, respectively). The two cultivars showed different effect of the DI treatments on NOFB. Treatments of RDIs and CDI resulted in significant reduction in NOFB compared to control treatments for both cultivars but these two DI treatments did not differ significantly from each other.
ANOVA on FBA showed a significant effect for the year variable and irrigation treatment, while cultivar was non-significant. Significant two- or three-way interactions were not detected for the treatments’ effects (Table 4). According to ANOVA, FBA data were presented as the average of the two cultivars (Figure 5D). The lowest FBA value was 18.9% in the control treatment in 2016, while the highest one was 33.9% in the CDI treatments in 2017 (Figure 5D). Mean FBA values in 2017 was significantly higher than FBA values in 2016 or 2018 (means were 24.9, 28.1, and 24.5, for 2016, 2017, and 2018, respectively). In general, DI treatments increased FBA values compared to the control treatment but the treatment of CDI resulted in a significant increase in all years compared to the control treatment.

3.1.3. Yield Related Measures for Tree Physiological Properties

ANOVA on FS, SVG, FNT, and FY showed that there were significant (P < 0.05) effects for irrigation treatment and cultivar, while the year variable was non-significant (Table 6). There were no significant two- or three-way interactions for the treatments’ effects. According to ANOVA, the data of FS, SVG, FN, and FY were presented as the average of 3 years for FS (Figure 6A–D).
The lowest mean FS value was 26.1% in CDI treatment for cv. ‘Canino’, while the highest one was 39.7% in the RDIm treatments for cv. ‘Ninfa’ (Figure 6A). Cultivar ‘Ninfa’ showed significantly higher mean FS values compared to cv. ‘Canino’ (means were 38.2 and 29.4%, respectively). The two cultivars showed different effect of the DI treatments on FS. Treatments of RDIm and RDIs resulted in a significant increase in FS values compared to control or CDI treatments, and FS values were significantly higher in the RDIm treatment than RDIs one for cv. ‘Ninfa’. FS values in RDIs and CDI treatments were significantly lower than in the control or RDIm treatments for cv. ‘Canino’.
The lowest mean SVG value was 23.4 cm in CDI treatment for cv. ‘Canino’, while the highest one was 43.0 cm in the control treatments for cv. ‘Ninfa’ (Figure 6B). Cultivar ‘Ninfa’ showed significantly higher mean SVG values compared to cv. ‘Canino’ (means were 37.0 and 31.5 cm, respectively). The two cultivars showed different effects of the DI treatments on SVG. Treatments of RDIm, RDIs, and control resulted in a significant increase in SVG compared to the CDI treatment for cv. ‘Ninfa’, but SVG values of the three treatments were not significantly different (Figure 6B). Values of SVG in the RDIs and RDIm treatments were significantly higher compared to the CDI treatment but were significantly lower compared to the control treatment for cv. ‘Canino’.
The lowest mean FNT value was 138.8 in CDI treatment for cv. ‘Canino’, while the highest one was 367.7 in the RDIm treatments for cv. ‘Ninfa’ (Figure 6C). Cultivar ‘Ninfa’ showed significantly higher mean FNT values compared to cv. ‘Canino’ (means were 265.3 and 182.3, respectively). FNT values of all DI treatments differed from each other at P = 0.05 for both cultivars. The lowest FNT values were obtained for the CDI treatments for both cultivars. All other DI treatments were significantly higher compared to CDI treatment for both cultivars.
The lowest mean FY value was 5.0 kg tree−1 in CDI treatment for cv. ‘Canino’, while the highest one was 13.5 in the RDIm treatments for cv. ‘Ninfa’ (Figure 6D). Cultivar ‘Ninfa’ showed significantly higher mean FY values compared to cv. ‘Canino’ (means were 10.0 and 6.4, respectively). The two cultivars showed different effect of the DI treatments on FY. The RDIm treatment resulted in significantly higher FY values compared to RDIs, CDI, and control treatments for cv. ‘Ninfa’, but FY values of these three treatments were not significantly different. Values of FY in the fully irrigated control treatments were significantly higher compared to FY values of RDIm, RDIs, and CDI treatments for cv. ‘Canino’ but FY values of these three treatments were not significantly different.
ANOVA on FW showed that there was a significant (P < 0.05) effect for cultivar, while the year and irrigation treatment were non-significant. There were no significant two- or three-way interactions for the treatments’ effects (Table 6). Therefore, data were discussed only for the two cultivars as the average of 3 years and 4 irrigation treatments. The mean FW value of cv. ‘Ninfa’ (38.3 g) was significantly higher than that of cv. ‘Canino’ (34.9 g).

3.1.4. Measures of Tree Chemical Properties

ANOVA on TSC showed a significant effect for year, irrigation treatment and cultivar (Table 7).
There were no significant two- or three-way interactions for the treatments’ effects. Therefore, TSC data set were shown separately for years, cultivars and irrigation treatments (Table 8). The lowest TSC value was 109.4 mg g−1 in CDI treatment for cv. ‘Canino’ in 2017, while the highest one was 153.0 mg g−1 in the control treatment for cv. ‘Ninfa’ in 2018 (Table 8). Mean TSC values for cultivars showed that cv. ‘Ninfa’ showed significantly higher mean TSC values compared to cv. ‘Canino’ in all years (overall mean values were 132.5 and 124.7 mg g−1, respectively). TSC values of RDIm, RDIs and CDI treatments were significantly lower for both cultivars compared to the control treatment in all years. TSC values of the RDIm treatment were significantly higher for cv. ‘Ninfa’ compared to the RDIs and CDI treatments in all years. TSC values of RDIm, RDIs, and CDI treatments were not significantly different from each other for cv. ‘Canino’ in the three years.
ANOVA on TPC showed that there were significant (P < 0.05) effects for irrigation treatment and cultivar, while year was non-significant (Table 7). There were no significant two- or three-way interactions for the treatments’ effects. According to ANOVA, the data of TPC were presented as the average of 3 years for TPC (Figure 7). The lowest mean TPC value was 26.3 μg g−1 in control treatment for cv. ‘Ninfa’, while the highest one was 67.4 μg g−1 in the CDI treatments for cv. ‘Ninfa’ (Figure 7). Cultivar ‘Ninfa’ showed significantly higher mean TPC values compared to cv. ‘Canino’ (means were 43.7 and 39.6 μg g−1, respectively). Treatments of RDIm, RDIs and CDI resulted in significant increase in TPC compared to the control treatment for cv. ‘Ninfa’, and TPC values were significantly different in all the four irrigation treatments. TPC values in RDIs and CDI treatments were significantly higher than in control or RDIm treatments for cv. ‘Canino’. TPC values in the control or RDIm treatments were not significantly different for cv. ‘Canino’.

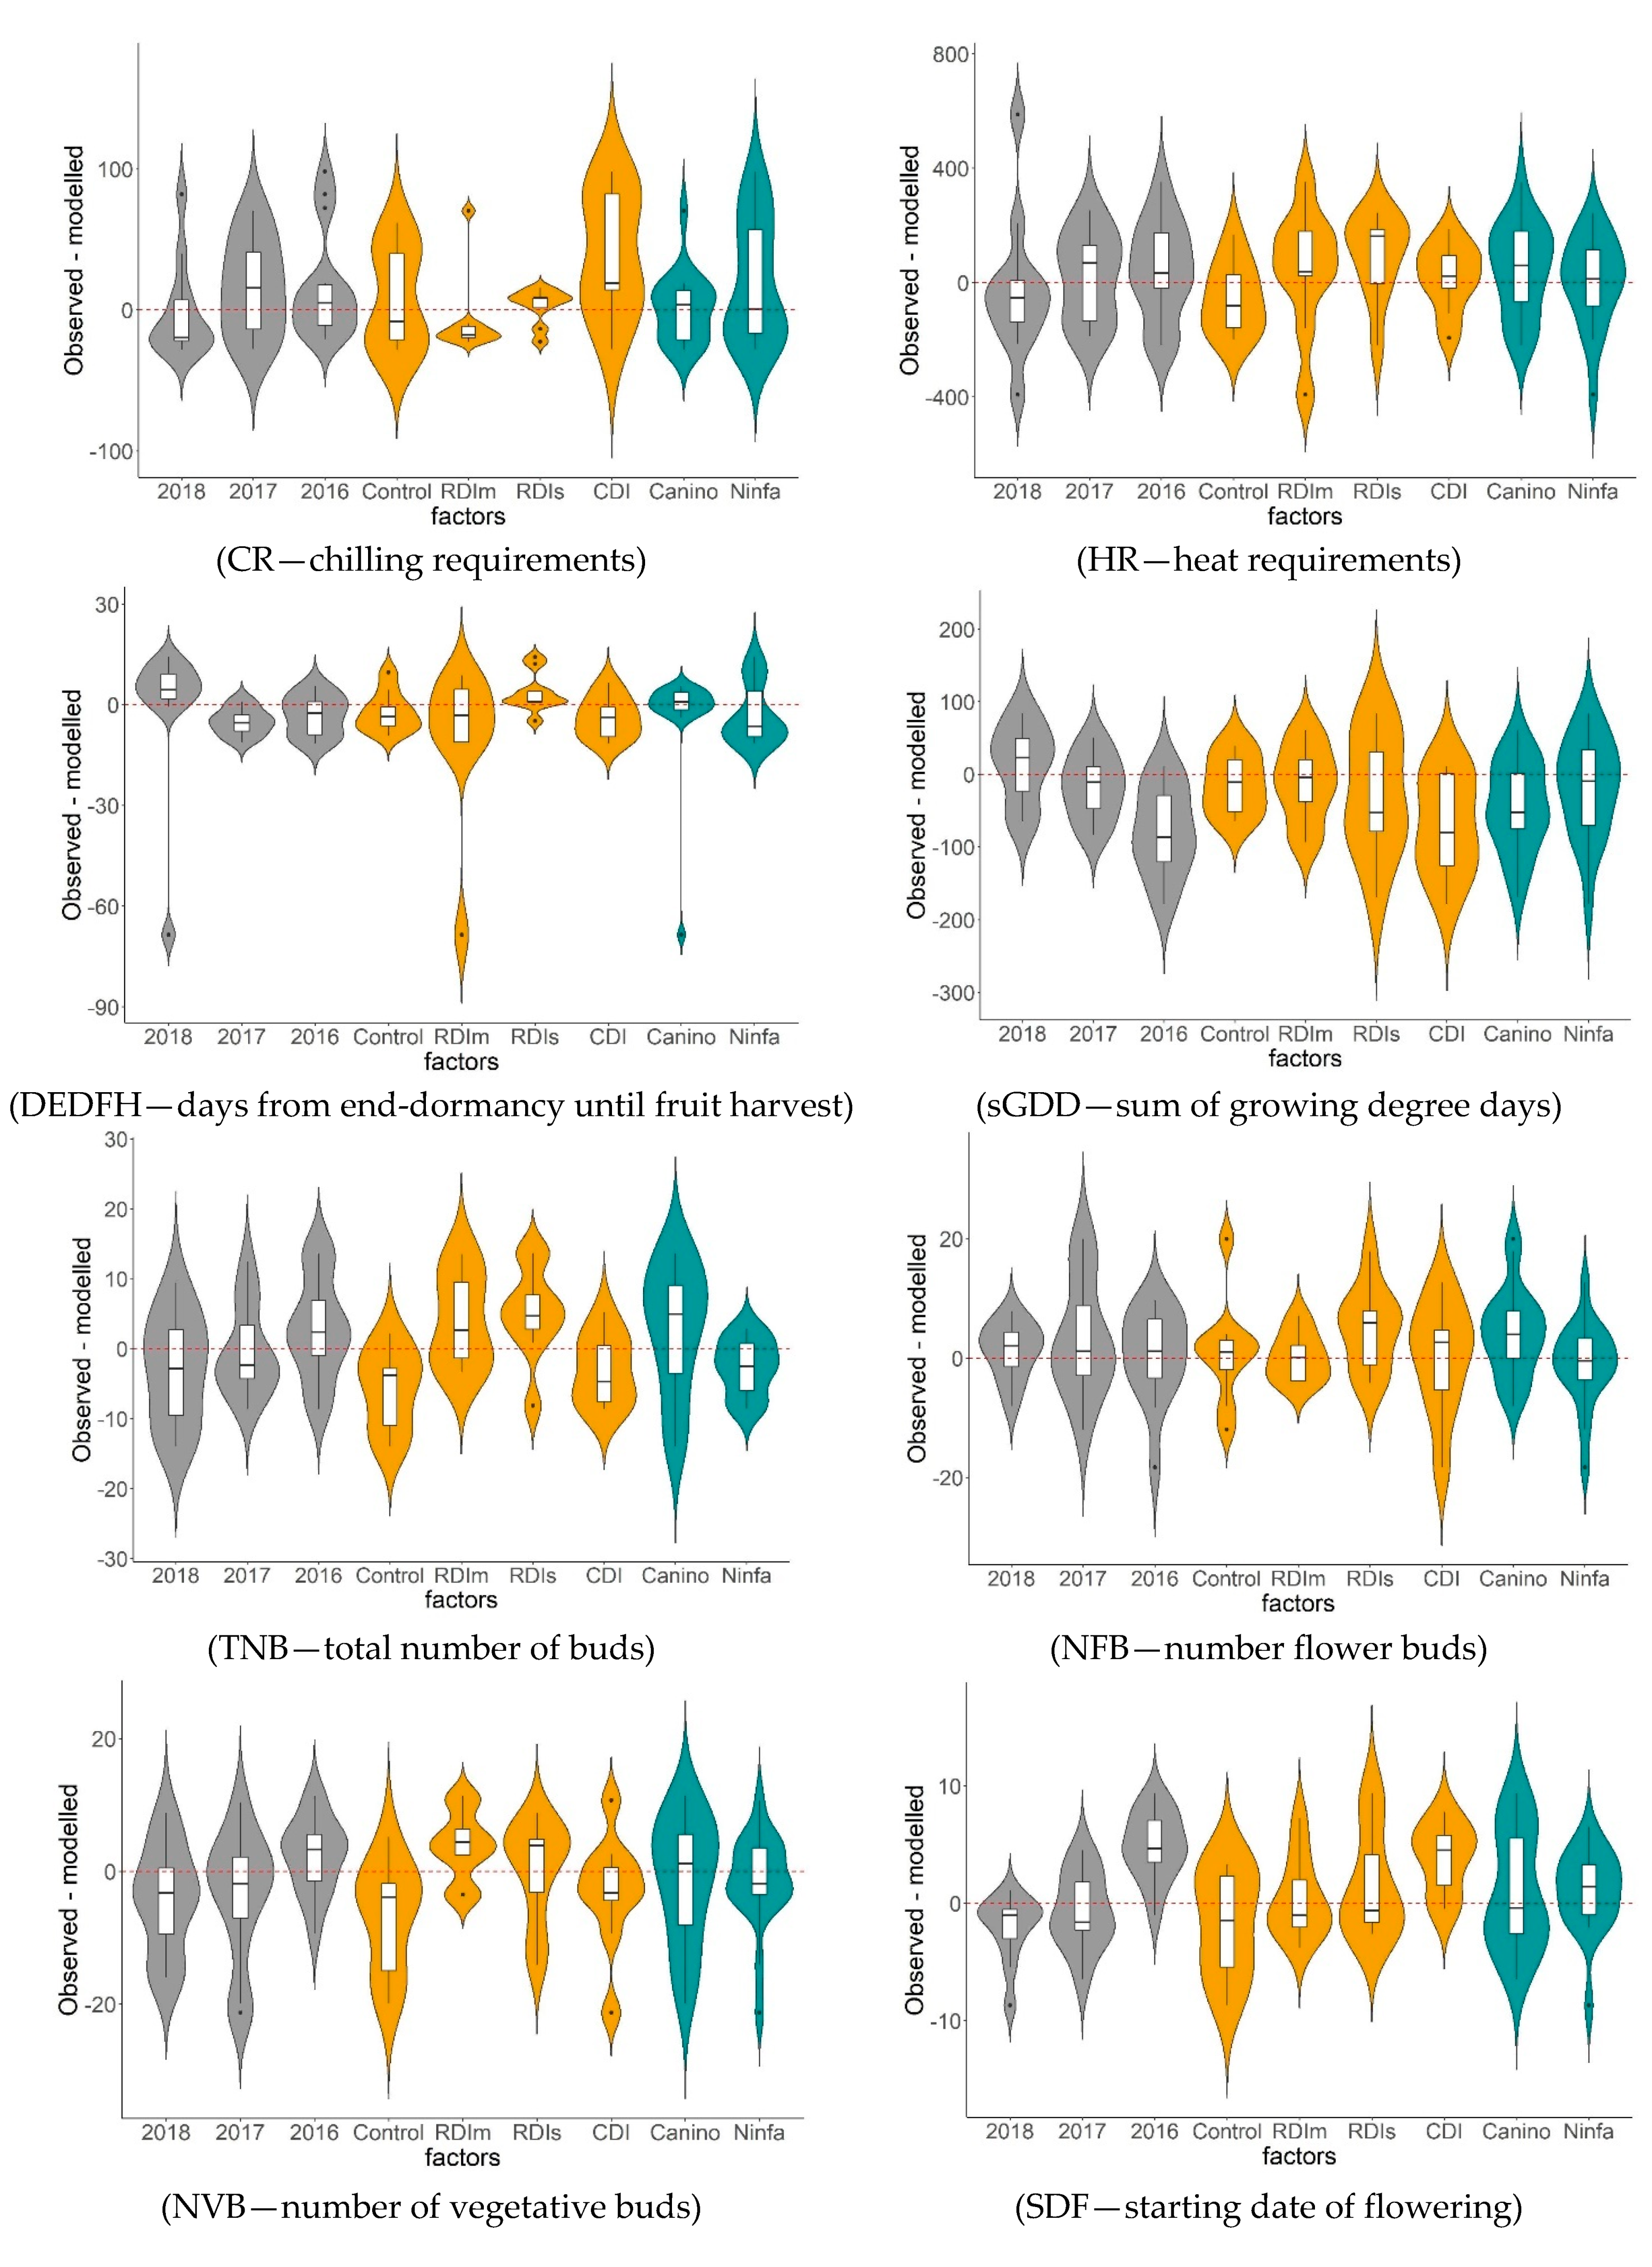
3.2. Prediction Based Model Analysis

Prediction based model analysis showed that the differences of the GLM predicted (violin plot) vs. the observed (boxplot) data (Figure 8) were larger than 0 for all the 17 tree measures and for all the three factors (years, irrigation treatments, and cultivars). Thus the GLM models slightly underestimated the real (observed) values for the 17 measures (median RMSEs were 23.39, 185.27, 7.77, 62.7, 9.04, 8.81, 9.14, 3.76, 6.24, 5.18, 7.03, 3.74, 43.2, 5.63, 2.49, 8.12, and 5.32, for CR, HR, DEDFH, sGGD, TNB, NFB, NVB, SDF, NOFB, FBA, FS, SVG, FNT, FW, FY, TSC, and TPC, respectively). However, the efficiency of most models was satisfactory based on the relationship between RMSE of the models and SD of the observed data. According to the calculated NSE coefficient values (ranging between 0.65 and 0.9), the best goodness-of-fit of the predicted GLM models was reached for the measures of HR, NOFB, FS, SVG, FNT, TSC, and TPC.

3.3. Relationship among Parameters

3.3.1. Pearson Correlation Analyses

When all data set for irrigation treatments, cultivars and years were analyzed together, 136 variable pairs were correlated from which 29 pair-variables correlated significantly at P = 0.05 probability level (Table 9A). When data set of 4 × 136 parameter pairs were analyzed separately for each of the four irrigation treatments, 45, 55, 53, and 43 pair-variables correlated significantly in the control, RDIm, RDIs, and CDI irrigation treatments, respectively (Table 9B,C,D,E).
Among these significant pair-variables, 22 pair-variables were significant in all the four irrigation treatments. Among these 22 pair-variables, 16 were correlated positively (TNB versus (vs.) NFB, TNB vs. NOFB, NFB vs. NOFB, NFB vs. FNT, NFB vs. FY, NFB vs. FW, NOFB vs. SVG, NOFB vs. FNT, NOFB vs. FY, FS vs. FNT, FS vs. FY, SVG vs. FNT, SVG vs. FY, SVG vs. TSC, FNT vs. FY, and FY vs. FW) and 6 negatively (CR vs. TSC, HR vs. TNB, HR vs. NFB, HR vs. FNT, HR vs. FY and NOFB vs. FBA) indicating strong connection among tree physiological and chemical properties (Table 9).

3.3.2. Linear Regression Analyses

The significant 22 pair-variables were further presented by linear regression analysis, showing the data of the four DI treatments (control, RDIm, RDIs, and CDI) with separated symbols (Figure 9). All the 22 pair-variables showed significant linear relationships with r values ranging from 0.689 to 0.903, and with P values ranging from 0.049 to 0.001. However, no differences were observed among the slope parameters for all pair-variables among the control, RDIm, RDIs, and CDI treatments as t-tests showed P values ranging from 0.847 to 0.059.

3.3.3. Principal Component Analyses

PCA explained the 82% of the total variance for the treatments (Figure 10A,B). Number of PCs had been justified by the RMSR: 0.06 (5 PCs), indicating a good fit.
PC1 explained 23% of the total variance and correlated with the HR, TNB, FS, FNT, and FY (Figure 10A,B). PC2 explained 21% of the total variance and correlated with the FBA, SVG, TSC, and TPC. PC3 explained 15% of the total variance and correlated with the NFB, NVB, and NOFB. PC4 explained 13% of the total variance and correlated with the CR, TNB, and NVB. In addition, 10% of the variance was accounted for PC5 and correlated with the sGDD and SDF.
The biplot figure for DI treatments showed that both PC1 and PC2 axes were dominant for all the four DI treatments (control, RDIm, RDIs, and CDI) (Figure 10A). The biplot figure showed that PC2 axes were dominant for CDI treatment while PC1 axes were the most dominant for RDIm treatment (Figure 10A).
The biplot figure for cultivars showed that both PC1 and PC2 axes were dominant for the two cultivars (‘Ninfa’ and ‘Canino’) (Figure 10B). The biplot figure showed that PC1 axes were more dominant for cv. ‘Canino’ while PC2 axes were more dominant for cv. ‘Ninfa’ (Figure 10B).
The decisive role of these two PC groups was also indicated by long arrows’ length and proximity of the variables of HR, TSC, SVG, FNT, FY, TPC, and FBA. These results indicated strong associations among tree physiological and chemical properties (Figure 10A,B).

4. Discussion

This study reported the various effects of different DI strategies on tree physiological and chemical attributes on two commonly grown apricot cultivars (‘Ninfa’ and ‘Canino’) in a semiarid Mediterranean region under sandy loam soil conditions in order to promote possible solutions to the water scarcity problem in apricot production [3].
In this study, ANOVA showed that CR were significantly affected by DI treatment and apricot cultivars under semiarid Mediterranean conditions in Egypt (Table 3) and CR increased by increasing water deficit (Figure 3A). This result was in agreement with the study of Nasrabadi et al. [43] who showed that CR was significantly affected by DI treatments on pomegranate trees. The authors revealed that water deficit in the soil resulted in an increase of chilling requirement; but the level of response varied by cultivars [43]. This cultivar difference under DI treatments was also detected in this study for apricot (Figure 3A). All these results showed that water deficit increases CR for apricot and pomegranates. This indicates that the required duration for winter cold temperature for completing CR has to be longer under increasing water deficit conditions in order to ensure regular flowering, fruit set, and fruit yield of the trees. This result is a strong practical indication for temperate fruit tree production of the Mediterranean regions as negative effects of the insufficient rates of chilling accumulation can be more severe in the Mediterranean regions, such as in Egypt compared to more cool regions of temperate fruit tree production [44,45]. Our results also indicated that growers in the Mediterranean regions have to choose an apricot cultivar with a lower CR if a water DI scheme is planned to be applied during fruit production. For an adequate cultivar selection, previous apricot studies [26,28,46,47] including this study, reported the CR values (between 322 and 1266 chill units) of apricot cultivars under Mediterranean climate conditions.
In this study, ANOVA showed that HR was significantly affected by DI treatment and apricot cultivars under Mediterranean climate conditions in Egypt (Table 3) but HR had no consistent increase or decrease with increasing water deficit (Figure 3B). HR was not significantly affected by different DI treatments for the pomegranate tree in a previous study of Nasrabadi et al. [43], while the cultivars showed significantly different heat requirements, which coincided with this study too (Table 3 and Figure 3B). The differences among the HR values of the apricot cultivars may be genetically determined as a wide range of HR values was reported for various apricot genotypes in previous studies [26,28,46].
In this study, ANOVA showed that irrigation treatments had significant effect on TNB and NVB (Table 4) which indicated that these bud measures were sensitive to DI treatments. However, increasing water deficit showed no clear decrease or increase in the bud numbers (Figure 5A,B). For instance, values of the TNB significantly decreased in the DI treatments of RDIs compared to fully irrigated control treatment for cv. ‘Ninfa’, while TNB significantly increased in the RDIs treatments compared to control for cv. ‘Canino’ (Figure 5A). Values of NVB in the RDIs treatments increased again compared to the control one (Figure 5B). However, the number of flower buds (NFB) was insensitive to DI treatments (Table 4). This latter result coincide with pervious results of Demirtas et al. [48] and Blanco et al. [49] in their sweet cherry studies, where authors showed that different water DI strategies did not result in significant differences for number of flower buds. However, Blanco et al. [49] also indicated that different level of water deficit resulted in an inconsistent response on the number of flower buds.
In this study, DI treatments showed significant effect on flowering and fruit set including the measures of SDF, NOFB, FBA, and FS (Table 4, Table 5 and Table 6, Figure 5 and Figure 6). Among bud and flower measures, cultivars showed significant effects on SDF, NOFB and FS but not on FBA (Table 4, Table 5 and Table 6, Figure 5 and Figure 6). Similarly to our results, several previous studies on fruit trees showed that periods of flowering and fruit set were sensitive to water restrictions [50,51,52,53,54,55,56,57,58,59,60,61,62]. Several studies found that water stress during flowering and fruit set stages decreased fruit set and increased the abscission of flowers, fall of young fruits; and consequently, reduced yield on citrus trees [51,53,54], sweet oranges [60], pear [57], apricot [55], and peach [61]. On the other hand, some other studies showed that the DI strategy enhanced flowering on pomegranate [62], loquat [58], pear [50], mango [52], and apricot [56]. In addition, some further studies showed no effects of DI on flowering and fruit sets on sweet cherry [49] and apricot [15,18,23,55,63]. Some earlier studies emphasized that lower fruit sets of deciduous trees occurred only under severe water deficit conditions during the postharvest period [64]. It was also reported that the use of a moderate water deficit strategy caused no effect on fruit sets if it was used in the non-sensitive phenological periods [15,18,23,49]. The various results of the studies suggest that joined factors can play a role in the effect of DI on flowering and fruit set. Such an essential combined effect can be the level of water deficit and crop load [65], as the high fruit load can decrease the fruit growth with increasing water deficit and may also delay the recovery from the water stress.
In this study, ANOVA showed that SVG was significantly affected by the DI treatments and cultivars (Table 6) and SVG significantly decreased with severe water deficit (Figure 6B). The increasing water stresses significantly lowered SVG on cv. ‘Canino’ in all DI treatments; however, on cv. ‘Ninfa’, only the most severe water deficit treatment lowered SVG considerably (Figure 6B). Many previous studies showed that yearly vegetative growth significantly decreased in the DI treatments on apricot [11,18,66], pomegranate [43], lemon [67,68], peach and pear [6,61,69,70,71,72], apple [7,73], sweet cherry [49,74,75,76], and olive [77]. Consequently, the RDI technique can be a useful tool to manipulate vegetative growth [78,79]. However, for a successful application of RDI, a clear separation is needed between the vegetative and fruit growth periods, because a detrimental effect can occur on yield if vegetative and fruit growth processes overlap.
In this study, ANOVA showed that FNT and FY were significantly affected by DI treatment and cultivars (Table 6) while FW was significantly affected by only cultivars (Table 6). In case of cv. ‘Ninfa’ both yield measures significantly increased in moderate RDI (RDIm) treatments compared to the fully irrigated control one (Figure 6C,D). In previous studies, the fruit growth was not reduced during the early fruit growth stages when moderate DI managements were applied compared with the fully irrigated trees. Moreover, even a stimulated fruit growth occurred when irrigation was increased to 100% ETc during the subsequent phenological stages. This was confirmed on apricot [23,64], citrus [80,81], pear [70,82] and apple [83] although no such results have been reached in other studies [61,67]. In this study, FNT and FY were significantly decreased in the severe water deficit treatment (CDI) on both apricot cultivars (Figure 6C,D). Our results coincided with the study of Peres-Pastor et al. [66], who showed that that RDI reduced yield when water deficits were severe. Such severe deficit induced an additional decrease in the vegetative growth of the trees which resulted in a significant reduction in the fruit numbers per tree. Peres-Pastor et al. [66] also showed that moderate water deficit treatments provided similar yields to the well irrigated treatment when the water deficit was applied before the fruit growth stage III; which also coincided with the results of this study in the RDIm treatment for cv. ‘Ninfa’. Therefore, the final stages of fruit growth (stage III) have to be considered as the most sensitive period for apricot irrigation. This is in agreement with other studies as different water deficit intensities during the fruit growth stage III caused a reduction of fruit diameter and fruit number, which adversely affected yield too [54,64,66,68,81,84,85].
The overall results on vegetative and generative growth indicated relative clear separations between shoot and fruit growth periods for apricot trees, which give the option to apply an RDI strategy successfully. Yield can remain unaffected with an appropriate use of RDI, while shoot growth can be reduced and water can be saved [18,23,86,87]. The strong connections between vegetative and yield parameters were also supported by the strong correlation coefficient values between SVG and FNT, and between SVG and FY in all DI treatments of this study (Table 9). In addition, this study showed overall strong associations among measures of bud vs. vegetative tree parts vs. generative tree parts vs. yield for all DI treatments; in correlation analyses for instance between flower bud vs. opened flower bud, fruit bud vs. shoot growth, fruit bud vs. yield, and fruit set vs. yield (Table 9); and in factor analyses of PC1, for instance, among bud numbers, fruit set, and yield (Figure 10).
This study showed that DI treatments, cultivars, and years had significant effects on the carbohydrate contents of apricot leaves (Table 7 and Table 8). In agreement with this study, Nasrabadi et al. [43] also found that the effect of DIs, cultivars, and years were significant for non-structural carbohydrate content in pomegranate leaves. In this study, the carbohydrate contents were gradually decreased by the reductions of supplied water. In line with our study, Soliman et al. [7] and Nasrabadi et al. [43] reported that the leaf area and non-structural carbohydrates significantly decreased on apple and pomegranate, respectively, in water deficit treatments compared to the well irrigated ones. Wong et al. [88] showed that a reduction in carbohydrate contents of leaves under water deficit conditions is due to the reduction in the photosynthesis of the leaves. This was in line with the study of Romero et al. [89] who reported that the photosynthetic capacity significantly decreased in young branches of almond trees under DI conditions. The reduction in the photosynthesis of leaves under water deficit conditions is related to the demolition of chlorophyll structure [90]. In addition, xylem structures also changed under water deficit conditions, which caused a decrease in the water movement from the roots to the leaves, and the leaves closed their stomata to prevent water losses [91]. The closed stomata reduce the photosynthetic rates of the leaves and the plant use the non-structural carbohydrate reserves [92]. Wong et al. [88,93] also showed that the amount of stored starch is essential for seasonal growth and tree vitality. In agreement with the above statements, the results of this study showed that SVG and TSC contents decreased in the DI treatments and they have significant inter-correlations with each other (Figure 6B, Table 7, Table 8 and Table 9). Thus, a reduced water supply caused a reduction in the photosynthetic activity of the apricot leaves, which resulted in decreased carbohydrate contents and a subsequent delay in the vegetative growth of apricot tree.
Our study showed significant negative correlations between the content on carbohydrate and chilling requirements in all DI treatments (Table 9). In agreement with this study, Nasrabadi et al. [43] also showed that pomegranate trees with high CR values had a low concentration of non-structural carbohydrates at the end of the growing season. Nasrabadi et al. [43] also noted that the correlation between the carbohydrate concentration and the heat requirement was nonsignificant, which corroborated with our non-significant relationships between TSC on HR in both correlation and regression analyses for apricot (Table 9).
This study showed that DI treatments and cultivars had significant effects on leaf proline contents (Table 7 and Figure 7). Treatments with increasing water deficit resulted in a significant increase in the leaf proline content for both apricot cultivars compared to the fully irrigated control treatment (Figure 7), which were in agreement with the study of Faghih et al. [94] on apple and Laajimi et al. [16] on apricot. Previous studies showed that proline accumulation in plants plays a protective role against the environmental stresses [95,96,97], such as limited availability of water due to soil water depletion or high temperature stress inducing an increased transpiration rates [98,99]. Proline is commonly increased during drought stress, which eliminates ROS and protects the plant cell membranes and antioxidant enzymes [100], and thus, the increased proline content can effectively prevent leaves from water loss [101,102]. Our study also indicated that apricot cultivars can accumulate different levels of proline, which was also in agreement with previous results on citrus trees [98,99].

5. Conclusions

The shortage of water resources and low chilling hours are considered as key challenges for apricot production in saline soil under semiarid climate conditions such as Egypt. Therefore, here we showed (i) overall effects of three water saving DI treatments (RDIm, RDIs, and CDI) on 17 measures of tree physiological and chemical properties, (ii) prediction based model analyses for the 17 measures and (iii) the inter-correlations of the 17 measures specified to DI treatments on two apricot cultivars in Egypt.
  • Results showed that values of CR, HR, TNB, SDF, NOFB, FS, SVG, FNT, FY, TSC, and TPC values were affected significantly by both DI treatments and cultivars. Values of FBA were significantly affected by years and DI treatments, while sGDD by years and cultivars. Values of DEDFH, NFB, and FW were significantly influenced only by cultivars, while NVB only by DI treatments.
  • Prediction based GLMs analysis demonstrated that GLMs can be predictors for the measured parameters in the DI treatments for the two cultivars and for the three years. The best goodness-of-fit of the predicted GLMs was reached for the measures of HR, NOFB, FS, SVG, FNT, TSC, and TPC.
  • In all the four DI treatments, 22 pair-variables correlated significantly in Pearson correlation analyses, which were further confirmed by linear regression analysis.
  • PCA explained 82% of the total variance and PC1, PC2, and PC3 explained 23, 21, and 15% of the total variance and correlated with the HR, TNB, FS, FNT, and FY; FBA, SVG, TSC, and TPC; and NFB, NVB, and NOFB, respectively, indicating strong relationships among tree physiological and chemical properties.
  • Treatment effect, prediction model based analyses and inter-correlation analyses together showed that the RDIm treatment and cv. ‘Ninfa’ provided the most acceptable values for most measured properties compared to the fully irrigated control treatment.
Overall results showed that DI techniques using moderate water deficits (RDIm) can be managed successfully under semiarid Mediterranean climate conditions if suitable DI timings and appropriate cultivars are selected for apricot growing.

Author Contributions

Conceptualization, A.E., A.-M.S., and I.J.H.; methodology, A.E. and I.J.H.; software, S.S. and I.J.H.; validation, A.E., I.J.H. and A.-M.S.; formal analysis, I.J.H., S.S., and A.E.; investigation, A.E. and A.-M.S.; resources, I.J.H.; data curation, A.E.; writing—original draft preparation, A.E., I.J.H., A.-M.S., and A.A.Y.; writing—review and editing, A.E.; I.J.H., and B.M.; visualization, I.J.H.; supervision, I.J.H.; project administration, A.E. and I.J.H.; funding acquisition, I.J.H. All authors have read and agreed to the published version of the manuscript.

Funding

This research was funded by the Hungarian Scientific Research Funds (K 131478), by a János Bolyai Research Fellowship awarded to I. J. Holb, by the European Union and the State of Hungary, cofinanced by the European Social Fund in the framework of TÁMOP-4.2.4.A/2-11/1-2012-0001 ‘National Excellence Program’ under project number A2-SZJ-TOK-13-0061, by the Thematic Excellence Programme of the Ministry for Innovation and Technology in Hungary, within the framework of the Space Sciences thematic program of the University of Debrecen, and by the Thematic Excellence Programme (TKP2020-NKA-04) of the Ministry for Innovation and Technology in Hungary, within the framework of the climate change thematic program of the University of Debrecen. We also thank Tempus Public Foundation—Tempus Közalapítvány for supporting the working team.

Institutional Review Board Statement

Not applicable.

Informed Consent Statement

Not applicable.

Conflicts of Interest

The authors declare no conflict of interest.

References

  1. Roussos, P.A.; Sefferou, V.; Denaxa, N.K.; Tsantili, E.; Stathis, V. Apricot (Prunus armeniaca L.) fruit quality attributes and phyto-chemicals under different crop load. Sci. Hortic. 2011, 129, 472–478. [Google Scholar] [CrossRef]
  2. Torrecillas, A.; Corell, M.; Galindo, A.; Pérez-López, D.; Memmi, H.; Rodríguez, P. Agronomical effects of deficit irrigation in apricot, peach, and plum trees. In Water Scarcity and Sustainable Agriculture in Semiarid Environment: Tools, Strategies, and Challenges for Woody Crops; Elsevier Inc.: Amsterdam, The Netherlands, 2018; pp. 87–109. [Google Scholar] [CrossRef]
  3. Omar, M.E.D.M.; Moussa, A.M.A. Water management in Egypt for facing the future challenges. J. Adv. Res. 2016, 7, 403–412. [Google Scholar] [CrossRef] [PubMed] [Green Version]
  4. Geerts, S.; Raes, D. Deficit irrigation as an on-farm strategy to maximize crop water productivity in dry areas. Agric. Water Manag. 2009, 96, 1275–1284. [Google Scholar] [CrossRef] [Green Version]
  5. Thakur, A.; Singh, Z. Deficit irrigation in nectarine: Fruit quality, return bloom and incidence of double fruits. Eur. J. Hortic. Sci. 2013, 78, 67–75. [Google Scholar]
  6. Rahmati, M.; Davarynejad, G.H.; Génard, M.; Bannayan, M.; Azizi, M.; Vercambre, G. Peach water relations, gas exchange, growth and shoot mortality under water deficit in semi-arid weather conditions. PLoS ONE 2015, 10, e0120246. [Google Scholar] [CrossRef] [Green Version]
  7. Soliman, M.A.M.; Ennab, H.A.; Mikhael, G.B. Effect of periodic deficit irrigation at different fruit growth stages on yield and fruit quality of “Anna” apple trees. J. Plant Prod. 2018, 9, 13–19. [Google Scholar] [CrossRef] [Green Version]
  8. Vallverdu, X.; Girona, J. Sensory quality and consumer acceptance of ‘Tardibelle’ peach are improved by deficit irrigation applied during stage II of fruit development. HortScience 2012, 47, 656–659. [Google Scholar] [CrossRef] [Green Version]
  9. Sotiropoulos, T.; Kalfountzos, D.; Aleksiou, I.; Kotsopoulos, S. Response of a clingstone peach cultivar to regulated deficit irrigation. Sci. Agric. 2010, 67, 164–169. [Google Scholar] [CrossRef] [Green Version]
  10. Ye, S.; Han, J.; Liu, T. Determination of optimum irrigation strategies and effect of drip irrigation system on growth and water use efficiency of pear jujube in Loess Hilly region of northern Shaanxi. PLoS ONE 2019, 14, e0221925. [Google Scholar] [CrossRef]
  11. Intrigliolo, D.S.; Castel, J.R. Effects of regulated deficit irrigation on growth and yield of young Japanese plum trees. J. Hortic. Sci. Biotechnol. 2005, 80, 177–182. [Google Scholar] [CrossRef]
  12. Moñino, M.J.; Blanco-Cipollone, F.; Vivas, A.; Bodelón, O.G.; Prieto, M.H. Evaluation of different deficit irrigation strategies in the late-maturing Japanese plum cultivar ‘Angeleno’. Agric. Water Manag. 2020, 234, 106–111. [Google Scholar] [CrossRef]
  13. Torrecillas, A.; Galego, R.; Pérez-Pastor, A.; Ruiz-Sánchez, M.C. Gas exchange and water relations of young apricot plants under drought conditions. J. Agric. Sci. 1999, 132, 445–452. [Google Scholar] [CrossRef] [Green Version]
  14. Alburquerque, N.; Burgos, L.; Egea, J. Apricot flower bud development and abscission related to chilling, irrigation and type of shoots. Sci. Hortic. 2003, 98, 265–276. [Google Scholar] [CrossRef]
  15. Pérez-Pastor, A.; Domingo, R.; Torrecillas, A.; Ruiz-Sánchez, M.C. Response of apricot trees to deficit irrigation strategies. Irrig. Sci. 2009, 27, 231–242. [Google Scholar] [CrossRef]
  16. Laajimi, N.O.; Abbas, F.; Rezgui, S.; Zekri, M.; Hellali, R. Effect of deficit irrigation on apricot (Prunus armeniaca L.) cv.‘Amor El Euch’ trees grown in the Mediterranean region of Tunisia. Fruit Veg. Cereal Sci. Biotechnol. 2009, 3, 16–21. [Google Scholar]
  17. Bozkurt, S.; Ödemiş, B.; Durgaç, C. Effects of deficit irrigation treatments on yield and plant growth of young apricot trees. N. Zeal. J. Crop Hortic. Sci. 2015, 43, 73–84. [Google Scholar] [CrossRef]
  18. Pérez-Sarmiento, F.; Mirás-Avalos, J.M.; Alcobendas, R.; Alarcón, J.J.; Mounzer, O.; Nicolás, E. Effects of regulated deficit irrigation on physiology, yield and fruit quality in apricot trees under mediterranean conditions. Span. J. Agric. Res. 2016, 14, 28. [Google Scholar] [CrossRef] [Green Version]
  19. Bartolini, S.; Piccolo, E.L.; Remorini, D. Different summer and autumn water deficit affect the floral differentiation and flower bud growth in apricot (Prunus armeniaca L.). Agronomy 2020, 10, 914. [Google Scholar] [CrossRef]
  20. Wei, J.; Liu, G.; Liu, D.; Chen, Y. Influence of irrigation during the growth stage on yield and quality in mango (Mangifera indica L). PLoS ONE 2017, 12, e0174498. [Google Scholar] [CrossRef]
  21. Ballester, C.; Castel, J.; Intrigliolo, D.S.; Castel, J.R. Response of Navel Lane Late citrus trees to regulated deficit irrigation: Yield components and fruit composition. Irrig. Sci. 2013, 31, 333–341. [Google Scholar] [CrossRef]
  22. Nagaz, K.; El Mokh, F.; Ben Hassen, N.; Masmoudi, M.M.; Ben Mechlia, N.; Baba, S.M.O. Impact of deficit irrigation on yield and fruit quality of orange trees (Citrus sinensis, L. Osbeck, cv. Meski Maltaise) in Southern Tunisia. Irrig. Drain. 2020, 69 (Suppl. S1), 186–193. [Google Scholar] [CrossRef] [Green Version]
  23. Ruiz-Sánchez, M.C.; Torrecillas, A.; Pérez-Pastor, A.; Domingo, R. Regulated deficit irrigation in apricot trees. Acta Hortic. 2000, 537, 759–766. [Google Scholar] [CrossRef]
  24. Kaya, S.; Evren, S.; Dasci, E.; Adiguzel, M.C.; Yilmaz, H. Effects of different irrigation regimes on vegetative growth, fruit yield and quality of drip-irrigated apricot trees. Afr. J. Biotechnol. 2010, 9, 5902–5907. [Google Scholar]
  25. Abrisqueta, J.M.; Ruiz, A.; Franco, J.A. Water balance of apricot trees (Prunus armeniaca L) under drip irrigation. Agric. Water Manag. 2001, 50, 211–227. [Google Scholar] [CrossRef]
  26. Razavi, F.; Hajilou, J.; Tabatabaei, S.J.; Dadpour, M.R. Comparison of chilling and heat requirement in some peach and apricot cultivars. Res. Plant Biol. 2011, 1, 40–47. [Google Scholar]
  27. Weinberger, J. Chilling requirements of peach varieties. Proc. Am. Soc. Hortic. Sci. 1950, 56, 122–128. [Google Scholar]
  28. Ruiz, D.; Campoy, J.A.; Egea, J. Chilling and heat requirements of apricot cultivars for flowering. Environ. Exp. Bot. 2007, 61, 254–263. [Google Scholar] [CrossRef]
  29. Mohamed, S.A.; Eid, T.A.; Water, S. Irrigation regimes for apricot trees under different rates of soil moisture depletion. Egypt J. Hortic. 2013, 40, 205–225. [Google Scholar] [CrossRef]
  30. Ranganna, S. Handbook of Analysis and Quality Control for Fruit and Vegetable Products, 2nd ed.; McGraw-Hill Inc.: Noida, India, 2007; p. 1152. [Google Scholar]
  31. Bates, L.S.; Waldren, R.P.; Teare, I.D. Rapid determination of free proline for water-stress studies. Plant Soil 1973, 39, 205–207. [Google Scholar] [CrossRef]
  32. Field, A.; Miles, J.; Field, Z. Discovering Statistics Using R; Sage Publications Ltd.: Thousand Oaks, CA, USA, 2012; p. 992. [Google Scholar]
  33. Brownlee, J. Machine Learning Mastery with R; e-Book. 2016, p. 224. Available online: https://machinelearningmastery.com/machine-learning-with-r/ (accessed on 3 October 2016).
  34. Hastie, T.; Tibshirani, R.; Friedman, J. The Elements of Statistical Learning: Data Mining, Inference, and Prediction, 2nd ed.; Springer Science & Business Media: Berlin/Heidelberg, Germany, 2009; p. 763. [Google Scholar]
  35. Nash, J.E.; Sutcliffe, J.V. River flow forecasting through conceptual models part I—A discussion of principles. J. Hydrol. 1970, 10, 282–290. [Google Scholar] [CrossRef]
  36. R Core Team. R: A Language and Environment for Statistical Computing; R Foundation for Statistical Computing: Vienna, Austria, 2020; Available online: https://www.R-project.org/ (accessed on 10 May 2020).
  37. Kuhn, M. Caret: Classification and regression training. R package version 6.0-86. 2020. Available online: https://CRAN.R-project.org/package=caret (accessed on 3 March 2020).
  38. Wickham, H. Ggplot2: Elegant Graphics for Data Analysis; Springer: New York, NY, USA, 2016; Available online: https://ggplot2.tidyverse.org (accessed on 7 June 2016).
  39. Basto, M.; Pereira, J.M. An SPSS R-menu for ordinal factor analysis. J. Stat. Softw. 2012, 46, 1–29. [Google Scholar] [CrossRef] [Green Version]
  40. Revelle, W. Psych: Procedures for Personality and Psychological Research; Northwestern University: Evanston, IL, USA, 2015; Available online: http://CRAN.R-project.org/package=psych (accessed on 12 June 2015).
  41. Lê, S.; Josse, J.; Husson, F. FactoMineR: An R package for multivariate analysis. J. Stat. Softw. 2008, 25, 30294. Available online: https://www.jstatsoft.org/article/view/v025i01 (accessed on 25 October 2008). [CrossRef] [Green Version]
  42. Kassambara, A.; Mundt, A. Factoextra: Extract and Visualize the Results of Multivariate Data Analyses. R package version 1.0.6. 2019. Available online: https://CRAN.R-project.org/package=factoextra (accessed on 1 June 2019).
  43. Nasrabadi, M.; Ramezanian, A.; Eshghi, S.; Sarkhosh, A. Chilling and heat requirement of pomegranate (Punica granatum L.) trees grown under sustained deficit irrigation. Sci. Hortic. 2020, 263, 109–117. [Google Scholar] [CrossRef]
  44. Luedeling, E.; Zhang, M.; Girvetz, E.H. Climatic changes lead to declining winter chill for fruit and nut trees in California during 1950–2099. PLoS ONE 2009, 16, e61664. [Google Scholar] [CrossRef] [PubMed]
  45. Salama, A.M.; Ezzat, A.; El-Ramady, H.; Alam-Eldein, S.M.; Okba, S.; Elmenofy, H.M.; Hassan, I.F.; Illés, A.; Holb, I.J. Temperate fruit trees under climate change: Challenges for dormancy and chilling requirements in warm winter regions. Horticulturae 2021, 7, 86. [Google Scholar] [CrossRef]
  46. Valentini, N.; Me, G.; Spanna, F.; Lovisetto, M. Chilling and heat requirement in apricot and peach varieties. Acta Hortic. 2004, 636, 199–203. [Google Scholar] [CrossRef]
  47. Viti, R.; Andreini, L.; Ruiz, D.; Egea, J.; Bartolini, S.; Iacona, C.; Campoy, J.A. Effect of climatic conditions on the overcoming of dormancy in apricot flower buds in two Mediterranean areas: Murcia (Spain) and Tuscany (Italy). Sci. Hortic. 2010, 124, 217–224. [Google Scholar] [CrossRef]
  48. Demirtas, C.; Erturk, U.; Yazgan, S.; Candogan, B.N.; Soylu, A. Effects of different irrigation levels on the vegetative growth, flower bud formation and fruit quality of sweet cherry in western part of Turkey. J. Food Agric. Environ. 2008, 6, 168–172. [Google Scholar]
  49. Blanco, V.; Blaya-Ros, P.J.; Torres-Sánchez, R.; Domingo, R. Influence of regulated deficit irrigation and. Plants 2020, 9, 94. [Google Scholar] [CrossRef] [Green Version]
  50. Mitchell, P.D.; Chalmers, D.J.; Jerie, P.H.; Burge, G. The use of initial withholding of irrigation and tree spacing to enhance the effect of regulated deficit irrigation on pear trees. J. Am. Soc. Hortic. Sci. 1986, 111, 858–861. [Google Scholar]
  51. Torrecillas, A.; Ruiz-Sanchez, M.C.; Domingo, R.; Hernández-Borroto, J. Regulated deficit irrigation on Fino lemon trees. Acta Hortic. 1993, 335, 205–212. [Google Scholar] [CrossRef]
  52. Nuñez-Elisea, R.; Davenport, T. Flowering of mango trees in containers as influenced by seasonal temperature and water stress. Sci. Hortic. 1994, 58, 57–66. [Google Scholar] [CrossRef]
  53. Ginestar, C.; Castel, J.R. Response of young ‘Clementine’ in citrus trees to water stress during different phenological periods. J. Hortic. Sci. 1996, 71, 551–559. [Google Scholar] [CrossRef]
  54. González-Altozano, P.; Castel, J.R. Regulated deficit irrigation in ‘Clementina de Nules’ citrus trees. I. Yield and fruit quality effects. J. Hortic. Sci. Biotechnol. 1999, 74, 706–713. [Google Scholar] [CrossRef]
  55. Ruiz-Sánchez, M.C.; Egea, J.; Galego, R.; Torrecillas, A. Floral biology of ‘Búlida’ apricot trees subjected to postharvest drought stress. Ann. Appl. Biol. 1999, 135, 523–528. [Google Scholar] [CrossRef]
  56. Arzani, K.; Wood, D.; Lawes, G.S. Influence of first season application of paclobutrazol, root-pruning and regulated deficit irrigation on second season flowering and fruiting of mature ‘Sundrop’ apricot trees. Acta Hortic. 2000, 516, 75–82. [Google Scholar] [CrossRef]
  57. Marsal, J.; Mata, M.; Arbonés, A.; Rufat, J.; Girona, J. Regulated deficit irrigation and rectification scheduling in young pear trees: An evaluation based on vegetative and productive response. Eur. J. Agron. 2002, 17, 111–122. [Google Scholar] [CrossRef]
  58. Cuevas, J.; Romero, I.M.; Fernández, M.D.; Hueso, J.J. Deficit irrigation schedules to promote early flowering in ’Algerie’ loquat. Acta Hortic. 2007, 750, 281–286. [Google Scholar] [CrossRef] [Green Version]
  59. Perez-Perez, J.G.; Romero, P.; Navarro, J.M.; Botıa, P. Response of sweet orange cv ‘Lane late’ to deficit irrigation in two rootstocks. I: Water relations, leaf gas exchange and vegetative growth. Irrig. Sci. 2008, 26, 415–425. [Google Scholar] [CrossRef]
  60. Perez-Perez, J.G.; Romero, P.; Navarro, J.M.; Botıa, P. Response of sweet orange cv ‘Lane late’ to deficit-irrigation strategy in two rootstocks. II: Flowering, fruit growth, yield and fruit quality. Irrig. Sci. 2008, 26, 519–529. [Google Scholar] [CrossRef]
  61. Girona, J.; Mata, M.; Arbones, A.; Alegre, S.; Rufat, J.; Marsal, J. Peach tree response to single and combined regulated deficit irrigation regimes under shallow soils. J. Am. Soc. Hortic. Sci. 2003, 128, 432–440. [Google Scholar] [CrossRef] [Green Version]
  62. Selahvarzi, Y.; Zamani, Z.; Fatahi, R.; Talaei, A.R. Effect of deficit irrigation on flowering and fruit properties of pomegranate (Punica granatum cv. Shahvar). Agric. Water Manag. 2017, 192, 189–197. [Google Scholar] [CrossRef]
  63. Egea, J.; Burgos, L. Fructification problems in continental apricot cultivars growing under Mediterranean climate. Ovule development at anthesis in two climatic areas. J. Hortic. Sci. Biotechnol. 1998, 73, 107–110. [Google Scholar] [CrossRef]
  64. Torrecillas, A.; Domingo, R.; Galego, R.; Ruiz-Sánchez, M.C. Apricot tree response to withholding irrigation at different phenological periods. Sci. Hortic. 2000, 85, 201–215. [Google Scholar] [CrossRef]
  65. Marsal, J.; López, G.; Girona, J. Recent advances in regulated deficit irrigation (RDI) in woody perennials and future perspectives. Acta Hortic. 2008, 792, 429–439. [Google Scholar] [CrossRef]
  66. Pérez-Pastor, A.; Ruiz-Sánchez, M.C.; Domingo, R. Effects of timing and intensity of deficit irrigation on vegetative and fruit growth of apricot trees. Agric. Water Manag. 2014, 134, 110–118. [Google Scholar] [CrossRef]
  67. Domingo, R.; Ruiz-Sánchez, M.C.; Sánchez-Blanco, M.J.; Torecillas, A. Water relations, growth and yield of Fino lemon trees under regulated deficit irrigation. Irrig. Sci. 1996, 16, 115–123. [Google Scholar] [CrossRef]
  68. González-Altozano, P.; Castel, J.R. Regulated deficit irrigation in ‘Clementina de Nules’ citrus trees. II: Vegetative growth. J. Hortic. Sci. Biotechnol. 2000, 75, 388–392. [Google Scholar] [CrossRef]
  69. Mitchell, P.D.; Chalmers, D.J. The effects of reduced water supply on peach tree growth and yields. J. Am. Soc. Hortic. Sci. 1982, 107, 853–856. [Google Scholar]
  70. Mitchell, P.D.; Jerie, P.H.; Chalmers, D.J. Effects of regulated water deficits on pear tree growth, flowering, fruit growth and yield. J. Am. Soc. Hortic. Sci. 1984, 109, 604–606. [Google Scholar]
  71. Hipps, N.A.; Pages, L.; Huguet, J.G.; Serra, V. Influence of controlled water supply on shoot and root development of young peach trees. Tree Physiol. 1995, 15, 95–103. [Google Scholar] [CrossRef] [PubMed]
  72. Girona, J.; Gelly, M.; Mata, M.; Arbones, A.; Rufat, J.; Marsal, J. Peach tree response to single and combined deficit irrigation regimes in deep soils. Agric. Water Manag. 2005, 72, 97–108. [Google Scholar] [CrossRef]
  73. Fernandez, E.; Luedeling, E.; Behrend, D.; Van De Vliet, S.; Kunz, A.; Fadón, E. Mild water stress makes apple buds more likely to flower and more responsive to artificial forcing impacts of an unusually warm and dry summer in Germany. Agronomy 2020, 10, 274. [Google Scholar] [CrossRef] [Green Version]
  74. Candogan, B.N.; Yazgan, S. The effects of different irrigation levels on vegetative growth of young dwarf cherry trees in a sub-humid climate. Pak. J. Bot. 2010, 42, 3399–3408. [Google Scholar]
  75. Nieto, E.; Prieto, M.H.; Fortes, R.; Gonzalez, V.; Campillo, C. Response of a long-lived cherry cultivar to contrasting irrigation strategies in the Jerte Valley, Extremadura, Spain. Acta Hortic. 2017, 1161, 197–204. [Google Scholar] [CrossRef]
  76. Blanco, V.; Torres-Sánchez, R.; Blaya-Ros, P.J.; Pérez-Pastor, A.; Domingo, R. Vegetative and reproductive response of ‘Prime Giant’ sweet cherry trees to regulated deficit irrigation. Sci. Hortic. 2019, 249, 478–489. [Google Scholar] [CrossRef]
  77. Aganchich, B.; Tahi, H.; Wahbi, S.; Elmodaffar, C.; Serraj, R. Growth, water relations and antioxidant defense mechanisms of olive (Olea europaea L.) subjected to Partial Root Drying (PRD) and Regulated Deficit Irrigation (RDI). Plant Biosyst. 2007, 141, 252–264. [Google Scholar] [CrossRef]
  78. Johnson, R.S.; Handley, D.F. Using water stress to control vegetative growth and productivity of temperate fruit trees. HortScience 2000, 35, 1048–1050. [Google Scholar] [CrossRef] [Green Version]
  79. Ruiz-Sánchez, M.C.; Domingo, R.; Castel, J.R. Deficit irrigation in fruit trees and vines in Spain. Spanish J. Agric. Res. 2010, 8, S5–S20. [Google Scholar] [CrossRef] [Green Version]
  80. Cohen, A.; Goell, A. Fruit growth and dry matter accumulation in grapefruit during periods of water withholding and after reirrigation. Funct. Plant Biol. 1988, 15, 633–639. [Google Scholar] [CrossRef]
  81. González-Altozano, P.; Castel, J.R. Effects of regulated deficit irrigation on ‘Clementina de Nules’ citrus trees growth, yield and fruit quality. Acta Hortic. 2000, 537, 749–758. [Google Scholar] [CrossRef]
  82. Caspari, H.W.; Behboudian, M.H.; Chalmers, D.J. Water use, growth, and fruit yield of Hosui’ Asian pears under deficit irrigation. J. Am. Soc. Hortic. Sci. 1994, 119, 383–388. [Google Scholar] [CrossRef]
  83. Ebel, R.C.; Proebsting, E.L.; Evans, R.G. Deficit irrigation to control vegetative growth in apple and monitoring fruit growth to schedule irrigation. HortScience 1995, 30, 1229–1232. [Google Scholar] [CrossRef] [Green Version]
  84. González-Altozano, P.; Castel, J.R. Regulated deficit irrigation in “Clementina de Nules” citrus tree, 1: Yield and fruit quality effects during four years. Span. J. Agric. Res. 2003, 1, 81–92. [Google Scholar] [CrossRef] [Green Version]
  85. Girona, J.; Marsal, J.; Mata, M.; Arbones, A.; De Jong, T. A comparison of the combined effect of water stress and crop load on fruit growth during different phenological stages in young peach trees. J. Hortic. Sci. Biotechnol. 2004, 79, 308–315. [Google Scholar] [CrossRef]
  86. Goldhamer, D.A.; Shackel, K. Irrigation cuto and drought irrigation strategy effects on almond. In Proceedings of the 18th Almond Research Conference, Fresno, CA, USA, 11–13 December 1990; pp. 30–35. [Google Scholar]
  87. Pérez-Sarmiento, F.; Alcobendas, R.; Mounzer, O.; Alarcón, J.; Nicolás, E. Effects of regulated deficit irrigation on physiology and fruit quality in apricot trees. Span. J. Agric. Res. 2010, 8 (Suppl. S2), S86–S94. [Google Scholar] [CrossRef] [Green Version]
  88. Wong, B.L.; Baggett, K.L.; Rye, A.H. Cold-season patterns of reserve and soluble carbohydrates in sugar maple and ice-damaged trees of two age classes following drought. Botany 2009, 87, 293–305. [Google Scholar] [CrossRef]
  89. Romero, P.; Botia, P.; Garcia, F. Effects of regulated deficit irrigation under subsurface drip irrigation conditions on vegetative development and yield of mature almond trees. Plant Soil 2004, 260, 169–181. [Google Scholar] [CrossRef]
  90. Anjum, S.; Wang, L.; Farooq, M.; Khan, I.; Xue, L. Methyl jasmonate-induced alteration in lipid peroxidation, antioxidative defence system and yield in soybean under drought. J. Agron. Crop Sci. 2011, 197, 296–301. [Google Scholar] [CrossRef]
  91. Trifilò, P.; Casolo, V.; Raimondo, F.; Petrussa, E.; Boscutti, F.; Lo Gullo, M.A. Effects of prolonged drought on stem non-structural carbohydrates content and post-drought hydraulic recovery in Laurus nobilis L.: The possible link between car-bon starvation and hydraulic failure. Plant Physiol. Biochem. 2017, 120, 232–241. [Google Scholar] [CrossRef]
  92. Maguire, A.J.; Kobe, R.K. Drought and shade deplete nonstructural carbohydrate reserves in seedlings of five temperate tree species. Ecol. Evol. 2015, 5, 5711–5721. [Google Scholar] [CrossRef]
  93. Wong, B.; Baggett, K.; Rye, A. Seasonal patterns of reserve and soluble carbohydrates in mature sugar maple (Acer saccharum). Can. J. Bot. 2003, 81, 780–788. [Google Scholar] [CrossRef] [Green Version]
  94. Faghih, S.; Zamani, Z.; Fatahi, R.; Omidi, M. Influence of kaolin application on most important fruit and leaf characteristics of two apple cultivars under sustained deficit irrigation. Biol. Res. 2011, 54, 1–15. [Google Scholar] [CrossRef]
  95. Hong, Z.; Lakkineni., K.; Zhang, Z.; Verma, D.P.S. Removal of feedback inhibition ofD1-pyrroline-5-carboxylate synthetase results in increased proline accumulation and protection of plants fromosmotic stress. Plant Physiol. 2000, 122, 1129–1136. [Google Scholar] [CrossRef] [Green Version]
  96. Deuschle, K.; Funck, D.; Hellmann, H.; Daschner, K.; Binder, S.; Frommer, W.B. A nuclear gene encoding mitochondrial D1-pyrroline-5-carboxylate dehydrogenase and its potential role in protection from proline toxicity. Plant J. 2001, 27, 345–356. [Google Scholar] [CrossRef]
  97. Ahmed, C.B.; Rouina, B.B.; Sensoy, S.; Boukhris, M.; Abdallah, F.B. Changes in gas exchange, proline accumulation and antioxidative enzyme activities in three olive cultivars under contrasting water availability regimes. Environ. Exp. Bot. 2009, 67, 345–352. [Google Scholar] [CrossRef]
  98. Zandalinas, S.I.; Rivero, R.M.; Martínez, V.; Gómez-Cadenas, A.; Arbona, V. Tolerance of citrus plants to the combination of high temperatures and drought is associated to the increase in transpiration modulated by a reduction in abscisic acid levels. BMC Plant Biol. 2016, 16, 105. [Google Scholar] [CrossRef] [Green Version]
  99. Hussain, S.; Khalid, M.F.; Saqib, M.; Ahmad, S.; Zafar, W.; Rao, M.J.; Morillon, R.; Anjum, M.A. Drought tolerance in citrus rootstocks is associated with better antioxidant defense mechanism. Acta Physiol. Plant. 2018, 40, 135. [Google Scholar] [CrossRef]
  100. Sun, X.; Yan, H.; Kang, X.; Ma, F. Growth, gas exchange, and water-use efficiency response of two young apple cultivars to drought stress in two scion-one rootstock grafting system. Photosynthetica 2013, 51, 404–410. [Google Scholar] [CrossRef]
  101. Šircelj, H.; Tausz, M.; Grill, D.; Batič, F. Detecting different levels of drought stress in apple trees (Malus domestica Borkh.) with selected biochemical and physiological parameters. Sci. Hortic. 2007, 113, 362–369. [Google Scholar] [CrossRef]
  102. Wang, S.; Liang, D.; Li, C.; Hao, Y.; Ma, F.; Shu, H. Influence of drought stress on the cellular ultrastructure and antioxidant system in leaves of drought tolerant and drought-sensitive apple rootstocks. Plant Physiol. Biochem. 2012, 51, 81–89. [Google Scholar] [CrossRef] [PubMed]
Figure 1. Geographical location of the study site for deficit irrigation treatments of apricot at Wadi El Natrun, El Beheira Governorate, Egypt.
Agronomy 11 01361 g001
Figure 2. Experimental design for the four deficit irrigation treatments (Control, RDIm, RDIs, and CDI) of apricot trees according to the months of the year, tree phenological phases (dormancy, flowering, fruit set, fruit growth, fruit harvest, postharvest), fruit growth stages (I., II., III.), critical periods and the percent of crop evapotranspiration (ETc) of irrigation treatments at Wadi El Natrun, El Beheira Governorate, Egypt (2016–2018). Control = fully irrigated scheme, RDIm = moderate regular deficit irrigation, RDIs = severe regular deficit irrigation and CDI = continuous deficit irrigation.
Agronomy 11 01361 g002
Figure 3. The effect of four irrigation treatments (control, moderate regular deficit irrigation—RDIm, severe regular deficit irrigation—RDIs and continuous deficit irrigation—CDI) and two cultivars (‘Ninfa’ and ‘Canino’) on chilling requirements—CR (A) and heat requirement—HR (B). Data are means of 2016, 2017 and 2018. Standard deviation values are presented by bars on the columns. Control means that trees were irrigated at 100% of seasonal ETc for all phenological growth stages of the trees. Differences among control, RDIm, RDIs and CDI treatments were represented by LSD0.05 values at P = 0.05, separately for the two cultivars (‘Ninfa’ and ‘Canino’). After each LSD0.05 value, first, second, third, and fourth letters belongs to the control, RDIm, RDIs and CDI treatments, respectively. Values within the given cultivar coupled with different letters are significantly different among the control, RDIm, RDIs and CDI treatments at P = 0.05 according to LSD t-tests.
Agronomy 11 01361 g003
Figure 4. The effect of three years (2016, 2017, 2018) and two cultivars (‘Ninfa’ and ‘Canino’) on sum of growing degree days (sGDD). Data are means of the four irrigation treatments. Standard deviation values are presented by bars on the columns. Differences among years were represented by LSD0.05 values at P = 0.05, separately for the two cultivars. After each LSD0.05 value, first, second, and third letters belongs to the years of 2016, 2017, and 2018, respectively. Values within the given cultivar coupled with different letters are significantly different among the years at P = 0.05 according to LSD t-tests.
Agronomy 11 01361 g004
Figure 5. The effect of four irrigation treatments (control, moderate regular deficit irrigation—RDIm, severe regular deficit irrigation—RDIs and continuous deficit irrigation—CDI) on four bud related measures. (A) total number of buds—TNB versus (vs.) four irrigation treatments and two cultivars, (B) number of vegetative buds—NVB vs. four irrigation treatments, (C) number of opened flower buds—NOFB vs. four irrigation treatments and two cultivars and (D) flower bud abscission—FBA% vs. four irrigation treatments and three years. The two cultivars are ‘Ninfa’ and ‘Canino’. Explanation for standard deviation values, irrigation treatments, calculations of significant differences, and explanations for LSD0.05 values are given in Figure 3.
Agronomy 11 01361 g005
Figure 6. The effect of four irrigation treatments (control, moderate regular deficit irrigation—RDIm, severe regular deficit irrigation—RDIs and continuous deficit irrigation—CDI) and two cultivars (‘Ninfa’ and ‘Canino’) on four yield related measures. (A) fruit set—FS, (B) seasonal vegetative growth–SVG, (C) fruit number per tree—FN, and (D) fruit yield—FY. Data are means of 2016, 2017 and 2018. Explanation for standard deviation values, irrigation treatments, calculations of significant differences, and explanations for LSD0.05 values are given in Figure 3.
Agronomy 11 01361 g006
Figure 7. The effect of three years (2016, 2017, 2018) and two cultivars (‘Ninfa’ and ‘Canino’) on mean leaf proline content (TPC, μg g−1). Data are means of 2016, 2017 and 2018. Explanation for standard deviation values, irrigation treatments, calculations of significant differences, and explanations for LSD0.05 values are given in Figure 3.
Agronomy 11 01361 g007
Figure 8. Distribution of the differences between the observed (boxplot) and modelled (violin plot) values by the three years (2016, 2017, and 2018; grey), four deficit irrigation treatments (Control, RDIm, RDIs, and CDI; yellow) and cultivars two cultivars (‘Ninfa’ and ‘Canino’; blue) for fifteen tree physiological (CR, HR, DEDFH, sGDD, TNB, NFB, NVB, SDF, NOFB, FBA, FS, SVG, FNT, FY, and FW) and two chemical measures (TSC, and TPC). The modelled values were prepared by GLMs (Generalized Linear Models). Explanations for Control, RDIm, RDIs, and CDI are given in Figure 2.
Agronomy 11 01361 g008aAgronomy 11 01361 g008bAgronomy 11 01361 g008c
Figure 9. Relationships between 22 significant variable-pairs (TNB versus (vs.) NFB (A), TNB vs. NOFB (B), NFB vs. NOFB (C), NFB vs. FNT (D), NFB vs. FY (E), NFB vs. FW (F), NOFB vs. SVG (G), NOFB vs. FNT (H), NOFB vs. FY (I), FS vs. FNT (J), FS vs. FY (K), SVG vs. FNT (L), SVG vs. FY (M), SVG vs. TSC (N), FNT vs. FY (O), FY vs. FW (P), CR vs. TSC (Q), HR vs. TNB (R), HR vs. NFB (S), HR vs. FNT (T), HR vs. FY (U), and NOFB vs. FBA (V)) for four deficit irrigation treatments (Control, RDIm, RDIs, and CDI). Explanations for Control, RDIm, RDIs, and CDI are given in Figure 2.
Agronomy 11 01361 g009aAgronomy 11 01361 g009bAgronomy 11 01361 g009c
Figure 10. Two biplots of PCA (principal component analyses) conducted separately for the four deficit irrigation treatments (A) and for the two cultivars (B) in a commercial apricot orchard at Wadi El Natrun, Northern Egypt over 2016–2018. CR: chilling requirements, HR: heat requirements, DEDFH: days from end-dormancy until fruit harvest, sGDD: sum of growing degree days, TNB: total number of buds, NFB: number flower buds, NVB: number of vegetative buds, SDF: starting date of flowering, NOFB: number of opened flower buds, FBA: flower bud abscission (%), FS: fruit set, SVG: seasonal vegetative growth, FNT: fruit number per tree, FW: fruit weight, FY: fruit yield, TSC: total soluble carbohydrates and TPC: total proline content in leaf. Explanations for Control, RDIm, RDIs and CDI are given in Figure 2.
Agronomy 11 01361 g010
Table 1. The soil physical and chemical characteristics of the study site for deficit irrigation treatments of apricot at Wadi El Natrun, El Beheira Governorate, Egypt.
Soil Chemical and Physical PropertiesSoil Depth (cm)
0–3030–60
pH7.67.5
Organic carbon %0.580.27
Organic matter %1.210.44
Total nitrogen ‰0.260.22
K+ Meq L−11.451.32
Na+ Meq L−128.5011.23
Ca++ Meq L−117.5616.58
Texturesandy loamsandy loam
Clay (<0.002 mm) %75
Silt (0.002–0.05 mm) %66
Sand (>0.05) %8789
Table 2. The monthly irrigated water (L tree−1) and overall annual irrigated water (L tree−1, m3 ha−1) for the four deficit irrigation treatments (control, RDIm, RDIs, and CDI) of apricot trees at Wadi El Natrun, El Beheira Governorate, Egypt (2016–2018). Explanation for Control, RDIm, RDIs, and CDI are given in Figure 2.
ControlRDImRDIsCDI
January1507537.575
February950475237.5475
March1900950475950
April190014251187950
May190019001900950
June190019001900950
July190019001900950
August1900950475950
September1900950475950
October690345172.5345
November640320160320
December23011557.5115
Overall (L tree−1)15,96011,30589777980
Overall (m3 ha−1)9975.007065.635610.634987.50
Table 3. The monthly irrigated water (L tree−1) and overall annual irrigated water (L tree−1, m3 ha−1) for the four deficit irrigation treatments (control, RDIm, RDIs, and CDI) of apricot trees at Wadi El Natrun, El Beheira Governorate, Egypt (2016–2018). Bold figures indicate significant differences at P < 0.05. Explanations for Control, RDIm, RDIs and CDI are given in Figure 2.
Source of VariancedfCRHRDEDFHsGDD
MSP > FMSP > FMSP > FMSP > F
Year (Y)21181.10.07653552.70.14622129.70.053731,1200.0484
Irrigation (I)380,4910.04328390.20.0499219.60.065411,5120.1651
Cultivar (C)1882.60.03224415.50.0293997.60.041151,3060.0359
Y × I35234.50.25674586.80.1792218.80.18765494.90.0981
Y × C22351.30.10153625.30.098780.530.11764580.30.1812
I × C34325.10.17684136.10.261890.60.12655762.10.2801
Y × I × C622,5670.31547271.40.4259387.40.26543365.70.4108
Error17412,317 2654.3 1076.2 3824.1
Total191
df: degree of freedom. MS: mean squares. P > F: the probability values associated with the F-tests.
Table 4. Analyses of variance for the effects of year, deficit irrigation treatment and cultivar on bud measures of tree physiological properties (total number of buds—TNB, number of flower buds—NFB, number of vegetative buds—NVB, starting date of flowering—SDF, number of opened flower buds—NOFB and flower bud abscission (%)—FBA) in a commercial apricot orchard at Wadi El Natrun, Northern Egypt over 2016–2018 on two apricot cultivars ‘Ninfa’ and ‘Canino’. Explanations for bold figures are given in Table 3.
Source of VariancedfTNBNFBNVBSDFNOFBFBA
MSP > FMSP > FMSP > FMSP > FMSP > FMSP > F
Year (Y)261.10.7579255.10.399143.10.4321205.10.0319176.70.0412176.10.0451
Irrigation (I)32346.50.0019326.40.1060819.20.0496221.40.0398829.2<0.0012975.80.0087
Cultivar (C)14680.8<0.0014429.1<0.00169.30.3105847.30.00612437.8<0.00129.490.2831
Y × I31848.70.2583106.20.0761410.60.1704135.40.098786.20.0539286.10.0965
Y × C21297.30.1262419.40.119313.90.658231.20.1653103.50.091780.40.4618
I × C3448.30.0712237.10.5886575.90.1031148.70.0509106.20.0791255.90.3439
Y × I × C62467.80.3509411.20.0510358.30.0871245.70.201282.50.0696189.20.1349
Error17444.67 142.5 36.8 61.4 29.4 36.4
Total191
df: degree of freedom. MS: Mean squares. P > F: The probability values associated with the F-tests.
Table 5. The effects of three years (2016, 2017, 2018), deficit irrigation treatments (control, moderate regular deficit irrigation—RDIm, severe regular deficit irrigation—RDIs and continuous deficit irrigation—CDI) and two cultivars (‘Ninfa’ and ‘Canino’) on starting date of flowering (SDF) in a commercial apricot orchard at Wadi El Natrun, Northern Egypt. Explanation for irrigation treatments, calculations of significant differences, and explanations for LSD0.05 values are given in Figure 3; ns: nonsignificant. Different letters represent significant differences among DI treatments.
Cultivar/Irrigation Treatment Year
2016 2017 2018 Overall
‘Ninfa’
Control75.6b76.0b68.0a73.2ab
RDIm71.3a69.3a71.0ab70.5a
RDIs76.0bc70.7a73.0b73.2ab
CDI77.7bc78.0b72.6b76.1b
LSD0.054.2 4.5 3.9 4.2
‘Canino’
Control76.0ab66.6a68.0ns70.2ns
RDIm74.3a66.0a68.6ns69.7ns
RDIs79.0b67.0ab69.7ns71.9ns
CDI77.3ab70.7b69.3ns72.4ns
LSD0.054.1 3.7 - 3.9
Overall cultivar
‘Ninfa’75.2ns73.5b71.2ns73.3ns
‘Canino’76.7ns67.9a68.9ns71.1ns
LSD0.05- 4.3 - -
Overall irrigation
Control75.8ab71.3ab68.0ns71.7ab
RDIm72.8a67.7a69.8ns70.1a
RDIs77.5b68.8a71.3ns72.6ab
CDI77.6b74.3b71.0ns74.3b
LSD0.054.1 4.2 - 4.1
Table 6. Analyses of variance for the effects of year, deficit irrigation treatment and cultivar on yield related measures of tree physiological properties (fruit set—FS, seasonal vegetative growth—SVG, fruit number per tree—FNT, fruit weight—FW, fruit yield—FY) in a commercial apricot orchard in Egypt (2016–2018, cvs ‘Ninfa’ and ‘Canino’). Explanations for bold figures are given in Table 3.
Source of VariancedfFSSVGFNTFYFW
MSP > FMSP > FMSP > FMSP > FMSP > F
Year (Y)2405.50.241271.50.1822598.60.241229.10.348211.60.6691
Irrigation (I)34209.30.03419706.40.02146288.90.0328374.50.043257.20.2987
Cultivar (C)14753.90.01971859.10.03512991.90.0287804.50.0069155.10.0497
Y × I3229.10.1836234.30.1838687.90.2871169.30.257678.20.5251
Y × C252.60.318228.10.2387973.20.2371115.60.175483.40.3281
I × C3348.90.12141141.40.09861325.10.167256.90.0629100.80.1827
Y × I × C6128.10.3839234.20.2891216.10.3952181.50.298023.10.6421
Error17481.4 87.7 65.7 42.6 5.2
Total191
df: degree of freedom. MS: Mean squares. P > F: The probability values associated with the F-tests.
Table 7. Analyses of variance for the effects of year, deficit irrigation treatment, and cultivar on yield related measures of tree physiological properties (fruit set—FS, seasonal vegetative growth—SVG, fruit number per tree—FNT, fruit weight—FW, fruit yield—FY) in a commercial apricot orchard at Wadi El Natrun, Northern Egypt over 2016–2018 on two apricot cultivars ‘Ninfa’ and ‘Canino’. Explanations for bold figures are given in Table 3.
Source of VariancedfTSCTPC
MSP > FMSP > F
Year (Y)2341.6<0.00111.710.5319
Irrigation (I)3976.5<0.0011202.6<0.001
Cultivar (C)1364.50.0014100.20.0312
Y × I3134.50.05294586.80.1792
Y × C281.70.10193625.30.0987
I × C375.30.14924136.10.2618
Y × I × C6173.40.11587271.40.4259
Error17418.89 17.86
Total191
df = degree of freedom. MS = Mean squares. P > F: The probability values associated with the F-tests.
Table 8. The effects of three years (2016, 2017, 2018), deficit irrigation treatments (control, moderate regular deficit irrigation—RDIm, severe regular deficit irrigation—RDIs and continuous deficit irrigation—CDI) and two cultivars (‘Ninfa’ and ‘Canino’) on the soluble carbohydrates content (TSC, mg g−1) in a commercial apricot orchard at Wadi El Natrun, Northern Egypt. Explanation for irrigation treatments, calculations of significant differences, and explanations for LSD0.05 values are given in Figure 3; ns: nonsignificant. Different letters represent significant differences among DI treatments.
Cultivar/Irrigation Treatment Year
2016 2017 2018 Overall
‘Ninfa’
Control151.0c140.8b153.0c148.3c
RDIm143.3b134.1b146.3b141.2b
RDIs123.6a113.4a125.6a120.8a
CDI122.9a111.9a124.1a119.6a
LSD0.056.6 6.2 6.4 6.4
‘Canino’
Control144.9b135.9b148.2b143.0b
RDIm123.4a113.6a125.8a120.9a
RDIs121.5a110.3a122.5a118.1a
CDI119.0a109.4a121.7a116.7a
LSD0.056.2 5.9 6.2 6.1
Overall cultivar
‘Ninfa’135.2b125.0b137.3b132.5b
‘Canino’127.2a117.3a129.6a124.7a
LSD0.056.4 6.1 6.3 6.3
Overall irrigation
Control147.9c138.3c150.6c145.6c
RDIm133.4b123.8b136.1b131.1b
RDIs122.6a111.8a124.1a119.5a
CDI120.9a110.7a122.9a118.2a
LSD0.057.4 7.2 7.8 7.5
Table 9. Pearson’s correlation coefficients (r) amongst 17 measures for four deficit irrigation treatments (control—Cont., moderate regular deficit irrigation—RDIm, severe regular deficit irrigation—RDIs and continuous deficit irrigation—CDI) in a commercial apricot orchard at Wadi El Natrun, Northern Egypt over 2016–2018, on two apricot cultivars ‘Ninfa’ and ‘Canino’. Bold figures represent the significant (P < 0.05) correlation coefficient values in the deficit irrigation treatments. CR: chilling requirements, HR: heat requirements, DEDFH: days from end-dormancy until fruit harvest, sGDD: sum of growing degree days, TNB: total number of buds, NFB: number flower buds, NVB: number of vegetative buds, SDF: starting date of flowering, NOFB: number of opened flower buds, FBA: flower bud abscission (%), FS: fruit set, SVG: seasonal vegetative growth, FNT: fruit number per tree, FY: fruit yield, FW: fruit weight, TSC: total soluble carbohydrates and TPC: total proline content in leaf. A: Total = all data were used and combined for years, cultivars and irrigation treatments. B: Cont. = data from control deficit irrigation treatment were used for calculating correlations; data were combined for years and cultivars. C: RDIm = data from RDIm treatment were used for calculating correlations; data were combined for years and cultivars. D: RDIs = data from RDIs treatment were used for calculating correlations; data were combined for years and cultivars. E: CDI = data from CDI treatment were used for calculating correlations; data were combined for years and cultivars.
A: TotalCRHRDEDFHsGDDTNBNFBNVBSDFNOFBFBAFSSVGFNTFYFWTSC
HR−0.44
DEDFH−0.150.27
sGDD−0.220.260.29
TNB0.32−0.64−0.23−0.18
NFB0.11−0.61−0.27−0.170.76
NVB0.35−0.25−0.03−0.070.62−0.04
SDF0.31−0.24−0.13−0.460.140.080.12
NOFB−0.06−0.56−0.14−0.080.650.760.14−0.02
FBA0.230.11−0.12−0.07−0.11−0.040.230.10−0.61
FS−0.24−0.58−0.27−0.200.310.210.220.010.44−0.41
SVG−0.05−0.39−0.09−0.250.490.370.32−0.080.73−0.660.53
FNT−0.22−0.66−0.26−0.250.490.650.23−0.030.65−0.430.950.67
FY−0.16−0.71−0.33−0.270.560.640.210.110.68−0.380.850.620.93
FW0.12−0.36−0.25−0.100.290.610.040.410.260.010.040.070.130.68
TSC−0.62−0.240.01−0.090.430.320.27−0.050.710.530.400.650.510.530.18
TPC0.61−0.12−0.01−0.11−0.28−0.09−0.320.38−0.480.61−0.28−0.72−0.39−0.310.15−0.65
B: Cont.CRHRDEDFHsGDDTNBNFBNVBSDFNOFBFBAFSSVGFNTFYFWTSC
HR−0.90
DEDFH−0.260.44
sGDD−0.190.150.56
TNB0.72−0.93−0.53−0.07
NFB0.51−0.78−0.54−0.060.95
NVB0.88−0.98−0.43−0.070.91−0.72
SDF0.34−0.39−0.63−0.530.240.030.47
NOFB0.26−0.59−0.390.040.840.920.59−0.01
FBA0.69−0.77−0.56−0.130.860.060.700.02−0.63
FS−0.05−0.09−0.02−0.350.18−0.370.080.72−0.18−0.57
SVG0.84−0.65−0.42−0.160.490.310.640.350.61−0.670.24
FNT0.19−0.63−0.47−0.340.580.620.560.590.70−0.170.660.61
FY−0.01−0.61−0.85−0.520.450.610.320.620.61−0.280.610.640.78
FW−0.14−0.10−0.92−0.510.260.610.100.530.330.270.090.060.470.92
TSC−0.63−0.320.25−0.340.290.200.350.060.290.530.390.610.47−0.030.36
TPC0.510.810.010.09−0.62−0.41−0.780.16−0.190.590.07−0.74−0.080.220.38−0.52
C: RDImCRHRDEDFHsGDDTNBNFBNVBSDFNOFBFBAFSSVGFNTFYFWTSC
HR−0.23
DEDFH−0.420.11
sGDD−0.170.500.10
TNB0.36−0.71−0.13−0.40
NFB0.26−0.84−0.16−0.140.76
NVB0.66−0.06−0.01−0.440.61−0.06
SDF0.71−0.02−0.41−0.320.620.090.63
NOFB−0.09−0.68−0.21−0.400.950.870.390.35
FBA0.630.35−0.11−0.580.61−0.030.690.56−0.61
FS0.01−0.65−0.11−0.600.64−0.670.320.150.68−0.62
SVG−0.06−0.61−0.15−0.490.680.650.240.200.81−0.530.65
FNT0.03−0.97−0.06−0.590.760.730.270.170.90−0.550.990.76
FY0.08−0.99−0.08−0.550.610.840.220.180.94−0.460.960.620.88
FW0.19−0.70−0.25−0.280.620.970.080.190.680.120.660.580.610.89
TSC−0.64−0.540.03−0.540.670.680.260.420.690.510.610.720.710.690.62
TPC0.56−0.070.56−0.26−0.37−0.09−0.460.74−0.190.25−0.01−0.21−0.03−0.03−0.01−0.14
D: RDIsCRHRDEDFHsGDDTNBNFBNVBSDFNOFBFBAFSSVGFNTFYFWTSC
HR−0.78
DEDFH−0.660.13
sGDD−0.40−0.040.74
TNB0.22−0.63−0.02−0.25
NFB0.38−0.61−0.07−0.330.82
NVB0.410.23−0.09−0.300.41−0.66
SDF0.05−0.15−0.11−0.340.43−0.070.49
NOFB0.42−0.67−0.190.180.800.710.420.13
FBA−0.170.69−0.35−0.630.250.060.320.25−0.66
FS−0.26−0.64−0.46−0.240.53−0.290.010.490.64−0.58
SVG0.70−0.69−0.31−0.260.730.750.460.270.87−0.420.64
FNT0.77−0.85−0.42−0.260.670.610.180.420.76−0.530.970.74
FY0.73−0.88−0.33−0.150.630.61−0.080.440.77−0.650.980.700.89
FW−0.19−0.22−0.32−0.670.220.640.620.310.070.780.25−0.140.090.63
TSC−0.65−0.340.36−0.350.010.410.650.620.240.540.420.670.280.410.61
TPC0.54−0.700.49−0.33−0.46−0.51−0.390.14−0.660.37−0.68−0.67−0.62−0.690.10−0.13
E: CDICRHRDEDFHsGDDTNBNFBNVBSDFNOFBFBAFSSVGFNTFYFWTSC
HR−0.59
DEDFH−0.510.52
sGDD−0.470.340.55
TNB0.37−0.74−0.01−0.19
NFB−0.11−0.61−0.18−0.340.73
NVB0.62−0.08−0.27−0.220.23−0.49
SDF0.33−0.54−0.61−0.690.230.520.45
NOFB0.07−0.62−0.01−0.340.890.930.190.43
FBA−0.490.11−0.40−0.170.570.010.740.13−0.61
FS−0.47−0.63−0.38−0.220.12−0.110.310.04−0.15−0.22
SVG0.03−0.48−0.13−0.440.500.590.210.630.64−0.190.04
FNT0.31−0.93−0.34−0.210.680.69−0.120.530.650.060.620.66
FY0.15−0.85−0.18−0.080.670.710.150.440.66−0.070.610.700.88
FW−0.14−0.61−0.16−0.170.570.620.170.210.590.070.440.720.640.83
TSC−0.64−0.240.29−0.270.650.130.68−0.010.460.590.190.610.070.040.31
TPC0.57−0.630.65−0.620.62−0.48−0.110.72−0.520.19−0.52−0.47−0.69−0.610.36−0.32
Publisher’s Note: MDPI stays neutral with regard to jurisdictional claims in published maps and institutional affiliations.

