Abstract
Vitamin A deficiency is the leading cause of night blindness, total blindness, maternal and childhood mortality in developing countries. Drought, low soil nitrogen and Striga hermonthica parasitism are major constraints to maize production in sub-Saharan Africa (SSA). Thus, the development of multiple stress tolerant maize varieties with elevated levels of PVA is an economically feasible approach to simultaneously tackle malnutrition and food insecurity in SSA. The objectives of this study were to determine the gene action modulating the inheritance of grain yield and other traits, group the inbred lines, investigate inter-trait relationships among grain yield and other traits and assess the performance and stability of single-cross hybrids derived from a set of inbred lines under stress and non-stress environments. One hundred and ninety diallel crosses plus six hybrid checks were evaluated under managed drought at Ikenne during the 2016/17 and 2017/18 dry seasons, low soil N conditions at Mokwa and Ile-Ife, Striga infestation at Abuja and Mokwa, and optimal management conditions at Ikenne, Kadawa, Abuja, Bagauda and Mokwa during the 2016 and 2017 growing seasons. Both additive and non-additive gene actions were prominent in the inheritance of grain yield and other measured traits under stress and optimal management conditions. However, additive gene action was preponderant over the non-additive. The PVA inbreds were classified into three heterotic groups with TZEI 25 and TZEIOR 164 identified as inbred testers for heterotic groups 2 and 3, respectively. Plant and ear heights, ears per plant, plant and ear aspects were identified as reliable secondary traits for genetic enhancement of grain yield under both stress and non-stress conditions. Hybrids TZEIOR 4 × TZEIOR 158 and TZEIOR 119 × TZEIOR 158 were outstanding in performance and should be tested extensively for possible commercialization to combat malnutrition and food insecurity in SSA.
1. Introduction
Maize (Zea mays) is the most cultivated cereal crop in sub-Saharan Africa (SSA) and has the potential to combat the challenges of food insecurity and malnutrition presently facing the region. The crop is cultivated on about 100 million hectares across the developing world and it is an important source of at least 30% of dietary calories for about 310 million people [1]. Due to increasing population and wider acceptability, the demand for maize in the developing world is projected to double by 2050. Therefore, there is a dire need for increased production of maize to meet this demand [2,3]. Maize is largely cultivated for its starchy endosperm which contributes a large portion of human energy intake. However, normal endosperm maize is deficient in vitamin A, which unfortunately the human body is unable to synthesize but must be sourced from external food supplements. Maize as a sole source of food exposes human populations in sub-Saharan Africa (SSA) to the risk of health challenges associated with vitamin A deficiency. Therefore, maize consumers in SSA rely on the dietary sources from plant tissues to meet its vitamin A requirements. Vitamin A deficiency is responsible for several health disorders including night blindness, total blindness and it is the leading cause of maternal and childhood mortality in developing countries [4], Development and commercialization of high yielding maize, fortified with vitamin A, is a realizable strategy for combating both hunger and health challenges related to malnutrition in SSA. Additionally, recurrent drought, low soil nitrogen and Striga hermonthica parasitism are major limiting factors to increased maize production and productivity in SSA. Yield loss due to recurrent drought is considered one of the greatest challenges facing agricultural production in SSA [5]. The occurrence and severity of drought have been projected to increase in all regions of the world leading to a downward trend in maize production. The highest yield reduction is recorded when drought occurs at the reproductive and grain filling periods, which often leads to reduced ear and kernel sizes and increased anthesis-silking interval in maize [6]. Badu-Apraku et al., [7] reported 44% yield reduction in some selected early-maturing maize varieties under moisture deficit conditions when the yield of the varieties was compared to their mean yield under well-watered environments. Striga hermonthica parasitism is another leading cause of yield loss in maize in the savanna of West and Central Africa (WCA) [8]. S. hermonthica is a parasitic weed which attacks maize, guinea corn and other cereal crops, and it is the most economically important biotic stress factor that limits maize grain yield in SSA, where majority of the diets are cereal based [9]. The damage caused by Striga is widespread, affecting the livelihoods of over 100 million Africans through reduction in grain yield [10]. The high incidence of the parasite in the savanna and mid-altitude agro-ecologies, areas with the highest maize yield potentials, severely limits the maize production capacity of SSA [10]. Kim [11] reported that under controlled environment conditions, Striga infestation causes an average yield reduction of 67% with a range of 41–91% depending on the severity of infestation and host plant susceptibility levels. Several control measures are available; however, none is capable of ensuring total control of the parasitic weed, necessitating an integrated management approach [10]. Genetic control via use of improved cultivars possessing Striga resistance/tolerance alleles has been proposed as a reliable strategy for minimizing Striga damage in SSA [12,13]. In a study conducted to compare the yield losses due to drought stress and Striga parasitism, [14] reported yield reductions of 53% and 42% under drought conditions and Striga infestation, respectively. Several factors, such as continuous cropping, declining soil fertility, short fallow as well as expansion of production into marginal lands have contributed immensely to the prevalence of Striga parasitism [10,15,16]. Low soil nitrogen is another abiotic stress that constrains the maize production capacity of WCA. In most developing countries, peasant farmers produce maize under depleted soil-nitrogen conditions due to lack of access to fertilizer which may be attributed to non-availability, and high cost and non-availability of loan facilities to farmers [17]. Reduction in grain yield due to low N is estimated to vary between 10 to 50% [18].
The IITA Maize Program has used plant breeding strategies such as backcrossing, inbreeding, hybridization, and the S1 recurrent selection to develop early maturing Striga resistant, drought and low-N tolerant inbred lines with high Pro-vitamin A levels (PVA). However, information on the extent and patterns of genetic diversity among germplasm lines is critical to the success of a hybrid development program. This helps in the identification and selection of parents for the development of superior hybrids as well as identification of sources of favorable alleles for introgressive hybridization [9]. Knowledge of the mode of gene action modulating grain yield and other traits of inbred lines under stress conditions is critical for identifying good combiners and promising hybrids, and for designing appropriate strategies for developing multiple stress-tolerant hybrids. This information could be obtained through combining ability studies. However, results of several combining ability studies conducted are inconsistent. The inconsistencies observed in the findings call for further studies to clarify the contradictions about the type of gene action involved in the inheritance of grain yield and other traits under stress conditions. Additionally, it is important to assess combining ability and heterotic patterns of the several early maturing PVA inbreds recently developed in the IITA-MIP and to classify them into heterotic groups to exploit their genetic potential in hybrid combinations. Combining ability analysis is a powerful tool for identifying genotypes for crosses in order to fully exploit hybrid vigor and identify outstanding hybrids for direct use or for further breeding [19]. The genetic improvement of grain yield and other desirable traits depend on the nature and magnitude of genetic variability and interactions involved in the inheritance of the traits and can be estimated using diallel cross technique [20]. Diallel mating design has been effective for determining the gene action controlling the inheritance of grain yield and other important traits, estimating the general combining ability (GCA) of parental lines, identifying superior inbred parents for hybrid or synthetic cultivar development, classifying inbred lines into heterotic groups and identifying appropriate testers for use in breeding programs in SSA [21,22,23,24]. The present study was carried out to (i) determine the gene action modulating inheritance of grain yield and other traits (ii) estimate general and specific combining abilities of 20 PVA early maturing inbred line and classify them into heterotic groups (iii) assess the performance and stability of the single-cross hybrids under stress and non-stress conditions and (iv) investigate interrelationships among grain yield and other traits under stress and non-stress conditions.
2. Materials and Methods
2.1. Development of PVA Maize Inbred Lines
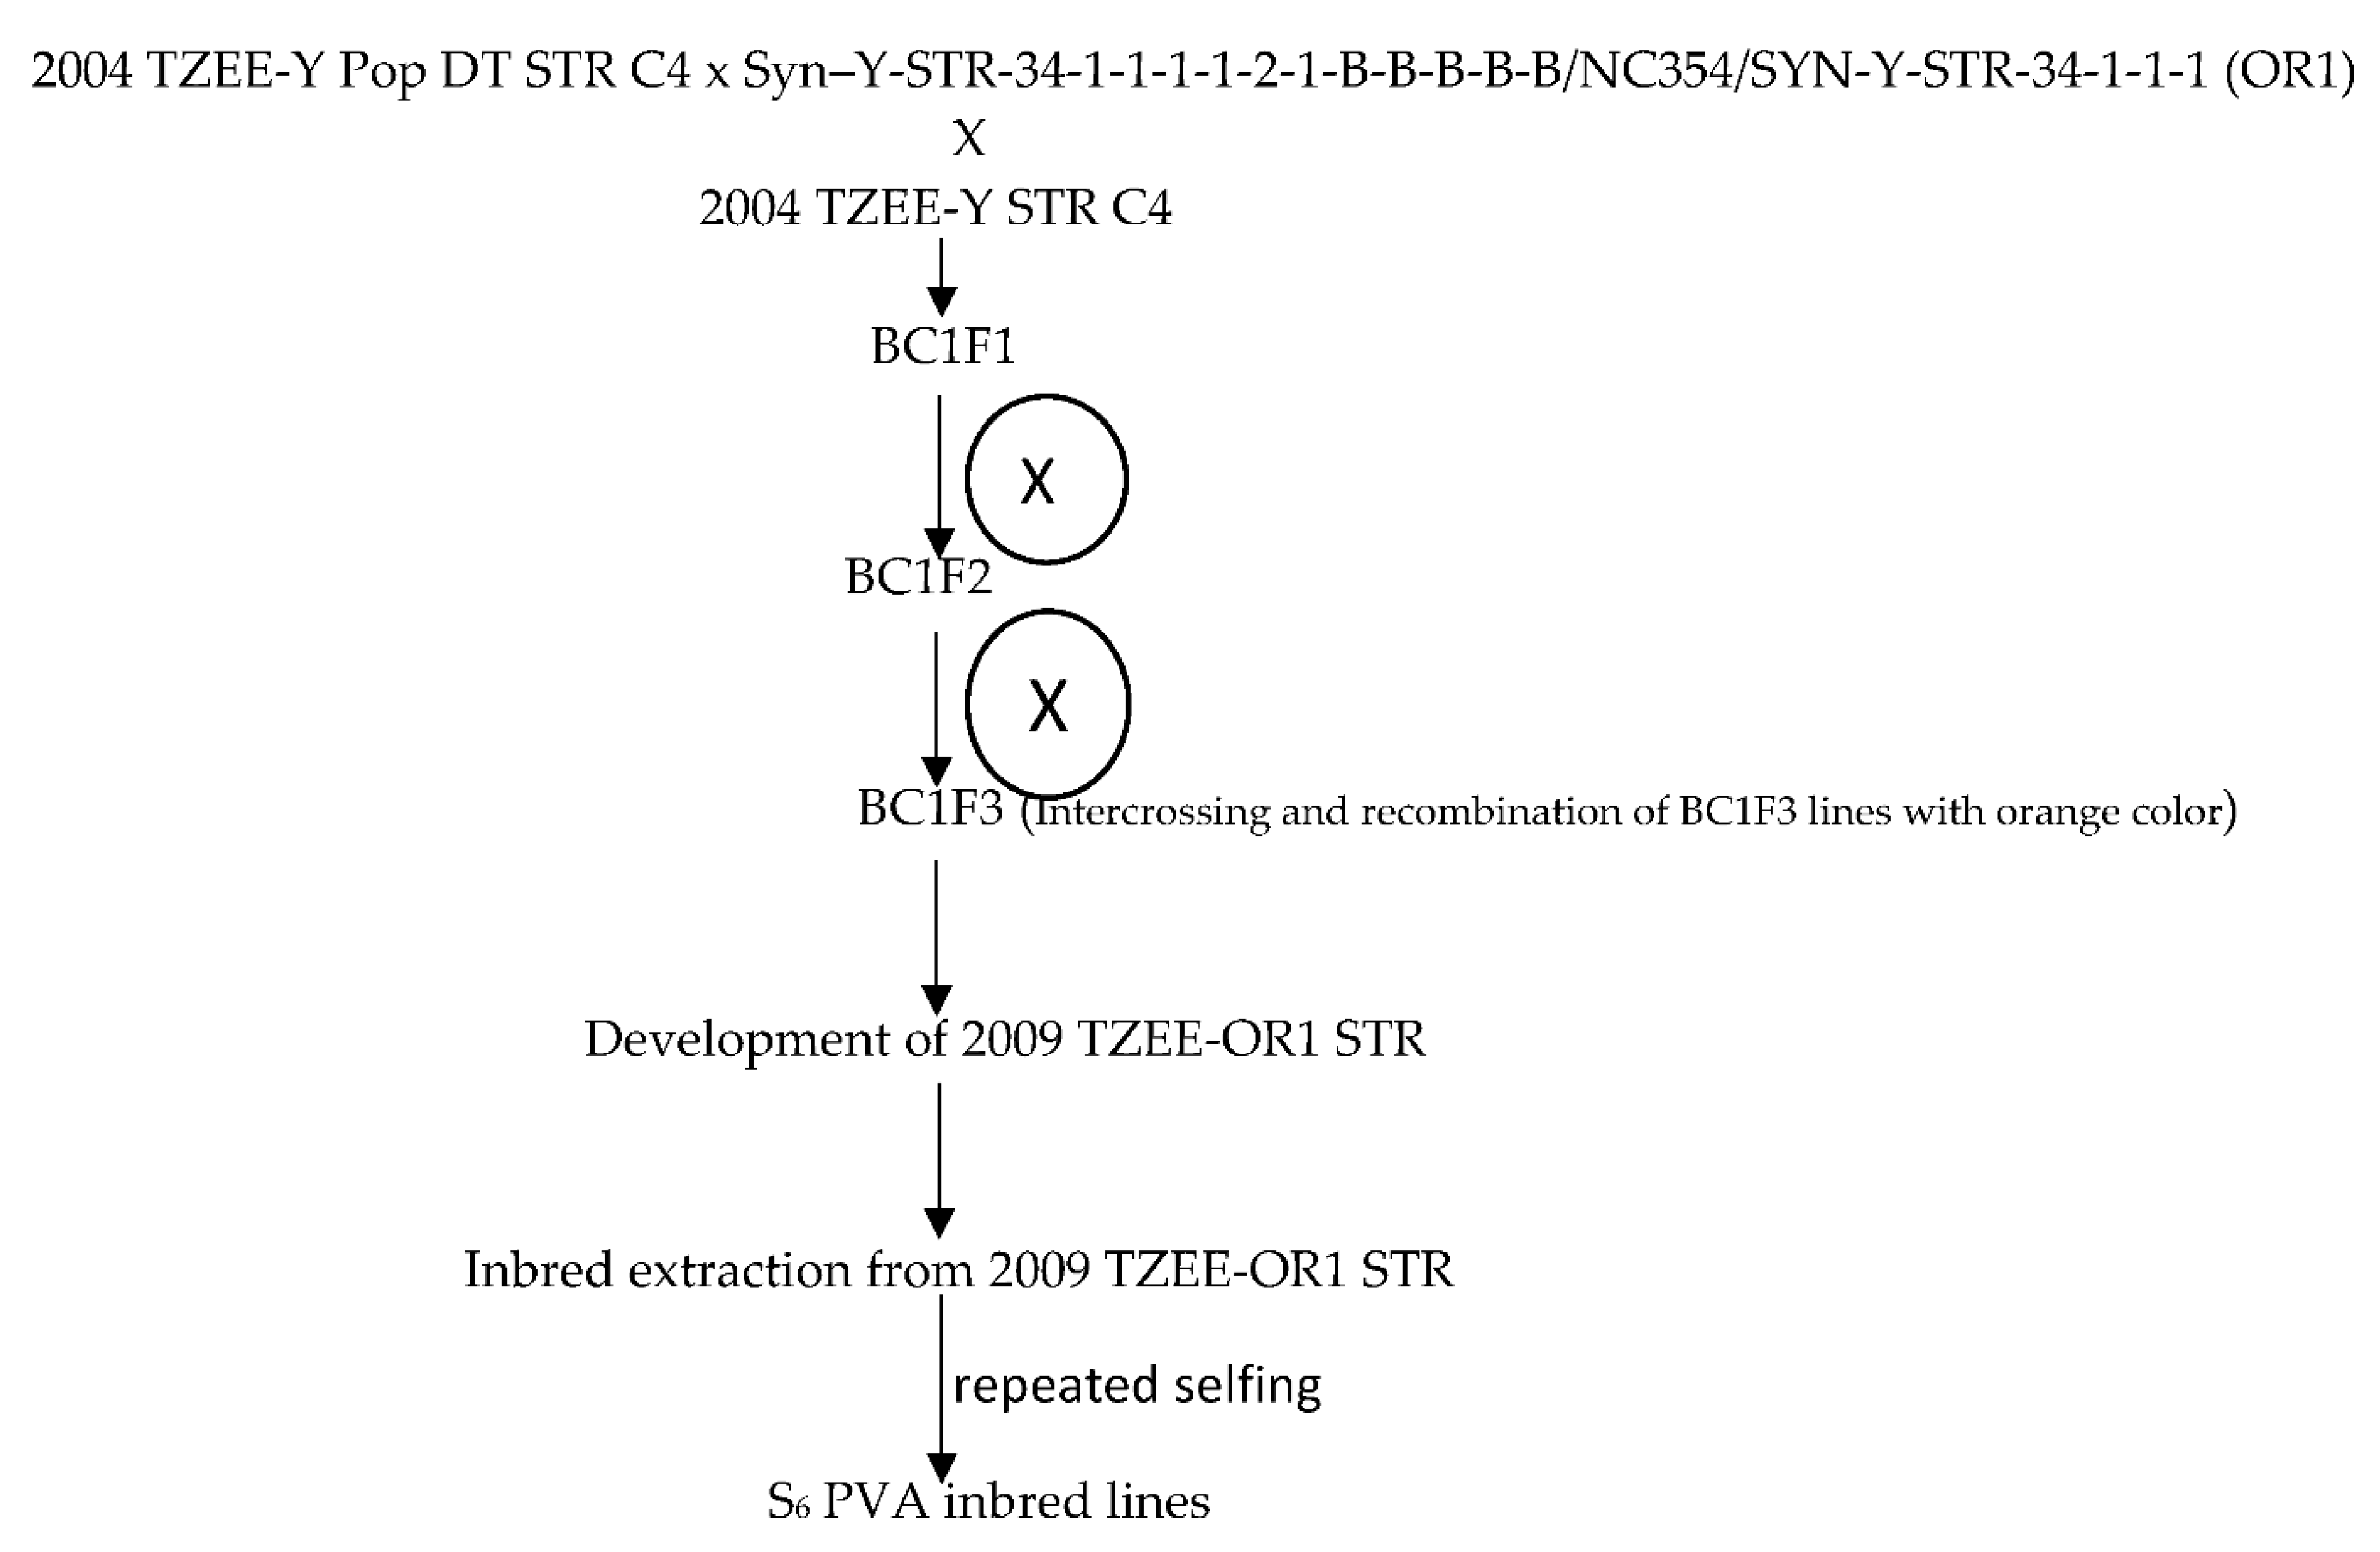
The broad based early maturing drought and Striga resistant yellow/orange variety, 2004 TZE-Y Pop DT STR C4, was crossed to a source of high provitamin A [Syn –Y-STR-34-1-1-1-1-2-1-B-B-B-B-B/NC354/SYN-Y-STR-34-1-1-1 (OR1) intermediate maturing population from the IITA Maize Improvement Program to introgress the genes for high beta-carotene into the variety. Subsequently, the top-cross hybrid was backcrossed to the recurrent population to recover earliness, resulting in BC1F1 progenies. This was followed by a cycle of backcrossing to 2004 TZE-Y Pop DT STR C4 to recover earliness. The kernels of BC1F1 with deep orange color were selected and recombined to obtain the early provitamin A variety 2009 TZE-OR1 STR. This was followed by selfing of 2009 TZE-OR1 STR to obtain S1 lines which were advanced through repeated selfing to the S6 stage to develop 155 early provitamin A inbred lines. The kernels of the BC1F1 of each material with deep orange color were selected and self-pollinated for two cycles for advancement to the BC1F3 stage. Furthermore, BC1F3 lines with the deep orange color were selected and recombined to form the early Provitamin A variety, 2009 TZE-OR1 STR (Figure 1). Due to fund limitations the provitamin A variety could not be screened for beta-carotene content. However, the variety was included in the regional uniform variety trials under multiple contrasting environments in 2010 and several of them showed outstanding performance. Additionally, the early varieties 2009 TZE-OR1 DT STR out-yielded the commercial OPV check, TZE Comp 3 and DT C2 F2 by 12 and 11% across eight contrasting environments in WCA [25]. Following the development of the PVA inbred lines, genetic studies were conducted to determine the combining ability of the lines and to identify inbred testers. Several outstanding inbred lines identified were crossed among themselves to develop bi-parental crosses including (TZEI 17 × TZEI 11) from which additional inbred lines were developed through pedigree selection [26]. Furthermore, selected inbred testers were crossed to the OPVs including 2009 TZE-OR1 STR for development of top-cross hybrids. The 20 early maturing pro-vitamin A inbred lines used for the present study included lines extracted from (TZEI 17 × TZEI 11) and 2009 TZE OR1 DT STR. Selection of the inbred lines for the present study was based on the evaluations conducted under managed moisture stress at Ikenne as well as under Striga-infested conditions at Mokwa and Abuja in 2014 and 2015.
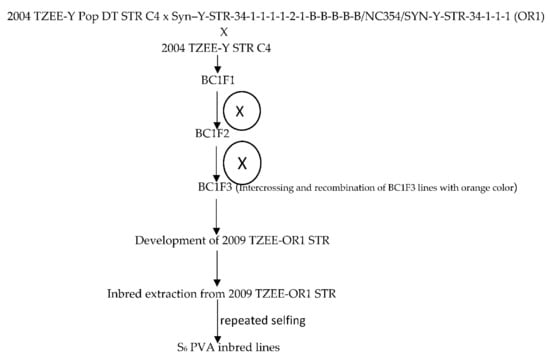
Figure 1.
Extraction of the PVA inbred lines derived from the source population 2009 TZEE-OR1 STR.
2.2. Generation of the Diallel Crosses
The 20 PVA inbred lines selected for this study were planted in the breeding nursery at IITA headquarters, Ibadan, during the growing season of 2016. All the inbred lines were mated in a diallel to produce 190 F1 hybrids excluding reciprocals. The 190 hybrids along with six checks (three yellow normal-endosperm early maturing single-cross hybrids and three top-cross hybrids were evaluated in the present study.
2.3. Field Evaluations
The hybrids (190 single-cross hybrids plus 6 checks) were evaluated between 2016 and 2017. The trial was evaluated under managed moisture stress at Ikenne (6°53′ N, 30°42′ E, 60 m altitude) during the dry seasons of 2016/2017 and 2017/2018. The plants were irrigated using sprinkler irrigation system that delivered 17 mm of water each week for the first three weeks. Drought stress was imposed by withdrawing irrigation at 25 days after planting (DAP) until maturity, thus making the maize plants rely on water stored in the soil for growth and development. The soil at the IITA experimental station at Ikenne is eutric nitrosol [27], with high water holding capacity. The experiment was planted on a flat and uniform field. Fertilizer was applied at planting at the rate of 60 kg N/ha, 60 kg P/ha and 60 kg K/ha, with an additional 60 kg N/ha applied as top-dress at 4 WAP.
Evaluations under Striga infestation was carried out at Mokwa (9°18′ N, 5°4′ E, 457 m altitude, 1100 mm rainfall) in 2016 and 2017 and Abuja (9°16′ N, 7°20′ E, 300 m altitude, 1500 mm rainfall) in 2017 in the southern Guinea savanna of Nigeria. Striga infestation was in accordance with the method of [11] and [28]. Striga hermonthica seeds collected from sorghum (Sorghum bicolor) fields and stored for at least 6 months to break the seed dormancy were used for the present study. Ethylene gas was injected into the soil 2 weeks before artificial infestation to stimulate suicidal germination of existing Striga seed in the field. Application of fertilizer was delayed until about 21–25 DAP when 30 kg/ha each of N, P and K were applied as NPK 15-15-15. The delay was necessary to stimulate the production of strigolactones to cause suicidal germination of the Striga seeds in the soil. Weeds other than Striga were controlled by manual weeding.
Under low-N, the single-cross hybrids plus checks were planted at Mokwa during the major growing season of 2016 and 2017. The soil at Mokwa is luvisol [27] with 0.27%, 0.04% and 0.48% by volume of organic carbon, organic nitrogen and phosphorus content, respectively. Maize was planted on the experimental field for several years and the biomass was removed after each harvest to deplete the N in the soil. Soil samples were taken, and the N content of the soil was determined at IITA Analytical Laboratory Services, Ibadan, using the Kjeldahl digestion and colorimetric methods [29]. Fertilizer was applied to bring the total available N to 30 kg N/ha at 2 WAP. Single superphosphate (P2O5) and muriate of potash (K2O) were applied to the low-N blocks at the rate of 60 kg/ha.
Under optimal growing conditions, the single-cross hybrids plus the checks were evaluated at Ikenne during the growing season of 2016 and 2017, Mokwa and Kadawa in 2016, Abuja and Bagauda in 2017. Water and nitrogen were not limiting under the optimal growing conditions, and weeds were effectively controlled. The trials received 60 kg/ha each of N, P and K at 2 WAP with an additional 30 kg N/ha top-dressed at 4 WAP. A 14 × 14 randomized incomplete-block design with two replications was used in each of the trials. The experimental unit was single-row plots, 3 m long with spacing of 0.75 m between rows and 0.40 m between plants within a row in all the trials. Three seeds were planted per hill, and the seedlings were thinned to two seeds per hill at about 2 weeks after emergence to give a final population density of about 66,666 plants ha−1. All experiments except those under Striga infestation were kept weed-free with the application of Atrazine and Gramoxone at 5 L/ha as pre- and post-emergence herbicides, respectively.
2.4. Kernel Samples Production for Quantification of PVA Contents
Seed samples used for the carotenoid analyses in the present study were produced as described by [30] by self-pollinating the hybrids and 20 PVA inbred lines to produce kernel samples for analysis of the PVA contents. The 54 hybrids were selected from the 196 derived hybrids based on GY performance. The 20 inbred lines were parents involved in generating the 54 hybrids using the diallel mating arrangement. The genotypes were planted under well-watered conditions at IITA-Ibadan (7°28′11.99″ N, 3°53′2.88″ E, altitude 190 m) and Ikenne in 2018 using 1 m long single rows with 0.75 m between rows and 0.20 m within rows. One plant per hill was established to provide five plants per plot. Maize grain samples of hybrids and inbred lines were produced by self-pollination of individual plants in each plot. At physiological maturity, the self-pollinated ears of the inbred lines and hybrids of each location were harvested per plot, dried under ambient temperature, and shelled [31]. The seed samples were stored in the long-term storage facility of IITA at 4 °C. Seed samples of the 20 inbred lines used for the diallel crosses along with the top yielding 13 PVA hybrids plus two checks obtained from compositing grains harvested separately from the inbred lines and hybrid trials of the two locations were drawn from the long-term storage and the carotenoids were extracted and quantified at the Food and Nutritional Laboratory of IITA, Ibadan, Nigeria. The High-Performance Liquid Chromatography (HPLC) method, based on the extraction protocol described by [32], was employed for the carotenoid analysis. The five carotenoids, β -carotene (cis and trans isomers), α-carotene, β-cryptoxanthin, zeaxanthin, and lutein were determined based on calibrations using external standards. Total carotenoids were computed as the sum of concentrations of α-carotene, β-carotene, lutein, zeaxanthin and β-cryptoxanthin. PVA was computed as the sum of β-carotene, and half of each of β-cryptoxanthin and α-carotene contents, because β-cryptoxanthin and α-carotene contribute about 50% of the β-carotene as PVA according to the [33]. Two independent measurements were taken to represent each sample. In addition to the PVA levels of the hybrids (HPVA) determined by chemical analysis, those of the mid-parent (MP) were calculated as the average of the sum of PVA levels of parental inbred lines (Table 1) involved in hybrid development.

Table 1.
Characteristics and parentage of early-maturing maize inbred lines used for the diallel study.
2.5. Data Collection
In all the environments, data were recorded for days to silking and days to anthesis as the number of days from planting to when 50% of the plants in the plot had extruded silks and had shed pollen. The anthesis-silking interval (ASI) was calculated as the difference between the number of days to silking and number of days to anthesis. Plant height was measured as the distance from the base of the plant to the height of the first tassel branch and ear height as the distance from the base of the plant to the node bearing the upper ear. Root lodging (the percentage of plants leaning more than 300 from the vertical), and stalk lodging (percentage of plant broken at or below the ear node) were recorded. For drought and low-N experiments, stay-green characteristic was measured at 70 DAP on a scale of 1 (almost all leaves green) to 9 (virtually all leaves dead). Plant aspect was scored on a scale of 1 (excellent plant type) to 9 (poor plant type). Husk cover was scored on the scale of 1 (husk tightly arranged and extended beyond the tip of the ear) to 5 (ear tips exposed). Ear aspect was measured on the scale of 1 (clean, uniform, large and well-filled ears) to 9 (ears with undesirable features). Number of ears per plant (EPP) was calculated by dividing the total number of ears harvested per plot by number of plants in the plot. Percentage moisture was determined from shelled harvested ears. For trials under drought and low-N, harvested ears were shelled and weighed, grain yield in kg/ha was computed from the grain weight, adjusted to 15% moisture. For the optimal and Striga experiments, a shelling percentage of 80% was assumed for all hybrids and grain weight (obtained from ears weighed and converted to kg/ha) was adjusted to 15% moisture. The data recorded under Striga experiments were the same as those obtained under low-N except that no data was recorded on plant aspect and stay-green characteristic. Striga damage [13] and number of emerged Striga plants at 8 and 10 WAP (50 and 70 DAP) in the Striga infested plots. Striga damage ratings were scored on the scale of 1 (no damage, indicating normal plant growth) to 9 (complete collapse or death of the maize plant i.e highly susceptible). Even though data were collected on several traits, only those on the most important traits in the studies were presented.
2.6. Statistical Analysis
Analysis of variance was conducted on data collected across locations and years under each research condition with PROC GLM in SAS using RANDOM statement with the test option [34]. Furthermore, combined ANOVA were carried out across the 13 research environments with the sources of variation such as environment, replicates within environments and block within replicate × environment considered as random factors while hybrids (190 plus six checks) were regarded as fixed factors. The general combining ability (GCA) effects of the parents and the specific combining ability (SCA) effects of the crosses, as well as their mean squares in each environment and across research environments were estimated for the 190 diallel crosses following Griffing’s method 4 model 1 (fixed model) ([35] and the DIALLEL-SAS program developed by [36] adapted to SAS software version 9.3 [34]. The GCA and SCA effects were tested for significance using t-test. The relative importance of the GCA was investigated using the method of [37] as modified by [38].
Inbred lines were assigned into heterotic groups based on GCA of multiple traits (HGCAMT) grouping method proposed by [39]. Grouping was achieved by standardizing the GCA effects of each trait that had significant mean squares for G under each study condition to minimize the effects of different scales for the traits. The statistical model used was:
where Y is HGCAMT, which is the genetic value measuring relationship among genotypes based on the GCA of multiple traits i to n; Yi is the individual GCA effects of genotypes for trait I, Ẏ is the mean of the GCA effects across genotypes for traits I, s is the standard deviation of the GCA effects of the trait I and εij is the residual of the model associated with the combination of the inbred i and trait j.
The 20 inbred lines were then classified into heterotic groups based on the Euclidean distance generated from the HGCAMT. Ward’s minimum variance cluster analysis based on GCA effects was used to assign the inbred lines to heterotic groups across environments using SAS software version 9.3. The efficiency of the HGCAMT grouping method was confirmed based on the procedure proposed by [40] and modified by [39]. The 190 hybrids were divided into two major groups i.e., inter-group and within-group crosses. These two groups were subsequently divided into high yielding hybrids (Yield of group 1 with a mean grain yield ranking among the first 64); intermediate yielding hybrids (Yield group 2 with a mean grain yield between the 65th and the 127th) and low yielding hybrids (Yield group 3 with a mean grain yield between the 128th and the 190th).
The genotype-by-trait (G × T) analysis was conducted using R (software) package GEA-R (version 4.0), [41]. Since the traits were measured in different units, they were standardized (mean = 0, standard deviation = 1). The GGE biplot model equation for the G × T analysis is as follows:
where Ŷij is the genetic value of the combination between inbred I and trait j; µ is the mean of all combinations involving trait j; βj is the main effect of trait j; λ1 and λ2 are the singular values for PC1 and PC2; gi1 and gi2 are the PC1 and PC2 eigenvectors, respectively, for inbred I; e1j and e2j are the PC1 and PC2 eigenvectors, respectively, for trait j; dj is the phenotypic standard deviation (with mean zero and standard deviation of 1); and εij is the residual of the model associated with the combination of inbred I and trait j.
The data on grain yield was subjected to GGE biplot analysis to decompose the G × E interactions as described by [42]. The GGE biplot focused on the first two principal components (PC1 and PC2) derived by subjecting the environment centered grain yield means for each location to singular value decomposition. The data were not transformed (Transform = 0), not standardize (Scale = 0), and were environment-centered (Centering = 2). This provided information on the hybrids that were suitable for the different environments and investigation of stability of hybrids in the various environments.
3. Results
Analysis of Variance and Combining Ability of Grain Yield and Other Agronomic Traits
The result of the analysis of variance across the three stresses (Table 2) showed significant mean squares for genotype (G), environment (E) and genotype by environment interactions (GEI) for grain yield and other measured traits. Partitioning the genotypic effects into GCA and SCA components revealed that across the stresses, GCA and SCA mean squares were significant for grain yield and other measured traits except for SCA for ASI. Also, significant GCA and SCA mean squares were observed for PASP and STGR under drought and low soil N conditions, Striga damage at 8 and 10 WAP, and emerged Striga plants at 8 and 10 WAP in Striga-infested environments. However, the SCA mean squares for emerged Striga plants at 8 WAP and 10 WAP were not significant. Under optimal conditions, G, E and GEI showed significant mean squares for measured traits under optimal growing conditions (Table 3). Significant GCA and SCA mean squares were detected for all measured traits except husk cover. The GEI mean squares were significant for measured traits under stress conditions excluding emerged Striga plants at 8 WAP and 10 WAP. Additionally, significant GCA × E and SCA × E interaction mean squares were observed for measured traits under stress, optimal and across research conditions except GCA × E for days to anthesis, Striga damage at 8 and 10 WAP, emerged Striga plants at 8 and 10 WAP under striga -infested conditions, days to anthesis and silk under optimal conditions, SCA × E interaction mean squares for Striga damage and emerged Striga plants at 8 and 10 WAP under Striga infestation.
Table 2.
Mean squares from the ANOVA of grain yield and other agronomic traits of 190 early maturing pro-vitamin A hybrids and 6 hybrid checks evaluated across three stress conditions (drought, low-N and under Striga infestation) in 2016 and 2017 in Nigeria.
Table 3.
Mean squares from the ANOVA of grain yield and other agronomic traits of 190 early maturing pro-vitamin A hybrids and 6 hybrid checks evaluated under optimal conditions and across stress and non-stress conditions in 2016 and 2017 in Nigeria.
Significant and positive GCA effects for grain yield were observed for TZEI 25 and TZEIOR 164 across research environments (Table 4). Inbreds TZEIOR 52, TZEIOR 163 and TZEI 25 recorded a positive and significant GCA effect for grain yield across research environments. TZEIOR 163 and TZEI 25 had negative and significant GCA effects for Striga damage rating at 8 and 10 WAP while TZEIOR 52, TZEIOR 158 and TZEIOR 164 recorded negative and significant GCA effects for Striga damage at 8 WAP and 10 WAP as well as emerged Striga plants at 8 and 10 WAP. The ratio of GCA/SCA effects revealed a higher GCA effect than the SCA for grain yield and other measured traits. The highest and least genetic ratios were observed for ASI and grain yield, respectively, under optimal growing conditions. Additionally, the relative importance of GCA to SCA effects for grain yield was higher across stress conditions than the non-stress conditions (Figure 2).
Table 4.
General combining ability (GCA) effects for grain yield and other agronomic traits of the 20 early maturing pro-vitamin A inbred lines crossed in diallel fashion and evaluated under stress, non-stress and across both conditions between 2016 and 2017 in Nigeria.
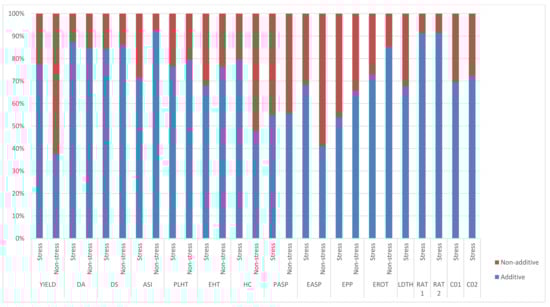
Figure 2.
Proportion of additive (lower bar) and non-additive (upper bar) genetic variance for grain yield and other agronomic traits under stress, non-stress, and across test environments in a diallel among 20 early pro-vitamin A inbred lines.
The dendrogram constructed using the HGCAMT grouping method placed the parental inbred lines into three heterotic groups (Figure 3). Eleven inbred lines TZEIOR 125, TZEIOR 124, TZEIOR 79, TZEIOR 68, TZEIOR 73, TZEIOR 62, TZEIOR 129, TZEIOR 30, TZEIOR 4, TZEIOR 6 and TZEIOR 2 constituted heterotic group I. Inbreds TZEIOR 163, TZEIOR 158, TZEIOR 157, TZEIOR 25, and TZEIOR 52 were placed in heterotic group II while TZEIOR 165, TZEIOR 164, TZEIOR 119 and TZEIOR 117 were classified into group III. Inbred testers were identified based on high per se grain yield, significant and positive GCA for grain yield, and classification into heterotic groups. Based on these criteria, inbred lines TZEI 25 and TZEIOR 164 were identified as the best testers for heterotic groups II and III, respectively, while no tester was identified for heterotic group I.
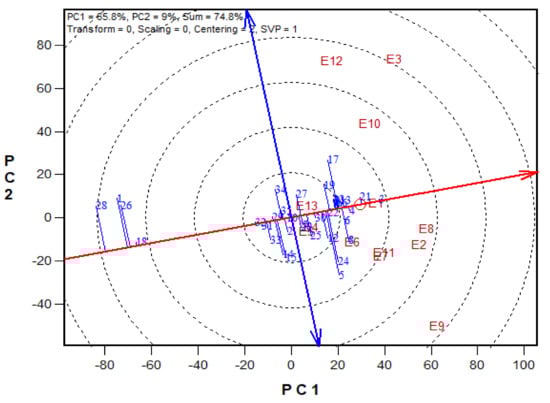
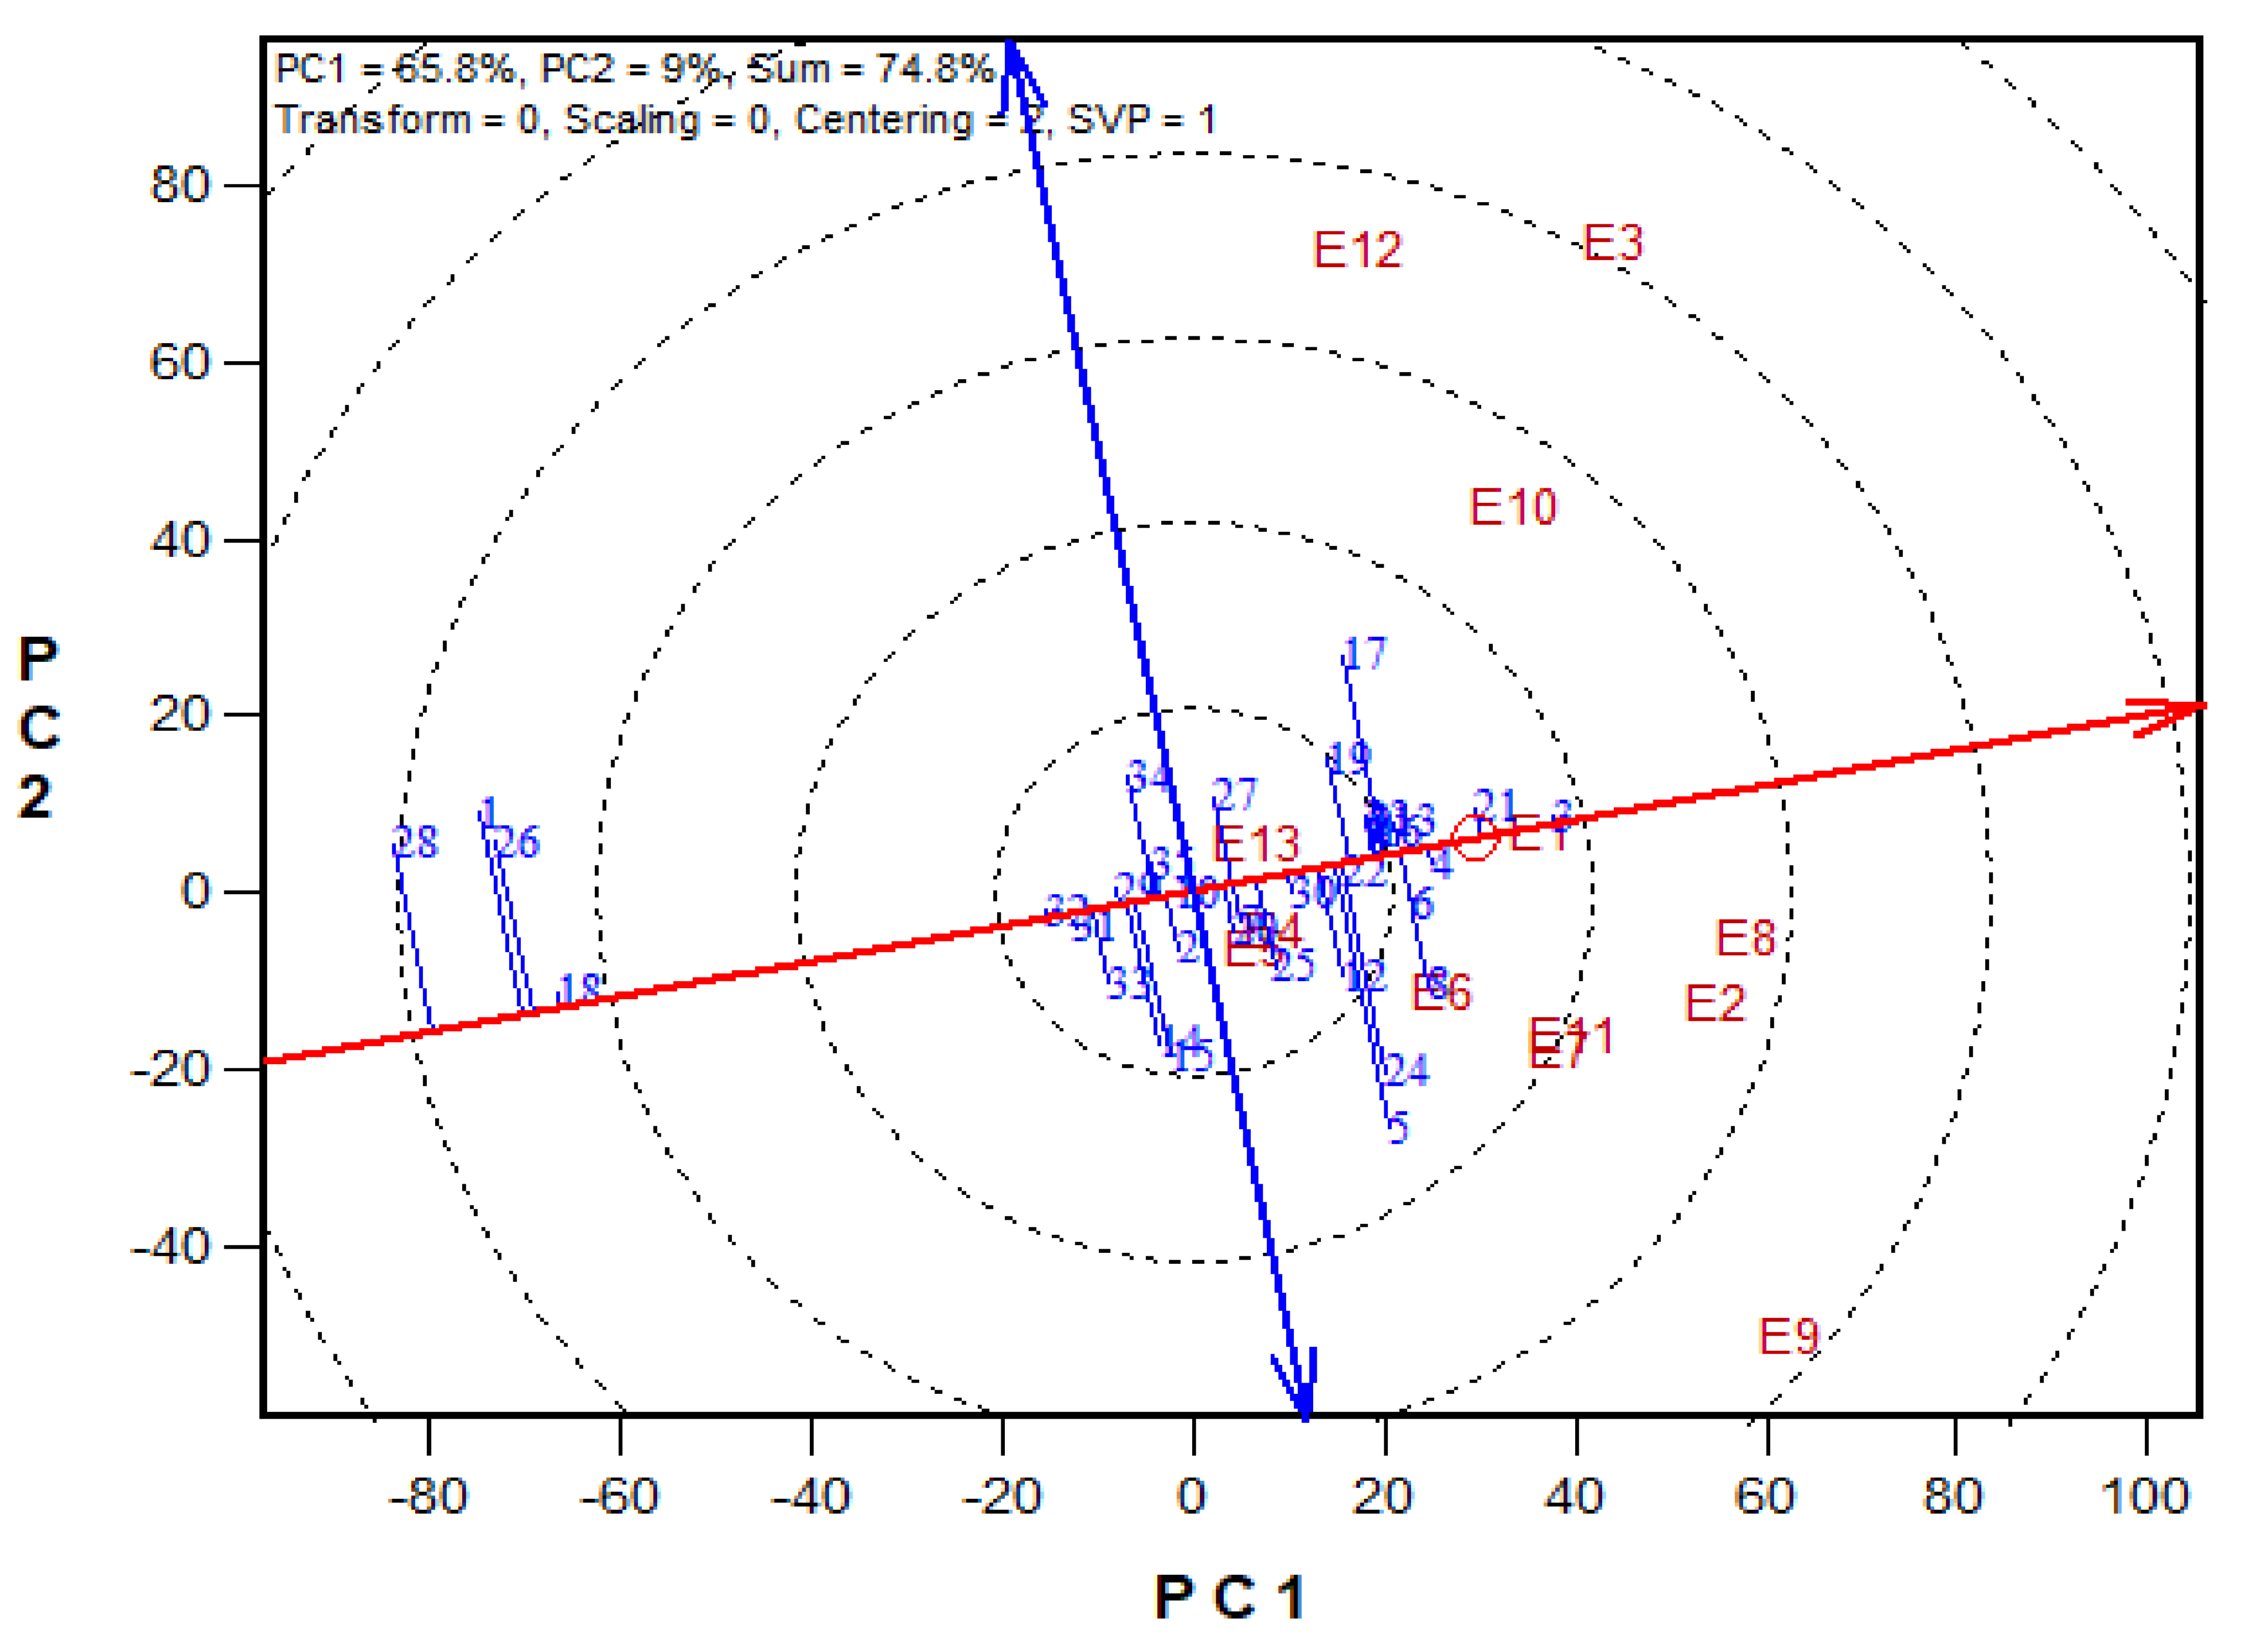
Figure 3.
A Mean vs. Stability view based on a genotype × environment yield data of 29 early maturing pro-vitamin A hybrids and 6 checks evaluated in 13 environments under drought, low-N, Striga infestation and optimal conditions between 2016 and 2017. The biplot was based on environment-focused singular value partitioning (‘SVP = 1) and is therefore appropriate for visualizing the relationships among genotypes. Principal component (PC)1 and PC 2 explained 51.1% of yield variation.
Under stress conditions, grain yield ranged from 23 Kg ha−1 for TZEIOR 62 × TZEIOR 68 to 3341 Kg ha−1 for TZEIOR 119 × TZEIOR 158 (Table S1). The best PVA hybrid outyielded the best non-PVA hybrid check by 29% under stress conditions and the least performing hybrid check by 101%. Under optimal conditions, grain yield ranged from 480 kg/ha for TZEIOR 157 × TZEIOR 163 to 6588 kg/ha for TZEIOR 4 × TZEIOR 158 (Table S2), outyielding the best performing hybrid check by 43%, and the least performing hybrid check by 57%. Across research environments, grain yield varied between 781 kg/ha for TZEIOR 164 × TZEIOR 165 to 4300 kg/ha for TZEIOR 4 × TZEIOR 158. The yield of the top performing PVA hybrid was 24% better than the best performing single-cross commercial check (TZEI 124 × TZEI 25) and 49% better than the least performing single-cross hybrid check (TZEI 24 × TZEI 17) across the research environments (data not shown).
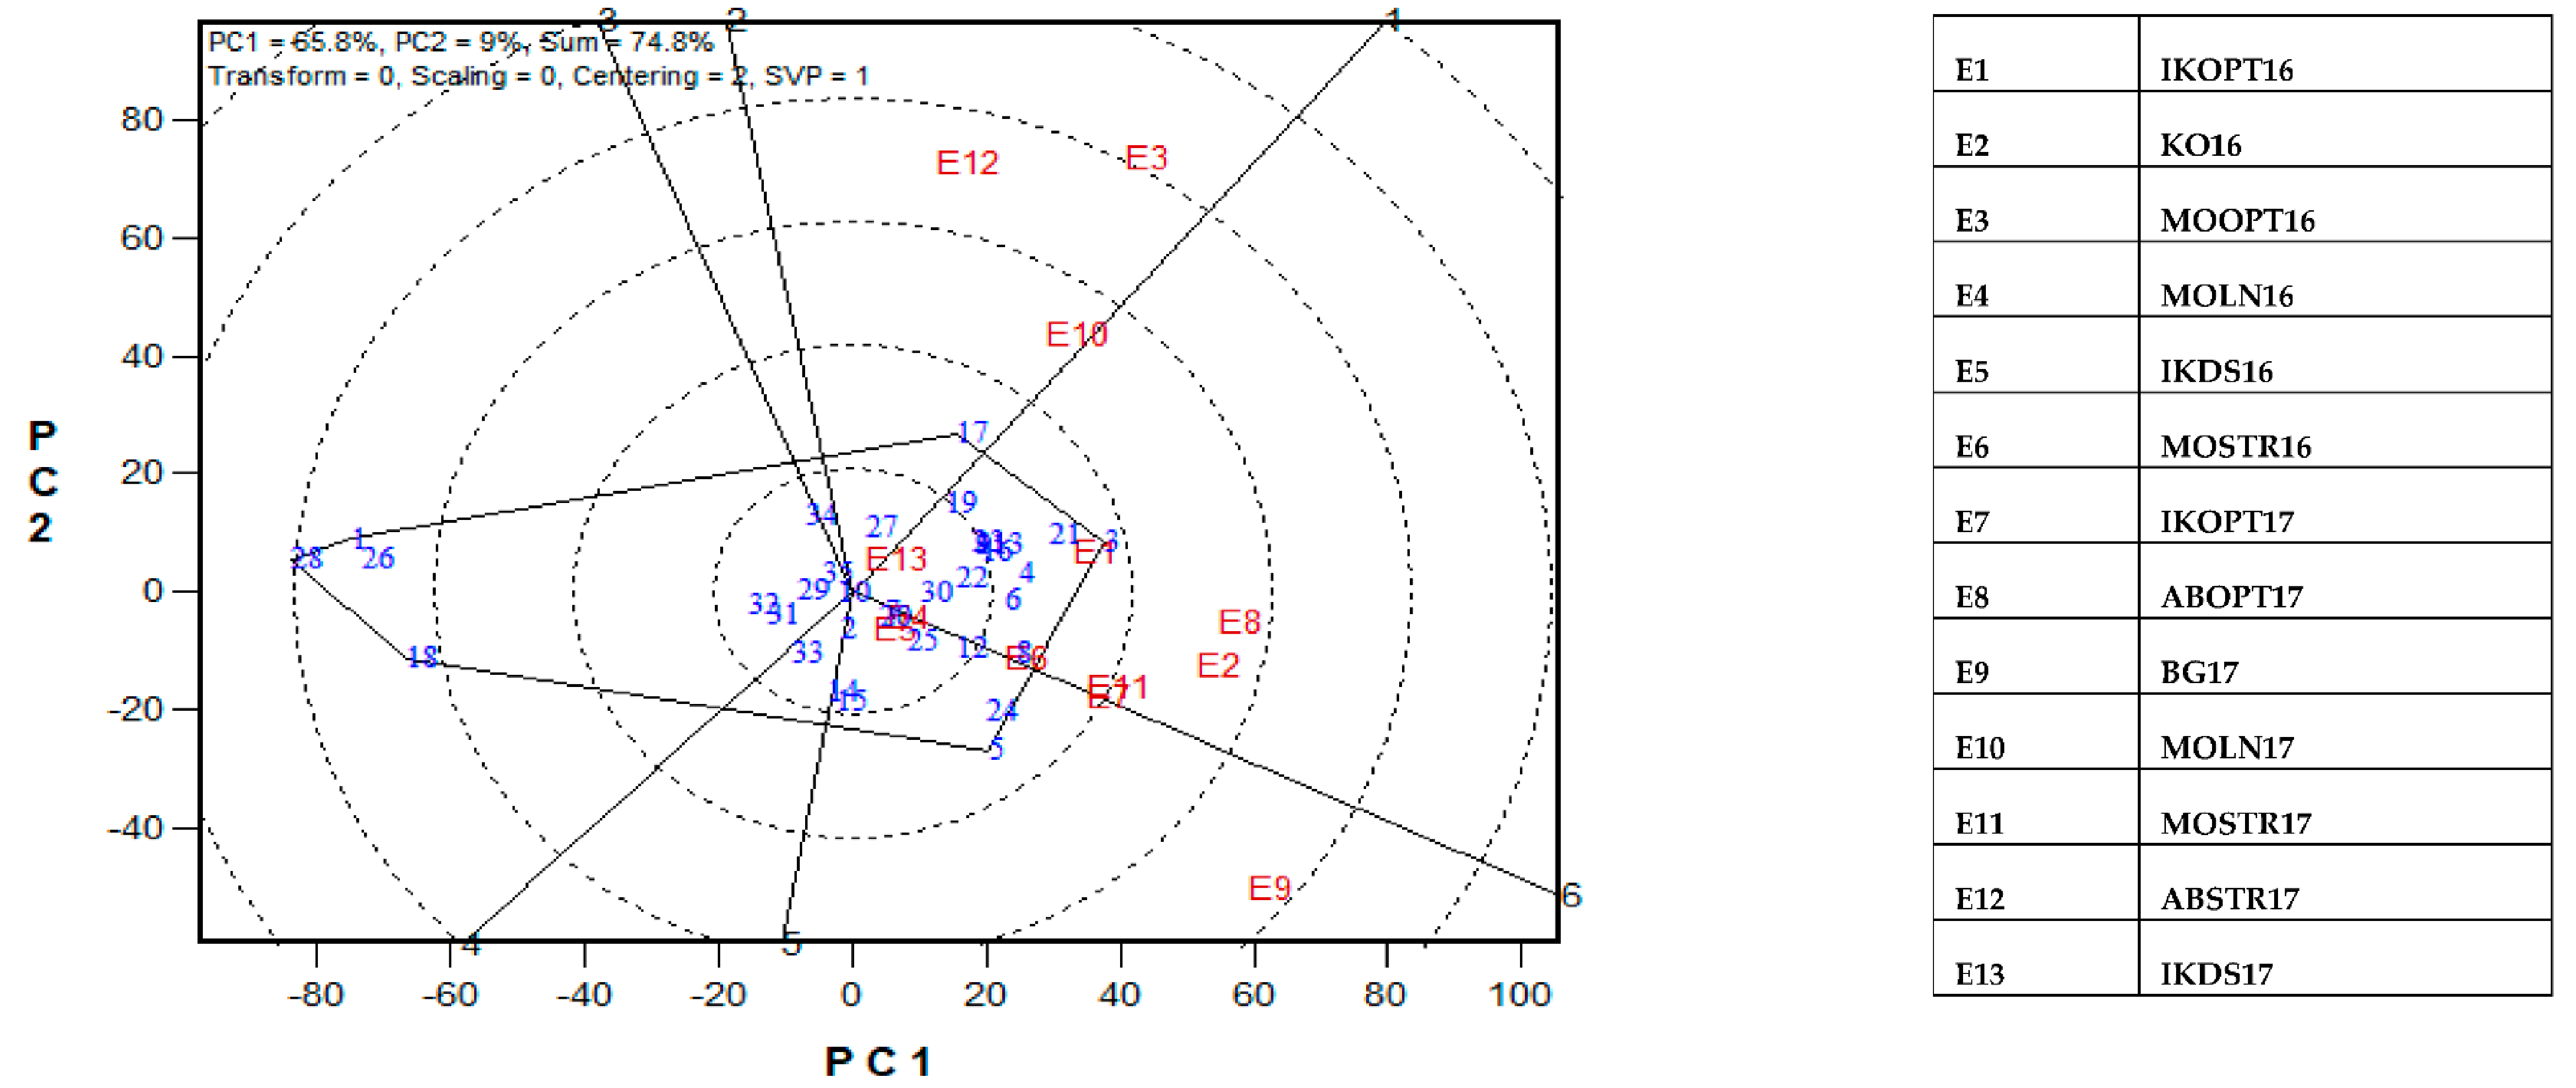
The GGE-biplot was employed to decompose the G × E interaction, to determine the yield and stability of the PVA hybrids across research environments. The principal component 1(PC1) axis explained 65.8%, while the PC2 explained 9% of the total variation jointly accounting for about 75% of the total variation (Figure 3). The GGE biplot for grain yield of the best 25 and the worst four PVA hybrids alongside the six checks evaluated at 13 locations under drought and low soil-N conditions, artificial Striga infestation and optimal growing conditions is shown in Figure 3 and Figure 4. In the entry/tester view (mean vs. stability) of the GGE biplot (Figure 3), the double-arrowed line separated entries with below-average means from those with above-average means. The average yield of a cultivar is approximated by the projections of their markers on the average-tester axis while the stability of a hybrid is measured by its projection onto the double-arrow line (average-tester coordinate (y) axis). Hybrids 3 (TZEIOR 4 × TZEIOR 158), 21 (TZEIOR 119 × TZEIOR 158) and 4 (TZEIOR 4 × TZEIOR 167) were the highest yielding and the most stable hybrids across the 13 research environments while hybrids 1 (TZEIOR 2 × TZEIOR 6), 28 (TZEIOR 164 × TZEIOR 165), and 26 (TZEIOR 157 × TZEIOR 158) were the lowest yielding and most unstable across test locations. In the polygon view (Figure 4), the vertex hybrid in each sector indicated the highest yielding hybrid in the locations that fell within the sector. Therefore, entry 3 (TZEIOR 4 × TZEIOR 158) was the highest yielding hybrid at E1 (Ikenne under optimal conditions in 2016), E2 (Kadawa, under optimal conditions in 2016), E4 (Mokwa, under low-N in 2016), E6 (Mokwa, under Striga infestation in 2016), E7 (Ikenne, under optimal conditions in 2017), E8 (Abuja, under optimal conditions in 2017) and E11 (Mokwa, under Striga infestation in 2017); hybrid 17 (TZEIOR 73 × TZEIOR 158) was the top ranking hybrid at E3 (Mokwa, under optimal growing conditions in 2016), E10 (Mokwa, under low-N in 2017) and E12 (Abuja, under Striga infestation in 2017); while entry 5 (TZEIOR 6 × TZEIOR 73) was the top ranking hybrid at E5 (Ikenne, under drought condition) and E9 (Bagauda, under optimal conditions).
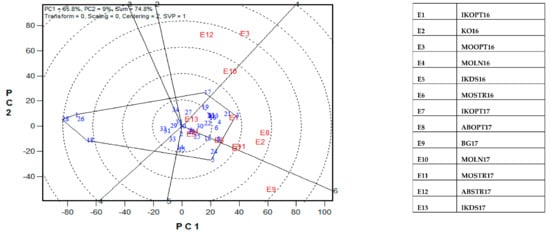
Figure 4.
A Which-won where or which-is-best-at-what based on a genotype × environment yield data of 29 early maturing pro-vitamin A hybrids and 6 checks evaluated in 13 environments under drought, low-N, Striga infestation and optimal conditions between 2016 and 2017. The biplot was based on genotype-focused singular value partitioning (‘SVP = 2) and is therefore appropriate for visualizing the relationships among environments. Principal component (PC) 1 and PC 2 explained 74.8% of yield variation.
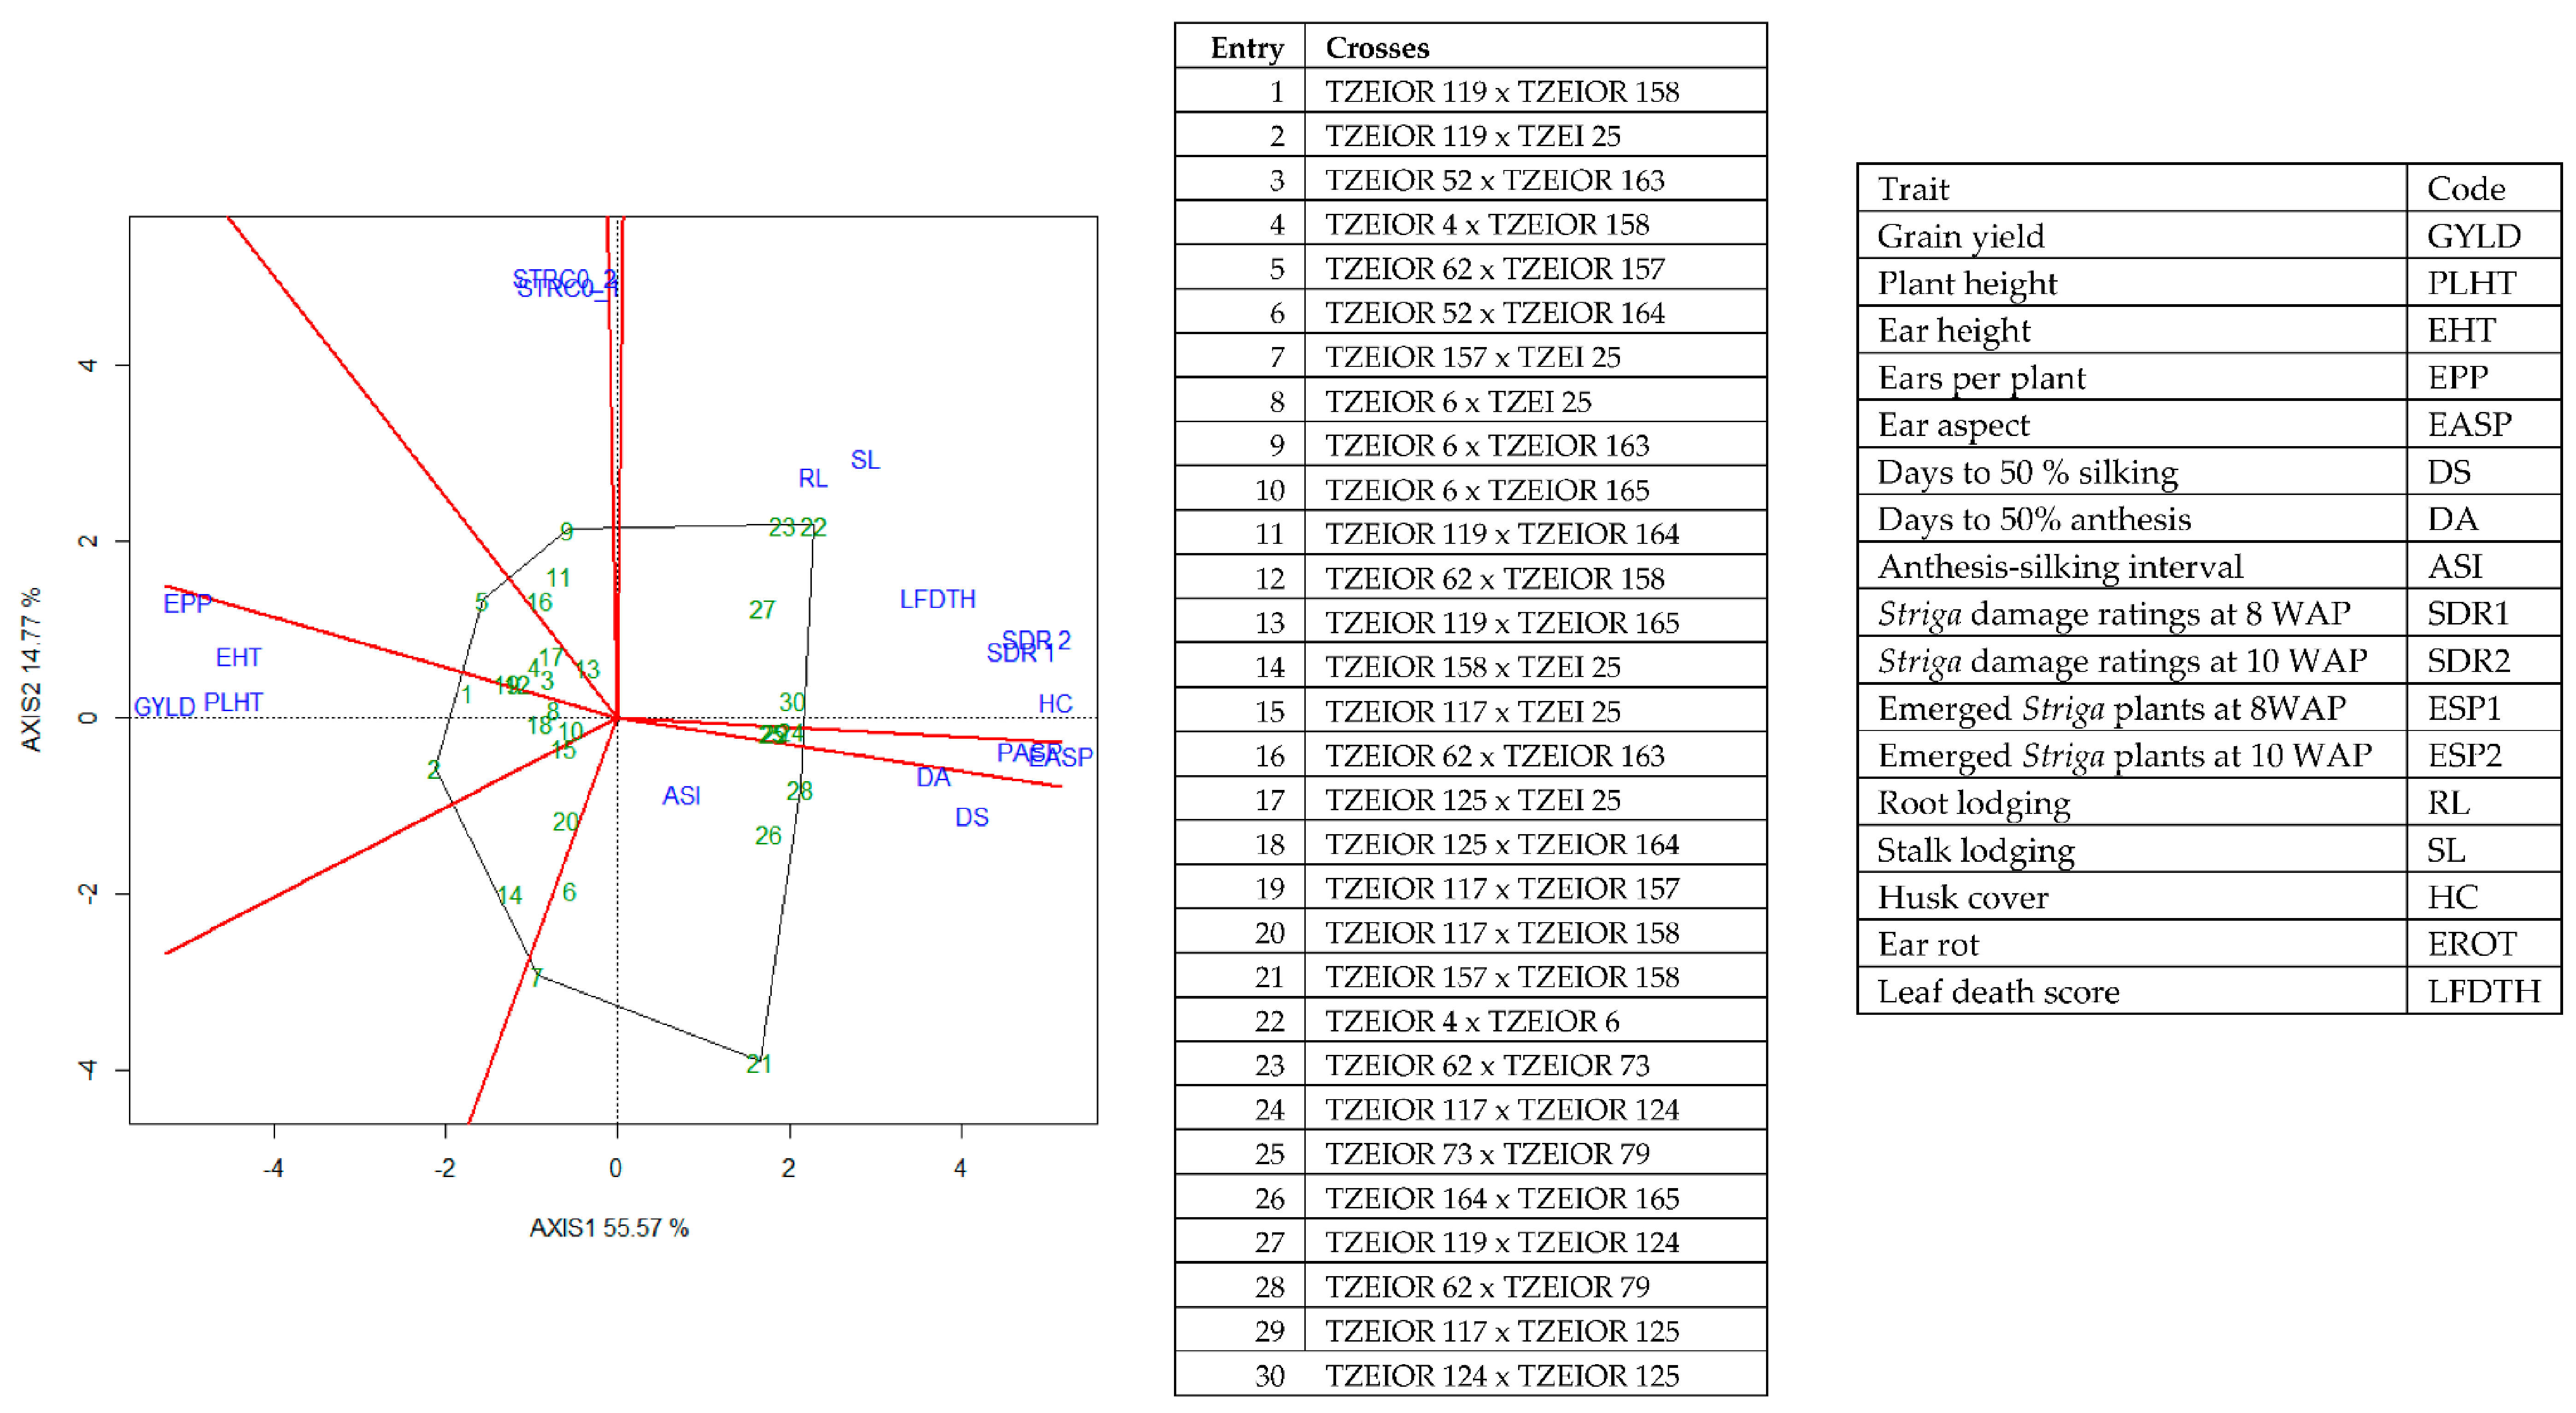
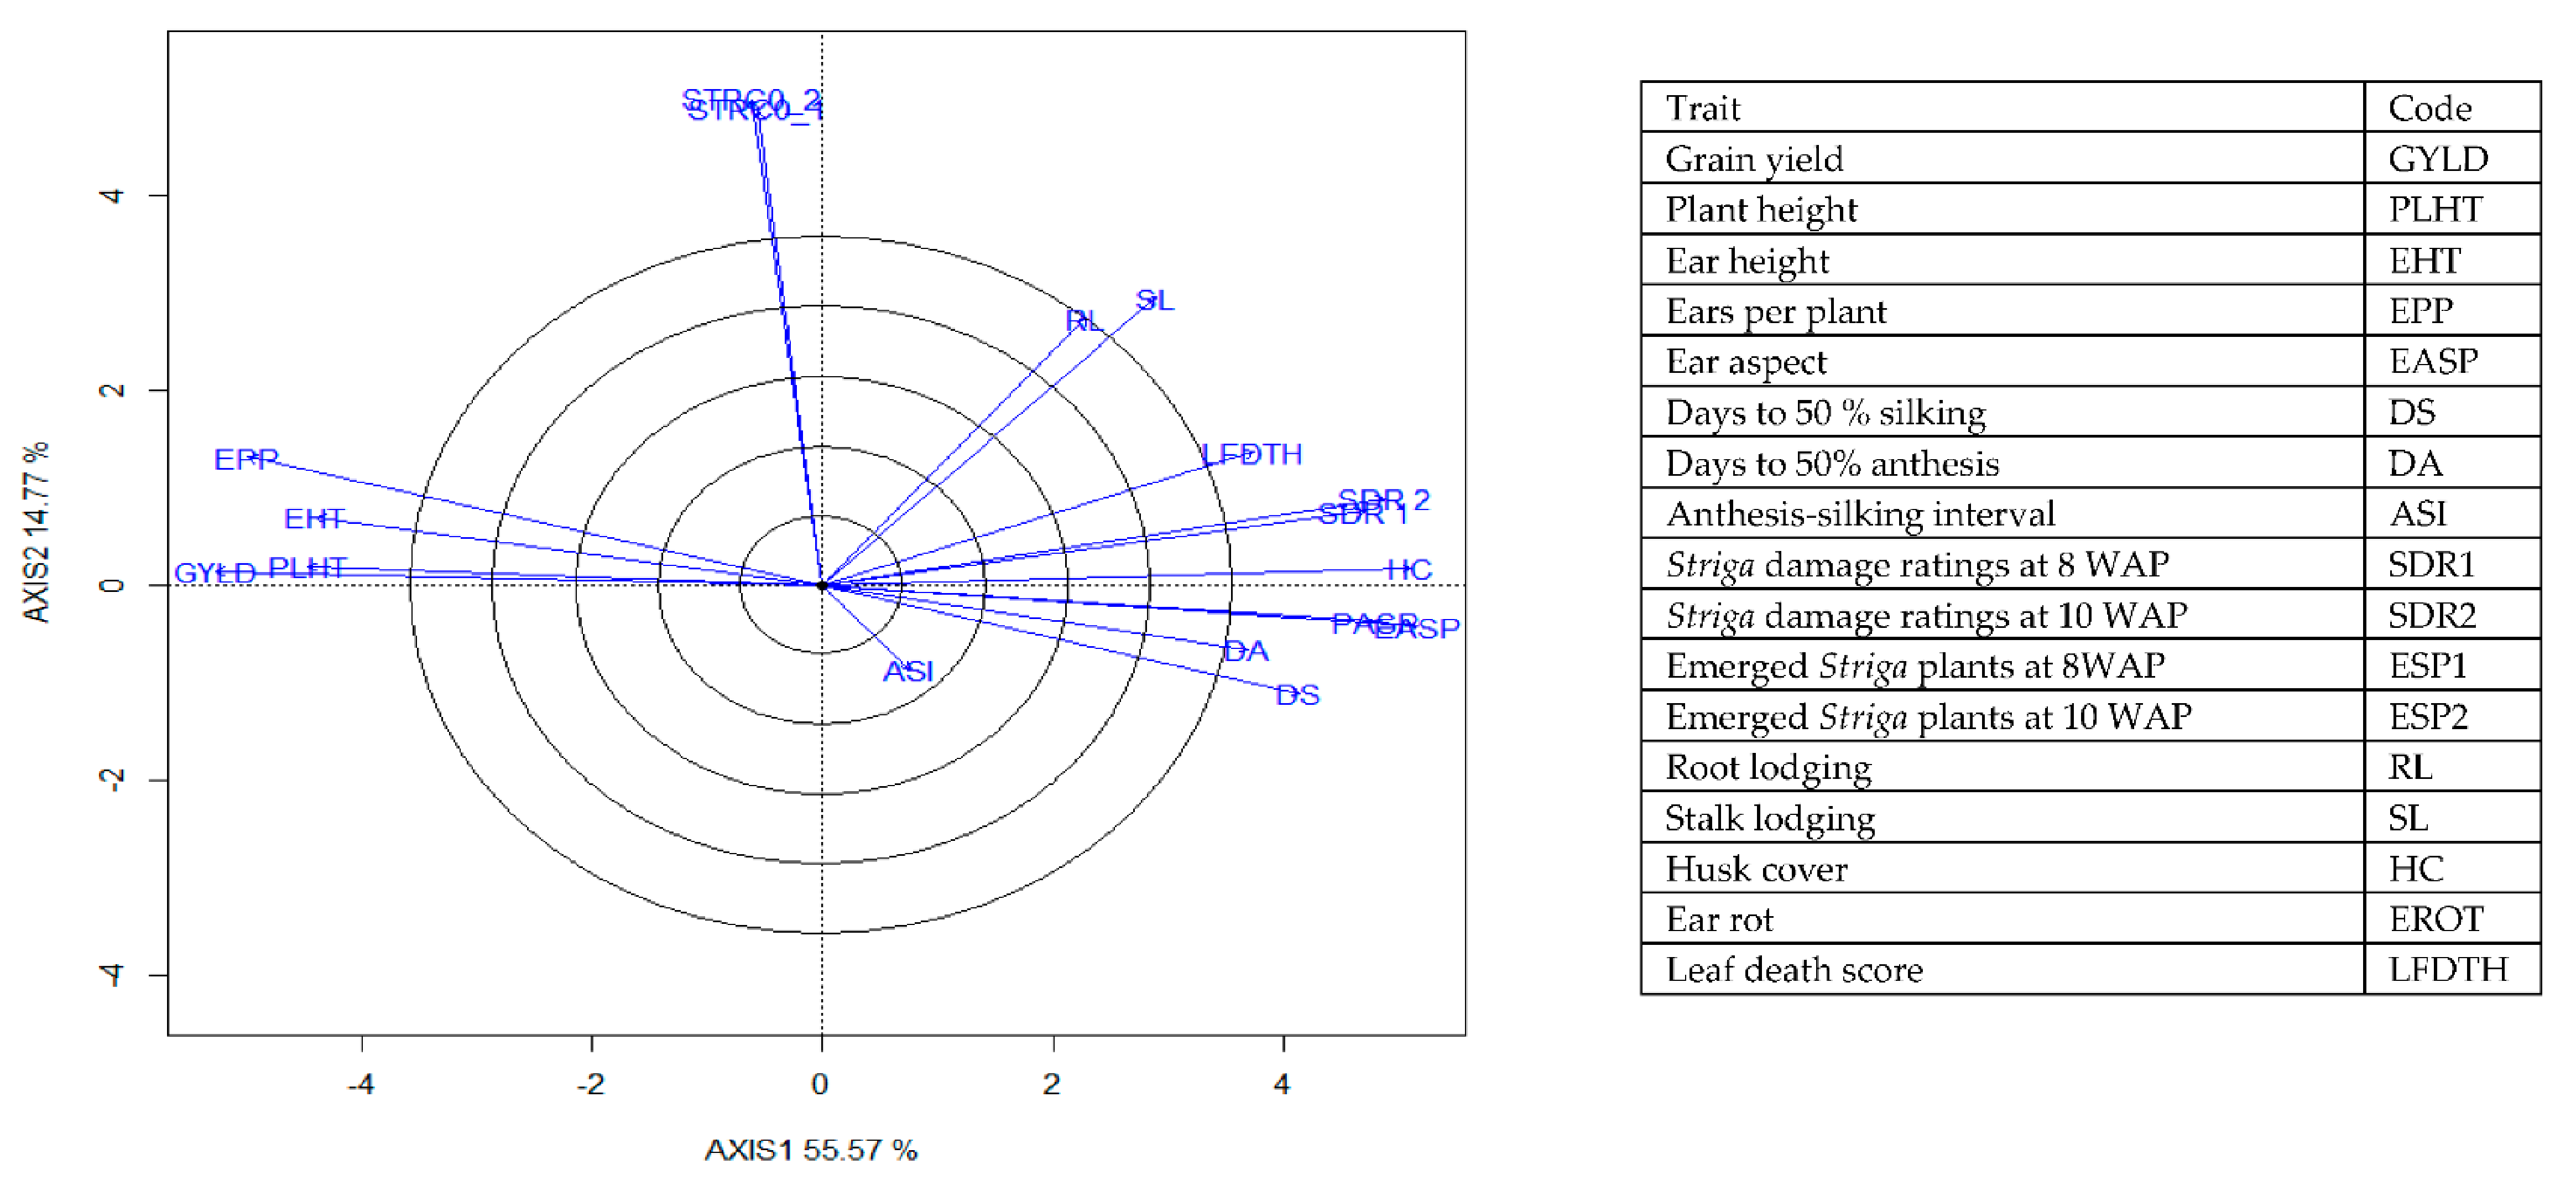
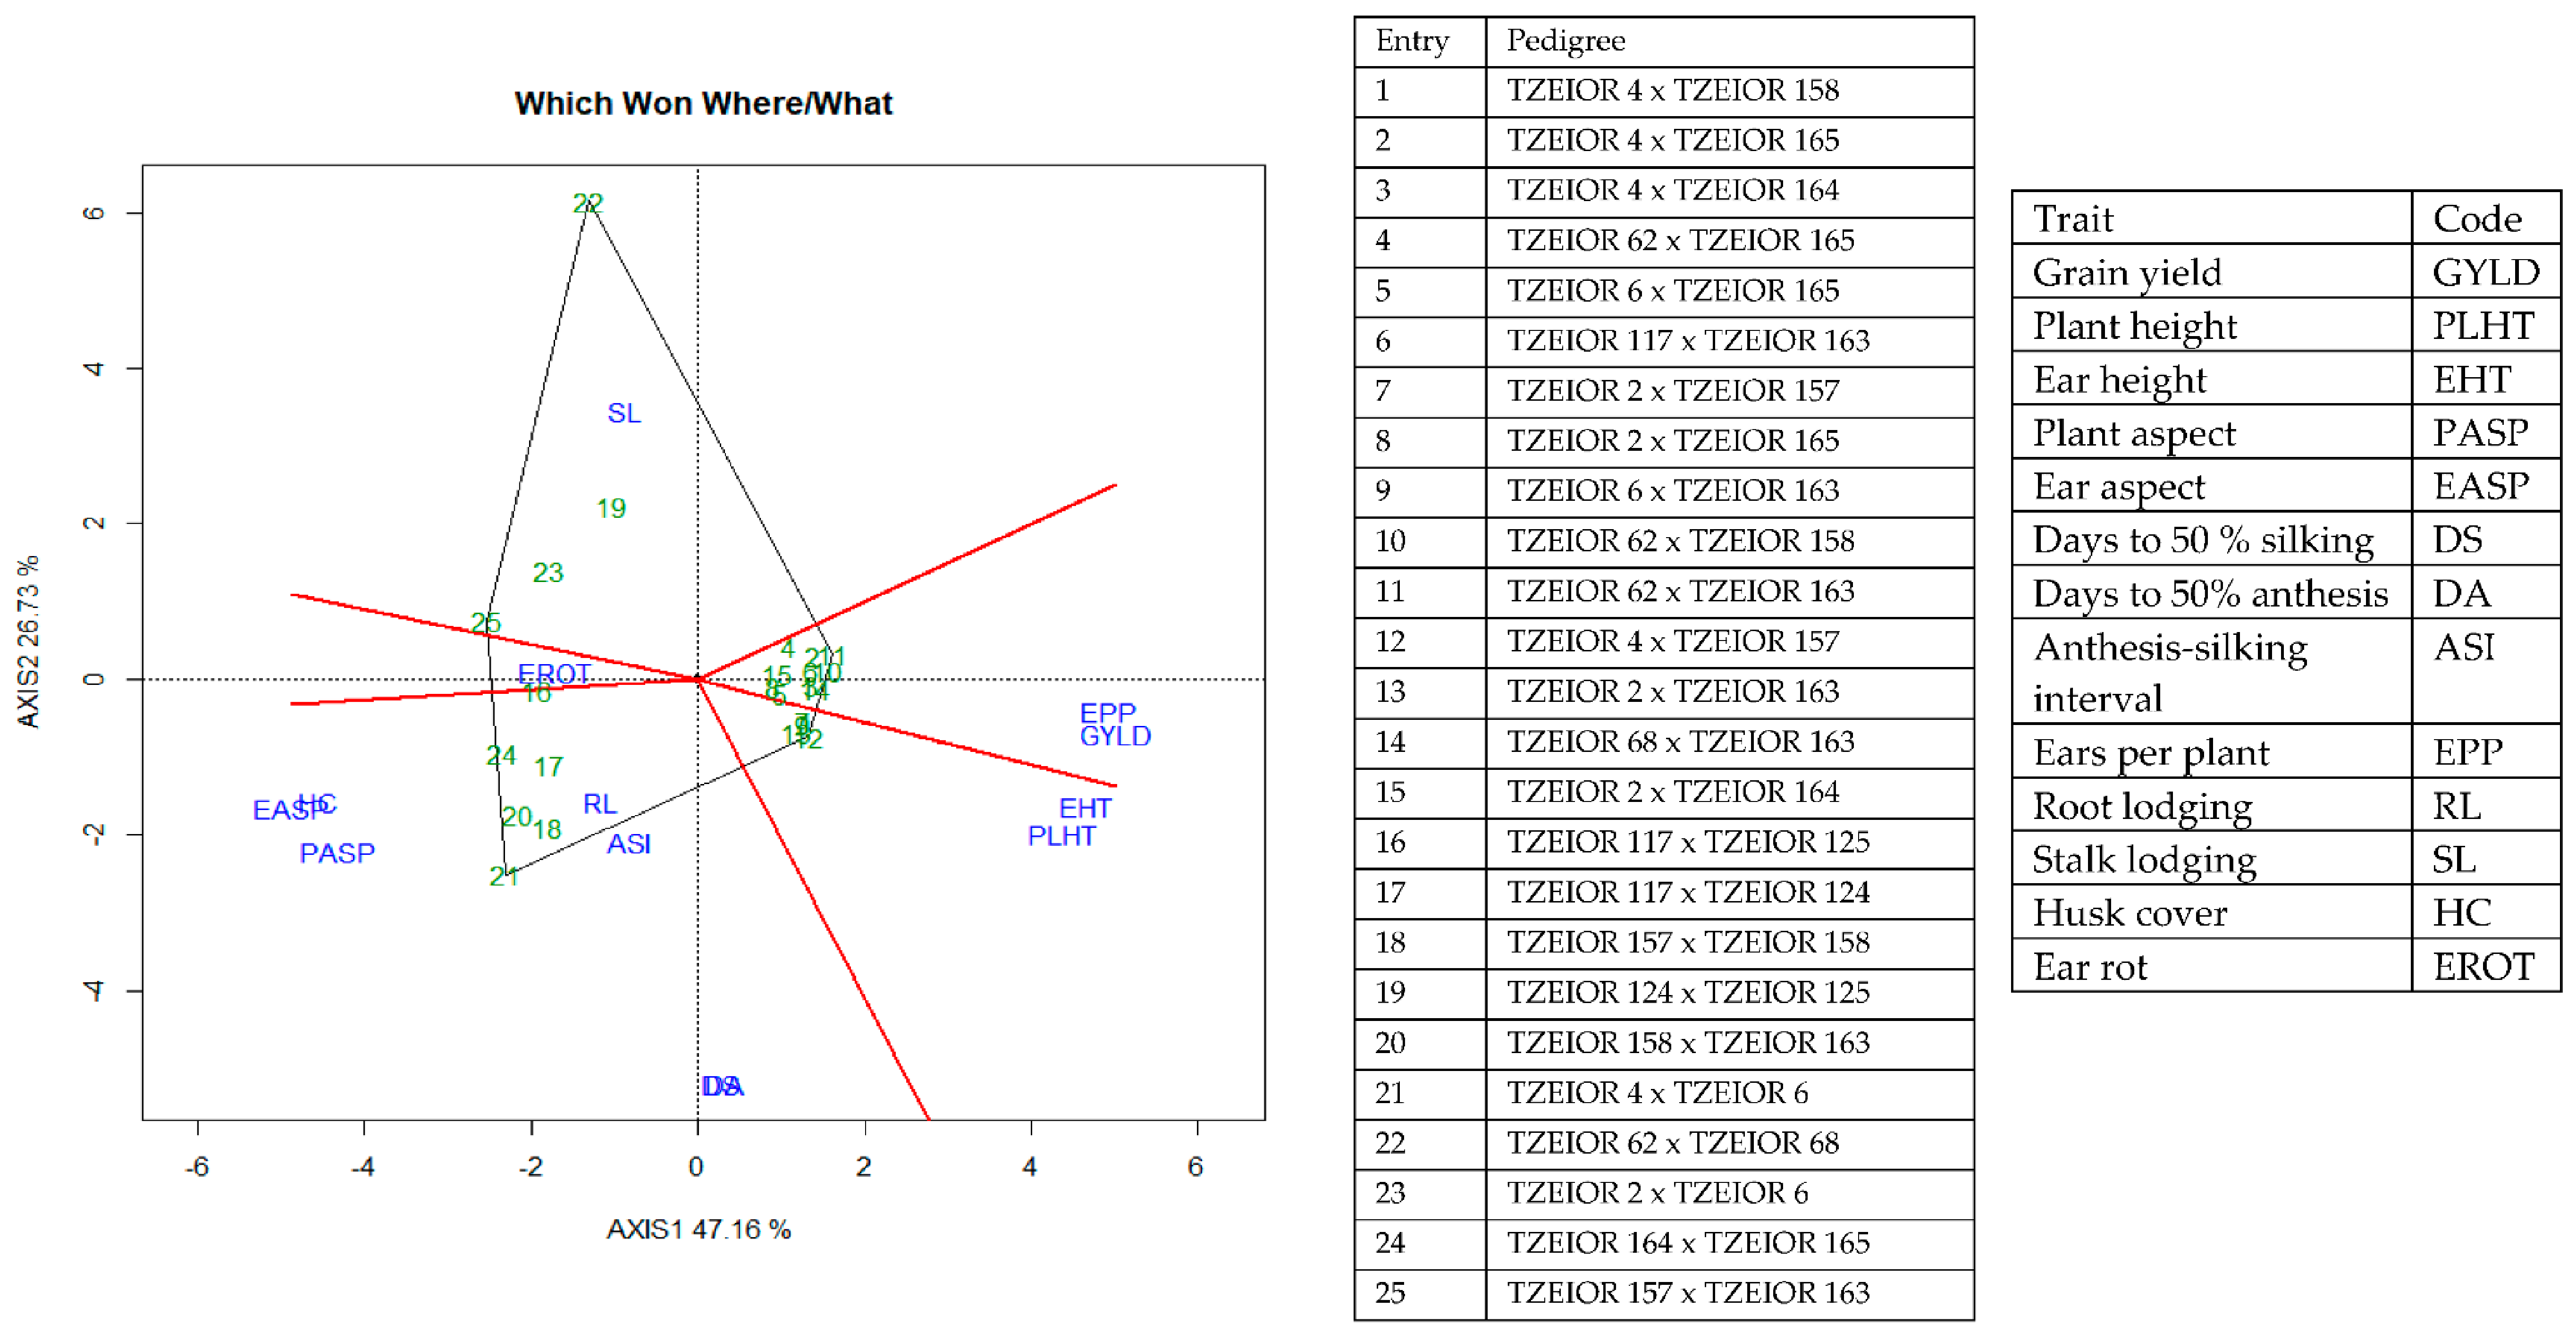
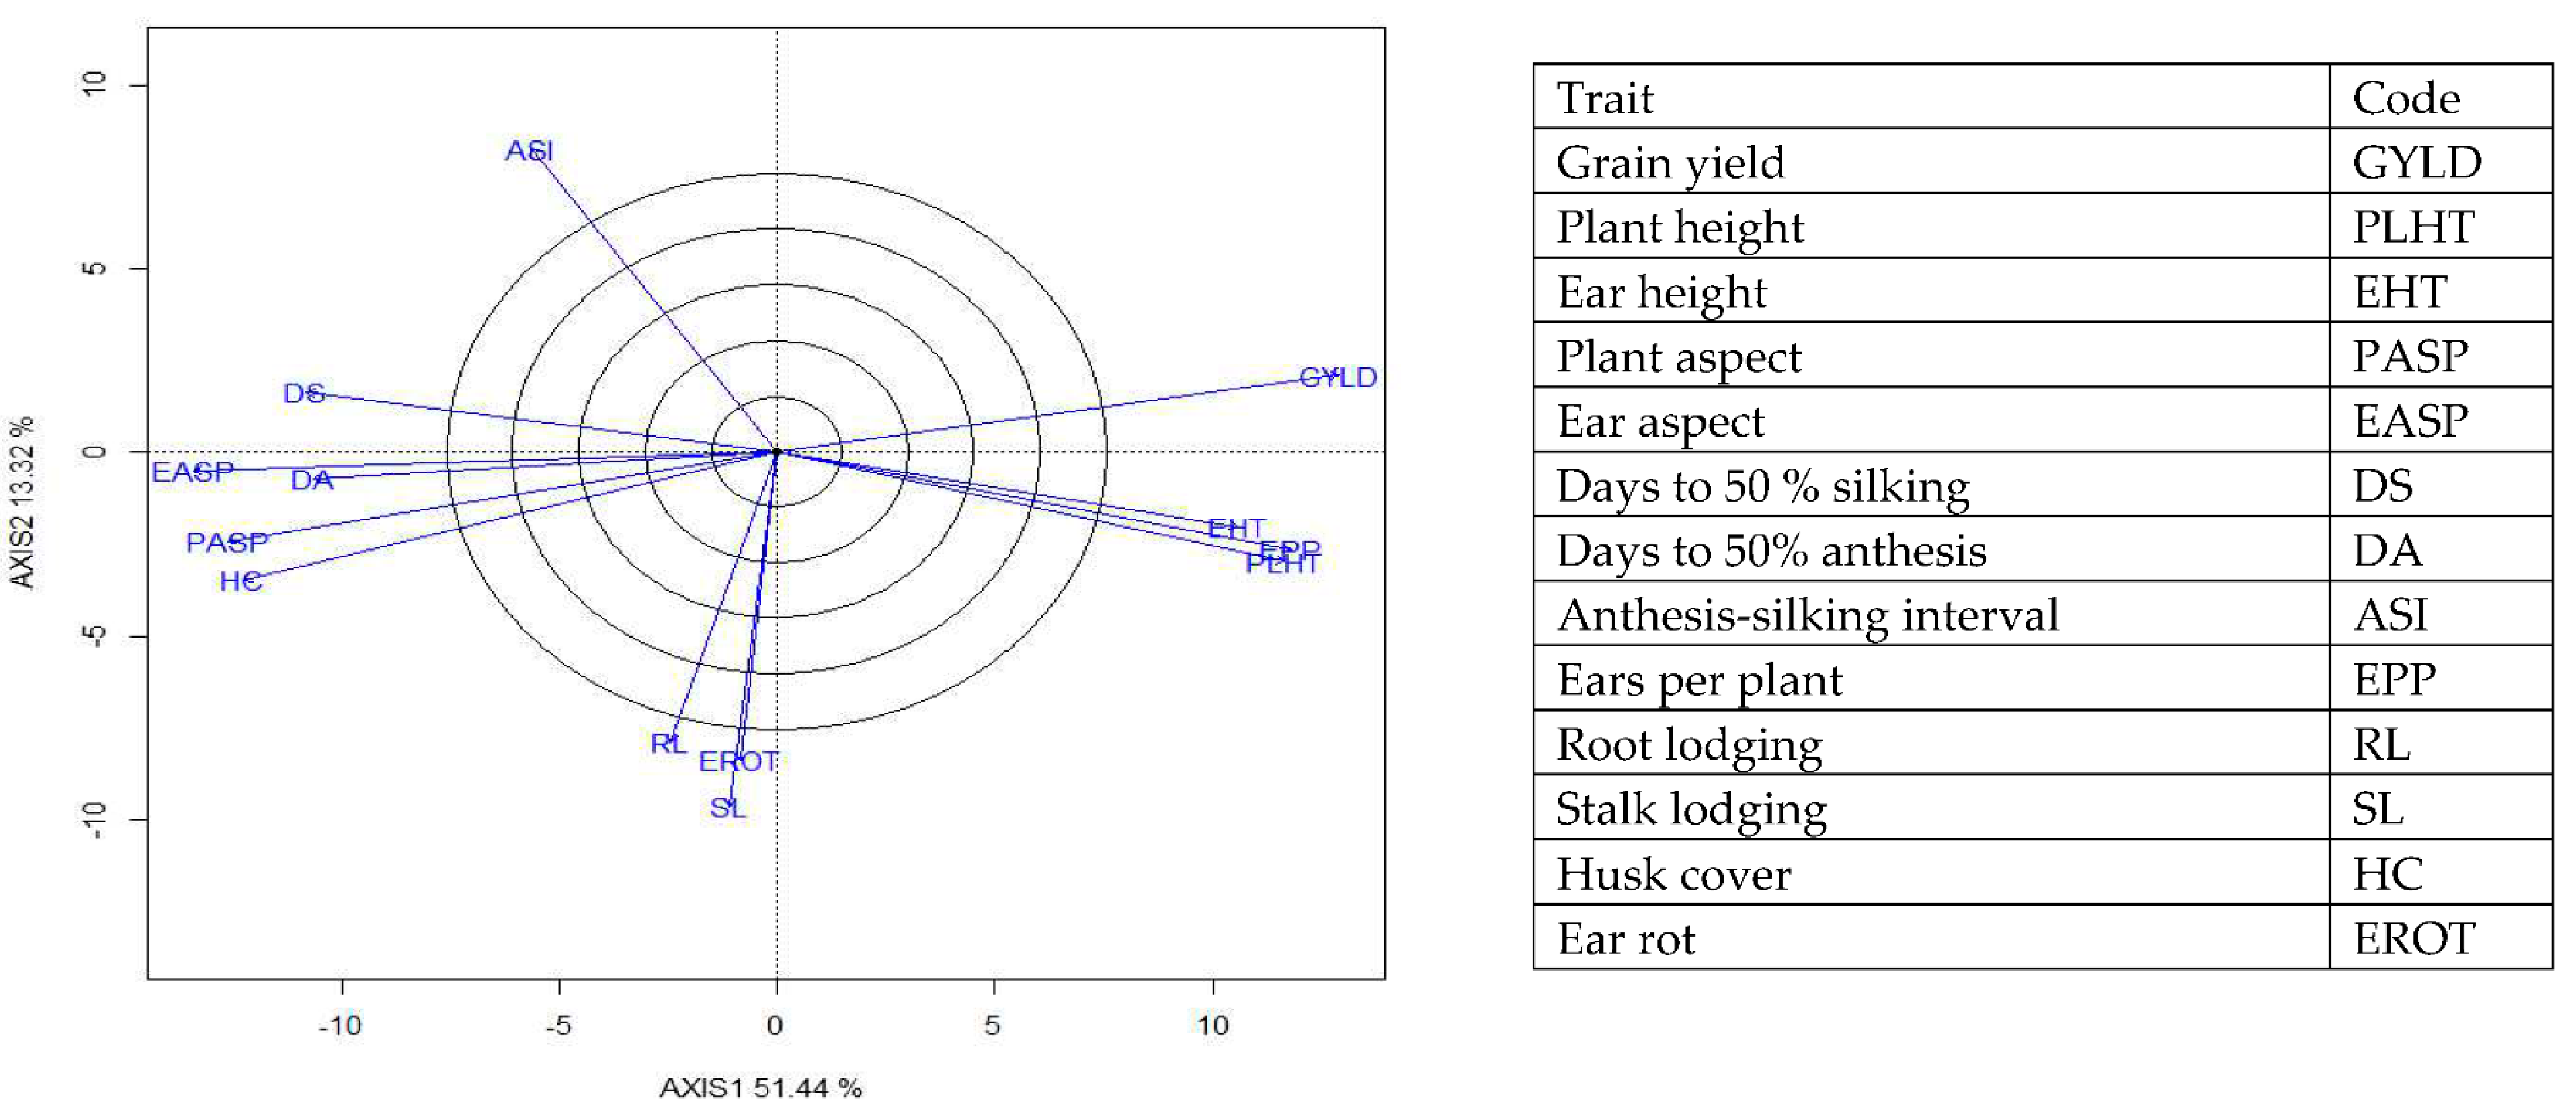
The genotype × trait (G × T) biplot (Figure 5) shows the performance of the genotypes with respect to different agronomic traits across the stress conditions. Genotypes in the same sector with traits are associated with such traits, while genotype(s) at the vertex of a sector was the best for the trait(s) in the sector and the worst for traits in the opposing sector. Result of relationship among genotypes and genotypes by trait interaction was substantiated by standardizing means of the evaluated hybrids. Under stress, the G × T biplot accounted for 70.34% of the total variation, axis 1(PC 1) = 55.57%, axis 2 (PC 2) =14.77%. Hybrid 1 (TZEIOR 119 × TZEI 158) and hybrid 2 (TZEIOR 119 × TZEIOR 25) were outstanding for grain yield, number of ears per plant, plant, and ear heights. Additionally, hybrid 9 (TZEIOR 6 × TZEIOR 163) recorded the highest number of emerged Striga plants at 8 and 10 WAP. Hybrid 22 (TZEIOR 4 × TZEIOR 6) was associated with high Striga damage at 8 and 10 WAP, stem lodging, root lodging, leaf-death score, and husk cover. The vector view of genotype by trait (GT) biplot showing the relationships among traits (Figure 6) across stress conditions explained 70.34% of the total variation among the traits of the single-cross hybrids. In the display, the line that connects the trait to the biplot origin is called a trait vector. The cosine of the angle between any two vectors measured the correlation between the traits. The biplot display revealed a high positive and significant relationship among grain yield, number of ears per plant, plant and ear heights while these traits showed a negative relationship with plant and ear aspects, Striga damage at 8 and 10WAP, husk cover and leaf-death score. However, there was weak relationship between grain yield and number of emerged Striga plants at 8 and 10 WAP. The G × T biplot under optimal growing conditions (Figure 7) explained 64.76% of the total variation with axis PC 1 = 47.16%, PC 2 = 26.73%. Hybrid 1 (TZEIOR 4 × TZEIOR 158) was the best hybrid for grain yield and number of ears per plant under optimal conditions. Hybrid 12 (TZEIOR 4 × TZEIOR 157) was associated with high ratings for plant and ear heights while hybrid 21 (TZEIOR 4 × TZEIOR 6) was associated with high plant aspect, ear aspect and husk cover. The ‘relationship among traits’ biplot under optimal conditions (Figure 8) explained 64.8% of the observed variation for the evaluated hybrids. There was positive association among grain yield, ears per plant, plant height, and ear height. These traits showed a negative relationship with plant aspect, ear aspect, husk cover, number of days to 50% flowering and number of days to 50% silking.
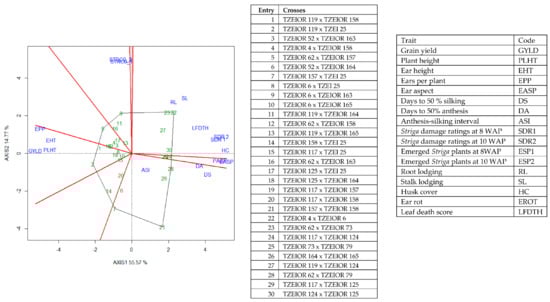
Figure 5.
A polygon view of genotype by trait showing top 20 hybrids and the least 10 hybrids among the 196 testcrosses evaluated under Striga infestation at Mokwa and Abuja, drought stress at Ikenne and low N at Mokwa and Ile-Ife, Nigeria in 2016 and 2017. The biplot was based on genotype-focused singular value partitioning (‘SVP = 2). Principal component (axis 1) and axis 2 for model 2 explained 70.34% of the variation among traits.

Figure 6.
A vector view of the genotype-by-trait biplot showing interrelationships among all traits of 196 early maturing pro-vitamin A hybrid maize evaluated under Striga infestation at Mokwa in 2016 and 2017 and at Abuja in 2017. The biplot was based on genotype-focused singular value partitioning (‘SVP = 2) and is therefore appropriate for visualizing the relationships among traits. Principal component (axis 1) and axis 2 for model 2 explained 70.34% of the variation among traits.

Figure 7.
A polygon view of genotype by trait showing top 15 hybrids and the least 10 hybrids among the 196 testcrosses evaluated under optimal conditions at Bagauda, Kadawa, Abuja, Ikenne and Mokwa, Nigeria in 2016 and 2017. The biplot was based on genotype-focused singular value partitioning (‘SVP = 2). Principal component (axis 1) and axis 2 for model 2 explained 64.76% of the variation among traits.

Figure 8.
A vector view of the genotype-by-trait biplot showing interrelationships among all traits of 190 early maturing pro-vitamin A hybrid maize evaluated under optimal conditions at Bagauda, Kadawa, Abuja, Ikenne and Mokwa, Nigeria in 2016 and 2017. The biplot was based on genotype-focused singular value partitioning (‘SVP = 2) and is therefore appropriate for visualizing the relationships among traits. Principal component (axis 1) and axis 2 for model 2 explained 64.76% of the variation among traits.
4. Discussion
The significant genotype mean squares observed for all traits measured under stress, optimal and across research conditions were indicative of the existence of high genetic variability for grain yield in the genotypes which can be exploited for accelerated genetic gains in the improvement of these traits. Also, the significant mean squares observed for the environment suggested the uniqueness of the capacity of the test environments to discriminate among the genotypes under stress and non-stress conditions. The significant GEI obtained for most measured traits in stress, non-stress and across environments revealed differential performances of the genotypes under contrasting environmental conditions, thus the need for identification and selection of outstanding and stable genotypes across environments [25,26]. Additionally, the significant GEI observed for grain yield and most other traits confirmed the importance of multi-environment testing of hybrids before recommendations for release and commercialization could be made [43]. The significant GCA × E interaction effect detected for most measured traits suggested significant differences in the combining ability of the PVA inbred lines under varying environmental conditions, suggesting the need for testing the lines in contrasting environments for identification of those with stable performance for the development of multiple stress tolerant hybrids [43].
The significant GCA and SCA mean squares obtained for grain yield and most other measured traits in the test environments indicated that both additive and non-additive gene actions were important in the inheritance of the measured traits of the PVA genotypes evaluated in the present study. Variations in the GCA mean squares of the inbred lines further suggested the availability of genetic variability among the inbreds under each environment which suggests a great potential for classifying the inbred lines into heterotic groups as well as identifying lines with high general combining abilities which could be useful as testers. Additionally, the preponderance of GCA over SCA effects for grain yield and other measured traits in both stress and non-stress environments, except for grain yield across multiple stress conditions revealed the relative importance of additive gene action to non-additive gene action in the inheritance of grain yield and other measured traits of the PVA inbred lines. This was an indication that most of the measured traits could be improved through recurrent selection methods such as the full-sib, half-sib. This result is consistent with the findings of [43]. Significant GCA for grain yield and most other traits facilitated the identification of potentially discriminating inbred testers as well as candidate parental inbreds for hybrid development. Additionally, this result indicated that most of the traits could be improved through population improvement methods such as the S1 family recurrent selection, half-sib and full-sib recurrent selection methods. Additionally, the presence of significant SCA effects indicated that the backcrossing method could be employed for hybrid formation, and development of synthetics. The significant SCA × E interaction for grain yield and most measured traits signified differential performance of the hybrids under contrasting environmental conditions, indicating the need for selection of hybrids best adapted to each environment. However, the insignificant SCA × E for number of emerged Striga plants implied consistency in hybrid performance across Striga-infested environments. The results further lend credence to the approach of evaluating hybrids under contrasting conditions to enable identification of superior hybrids for each and across research environments. The HGCAMT method used in this study classified the early PVA inbred lines into three heterotic groups, effectively placing the parental lines of high yielding hybrids into opposing heterotic groups. However, the parental inbreds of the low-yielding hybrids were not necessarily placed in the same heterotic group.
A prime objective of this study was to identify high yielding and stable PVA hybrids across stress and non-stress conditions. The present study showed that some PVA hybrids out-yield the normal endosperm hybrids under stress and non-stress conditions. The GGE biplot identified TZEIOR 4 × TZEIOR 158 as the most stable and highest yielding PVA hybrid in the present study, out yielding the PVA commercial hybrid check, TZEI 124 × TZEI 25 by 25.6% across research conditions. This implied that the PVA hybrid has the potential to replace this commercial check in the public domain. It is important to note that TZEIOR 119 × TZEIOR 158 and TZEIOR 4 × TZEIOR 165 were also high yielding and stable across research environments. Following an extensive evaluation for consistency in performance, these PVA hybrids could be commercialized to combat malnutrition and food insecurity in SSA.
An inbred parent with significant and positive GCA effects for a target trait is a good combiner for such trait and has a high probability of passing the characteristics to its progeny in a cross. Genotypes with positive and significant GCA effects for grain yield and other desirable traits could therefore be used for the development of heterotic populations as well as high yielding synthetics and hybrids ([9]. Significant and positive GCA effects were observed for the grain yield of TZEIOR 52, TZEI 25 and TZEIOR 163 under multiple stresses, while TZEIOR 4 and TZEI 129 possessed positive and significant GCA effects under optimal conditions, and TZEIOR 164 and TZEI 25 across research conditions. This indicated that these inbred lines possessed beneficial alleles for grain yield and would contribute high grain yield to their progenies under the contrasting environmental conditions. Contrarily, significant and negative GCA effects were recorded for Striga damage and number of emerged Striga plants at 8 and 10 WAP for TZEIOR 164 and TZEI 25, implying that these inbred lines are invaluable resources for Striga resistance/tolerance alleles for improving tropical maize germplasm for multiple stress tolerance.
Fan et al., [40] reported that an efficient heterotic grouping method should classify inbred lines into groups which allow inter-heterotic group crosses to display higher heterosis than intra-heterotic groups. Badu Apraku et al., [43] compared different heterotic grouping methods and concluded that HGCAMT was the best method for grouping early QPM inbreds into heterotic groups with breeding efficiency of 82%. In the present study, the HGCAMT method placed the parental lines of the high yielding PVA hybrids into opposing heterotic groups further confirming the effectiveness of the grouping method at placing parental inbred lines into heterotic groups to maximize heterosis from planned crosses. Despite the effectiveness of the HGCAMT method in classifying the inbred lines into heterotic groups in the present study, it would be desirable to use molecular markers and genomic selection to confirm the heterotic groupings of the 20 early inbred lines.
Information on inter-trait relationships among grain yield and other agronomic traits will enhance the efficiency of breeding programs using appropriate traits as selection criteria under stress and non-stress conditions [17]. The results of the G × T biplot analysis under multiple stresses revealed that ASI had a short trait vector implying that it is not important in evaluating early maturing maize genotypes for stress tolerance. The small acute angle observed between grain yield and ears per plant as well as plant and ear heights indicated the existence of significant positive correlations between grain yield and these traits suggesting that they could serve as important selection criteria for improved grain yield across multiple stresses. Additionally, days to anthesis and silking, husk cover, Striga damage at 8 and 10 WAP and the stay green characteristic which had angles near 1800 were negatively correlated with yield, an indication that these traits had direct or indirect effects on yield across stress environments. This result is consistent with the findings of [38,44,45]. The significant and positive correlations between grain yield and ears per plant, ear and plant heights implied that selection for improvement in these traits under optimal growing conditions will result in improved grain yield. Also, the significant negative correlation between grain yield and plant aspect, ear aspect, days to silking, and anthesis as well as husk cover in non-stress environments are indications that these traits are reliable selection indices for yield improvement in optimal conditions. TZEIOR 119 × TZEIOR 158 and TZEIOR 4 × TZEIOR 158 identified as high yielding and stable hybrids by both GGE and the G × T biplot analyses should be further tested for consistency in performance and released for commercialization to combat malnutrition and food insecurity in SSA.
5. Conclusions
The significant mean squares obtained for genotypes for grain yield and other measured traits confirmed the availability of genetic variability for multiple stress tolerance among the early maturing maize. The significant GCA and SCA mean squares observed in the present study implied that both additive and non-additive gene actions modulated the inheritance of grain yield and other measured traits across the multiple stresses and optimal management conditions, however, additive gene action was more important. TZEI 25 and TZEIOR 164 were identified as inbred testers for groups 2 and 3, respectively. Plant and ear heights, ears per plant, plant and ear aspects were identified as invaluable selection criteria for yield improvement in both stress and non-stress management conditions. TZEIOR 4 × TZEIOR 158 and TZEIOR 119 × TZEIOR 158 were outstanding in terms of grain yield and stability and should be extensively tested and commercialized to combat malnutrition and food insecurity in SSA.
Supplementary Materials
The following are available online at https://www.mdpi.com/article/10.3390/agronomy11071371/s1, Table S1: Mean squares showing grain yield and other agronomic traits of 196 early maturing pro-vitamin A hybrids evaluated under Striga Infestation both in 2016 and 2017 in Nigeria, Table S2: Mean squares showing grain yield and other agronomic traits of 196 early maturing pro-vitamin A hybrids evaluated under Optimal conditions both in 2016 and 2017 in Nigeria.
Author Contributions
Conceptualization, B.B.-A. and J.T; Methodology, B.B.-A. and J.T., Formal analysis, J.T. and O.O; Investigation, B.B.-A.; resources, B.B.-A.; Data curation, O.O and J.T.; Writing—original draft preparation, B.B.-A., J.T and O.O.; Writing—review and editing, B.B.-A., O.O., O.B.O. and J.T.; Project administration, B.B.-A.; Funding acquisition, B.B.-A. All authors have read and agreed to the published version of the manuscript.
Funding
This work was funded by the Bill and Melinda Gates Foundation [OPP1134248]. The authors are also grateful for the funding support for this research as well as the technical assistance from the staff of the IITA Maize Improvement Unit.
Institutional Review Board Statement
Not Applicable.
Informed Consent Statement
Not Applicable.
Data Availability Statement
The datasets used in the present study are available at the IITA CKAN repository.
Conflicts of Interest
The authors declare no conflict of interest.
References
- Shiferaw, B.; Prasanna, B.; Hellin, J.; Banziger, M. Feeding a hungry world: Past successes and future challenges to global food security in maize. Food Secur. 2011, 3, 307–327. [Google Scholar] [CrossRef] [Green Version]
- Rosegrant, M.W.; Msangi, S.; Ringler, C.; Sulser, T.B.; Zhu, T.; Cline, S.A. Model for Policy Analysis of Agricultural Commodities and Trade (IMPACT): Model Description; International Food Policy Research Institute: Washington, DC, USA, 2008. [Google Scholar]
- Tester, M.; Langridge, P. Breeding technologies to increase crop production in a changing world. Science 2008, 327, 818–822. [Google Scholar] [CrossRef]
- WHO. Global Prevalence of Vitamin A Deficiency in Populations at Risk 1995–2005. In WHO Global Database on Vitamin A Deficiency; World Health Organization: Geneva, Switzerland, 2009; pp. 1–55. [Google Scholar]
- Daryanto, S.; Wang, L.; Jacinthe, P. Global synthesis of drought effect on maize and wheat. PLoS ONE 2016, 11, e0156362. [Google Scholar] [CrossRef]
- Anami, S.; De Block, M.; Machuka, J.; Van Lijsebettens, M. Molecular improvement of tropical maize for drought stress tolerance in sub-Saharan Africa. Crit. Rev. Plant Sci. 2009, 28, 16–35. [Google Scholar] [CrossRef]
- Badu-Apraku, B.; Menkir, A.; Ajala, S.O.; Akinwale, R.O.; Oyekunle, M.; Obeng-Antwi, K. Performance of tropical early-maturing maize cultivars in multiple stress environments. Can. J. Plant Sci. 2010, 90, 1–22. [Google Scholar] [CrossRef] [Green Version]
- Badu-Apraku, B.; Lum, A.F. Agronomic performance of Striga resistant early-maturing maize varieties and inbred lines in the savannas of West and Central Africa. Crop Sci. 2007, 47, 737–750. [Google Scholar] [CrossRef]
- Akinwale, R.O.; Badu-Apraku, B.; Fakorede, M.A.B.; Vroh-Bi, I. Heterotic grouping of tropical early-maturing maize inbred lines based on combining ability in Striga-infested and Striga-free environments and the use of SSR markers for genotyping. Field Crop. Res. 2014, 156, 48–62. [Google Scholar] [CrossRef]
- Lagoke, S.T.O.; Parkinson, V.; Agunbiade, R.M. Parasitic weeds and control methods in Africa. In Proceedings of the International Workshop on Combating Striga in Africa, IITA, Ibadan, Nigeria, 22–24 August 1988; pp. 3–14. [Google Scholar]
- Kim, S.K. Genetics of maize tolerance of Striga hermonthica. Crop Sci. 1994, 34, 900–907. [Google Scholar] [CrossRef]
- Badu-Apraku, B.; Fakorede, M.A.B.; Lum, A.F. Evaluation of experimental varieties from recurrent selection for Striga resistance in two extra-early maize populations in the savannas of West and Central Africa. Exp. Agric. 2006, 43, 183–200. [Google Scholar] [CrossRef]
- Kim, S.K. Breeding maize for Striga tolerance and the development of a field infestation technique. In Combating Striga in Africa, Proceedings of the International Workshop Organized by IITA, ICRISAT, and IDRC, IITA, Ibadan, Nigeria, 22–24 August 1988; Kim, S.K., Ed.; pp. 96–108.
- Badu-Apraku, B.; Fakorede, M.A.B.; Menkir, A.; Kamara, A.Y.; Adam, A. Effects of drought-screening methodology on genetic variances and covariances in Pool 16 DT maize population. J. Agric. Sci. 2004, 142, 445–452. [Google Scholar] [CrossRef]
- Cechin, I.; Press, M.C. The influence of nitrogen on growth and photosynthesis of sorghum infected with Striga hermonthica from different provenances. Weed Res. 1993, 3, 289–298. [Google Scholar] [CrossRef]
- Kim, S.K.; Adetimirin, V.O. Responses of tolerant and susceptible maize varieties to timing and rate of nitrogen under Striga hermonthica infestation. Agron. J. 1997, 89, 38–44. [Google Scholar] [CrossRef]
- Banzigar, M.; Lafitte, H.R. Efficiency of secondary traits for improving maize for low-Nitrogen target environments. Crop Sci. 1997, 37, 1110–1117. [Google Scholar] [CrossRef]
- Wolfe, D.W.; Henderson, D.C.; Hsiao, T.C.; Alvio, A. Interactive water and nitrogen effects on maize. II. Photosynthetic decline and longevity of individual leaves. Agron. J. 1988, 80, 865–870. [Google Scholar] [CrossRef]
- Nigussie, M.; Zelleke, H. Heterosis and combining ability in a diallel among eight elite maize populations. Afr. Crop Sci. J. 2001, 9, 471–479. [Google Scholar] [CrossRef]
- Zeinab, G.E.; Helal, A.G. Diallel analysis and separation of genetic variance components in eight faba bean genotypes. Ann. Agric. Sci. 2014, 59, 147–154. [Google Scholar] [CrossRef] [Green Version]
- Beck, D.L.; Vasal, S.K.; Crossa, J. Heterosis and combining ability among subtropical and temperate intermediate maturity maize germplasm. Crop Sci. 1991, 31, 68–73. [Google Scholar] [CrossRef]
- Bhatnagar, S.; Betrán, F.J.; Rooney, L.W. Combining abilities of quality protein maize inbreds. Crop Sci. 2004, 44, 1997–2005. [Google Scholar] [CrossRef] [Green Version]
- Menkir, A.; Badu-Apraku, B.; The, C.; Adepoju, A. Evaluation of heterotic patterns of IITA lowland white maize inbred lines. Maydica 2003, 48, 161–170. [Google Scholar]
- Gethi, J.G.; Smith, M.E. Genetic responses of single crosses of maize to Striga hermonthica (Del.) Benth. and Striga asiatica (L.) kuntze. Crop Sci. 2004, 44, 2068–2077. [Google Scholar] [CrossRef]
- Badu-Apraku, B.; Abamu, F.J.; Menkir, A.; Fakorede, M.A.B.; Obeng-Antwi, K. Genotype by environment interactions in the regional early variety trials in West and Central Africa. Maydica 2003, 48, 93–104. [Google Scholar]
- Moghaddam, M.; Pourdad, S. Comparison of Parametric and Non-parametric Methods for Analysing Genotype × Environment Interactions in Safflower (Carthamus tinctorius L.). J. Agric. Sci. 2009, 147, 601. [Google Scholar] [CrossRef]
- FAO. World Reference Base for Soil Resources: A Framework for International Classification, Correlation and Communication; FAO: Rome, Italy, 2006; p. 103. [Google Scholar]
- Kim, S.K.; Winslow, M.D. Progress in Breeding Maize for Striga-Tolerance/Resistance at IITA. In Proceedings of the 5th International Symposium Parasitic Weeds, Nairobi, IITA, Ibadan, Nigeria, 24–30 June 1991; Ransom, J.K., Ed.; pp. 494–499. [Google Scholar]
- Bremner, J.M.; Mulvaney, C.S. Nitrogen-total. In Methods of Soil Analysis. Part 2, 2nd ed.; Page, A.L., Ed.; Agronomy Monographs Book Series; ASA and SSSA: Madison, WI, USA, 1982; pp. 595–624. [Google Scholar]
- Suwarno, W.B.; Pixley, K.V.; Palacios-Rojas, N.; Kaeppler, S.M.; Babu, R. Genome-wide association analysis reveals new targets for carotenoid biofortification in maize. Theor. Appl. Genet 2015, 128, 851–864. [Google Scholar] [CrossRef] [Green Version]
- Azmach, G.; Gedil, M.; Menkir, A.; Spillane, C. Marker-trait association analysis of functional gene markers for provitamin A levels across diverse tropical yellow maize inbred lines. BMC Plant Biol. 2013, 13, 227. [Google Scholar]
- Howe, J.A.; Tanumihardjo, S.A. Evaluation of analytical methods for carotenoid extraction from biofortified maize (Zea mays sp). J. Agric. Food Chem. 2006, 54, 7992–7997. [Google Scholar] [CrossRef] [PubMed]
- US Institute of Medicine. Dietary Reference Intakes for Vitamin A, Vitamin K, Arsenic, Boron, Chromium, Copper, Iodine, Iron, Manganese, Molybdenum, Nickel, Silicon, Vanadium, and Zinc; The National Academies Press: Washington, DC, USA, 2001. [Google Scholar]
- SAS Institute Inc. Base SAS®9. 3 Procedures Guide; SAS Institute Inc.: Cary, NC, USA, 2011. [Google Scholar]
- Griffing, B. Concept of general and specific combining ability in relation to diallel crossing systems. Aust. J. Biol. Sci. 1956, 9, 463–493. [Google Scholar] [CrossRef]
- Zhang, Y.; Kang, M.; Lamkey, K. DIALLEL-SAS05: A comprehensive program for griffing’s and Gardner-Eberhart analyses. Agron. J. 2005, 97, 1097–1106. [Google Scholar] [CrossRef]
- Baker, R.J. Issues in diallel analysis. Crop Sci. 1978, 18, 533–536. [Google Scholar] [CrossRef]
- Hung, H.Y.; Holland, J.B. Diallel analysis of resistance to fusarium ear rot and fumonium contamination in maize. Crop Sci. 2012, 52, 2173–2181. [Google Scholar] [CrossRef] [Green Version]
- Badu-Apraku, B.; Oyekunle, M.; Fakorede, M.A.B.; Vroh, I.; Akinwale, R.O.; Aderounmu, M. Combining ability, heterotic patterns and genetic diversity of extra-early yellow inbreds under contrasting environments. Euphytica 2013, 192, 413–433. [Google Scholar] [CrossRef]
- Fan, X.M.; Zhang, Y.M.; Yao, W.H.; Chen, H.M.; Tan, J.; Xu, C.X.; Han, X.L.; Luo, L.M.; Kang, M.S. Classifying maize inbred lines into heterotic groups using a factorial mating design. Agron. J. 2009, 101, 106–112. [Google Scholar] [CrossRef]
- Pacheco, A.; Vargas, M.; Alvarado, G.; Rodríguez, F.; Crossa, J.; Burgueño, J. GEA-R (Genotype × Environment Analysis with R for Windows). Version 2.0. CIMMYT. Available online: http://hdl.handle.net/11529/10203 (accessed on 20 June 2016).
- Badu-Apraku, B.; Fakorede, M.A.B.; Oyekunle, M.; Akinwale, R.O. Selection of extra-early maize inbreds under low N and drought at flowering and grain-filling for hybrid production. Maydica 2011, 56, 1721–1735. [Google Scholar]
- Badu-Apraku, B.; Annor, B.; Oyekunle, M.; Akinwale, R.O.; Fakorede, M.A.B.; Talabi, A.O.; Akaogu, I.C.; Melaku, G.; Fasanmade, Y. Grouping of early maturing quality protein maize inbreds based on SNP markers and combining ability under multiple environments. Field Crop. Res. 2015, 183, 169–183. [Google Scholar] [CrossRef] [Green Version]
- Badu-Apraku, B.; Oyekunle, M. Genetic analysis of grain yield and other traits of extra-early yellow maize inbreds and hybrid performance under contrasting environments. Field Crop. Res. 2012, 129, 99–110. [Google Scholar] [CrossRef]
- Oyekunle, M.; Badu-Apraku, B. Assessment of interrelationships among grain yield and secondary traits of early-maturing maize inbred lines under drought and well-watered conditions. Maydica 2018, 63, 1–10. [Google Scholar]

Publisher’s Note: MDPI stays neutral with regard to jurisdictional claims in published maps and institutional affiliations. |
© 2021 by the authors. Licensee MDPI, Basel, Switzerland. This article is an open access article distributed under the terms and conditions of the Creative Commons Attribution (CC BY) license (https://creativecommons.org/licenses/by/4.0/).