Article

Combining Ability and Gene Action Controlling Grain Yield and Its Related Traits in Bread Wheat under Heat Stress and Normal Conditions

1
Department of Agronomy, Faculty of Agriculture, Kafrelsheikh University, Kafr El-Sheikh 33516, Egypt
2
Agronomy Department, Faculty of Agriculture, New Valley University, El-Kharga 72511, Egypt
3
Agronomy Department, Faculty of Agriculture, Zagazig University, Zagazig 44519, Egypt
4
Agricultural Research Center, Soils, Water and Environment Research Institute, Giza 12112, Egypt
5
Biology Department, College of Science, Jouf University, Sakaka 41412, Saudi Arabia
6
Department of Plant Production (Genetic Branch), Faculty of Environmental Agricultural Sciences, Arish University, El-Arish 45511, Egypt
7
Department of Plant Production and Protection, College of Agriculture and Veterinary Medicine, Qassim University, Burydah 51452, Saudi Arabia
8
Department of Crop Science, College of Agriculture, Alexandria University, Alexandria 21545, Egypt
9
Department of Genetics, Faculty of Agriculture, Kafrelsheikh University, Kafr El-Sheikh 33516, Egypt
*
Author to whom correspondence should be addressed.
Agronomy 2021, 11(8), 1450; https://doi.org/10.3390/agronomy11081450
Submission received: 27 May 2021 / Revised: 5 July 2021 / Accepted: 17 July 2021 / Published: 21 July 2021

Abstract

:
High temperature is a major environmental stress that devastatingly affects wheat production. Thenceforth, developing heat-tolerant and high-yielding wheat genotypes has become more critical to sustaining wheat production particularly under abrupt climate change and fast-growing global population. The present study aimed to evaluate parental genotypes and their cross combinations under normal and heat stress conditions, exploring their diversity based on dehydration-responsive element-binding 2 gene (DREB, stress tolerance gene in response to abiotic stress) in parental genotypes, and determining gene action controlling yield traits through half-diallel analysis. Six diverse bread wheat genotypes (local and exotic) and their 15 F1 hybrids were evaluated at two different locations under timely and late sowing dates. Sowing date, location, genotype, and their interactions significantly impacted the studied traits; days to heading, chlorophyll content, plant height, grain yield, and its attributes. Cluster analysis classified the parents and their crosses into four groups varying from heat-tolerant to heat-sensitive based on heat tolerance indices. The parental genotypes P2 and P4 were identified as an excellent source of beneficial alleles for earliness and high yielding under heat stress. This was corroborated by DNA sequence analysis of DREB transcription factors. They were the highest homologies for dehydrin gene sequence with heat-tolerant wheat species. The hybrid combinations of P1 × P5, P1 × P6, P2 × P4, and P3 × P5 were detected to be good specific combiners for grain yield and its attributes under heat stress conditions. These designated genotypes could be used in wheat breeding for developing heat-tolerant and climate-resilient cultivars. The non-additive genetic variances were preponderant over additive genetic variances for grain yield and most traits under both sowing dates. The narrow-sense heritability ranged from low to moderate for most traits. Strong positive associations were detected between grain yield and each of chlorophyll content, plant height, number of grains/spike, and thousand-grain weights, which suggest their importance for indirect selection under heat stress, especially in early generations, due to the effortlessness of their measurement.

1. Introduction

Wheat (Triticum aestivum L.) is a widespread staple food crop [1]. It provides approximately 55% of carbohydrates, 21% of protein, and 19% of calories that are required daily for humans [2,3]. Furthermore, wheat straw is considered a significant component of animal feed. Globally, wheat is grown on about 216 million hectares and produced 766 million tons [1]. However, this large production is facing serious obstacles not only by the rising population, which is expected to reach more than 9 billion by 2090, but also by climate changes [4]. On the other hand, climate change poses tremendous constraints to wheat production [5,6,7]. By the end of the century, mean surface temperatures are expected to increase by 1.5 to 6 or more as suggested by the models of climate change [8]. High temperature has serious consequences on wheat yields, which are predicted to decrease by 6% for each 1 °C increase in temperature [9,10]. Wheat plants are considered sensitive to heat during the growth period, however, the anthesis and grain-filling periods are considered the most sensitive phases to heat stress [11]. High temperature shortens the anthesis period and promotes anther sterility resulting in fewer grains per spike [12,13,14]. Furthermore, high-temperature exposure after anthesis declines grain filling rate and duration, which reduces grain size and weight, hence reduces grain yield [15,16,17,18]. Additionally, heat stress restricts the life cycle and decreases plant height, chlorophyll content, spike length, yield attributes which eventually decline grain yield [19,20,21,22]. Consequently, developing heat-tolerant genotypes has become urgent to sustain wheat production particularly under abrupt climate change and fast-growing global population.
The successful breeding program for developing heat-tolerant and high-yielding genotypes requires screening available materials to identify suitable sources of heat tolerance [23,24]. Moreover, understanding the inheritance nature and heritability of important agronomic traits under heat stress assist wheat breeders to apply suitable breeding strategies [25]. The diallel mating design is a powerful biometric approach to assess general (GCA) and specific (SCA) combining ability effects and determine the gene action involved in various characteristics [26]. GCA and SCA are efficacious tools to identify the best parents and their cross combinations for generating superior progenies in breeding for heat tolerance [27]. In this context, Riaz et al. [20], Farooq et al. [22], Celliers et al. [28], Sharma et al. [29] and Al-Ashkar et al. [30] employed GCA and SCA to identify parents and promising cross combinations for enhancing heat tolerance. It also aids in knowledge of heterotic patterns of progeny at the earlier stage of crossing programs [31,32,33,34]. Thereupon, it is vital to investigate the combining ability and inheritance of agronomic traits under heat stress conditions [20,22,35].
Heat and drought tolerance, in general, depends on stress-responsive gene expression that can be divided into two classes. The first one comprises functional enzymes and proteins that act a vital role in osmotic stress protection, i.e., antioxidative enzymes, membrane transporters, LEA proteins, water channels, etc. The second class contains protein kinases and transcription regulators [36]. Single nucleotide polymorphisms (SNPs) marker is considered one of the most advantageous molecular markers that can be applied in marker-assisted breeding, marker-trait association, and high-resolution genetic maps [37]. In wheat, there are multiple homeologs from each gene, consequently, the potential of SNPs exists. The sequence data from 454 sequencing technology was used for SNP discovery via autoSNPdb method. About 4,694,141 sequence reads were assembled from three bread wheat to detect about 38,928 SNPs [38]. Characterization of abiotic tolerance genes enhanced response to abscisic acid (ERA1-D and ERA1-B), fructan 1-exohydrolase (1-FEH-B and 1-FEH-A), and dehydration responsive element binding (DREB) in wheat (Triticum aestivum L.) were applied for SNPs with phenotypic traits [39]. Accordingly, analysis expression of DREB genes from different genotypes with a comparative survey is an efficient approach to investigate the role of DREBs in plant tolerance to stress factors [40].
The current study aimed at (i) evaluating the performance of six diverse wheat genotypes and their corresponding 15 F1 crosses for grain yield and its attributes under optimal and heat stress conditions; (ii) exploring the SNPs diversity pattern of DREB gene among parental genotypes; (iii) estimating combining ability, heterosis, heritability, and type of gene action controlling studied agronomic traits; and (IV) assessing the relationship between grain yield and evaluated agronomic traits.

2. Materials and Methods

2.1. Parental Genotypes and Crossing

Six diverse bread wheat genotypes were chosen based on origin diversity and the level of tolerance to high temperature from previous preliminary screening trial (unpublished data). The selected parents included two local genotypes obtained from Agricultural Research Center (ARC), Egypt, and four exotic genotypes obtained from the International Maize and Wheat Improvement Center (CIMMYT). The pedigree of used parents is presented in Table S1. During the growing season of 2017–2018, the selected parents were grown at Experimental Farm, Faculty of Agriculture, Kafrelsheikh University, Egypt 31°6′ N 30°56′ E). Half-diallel mating design excluding reciprocal (6 × 6) was used to generate 15 F1 hybrids.

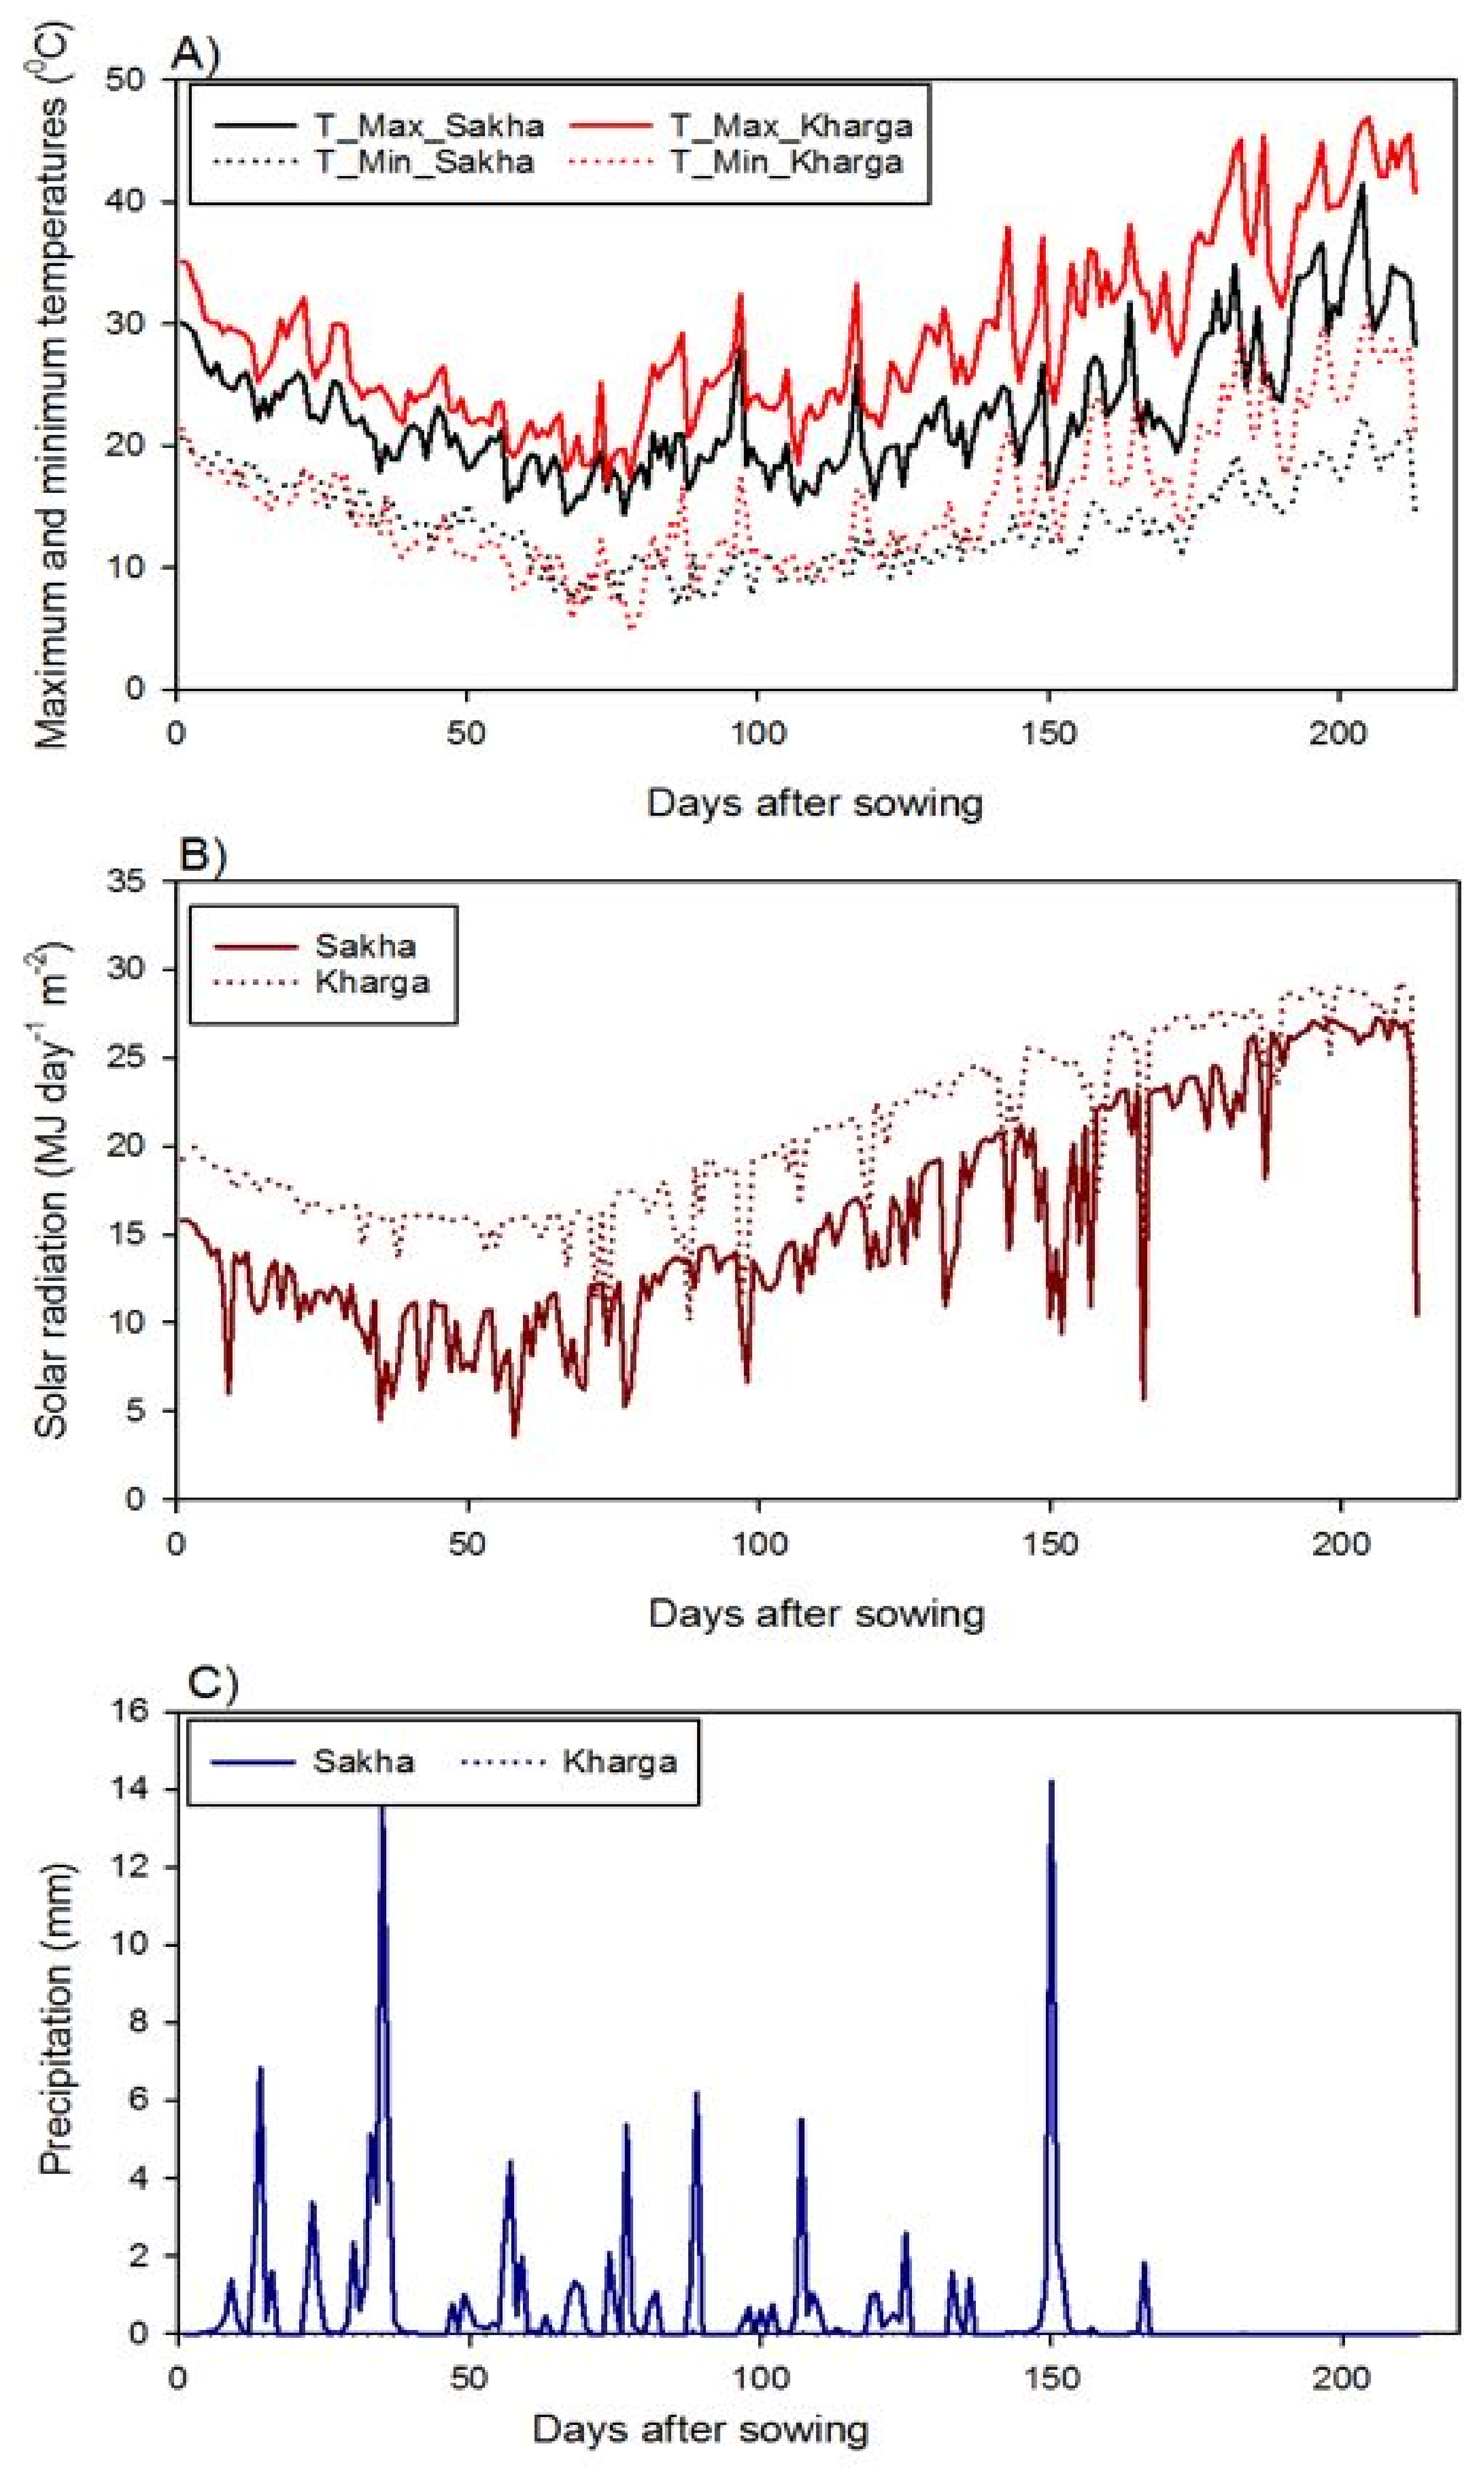
2.2. Experimental Sites and Agronomic Practices

The parental genotypes and obtained crosses were evaluated at two different locations under two sowing dates (recommended and late sowing dates) during 2018–2019 growing season. The recommended sowing date was 25 of November, while the late one was 25 of December at each location. The employed locations are different in soil type and climate variables. The first location was Sakha Agriculture Research Station, Egypt represents the old Nile Valley soil which is classified as clay soil (16.97% sand, 33.06% silt, and 49.97% clay). The second one was the experimental farm, Faculty of Agriculture, New Valley University, El-Kharga, Egypt represents the newly reclaimed soils and classified as sandy soil (86.33% sand, 8.27% silt, and 5.40% clay). The physical and chemical soil properties of both locations are presented in Tables S2 and S3. El-Kharga is an arid region and characterized by high annual temperature and very low precipitation. The meteorological data in both locations are presented in Figure 1.
Randomized Complete Block Design (RCBD) with three replications was used for each sowing date at both locations. The experimental plots consisted of one row, 3 m-long, with a spacing of 30 cm between rows and 20 cm between plants. Recommended fertilizers doses were applied at both locations. Phosphorus, potassium and nitrogen fertilizers were applied at rates of 35 kg P2O5 ha−1, 57 kg K2O and 180 kg N ha−1 at Sakha while at rates of 70 kg P2O5 ha−1, 57 kg K2O, and 288 kg N ha−1 at El-Kharga, in the same order. Other recommended agronomic practices, such as disease protection and weed control were achieved in a timely manner.

2.3. Measured Traits

Data were recorded on days to heading (DTH), plant height (PH; cm), chlorophyll content (CHLC; SPAD reading), number of spikes per plant (NSPP), number of grains per spike (NGPS), thousand grains weight (TGW; g), and grain yield per plant (GYPP; g). The DTH was recorded as the number of days from planting to the date when 50% of spikes completely emerged in each plot. PH was determined as the distance in centimeters from the soil surface to the spike end. A SPAD meter (Model: SPAD-502, Minolta Sensing Ltd., Hangzhou, Japan) was used for measuring CHLC from the uppermost fully expanded leaves on the main stem at the flowering stage. The NSPP was counted for ten plants bearing grains were selected randomly in each plot. The NGPS was recorded from ten spikes were selected randomly at each plot. TGW was recorded as the weight of 1000-grains sampled from each plot. GYPP was recorded by harvesting all plants of each genotype in each plot. The harvested samples were dried, threshed with a thresher machine and the weight of grain yield was determined.

2.4. Molecular Analysis

2.4.1. PCR Amplification and SNP Assay of Dehydrin Gene

The genomic DNA was extracted from six parents using the CTAB method [41]. PCR was performed using genomic DNA of wheat parents to amplify the dehydrin gene using the primers pair sequences [42,43]:
  • Dehydrin-1 (forward): GGTGGGTTTACTGGTGAAGCCGGCAGACAA
  • Dehydrin-2 (reverse): CTAGTGTCCAGTACATCCTCCAGTACCAGG
PCR was performed using Promega green master mix in a 50 µL reaction volume. PCR cycling was performed according to manufacture instructions. Amplified PCR products were purified, sequenced in both directions, assembled (CLC Main Workbench 8), and aligned by ClustalW in MEGA X [44].

2.4.2. Phylogenetic Analysis

The nucleotide sequences are inferred from a putative dehydration-responsive element-binding 2 gene of six selected parents. Evolutionary analyses were performed in MEGA X by utilizing the Maximum Likelihood method and Tamura–Nei model with the highest log likelihood (−373.68). The initial tree was constructed by applying the neighbor-joining method with a total of 134 positions.

2.5. Statistical Analysis

The analysis of variance (ANOVA) was computed for all recoded data applying R statistical software version 3.6.1. The combined analysis was applied whenever the homogeneity test was non-significant as outlined by Gomez and Gomez [45]. Combining ability analysis was performed according to Griffing’s method 2 model 1 [46]. The genetic components, along with related genetic parameters were estimated as suggested by Hayman [47]. Heritability values in the narrow and broad sense were determined according to Mather and Jinks [48]. The heterosis relative to mid-parent (MP) and better-parent values (BP) were assessed as the deviation of the F1 value from the MP and the BP values, respectively [49]. The heat tolerance indices were calculated as follows:
  • Mean productivity (MP) = Y s + Y p 2 Rosielle and Hamblin [50]
  • Geometric mean productivity (GMP) = Ys   ×   Yp Fernandez [51]
  • Stress tolerance index (STI) STI = Y s × Y p Ȳ p 2 Fernandez [51]
  • Yield index (YI) = Ys   Ȳ s Gavuzzi et al. [52]
where; Ys, is the grain yield of genotypes under stress condition, Yp, the grain yield of genotypes under optimal conditions, Ȳs and Ȳp are the mean yields of all genotypes under stress and optimal conditions, respectively. Based on these indices, the hierarchical cluster analysis was exploited to group the evaluated genotypes based on the level of heat tolerance according to Ward method [53]. Principal component analysis (PCA) was applied using averages of the evaluated traits to assess their relationships.

3. Results

3.1. Analysis of Variance

The results of combined analysis of variance (Table 1) indicated substantial effects of location (L), sowing date (D), genotype (G), and their interactions (G × L, G × D, and G × D × L) on all measured traits. Dividing of the genotypes into GCA and SCA components showed that the mean squares of GCA and SCA were highly significant for all investigated traits. The interaction effects of GCA × L, SCA × L, GCA × D, SCA × D, GCA × L × D, SCA × L × D were significant for all evaluated traits, except GCA × D for plant height (PH), chlorophyll content (CHLC), spike length (SL), and number of spikes per plant (NSPP). Moreover, GCA × L × D for PH, SL, TGW, and GYPP were not significant. The ratio of GCA/SCA was lower than the unity for all evaluated traits, except spike length (SL) and number of grains per spike (NGPS). Moreover, the magnitude of SCA × L interaction was superior to those of GCA × L interaction for all studied traits, except CHLC, NSPP, and TGW. Likewise and the magnitude of SCA × D interaction was superior to those of GCA × D interaction for all measured traits, except DTH and NGPS.

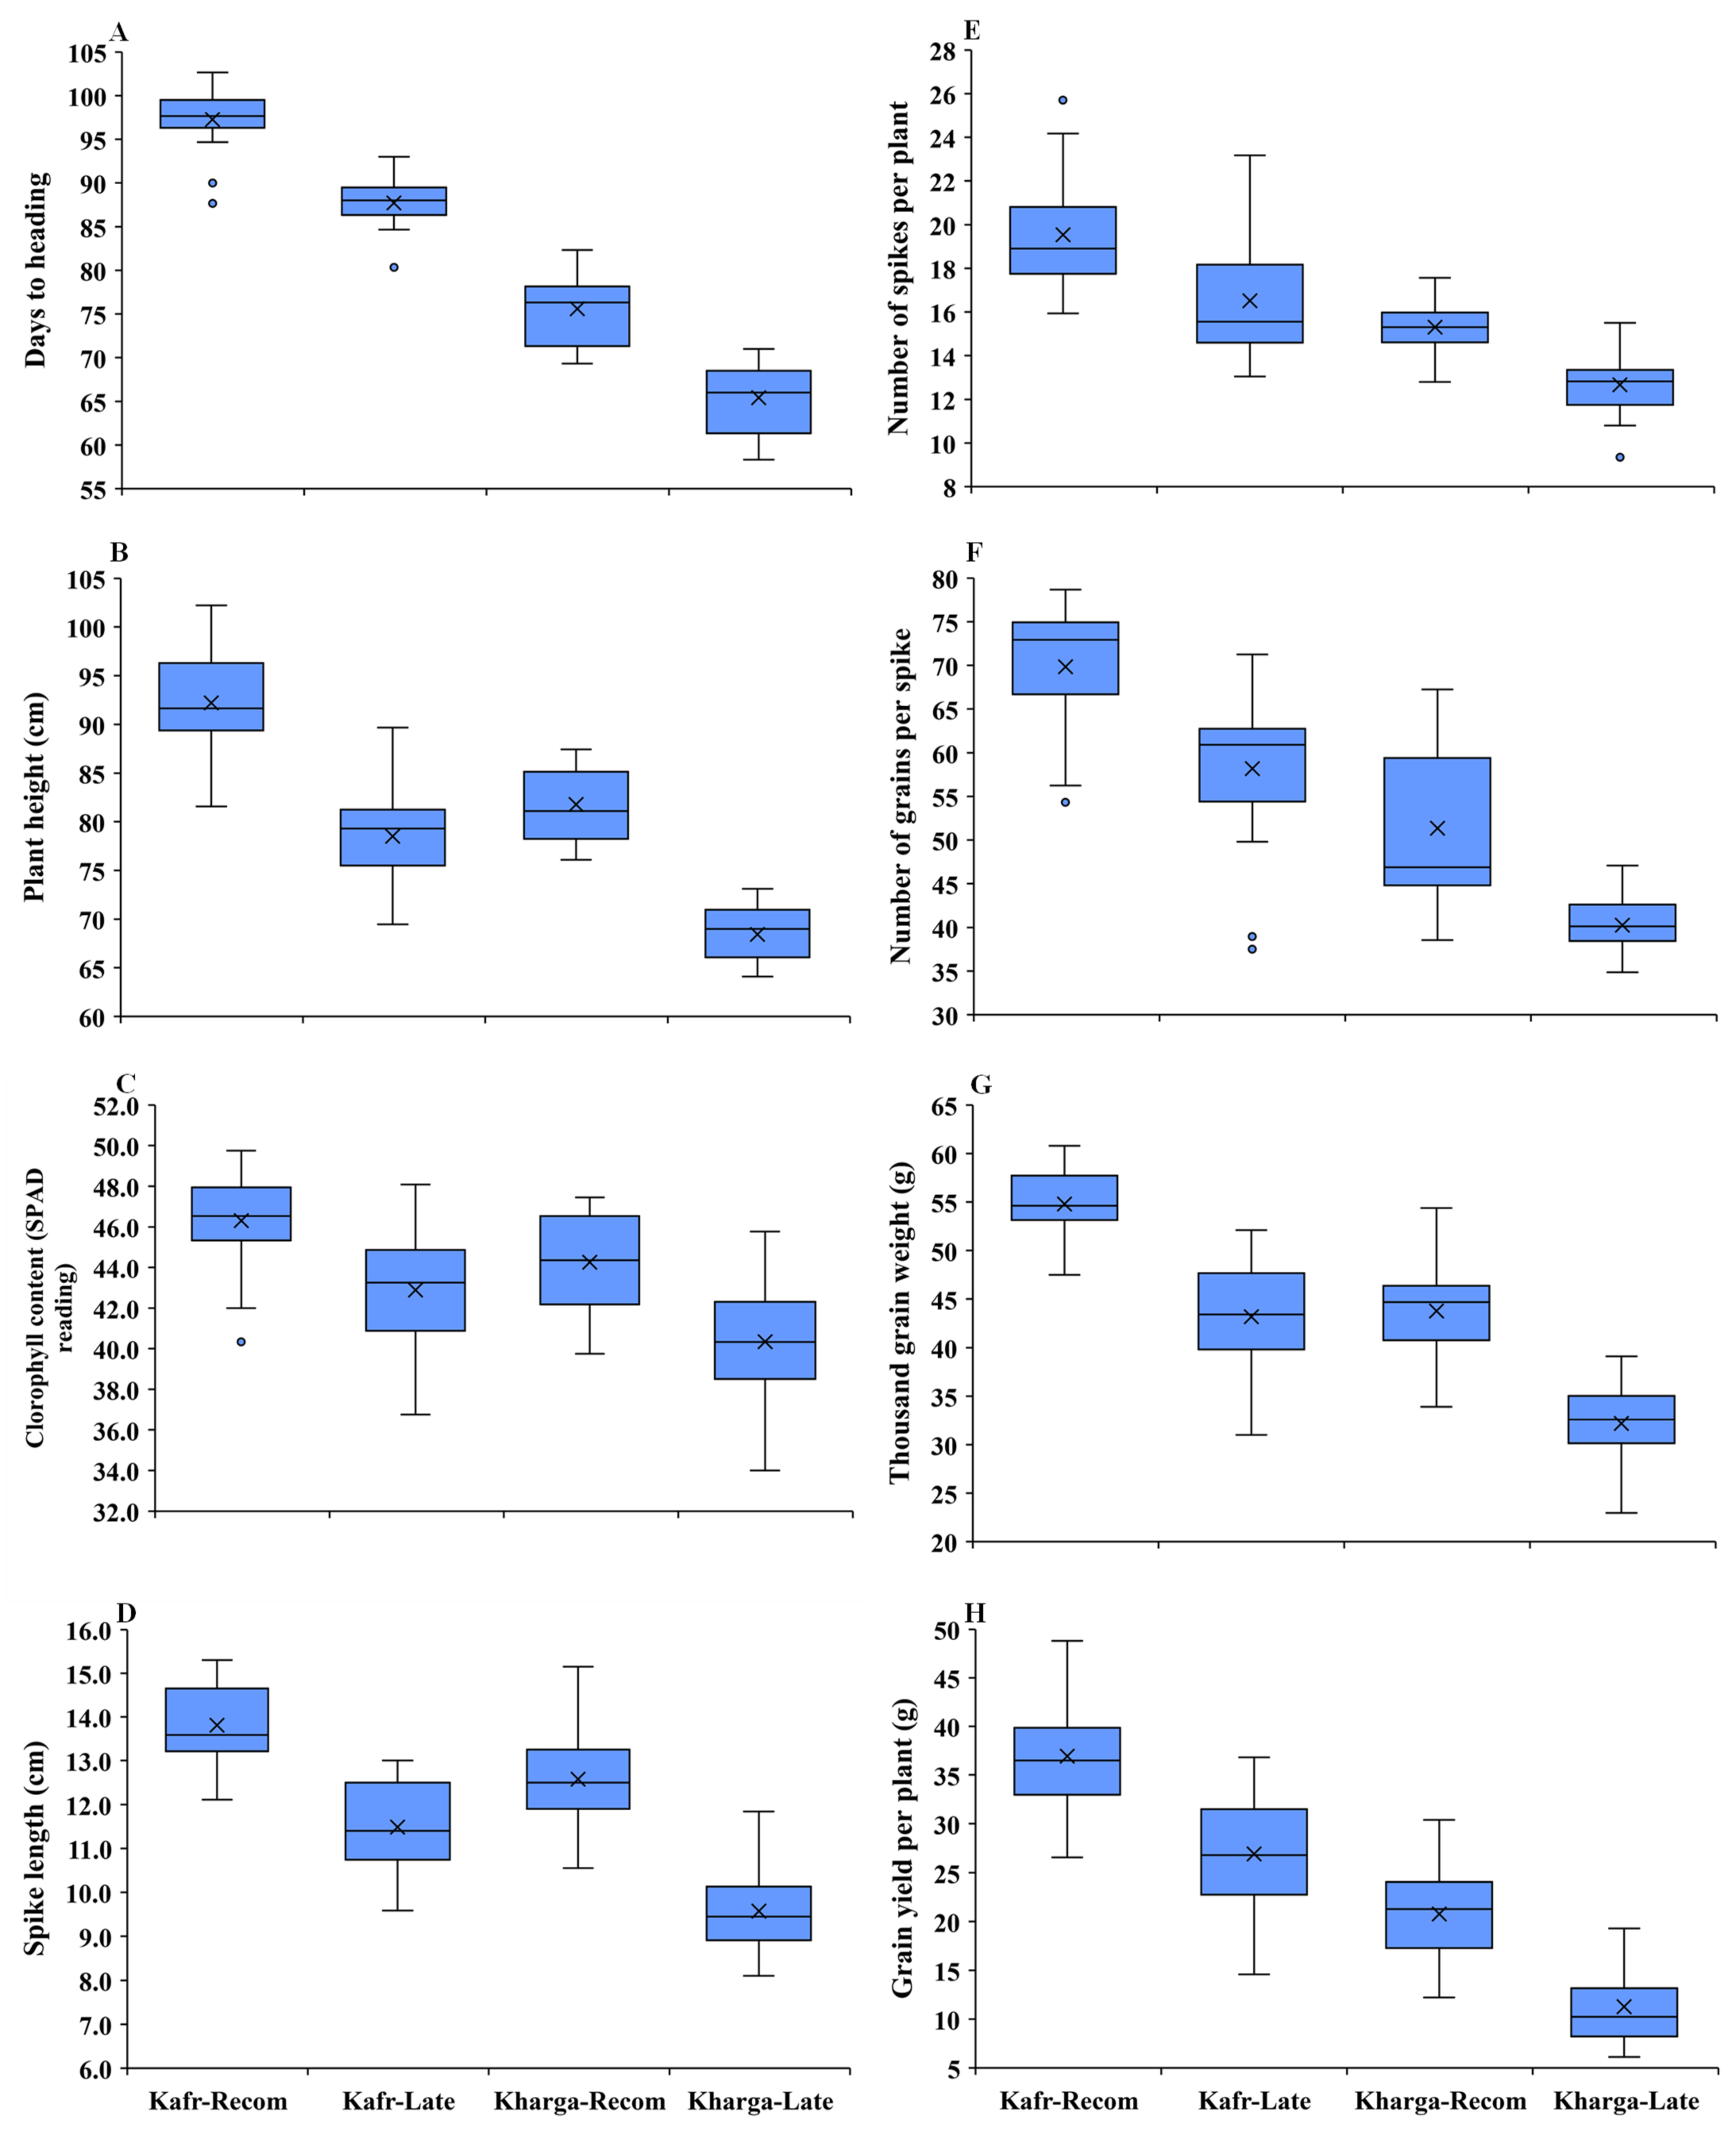
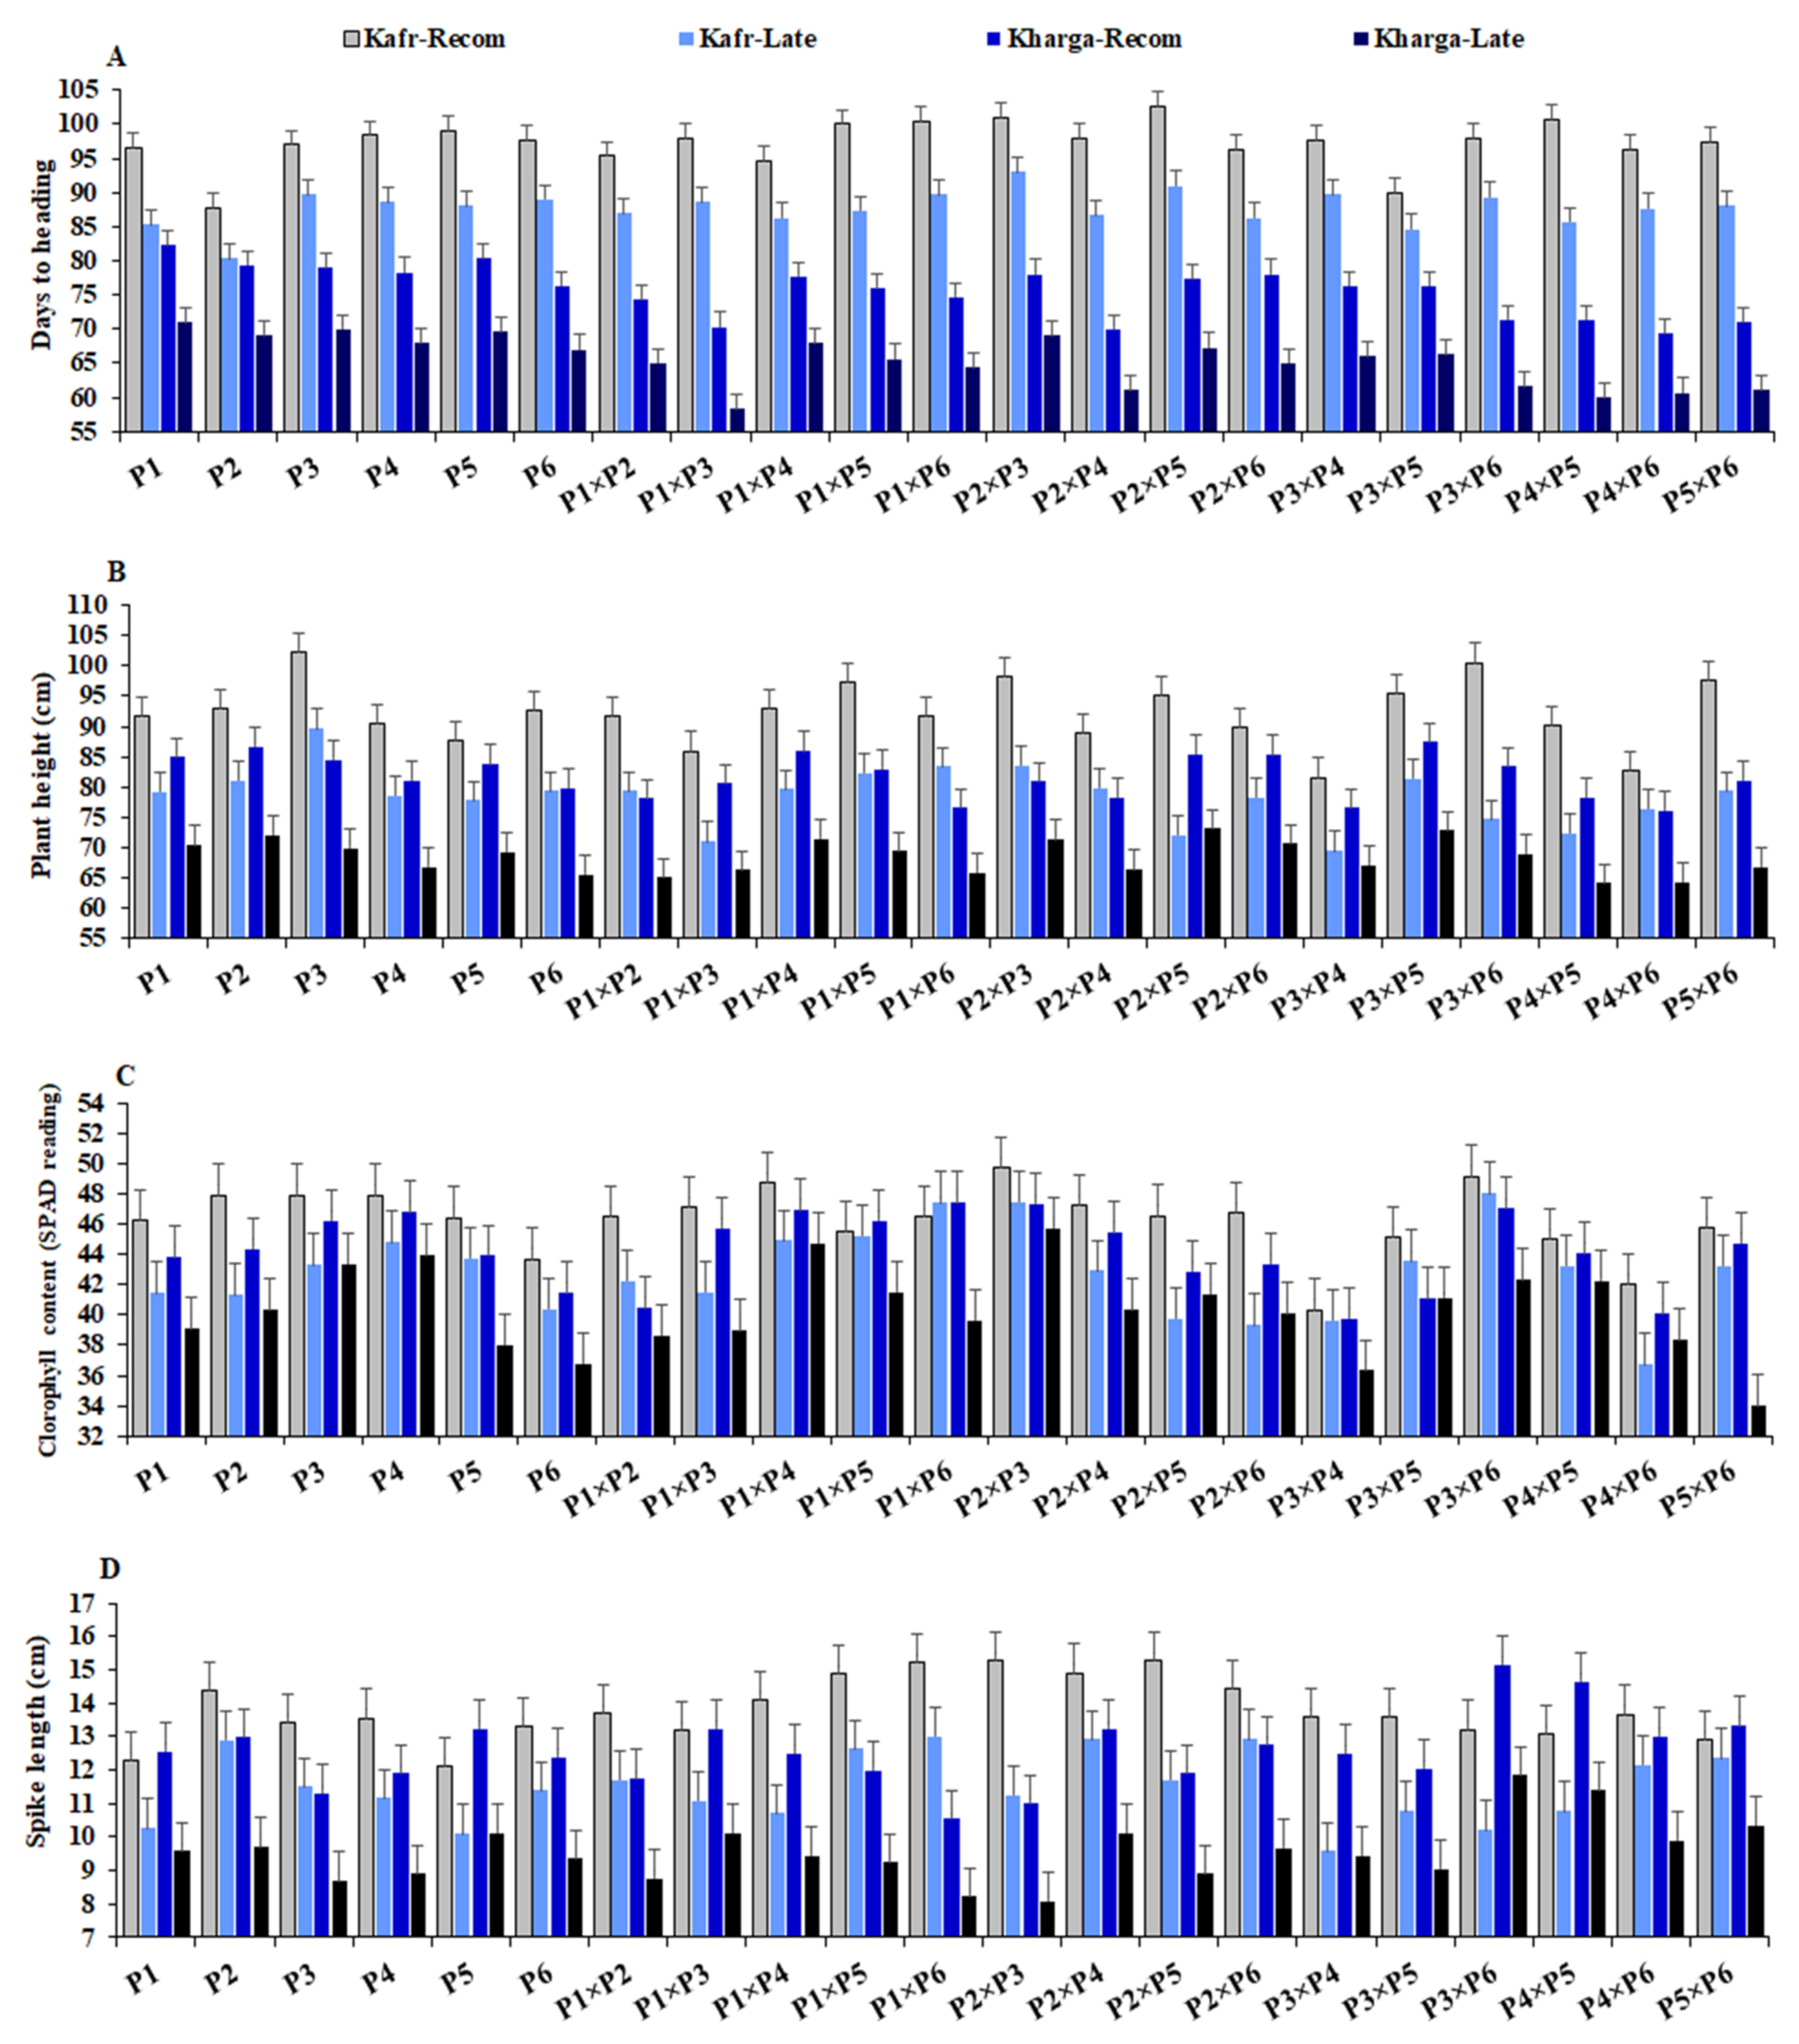
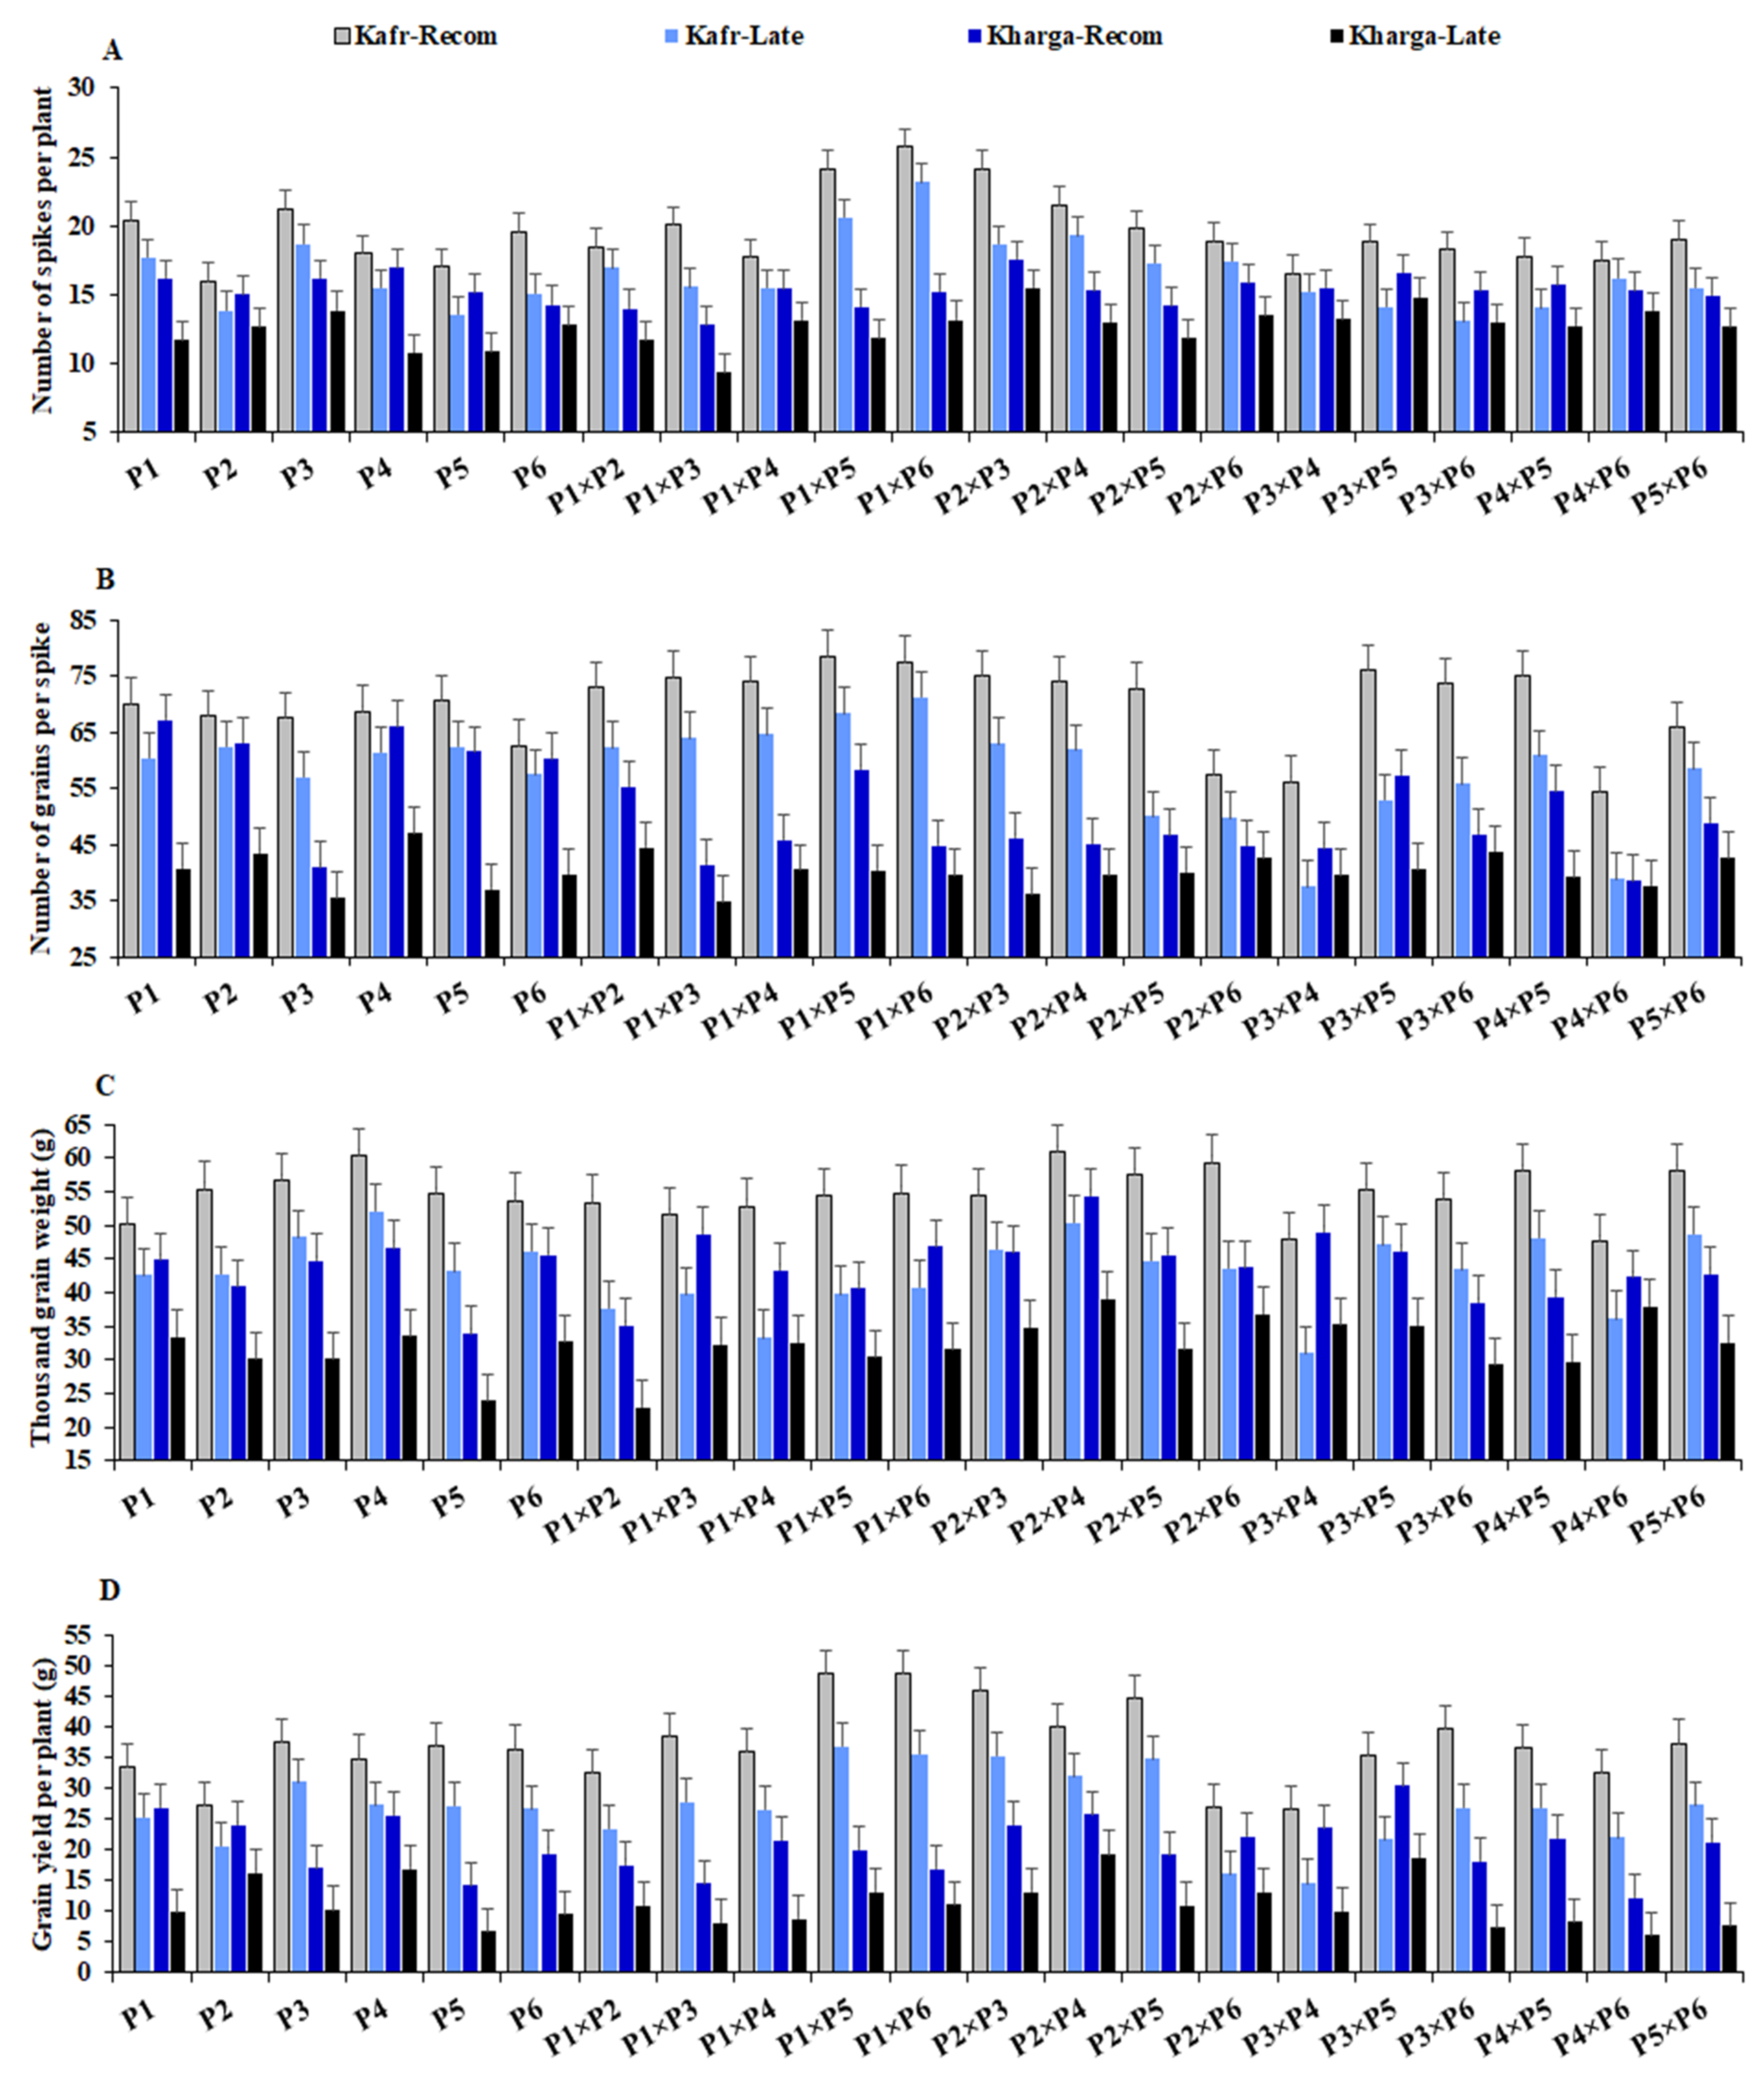
3.2. Mean Performance of Used Parents and Their F1 Hybrids

The evaluated parental genotypes and their F1 hybrids exhibited a wide variation for all assessed traits under all tested environments. The mean values of DTH reduced from 97.27 to 87.71 and from 75.60 to 65.43 days due to late sowing conditions in Sakha and El-Kharga locations, respectively (Figure 2 and Table S4). The parents P2 and P6 and hybrids P4 × P6 and P1 × P3 exhibited the earliest heading, while the latest heading was assigned for P5, P3, P2 × P3, and P2 × P5 across the four environments (Figure 3). Plant height declined from 92.21 to 78.49 cm; and from 81.78 to 68.43 cm in Sakha and El-Kharga, respectively, due to late sowing. The parents P2 and P3, as well as the hybrids P2 × P3 and P3 × P5, exhibited the tallest plants, while the shortest ones were obtained by P4, P6, P3 × P4, and P4 × P6 across all environments. Likewise, late sowing conditions decreased CHLC from 46.30 to 42.88 at Sakha; and from 44.25 to 40.34 at El-Kharga. The highest values for CHLC were assigned for P4 and P3 and the crosses P2 × P3 and P3 × P6, while the lowest values were given by P6, P1, P3 × P4, and P4 × P6 across all environments. In the same manner, late sowing shortened SL from 13.81 cm to 11.49 cm and from 12.57 cm to 9.57 cm at Sakha and El-Kharga, respectively (Figure 2). The parents P2 and P6, as well as the hybrids P2 × P4 and P3 × P6, had the longest spike across all environments (Figure 3).
A reduction in NSPP due to late sowing was also recorded from 19.54 to 16.51 and from 15.30 to 12.66 in Sakha and El-Kharga, respectively (Figure 2). The lowest values were exhibited by the parents P2 and P5 and the crosses P1 × P3 and P3 × P6, while the highest values were presented by the parents P3 and P1 and the crosses, P1 × P6 and P2 × P3 (Figure 4). The NGPS also declined from 69.84 to 58.18; and 51.36 to 40.27 due to late sowing in Sakha and El-Kharga, respectively. The parents P1 and P4 and the crosses P1 × P5 and P1 × P2 had the highest NGPS, but P3, P6, P4 × P6, and P3 × P4 produced the lowest NGPS under the four environments. Similarly, late sowing dropped TGW from 54.80 g to 43.17 g at Sakha; and from 43.76 g to 32.19 g at El-Kharga. The lightest TGW was assigned for P5 and P2 and the hybrids P1 × P2 and P1 × P4, whereas P4, P3, P2 × P4, and P3 × P5 exhibited the heaviest TGW across all environments. Eventually, GYPP diminished from 36.94 to 26.91 g at Sakha, while at El-Kharga it decreased from 20.76 to 11.26 g (Figure 2). The parents P5 and P2 and the hybrids P3 × P4 and P4 × P6 exhibited the lowest grain yield while P4, P3, P1 × P5, and P2 × P3 displayed the highest ones (Figure 4). Overall, the highest reduction in grain yield and its attributes due to the late sowing conditions was observed at El-Kharga compared with Sakha.
The late sowing condition displayed a significant adverse impact on all the evaluated traits relative to timely sowing. Across the two locations (on average), the mean of GYPP was significantly reduced by 36.46% under late sowing conditions in comparison with timely sowing (Figure 5). This reduction was accompanied by reductions in PH (15.60%), CHLC (8.11%), and all yield attributes; SL (20.35%), NSPP (16.37%), NGPS (19.15%), and TKW (23.83%). Moreover, the late sowing conditions shortened DTH by 11.64%.

3.3. Genotypic Classification According to Heat Tolerance Indices

Heat tolerance indices including, geometric mean productivity (GMP), mean productivity (MP), yield index (YI), and stress tolerance index (STI) were estimated based on grain yield under timely and late sowing conditions in each location for six parents and their 15 F1 hybrids. The estimated indices were applied to classify the assessed genotypes according to their heat stress tolerance. Using hierarchical clustering the genotypes were classified into four groups with different genotypes in both tested locations (Figure 6A,B). The genotypes in group A in both locations had the highest tolerance indices values; therefore, they are considered heat-tolerant genotypes. Likewise, group B included genotypes with intermediate indices values; consequently, it was classified as moderate heat-tolerant genotypes. While the genotypes in groups C and D had the lowest indices values; hence, they are considered intermediately heat sensitive and sensitive genotypes, respectively.

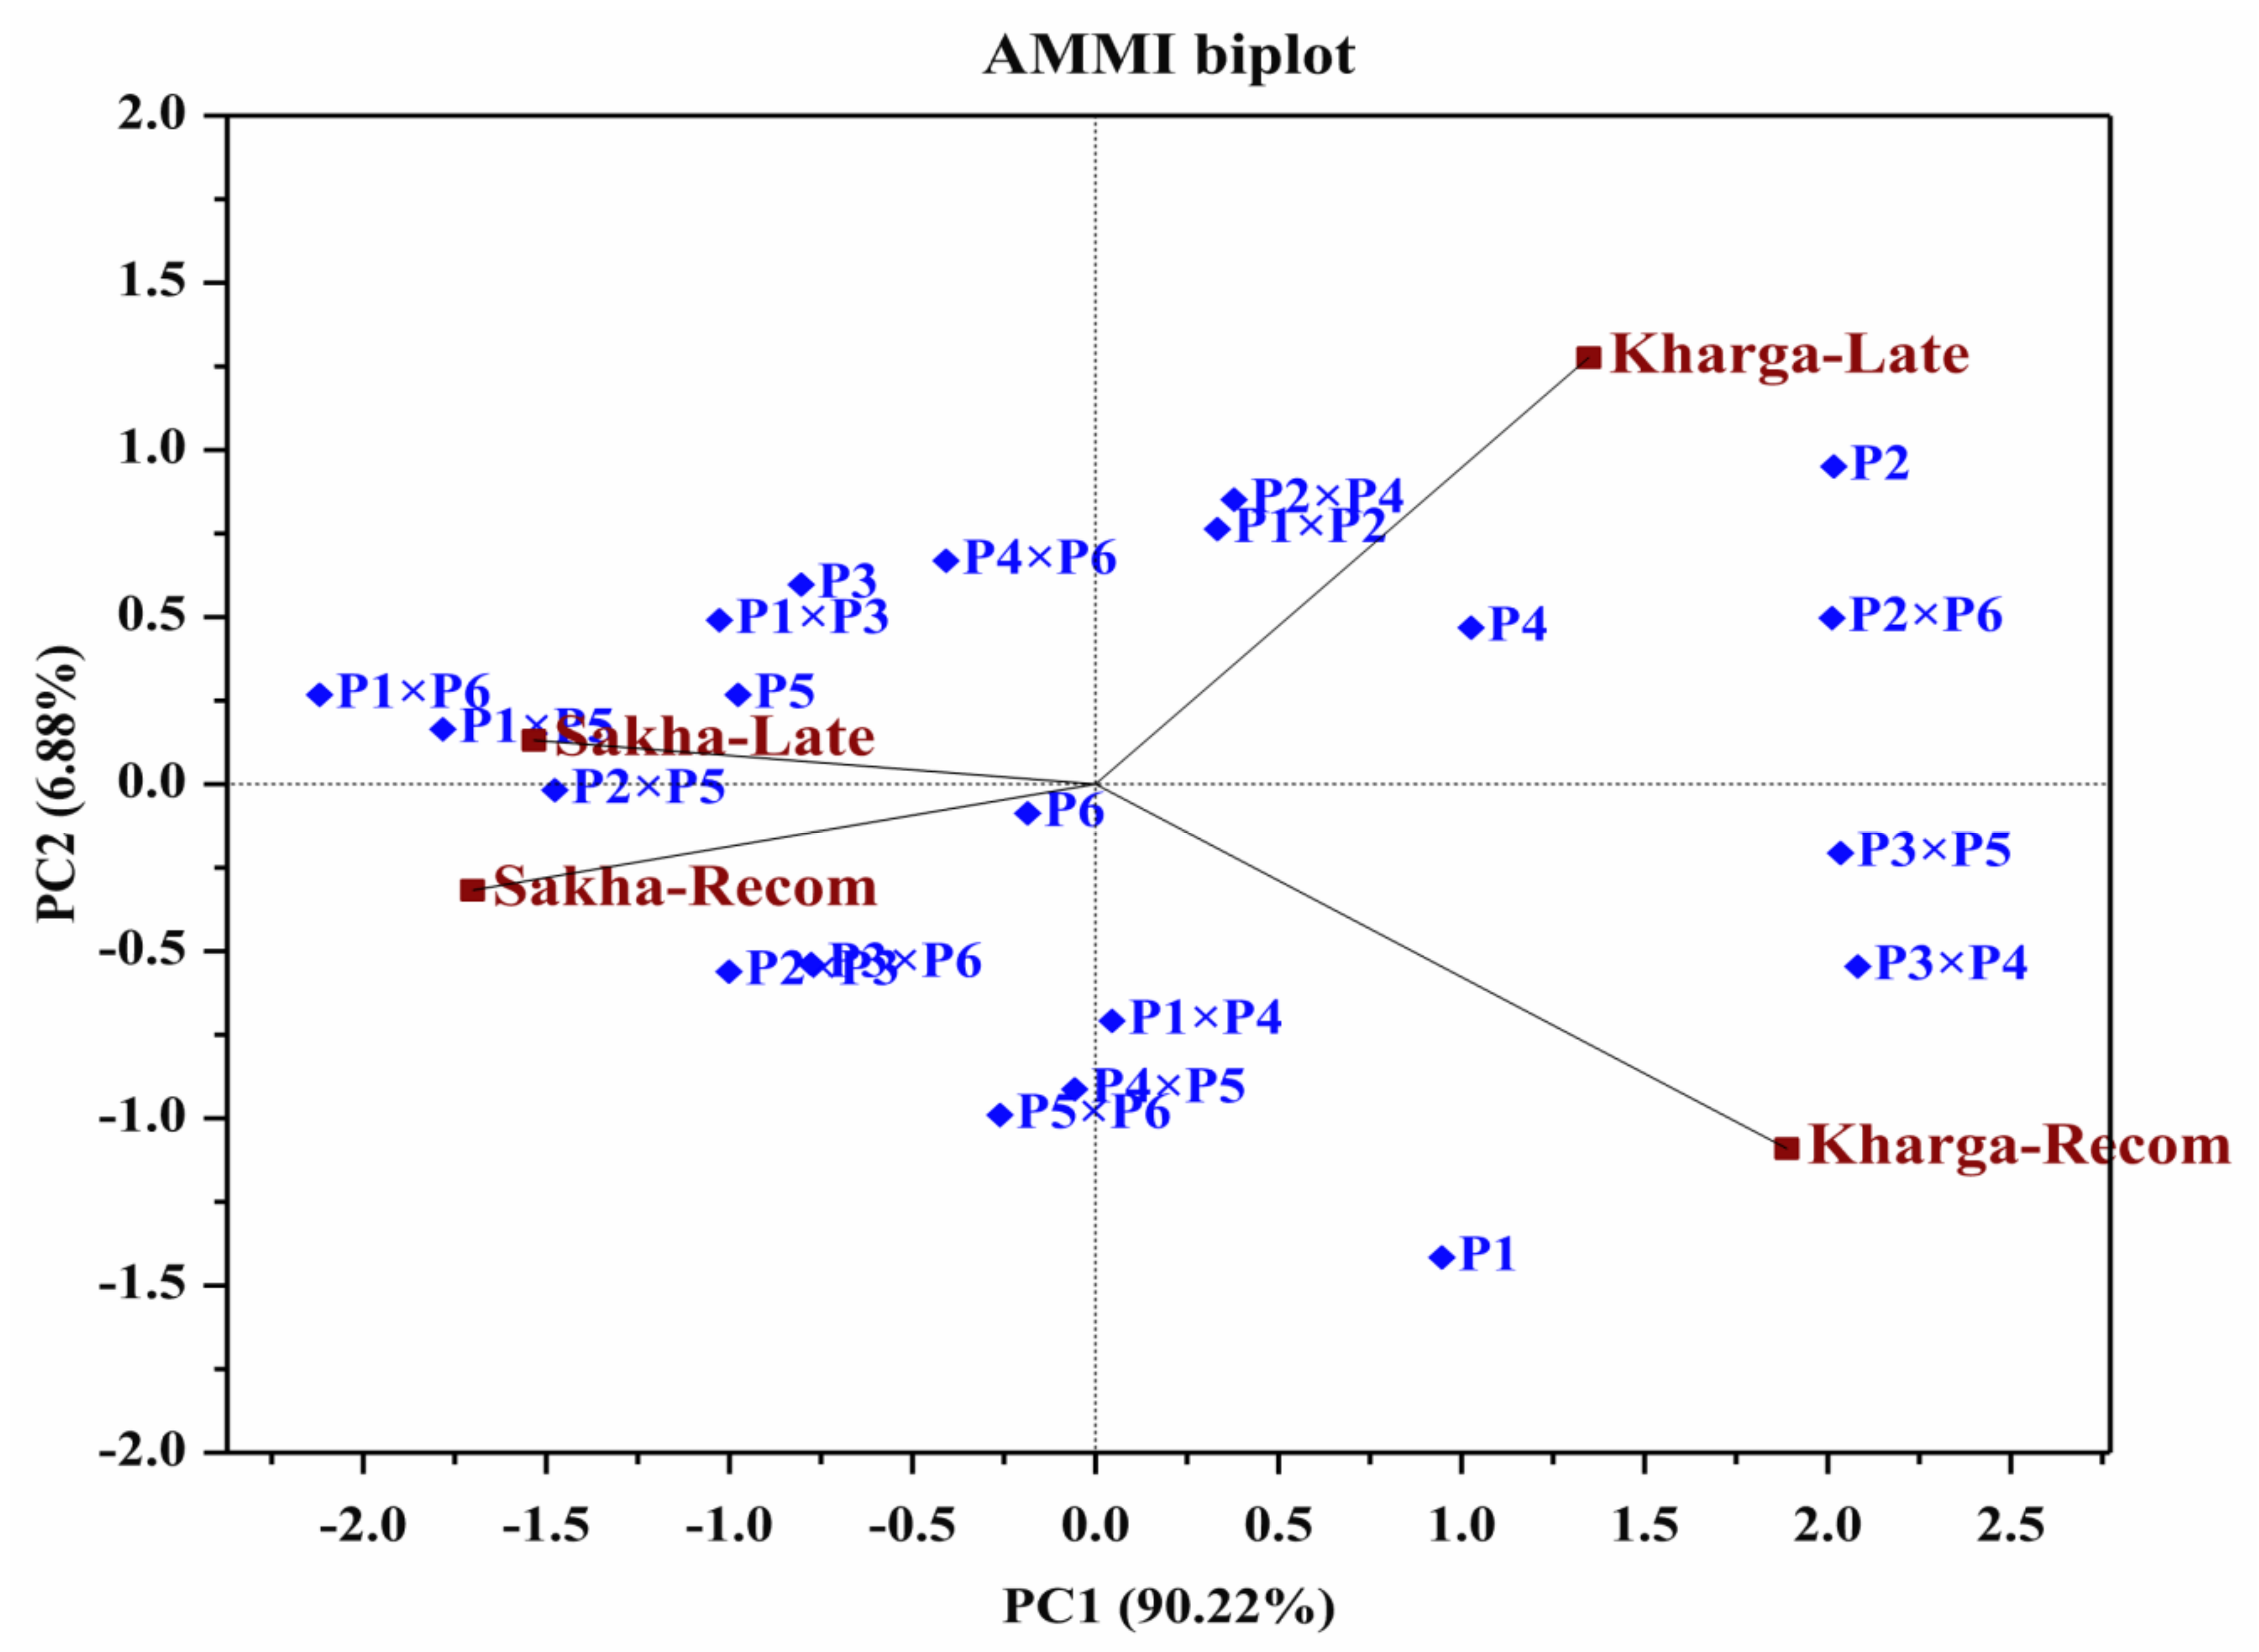
3.4. Additive Main Effect and Multiplicative Interaction Model (AMMI)

AMMI1 biplot was constructed for representing the impact of genotypes and environments as well as for further classification of the specific genotypic responses (Figure 7). The first two principal components explained most genotype-by-environment effects (97.1%). The genotypes are located close to origin are more stable across tested environments (Figure 7). The results revealed that P6 (intermediate heat-tolerant), P2 × P5 and P2 × P3, P2 × P4 and P4 (heat-tolerant), P3 × P6, P5 × P6, P4 × P5, P1 × P4, P5, P1 × P3, P3 and P1 × P2 (intermediate salt-sensitive) and P4 × P6 (heat-sensitive) showed the least variable values. On the other hand, P1 × P6 and P1 × P5 (intermediate heat-tolerant) and P2, P1, P2 × P6, P3 × P5, and P3 × P4 (intermediate heat-tolerant) showed large fluctuations across environments. Moreover, the environments are consistently located in different parts of the graph. The AMMI analysis presented highly adopted genotypes under heat stress at El-Kharga under late sowing date as P2, P4, P2 × P4, and P2 × P6. The first two PCs displayed a geographic prevalence of the genotype-by-environment interaction and mostly reflected the difference between tested environments. Clearly, El-Kharga under both sowing dates (Kharga-Late, Kharga-Recom) contributed largely to GEI whereas there was a small contribution by Sakha under both sowing dates (Sakha-Late and Sakha-Recom). This finding obviously suggests the importance of late sowing at El-Kharga for identifying heat-tolerant genotypes.

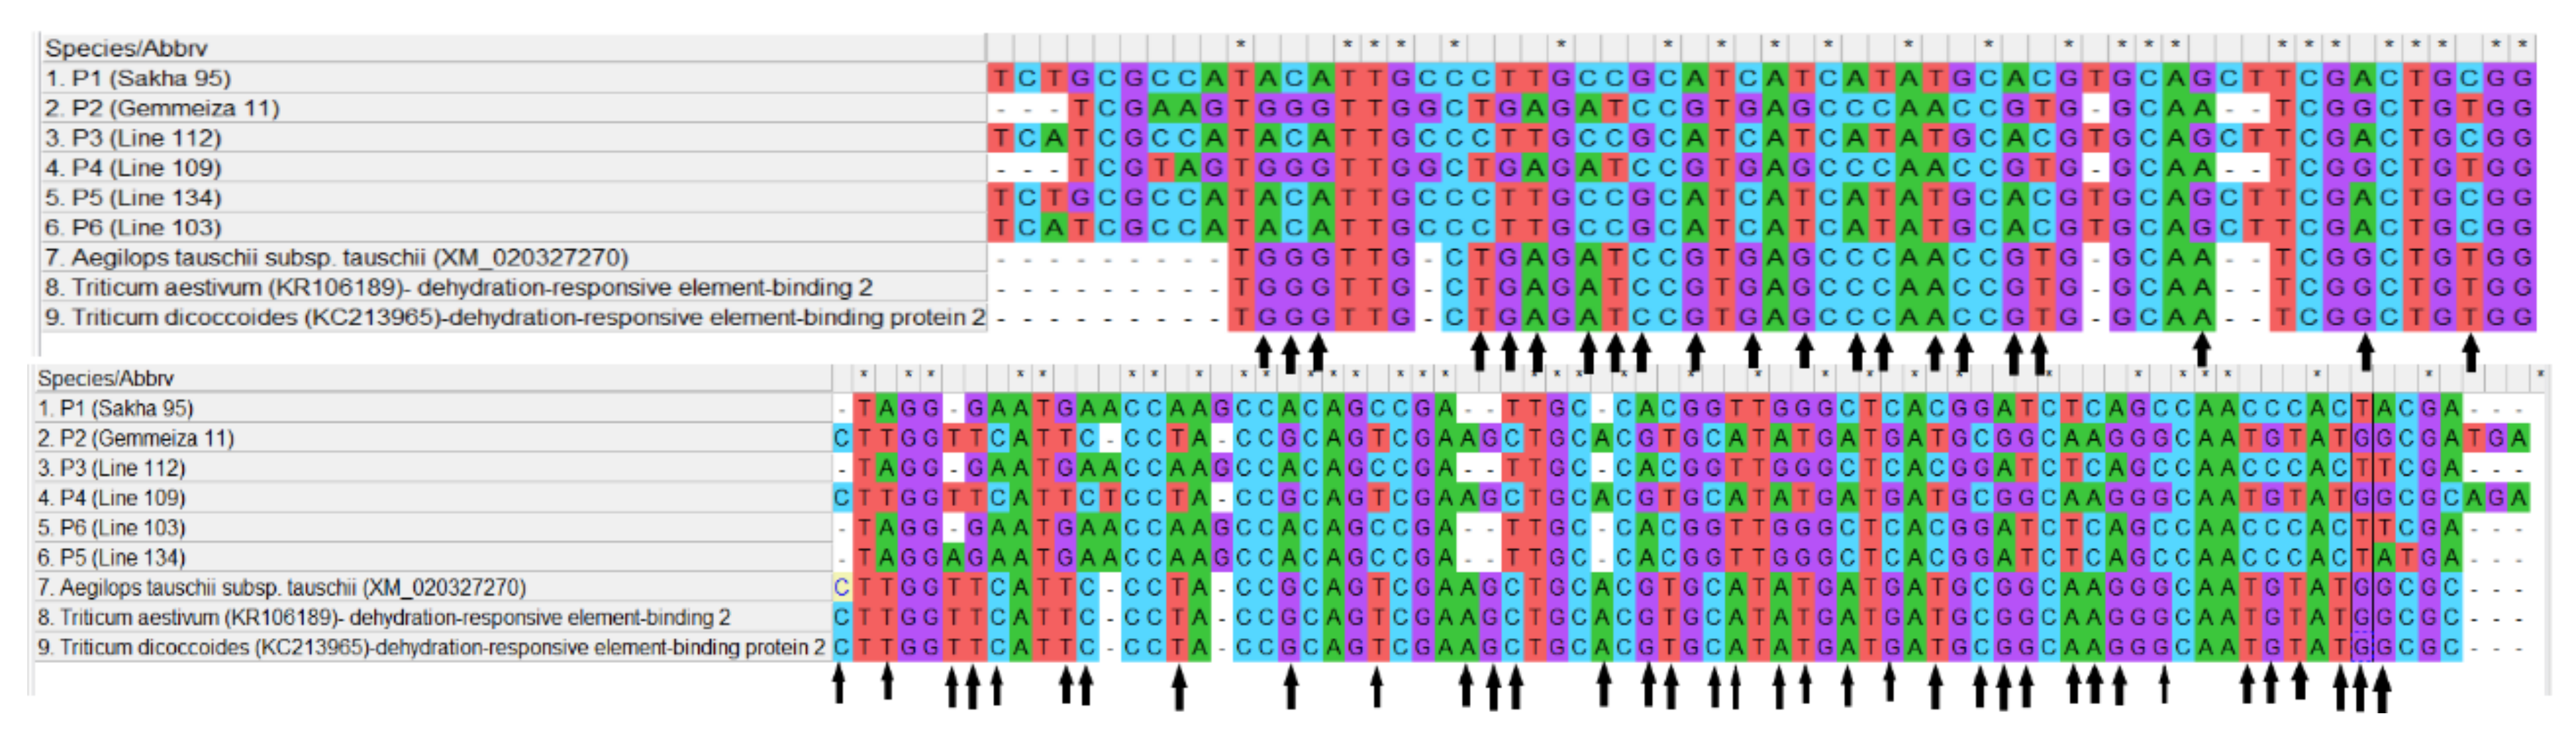
3.5. Phylogenetic Tree, SNP Analysis and Protein Sequence of Dehydrin Gene

Amplification of specific dehydrin gene in the evaluated wheat parents produced one fragment (800 bp). Based on assembled sequences coming from both directions for dehydration-responsive element-binding 2 gene (stress tolerance gene in response to several abiotic stresses), six parents and three sequences obtained from NCBI of Triticum aestivum, Triticum dicoccoides, and Aegilops tauschii subsp. tauschii were used in the phylogenetic tree construction (Figure 8). The tree contained two groups, the first group contains heat and drought tolerant genotypes (P2, P4, Triticum aestivum, Triticum dicoccoides, and Aegilops tauschii). Otherwise, the second group had the sensitive ones (P1, P3, P5, and P6).
The amplified genomic DNA sequence of the dehydrin gene for evaluated parental genotypes displayed several single nucleotide polymorphisms (about 57 SNPs positions). There are variations in specific nucleotides at certain positions (Figure 9). These findings demonstrate a considerable diversity for this gene within used wheat parental genotypes. The parents P2 and P4 exhibited similarity in nucleotides polymorphisms to heat and drought-tolerant species Triticum aestivum, Triticum dicoccoides, and Aegilops tauschii.
The proposed amino acid sequence by Mega X software showed a heat shock transcription factors (HSF) domain having a high degree of similarity with other HSF coding gene of related species Triticum dicoccoides and Aegilops tauschii (Figure S1). Wheat parents P2 and P4 had the highest homology for nucleotides and amino acid sequence with the heat and drought-tolerant genotypes Triticum aestivum, Triticum dicoccoides, and Aegilops tauschii.

3.6. General Combining Ability (GCA) Effects

The GCA effects for grain yield and its attributes varied widely among the parents (Table 2). The parents with positive and significant GCA effects are important for all agronomic attributes except DTH and PH negative values are desirable. Negative and significant GCA effects for DTH were assigned to P1 under late sowing at Sakha, P2 under both sowing dates at Sakha as well as P4 and P6 under both sowing dates at El-Kharga. Moreover, P4 had a highly significant negative GCA for PH across all studied environments and P6 at El-Kharga under both sowing dates. On the other hand, positive and significant GCA effects of CHLC were obtained by P2 at Sakha under timely sowing, P3 under late sowing at both locations and P4 under late sowing at El-Kharga. Similarly, P2 under both sowing dates at Sakha, P4 under optimal sowing at El-Kharga, P5 under both sowing dates at El-Kharga and P6 under late sowing at Sakha as well as timely sowing at El-Kharga displayed positive and significant GCA effects for SL. The highest significant GCA effects for NSPP were recorded by P1 under both sowing at Sakha, P2, P3 and P6 under late sowing at El-Kharga and P4 under timely sowing at El-Kharga. Additionally, P1 and P5 had consistent positive GCA effects for NGPS under both sowing dates at Sakha and timely sowing at El-Kharga, while P4 had positive GCA effects only under late sowing at El-Kharga. The parent P2 under timely sowing at Sakha, P3 under timely sowing at El-Kharga, P4 under both sowing dates at El-Kharga, P5 under both sowing dates at Sakha and P6 under late sowing at El-Kharga expressed significant and positive GCA effects for TGW. Notably, P1 and P5 under both sowing dates at Sakha as well as P2 and P4 under both sowing dates at El-Kharga had the highest GCA effects for GYPP.

3.7. Specific Combining Ability (SCA) Effects

Significant and negative SCA effects for DTH were assigned to P3 × P5 under both sowing dates at Sakha, and P1 × P2, P1 × P3, P2 × P4, P3 × P6, P4 × P5, P4 × P6, and P5 × P6 under both sowing dates at El-Kharga (Table 3). The crosses P1 × P3 and P3 × P4 displayed significant and negative SCA values for PH across all studied environments, as well as P4 × P5 under late sowing in both locations. On the contrary, the highest significant and positive SCA effects for CHLC were obtained by P1 × P4, P1 × P6, P2 × P3, and P3 × P6 across all tested environments. In respect of SL, the SCA effects were significant and positive under both recommended and late sowing for the crosses P1 × P5 and P1 × P6 at Sakha location, and P1 × P3, P2 × P4, P3 × P6, and P4 × P5 at El-Kharga location. Furthermore, the crosses P1 × P5, P1 × P6, P2 × P3, and P2 × P4 had the largest positive significant SCA value for NSPP overall the environments. The highest positive SCA effects for NGPS were obtained by the hybrids P1 × P6, P2 × P3, P3 × P5, P3 × P6, and P4 × P5 under timely sowing, and P1 × P3, P1 × P4, P1 × P5, P1 × P6, P2 × P3, P2 × P4, and P4 × P5 under late sowing at Sakha. Moreover, the crosses P1 × P2, P3 × P5, and P3 × P6 under late sowing in El-Kharga location had a positive significant SCA value for this trait. The hybrid combinations P2 × P4 and P5 × P6 across sites and sowing dates had the largest positive SCA effects for TKW. Significant and positive SCA effects under both sowing dates were observed by the crosses P1 × P5, P1 × P6, P2 × P3, P2 × P4, and P2 × P5 at Sakha, and P2 × P4 and P3 × P5 at El-Kharga for GYPP. Moreover, across the two locations three hybrids P1 × P5, P1 × P6, and P2 × P4 proved positive and significant SCA effects for GYPP under late sowing conditions. Based on the obtained results, no cross combination performed well for all evaluated traits across environments. Nevertheless, the hybrid P2 × P4 was a good specific combiner for TGW, SL, NGPS, and GYPP across the environments. Moreover, P1 × P5, P1 × P6, and P3 × P5 combined well for NSPP, NGPS, and GYPP across environments. Interestingly, the crosses that displayed high SCA effects for GYPP also displayed desirable SCA effects for certain other traits.

3.8. Heterosis Relative to Mid-Parent (MP) and Better-Parent (BP)

Heterosis percentage relative to MP or BP under recommended and late sowing dates across the two locations are presented in Table 4. The majority of crosses manifested significant heterosis relative to MP or BP under both sowing dates. The highest desirable significant and negative MP and BP heterotic effects under both normal and late sowing dates were recorded by the crosses P1 × P3, P3 × P5, P3 × P6, P4 × P5, P4 × P6, and P5 × P6 for DTH toward earliness, and P1 × P3 and P3 × P4 for PH toward shortness. On the other hand, the hybrid combinations P1 × P6, P2 × P3, and P3 × P6 possessed significant and positive heterosis over MP for CHLC under both sowing dates. However, the crosses P1 × P5, P1 × P6, and P2 × P3 showed positive and significant BP heterosis under the late sowing date. The highest positive MP and BP heterotic effects for SL were observed for the hybrids P1 × P5 and P4 × P5 under both sowing dates. In respect of NSPP, the crosses P1 × P5, P2 × P3, P1 × P6, P2 × P4, P2 × P5, and P2 × P6 displayed significant positive heterotic effects relative to MP and BP under both sowing dates, except the heterotic effects over BP were not significant for P2 × P4, P2 × P5, and P2 × P6 under recommended sowing date. The two hybrids P1 × P5, P1 × P6 possessed significantly positive heterosis relative to MP and BP for the NGPS under late sowing date. The maximum positive MP heterosis for TGW was observed for P2 × P4, P2 × P5, P2 × P6, and P3 × P5 under both sowing dates, while, the highest positive BP heterosis was exhibited by P2 × P4 and P2 × P5 under recommended sowing date. The hybrid combinations P1 × P5, P1 × P6, P2 × P3, P2 × P4, and P2 × P5 significantly exhibited the highest positive MP and BP heterotic effects under both sowing dates for GYPP.

3.9. Components of Genetic Variation and Heritability

The additive component (D) was not significant for most traits. However, the dominance components H1 and H2 were significant for all evaluated traits, except NSPP under normal sowing at El-Kharga (Table 5). The magnitude of dominance component (H1) was higher than the additive component (D) for all evaluated traits under both sowing dates at both locations (Table 5). Moreover, the H1 values were larger than H2 in all studied traits. The distributions of the relative frequencies of dominant versus recessive gene (F) were positive and not significant for most traits. Furthermore, the ratio of dominant to recessive genes in the parents (KD/KR) was more than the unity for all the studied traits, except DTS and PH under late sowing date in El-Kharga, and NGPS under both sowing dates at Sakha. The proportion of genes in the parents with positive and negative effects (H2/4H1) was less than 0.25 for all the traits in all environments. The average degree of dominance (H1/D) 0.5 was larger than one in all studied traits across all tested environments. Heritability in the narrow sense (h2n) varied from low (3.71) to moderate (43.62) for all the measured traits under timely and late sowing dates in both sites. Moreover, heritability in the broad sense was higher than that in the narrow sense for all the measured traits across all environments.

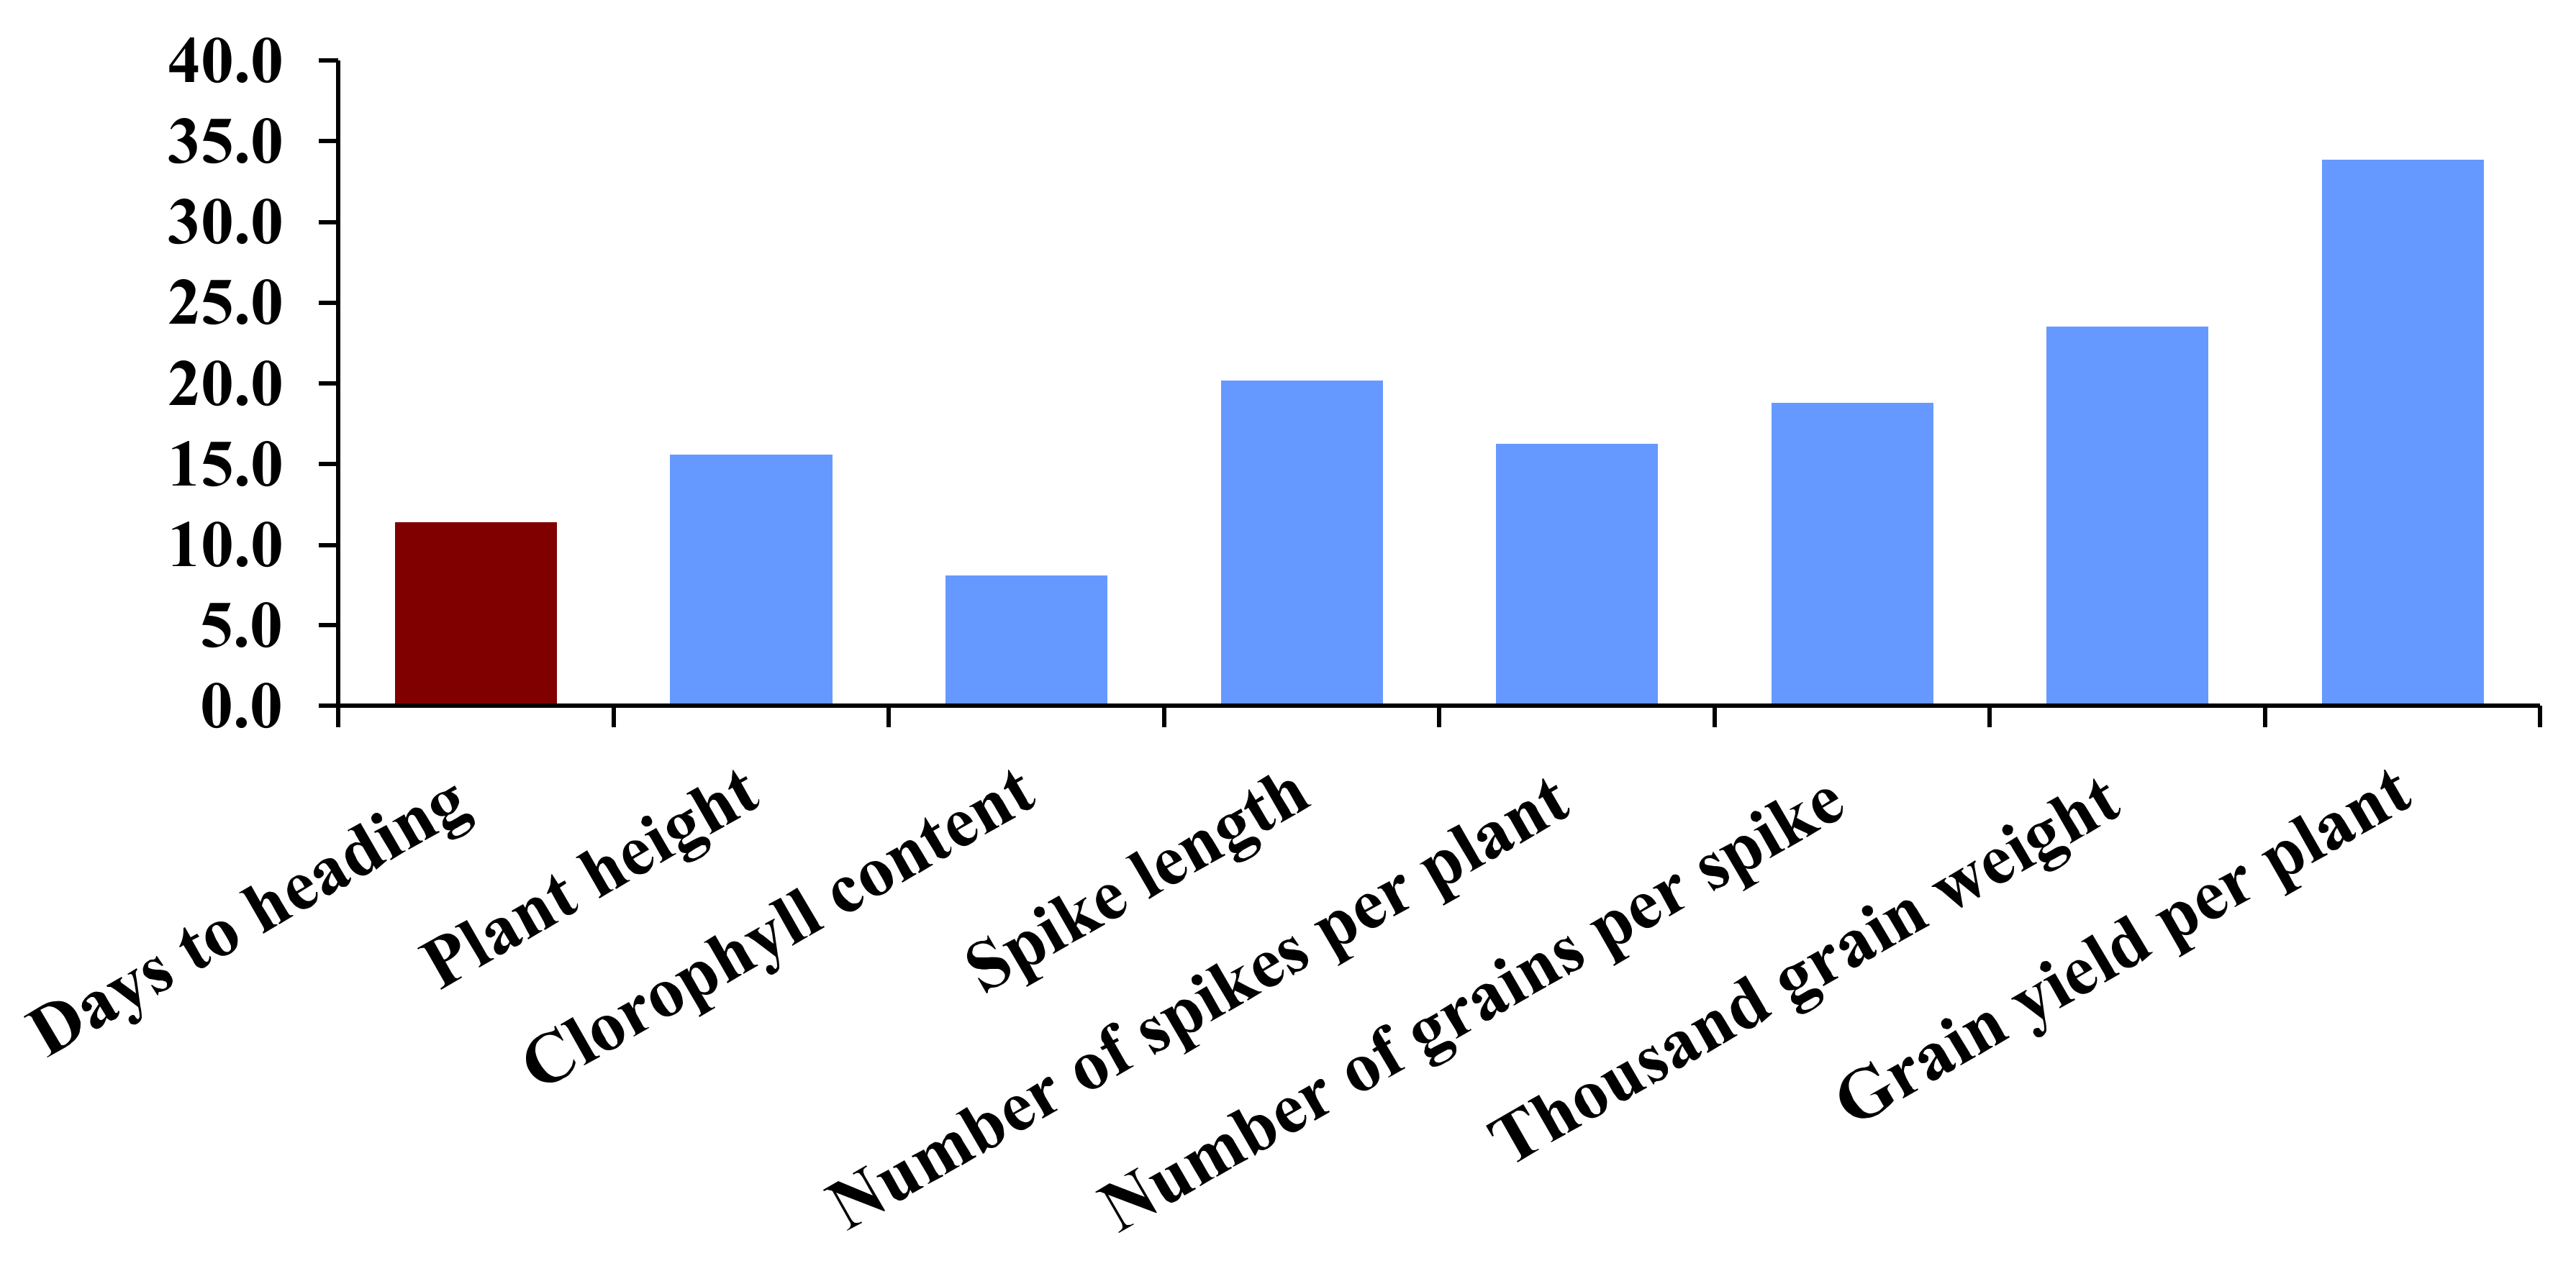
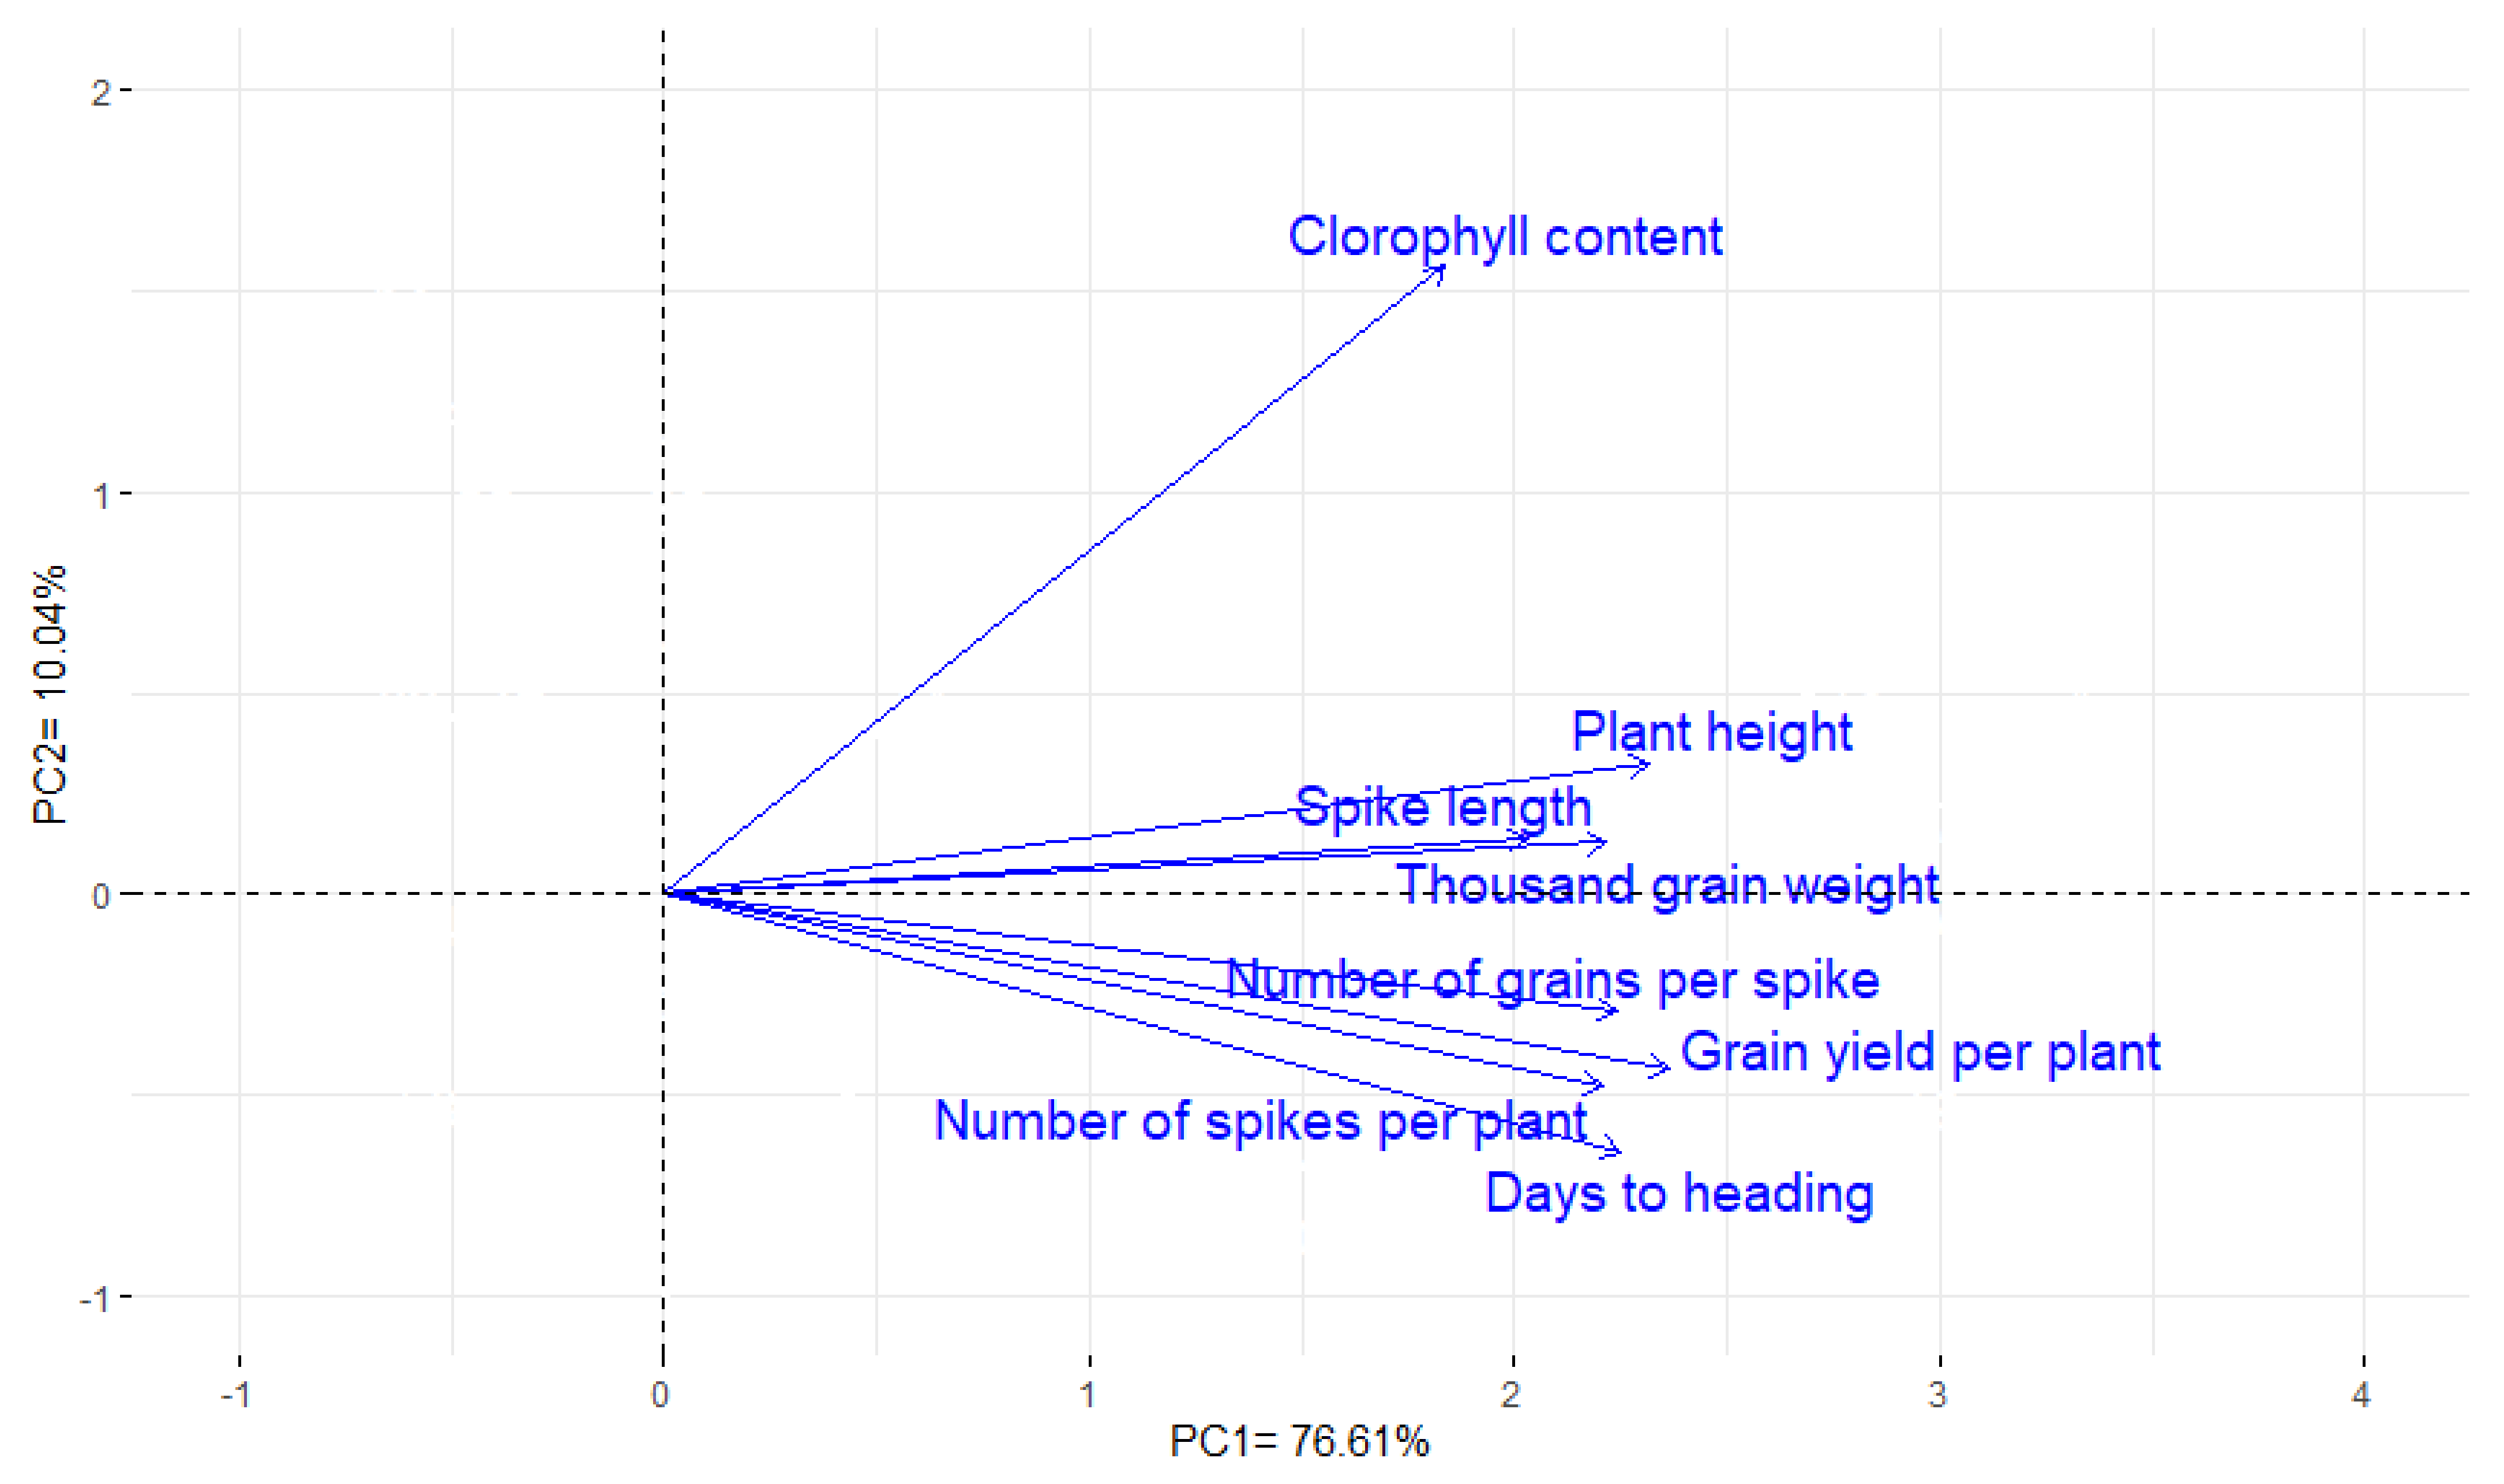
3.10. Interrelationship among Traits

Principal components were estimated to visualize the association among evaluated traits. The first two principal components reflected most of the variance, about 86.65% (76.61% and 10.04% by PC1 and PC2, respectively). Hence, the two PCs were employed to construct the PC-biplot (Figure 10). The acute angles among trait vectors reveal a robust positive association, while, opposite vectors imply to negative association among traits. Accordingly, a strong positive association was demonstrated between grain yield per plant and each of CHLC, PH, SL, NSPP, NGPS, and TGW.

4. Discussion

Detected significant variations for measured agronomic traits revealed considerable differences between used locations, sowing dates, and adequate genetic variability among parents and their progenies. The exposed genetic variations are useful for developing heat-tolerant and climate-resilient cultivars [54]. In this context, high genetic variability for different agronomic traits has been elucidated in wheat under different environments by Farooq et al. [22], Shaukat et al. [55], and Fleitas et al. [56]. The significant interaction between genotype and environment (locations and sowing dates) indicates that genotype ranking was not stable across environments. Moreover, the significant interactions of GCA × L, SCA × L, GCA × SD, and SCA × SD for most traits signify that the GCA effects of the parents and SCA of F1 hybrids were not stable under contrasting environments. This proposes prospects to identify genotypes with specific or broad adaptation to optimal and late sowing conditions which coincides with Aziz et al. [57], Tadesse et al. [58].
Timely sowing displayed the highest yield performance of all evaluated genotypes across two locations. Temperature rising due to late sowing considerably declined grain yield and its attributes, especially at El-Kharga. El-Kharga is characterized by high annual temperature. Hence, the substantial reduction in yield-related traits could be resulted from accelerating growth caused by high temperatures during the life cycle. This adverse effect was further elevated by terminal heat stress occurrence under late sowing that steeply reduced all agronomic traits. This emphasizes that El-Kharga is a heat-stressed environment and could be employed for identifying heat-tolerant genotypes. Reduction in chlorophyll content under late sowing was due to damaged chloroplast structure which resulted from high-temperature effects [19]. The deterioration of chlorophyll content and plant photosynthetic activity in wheat genotypes in response to terminal heat stress also was disclosed previously by Haque et al. [59], and Elbasyoni [19]. Heat stress also hindered the cell division process and accordingly plant height [60]. Grain yield per plant was the most impacted trait by heat stress with a decline of 36.46% (Figure 5). In this perspective, Elbasyoni [19] depicted a reduction in wheat grain yield by 40.32% under terminal heat stress conditions induced by delaying sowing date. Moreover, Schittenhelm et al. [61] displayed a great diminishing in wheat grain yield by 57.3% due to severe heat stress during grain filling. The considerable drop in grain yield under late sowing resulted from a decline in yield attributes especially number of grain per spike (19.15%) and 1000-grain weight (23.83%). The decline in number of grains/spike might be due to low pollen viability and ovule fertilization as a result of increased temperature during anthesis stage [13,21]. Exposure to high temperature after anthesis reduces grain filling rate and limits the supply of assimilating to developing grains which resulting in deteriorating grain weight [16,17]. The observed reduction in yield attributes traits in the current study is in consonance with earlier reports on wheat response to heat stress as reported by Tariq et al. [21], Talukder et al. [62], Akter and Islam [63], and Khan et al. [64].
The progress of breeding programs is depending predominantly on the precision identification of used parents [26,65,66,67]. Numerous cycles of crossing and selection among used parents and their progenies are needed to improve gene pyramiding and to fix promising recombinants [68,69,70]. The GCA effect is a critical indicator of genotypes’ ability for breeding superior genotypes. In the present study, high GCA values were scattered among the parents and changed across tested environments, which confirms the effects of environments on GCA estimates. The significant and negative GCA effects for DTH demonstrated by P2, P4, and P6 across all tested environments, suggested that these parents could be important sources of favorable alleles for earliness. Early heading has significant benefits for escaping terminal heat stress under late sowing conditions as suggested by Al-Ashkar et al. [30]. Likewise, the parents P4 and P6 were identified as excellent combiners for developing short stature cultivars which is important for lodging tolerance. The parents P1 and P3 were determined as good combiners for increasing chlorophyll content across all tested environments. The parents P1, P2, P4, and P5 could be promising combiners for grain yield and certain of its attributes. Thus, these parents could transmit favorable alleles for high grain yield to their offspring and increase grain yield under heat stress conditions. Interestingly, the parents P2 and P4 had desirable GCA effects for grain yield, and also were excellent combiner for earliness. Consequently, the beneficial alleles of these genotypes could be exploited in breeding early and high-yielding genotypes under heat stress conditions. Previous studies also stated significant GCA effects for yield and yield attributes in wheat under optimal and late sowing conditions [20,30].
Dehydrins (DHNs) are embryonic abundant proteins described by the dehydrin domains that are involved in plant tolerance to heat stress [71]. Phylogenetic analysis revealed that the dehydrin gene had the highest sequence similarity and identity with heat shock transcription factors of Aegilops tauschii [72]. The results revealed numerous single nucleotide polymorphisms (57 SNPs), positions in dehydrin gene sequence. The consensus sequence of dehydrin gene revealed substantial genetic diversity in all evaluated wheat parental genotypes. The parents P2 and P4 were the highest homologies for dehydrin gene sequence with heat and drought-tolerant species Triticum aestivum, Triticum dicoccoides, and Aegilops tauschii). Interestingly, P2 and P4 exhibited consistent positive GCA effects as well as cross combinations P2 × P4 and P3 × P5 showed positive and significant SCA effects for grain yield under heat stress environment (E4). Moreover, these parents and cross combinations had the highest tolerance indices values and were grouped in group A in the cluster of El-Kharga, which is characterized by high annual temperature. This suggests well-adaptability of these genotypes for heat stress which does not differ much in DHN gene sequence [73]. The identified SNPs in dehydrin gene were related to the differences in levels of heat tolerance among wheat parental genotypes. Additionally, differences associated with sequence transition in dehydration tolerance among wheat genotypes were associated with identified SNP in TaMYB2 gene [36,74]. In this context, Longmei et al. [75] manifested that a set of 176 SNPs were associated with the agronomic traits under heat stress conditions. Out of these, certain SNPs within different gene models were associated with heat tolerance.
Hybrid combinations with high SCA effects are distinctive candidates for selection in transgressive segregants. SCA estimations demonstrated that all realized hybrids exhibited significant SCA effects in a desirable direction for at least one characteristic. The crosses, P1 × P5, P1 × P6, P2 × P3, P2 × P4, P2 × P5, and P3 × P5 proved significantly positive SCA effects for grain yield across optimal and heat stress conditions. These crosses were derived from parents with good × good or good × poor general combiners. Likewise, Mwadzingeni et al. [69] manifested that presence of at least one good general combiner is essential for securing good specific cross combinations. Notably, none of the tested hybrids had significant SCA effects for all studied traits. Notwithstanding, the hybrid P2 × P4 was good hybrid combination for number of grain/spike, thousand-grain weight, spike length, and grain yield/plant. Moreover, P1 × P5, P1 × P6, and P3 × P5 were well-combined for number of spikes/plant, number of grain/spike, and grain yield/plant. Hence, desirable segregants could be expected from these crosses. Furthermore, these hybrids exhibited significant and positive mid and better parent heterotic effects for grain yield and other attributes traits. Accordingly, these hybrids could be effectively utilized in the wheat breeding programs to increase grain yield under optimal and heat stress conditions. Heterosis over mid and better parents was formerly elucidated for different agronomic traits for improving wheat under heat stress and optimal conditions [30,76,77,78].
Using several tolerance indices for identifying tolerant genotypes provides valuable information and improves the precision in classifying the genotypes. In the current study, cluster analysis based on different tolerance indices was employed to differentiate heat-tolerant and heat-sensitive genotypes. The analysis clustered the evaluated genotypes into four groups (a–d) ranged from tolerant to sensitive genotypes. The genotypes P2, P4, P2 × P4, and P2 × P5 were distinguished to be heat-tolerant (Figure 6B). Moreover, these genotypes exhibited the least values on the PCs of AMMI, hence revealing good stability under the tested environments (Figure 7). Thereupon, these results corroborate that these genotypes could be exploited in wheat breeding programs for increasing grain yield under heat stress conditions. Correspondingly, several studies applied cluster and AMMI analyses to classify wheat genotypes under different environments and considered these statistical approaches quite useful [20,79,80,81,82].
The significant estimates of GCA and SCA effects indicate that both additive and non-additive gene effects are involved in controlling all studied traits. However, the non-additive gene action was predominant for most traits under both sowing dates. The results were robustly supported by higher values of dominance component (H1 and H2) and low δ2 GCA/δ2 SCA ratio (less than the unity) for most evaluated traits. This was also confirmed by the average degree of dominance (H1/D) 0.5 values, which were more than the unity, indicating the presence of over dominance. Similarly, Riaz et al. [20] stated that the non-additive gene effects were preponderant for several agronomic traits in wheat including grain yield under optimal and late sowing. These findings concur with Sharma et al. [35] who disclosed that the non-additive gene action was crucial in the expression of grain yield under heat stress conditions. Likewise, Farooq et al. [22], manifested that non-additive gene action is more important in regulating grain yield inheritance in wheat under different temperature regimes. Considering the dominance components, the magnitude of H1 was larger than H2, signifying an unequal allele frequency in the parents at all loci for evaluated traits. This was also verified by the H2/4H1 ratio, which was less than the maximum value (0.25). The positive F value for most studied traits hinted that the frequency of dominant alleles was greater than the recessive ones in the parents, and this was further reinforced by the ratio of KD/KR, which was higher than the unity. The observed low to moderate narrow sense heritability values for all traits are associated with non-additive gene action as in cases like the current study. This suggested that selection could be less effective in the segregated generations. Consequently, recurrent and pedigree selection in advanced generations could be recommended for improving studied traits under timely and late sowing dates. These findings coincide with the results of Sareen et al. [83] who situated moderately to low narrow-sense heritability values for yield traits under heat stress and optimal conditions.
Grain yield and its related traits are important criteria for exploring genotypic responses to heat stress and determining heat-tolerant and high-yielding genotypes. Number of spikes per plant, number of grains per spike, thousand-grain weight exhibited a strong positive relationship with grain yield, which signifies their significance as crucial traits for indirect selection, especially in the segregated generations under heat stress (Figure 10). These traits are easier to record in comparison with grain yield, which is beneficial in the early generations. Similarly, a positive relationship between grain yield and attributed traits under heat stress and normal conditions was proved by Modarresi et al. [84], Tadesse et al. [58], and Elbasyoni [19]. Furthermore, a strong positive relationship was detected between chlorophyll content and grain yield indicating that it could be employed as an indirect selection criterion to select high-yielding wheat genotypes under heat stress conditions. Similar findings were confirmed by Pandey et al. [85], Yıldırım et al. [86], as they observed a significant positive association between grain yield and chlorophyll content under heat stress conditions. Moreover, the presence positive relationship between plant height and grain yield is an advantage in breeding for heat tolerance. Since plant height is easier to record and is considered a surrogate of aerial biomass. Likewise, Elbasyoni [19] and Aziz et al. [57] depicted a positive association between plant height and grain yield under heat stress conditions.

5. Conclusions

Highly genetic variations were detected among parents and their F1 hybrids for all measured traits under heat stress and optimal conditions. The parental genotypes P2 and P4 and their hybrid combination are proposed for developing high-yielding, heat-tolerant, and climate-resilient wheat genotypes. Moreover, the crosses, P1 × P5, P1 × P6, P2 × P4, and P3 × P5 were the most promising combinations for increasing grain yield, particularly in heat prone areas. The inheritance of grain yield and most of the measured traits were greatly regulated by non-additive gene effects relative to the additive gene effects. Several plant traits, including plant height, chlorophyll content, number of grains/spike, and thousand-grain weight were identified as indirect selection criteria for developing heat-tolerant genotypes due to their positive associations with grain yield.

Supplementary Materials

The following are available online at https://www.mdpi.com/article/10.3390/agronomy11081450/s1, Figure S1: The proposed amino acid sequences were inferred from Mega X software. The sequences illustrate that P2 and P4 are similar in amino acid sequences to the heat stress resistance genotypes (Triticum aestivum, Triticum dicoccoides and Aegilops, Table S1: Code, name, pedigree and source of the ten parental maize inbred lines. Table S2: Main soil physico-chemical analysis before wheat cultivation at Sakha. Table S3: Main soil physico-chemical analysis before wheat cultivation at El-Kharga. Table S4: Minimum, maximum and mean values of all the studied traits under two sowing dates across two locations.

Author Contributions

Conceptualization, M.M.K., K.M.I., E.M., A.M.S.K., M.O.G. and M.R.; methodology, M.M.K., K.M.I., E.M., A.M.S.K., M.O.G., D.A.E.-M., M.I.M., A.Y.A., M.A.F. and M.R.; software, M.M.K., K.M.I., E.M. and M.R.; validation, M.M.K., K.M.I., E.M., A.M.S.K., M.O.G., D.A.E.-M., M.I.M., A.Y.A., M.A.F. and M.R.; formal analysis, M.M.K., K.M.I., E.M. and M.R.; investigation, M.M.K., K.M.I., E.M., A.M.S.K., M.O.G., D.A.E.-M., M.I.M., A.Y.A., M.A.F. and M.R.; resources, M.M.K., K.M.I. and M.R.; data curation, M.M.K., K.M.I., E.M., A.M.S.K., M.O.G., D.A.E.-M., M.I.M., A.Y.A., M.A.F. and M.R.; writing—original draft preparation, M.M.K., K.M.I., E.M. and M.R.; writing—review and editing, M.M.K., K.M.I., E.M., A.M.S.K., M.O.G., D.A.E.-M., M.I.M., A.Y.A., M.A.F. and M.R.; visualization, M.M.K., K.M.I., E.M., A.M.S.K., M.O.G., D.A.E.-M., M.I.M., A.Y.A., M.A.F. and M.R.; supervision, M.M.K., K.M.I. and M.R.; funding acquisition, M.M.K., K.M.I. and M.R. All authors have read and agreed to the published version of the manuscript.

Funding

This research received no external funding.

Institutional Review Board Statement

Not applicable.

Informed Consent Statement

Not applicable.

Data Availability Statement

The data presented in this study are available upon request from the corresponding author.

Acknowledgments

The authors are grateful to the Faculty of Agriculture, Kafrelsheikh University, Egypt, Agricultural Research Center and the Faculty of Agriculture, New Valley University, Egypt for their support provided to conduct this work.

Conflicts of Interest

The authors declare no conflict of interest.

References

  1. FAOSTAT. Food and Agriculture Organization of the United Nations. Statistical Database. Available online: http://www.fao.org/home/en/ (accessed on 13 May 2021).
  2. Shewry, P.R.; Hey, S.J. The contribution of wheat to human diet and health. Food Energy Secur. 2015, 4, 178–202. [Google Scholar] [CrossRef]
  3. Joye, I.J. Dietary Fibre from Whole Grains and Their Benefits on Metabolic Health. Nutrients 2020, 12, 3045. [Google Scholar]
  4. Asseng, S.; Kheir, A.M.; Kassie, B.T.; Hoogenboom, G.; Abdelaal, A.I.; Haman, D.Z.; Ruane, A.C. Can Egypt become self-sufficient in wheat? Environ. Res. Lett. 2018, 13, 094012. [Google Scholar] [CrossRef] [Green Version]
  5. Attia, A.; El-Hendawy, S.; Al-Suhaibani, N.; Tahir, M.U.; Mubushar, M.; dos Santos Vianna, M.; Ullah, H.; Mansour, E.; Datta, A. Sensitivity of the DSSAT model in simulating maize yield and soil carbon dynamics in arid Mediterranean climate: Effect of soil, genotype and crop management. Field Crops Res. 2021, 260, 107981. [Google Scholar] [CrossRef]
  6. Yang, X.; Tian, Z.; Sun, L.; Chen, B.; Tubiello, F.N.; Xu, Y. The impacts of increased heat stress events on wheat yield under climate change in China. Clim. Chang. 2017, 140, 605–620. [Google Scholar] [CrossRef]
  7. Mansour, E.; Merwad, A.; Yasin, M.; Abdul-Hamid, M.; El-Sobky, E.; Oraby, H. Nitrogen use efficiency in spring wheat: Genotypic variation and grain yield response under sandy soil conditions. J. Agric. Sci. 2017, 155, 1407–1423. [Google Scholar] [CrossRef]
  8. Stocker, T.F.; Qin, D.; Plattner, G.-K.; Tignor, M.M.; Allen, S.K.; Boschung, J.; Nauels, A.; Xia, Y.; Bex, V.; Midgley, P.M. Climate Change 2013: The Physical Science Basis. In Contribution of Working Group I to the Fifth Assessment Report of IPCC the Intergovernmental Panel on Climate Change; Cambridge University Press: Cambridge, UK; New York, NY, USA, 2014; p. 1535. [Google Scholar]
  9. Lobell, D.B.; Burke, M.B.; Tebaldi, C.; Mastrandrea, M.D.; Falcon, W.P.; Naylor, R.L. Prioritizing climate change adaptation needs for food security in 2030. Science 2008, 319, 607–610. [Google Scholar] [CrossRef]
  10. Asseng, S.; Ewert, F.; Martre, P.; Rötter, R.P.; Lobell, D.B.; Cammarano, D.; Kimball, B.A.; Ottman, M.J.; Wall, G.; White, J.W. Rising temperatures reduce global wheat production. Nat. Clim. Chang. 2015, 5, 143–147. [Google Scholar] [CrossRef]
  11. Djanaguiraman, M.; Narayanan, S.; Erdayani, E.; Prasad, P.V. Effects of high temperature stress during anthesis and grain filling periods on photosynthesis, lipids and grain yield in wheat. BMC Plant Biol. 2020, 20, 268. [Google Scholar] [CrossRef]
  12. Prasad, P.V.; Djanaguiraman, M. Response of floret fertility and individual grain weight of wheat to high temperature stress: Sensitive stages and thresholds for temperature and duration. Funct. Plant Biol. 2014, 41, 1261–1269. [Google Scholar] [CrossRef] [Green Version]
  13. Tashiro, T.; Wardlaw, I. The response to high temperature shock and humidity changes prior to and during the early stages of grain development in wheat. Funct. Plant Biol. 1990, 17, 551–561. [Google Scholar] [CrossRef]
  14. Moustafa, E.S.; El-Sobky, E.-S.E.; Farag, H.I.; Yasin, M.A.; Attia, A.; Rady, M.O.; Awad, M.F.; Mansour, E. Sowing date and genotype influence on yield and quality of dual-purpose barley in a salt-affected arid region. Agronomy 2021, 11, 717. [Google Scholar] [CrossRef]
  15. Yang, J.; Sears, R.; Gill, B.; Paulsen, G. Growth and senescence characteristics associated with tolerance of wheat-alien amphiploids to high temperature under controlled conditions. Euphytica 2002, 126, 185–193. [Google Scholar] [CrossRef]
  16. Wardlaw, I.; Wrigley, C. Heat tolerance in temperate cereals: An overview. Funct. Plant Biol. 1994, 21, 695–703. [Google Scholar] [CrossRef]
  17. Wiegand, C.; Cuellar, J. Duration of grain filling and kernel weight of wheat as affected by temparature. Crop Sci. 1981, 21, 95–101. [Google Scholar] [CrossRef]
  18. Al-Khatib, K.; Paulsen, G.M. Mode of high temperature injury to wheat during grain development. Physiol. Plant. 1984, 61, 363–368. [Google Scholar] [CrossRef]
  19. Elbasyoni, I.S. Performance and stability of commercial wheat cultivars under terminal heat stress. Agronomy 2018, 8, 37. [Google Scholar] [CrossRef] [Green Version]
  20. Riaz, M.W.; Yang, L.; Yousaf, M.I.; Sami, A.; Mei, X.D.; Shah, L.; Rehman, S.; Xue, L.; Si, H.; Ma, C. Effects of heat stress on growth, physiology of plants, yield and grain quality of different spring wheat (Triticum aestivum L.) genotypes. Sustainability 2021, 13, 2972. [Google Scholar] [CrossRef]
  21. Tariq, A.; Ashraf, I.; Ahmed, M.; Muscolo, A.; Basra, S.; Reynolds, M. Evaluation of physiological and morphological traits for improving spring wheat adaptation to terminal heat stress. Plants 2021, 10, 455. [Google Scholar]
  22. Farooq, J.; Khaliq, I.; Ali, M.A.; Kashif, M.; Rehman, A.U.; Naveed, M.; Ali, Q.; Nazeer, W.; Farooq, A. Inheritance pattern of yield attributes in spring wheat at grain filling stage under different temperature regimes. Aust. J. Crop Sci. 2011, 5, 1745–1753. [Google Scholar]
  23. Abaza, G.M.S.M.; Awaad, H.A.; Attia, Z.M.; Abdel-lateif, K.S.; Gomaa, M.A.; Abaza, S.M.S.M.; Mansour, E. Inducing potential mutants in bread wheat using different doses of certain physical and chemical mutagens. Plant Breed. Biotech. 2020, 8, 252–264. [Google Scholar] [CrossRef]
  24. Mansour, E.; Moustafa, E.S.; Qabil, N.; Abdelsalam, A.; Wafa, H.A.; El Kenawy, A.; Casas, A.M.; Igartua, E. Assessing different barley growth habits under Egyptian conditions for enhancing resilience to climate change. Field Crops Res. 2018, 224, 67–75. [Google Scholar] [CrossRef]
  25. Moustafa, E.S.; Ali, M.; Kamara, M.M.; Awad, M.F.; Hassanin, A.A.; Mansour, E. Field screening of wheat advanced lines for salinity tolerance. Agronomy 2021, 11, 281. [Google Scholar] [CrossRef]
  26. Salem, T.; Rabie, H.; Mowafy, S.; Eissa, A.; Mansour, E. Combining ability and genetic components of egyptian cotton for earliness, yield, and fiber quality traits. SABRAO J. Breed. Genet. 2020, 52, 369–389. [Google Scholar]
  27. Kamara, M.M.; Ghazy, N.A.; Mansour, E.; Elsharkawy, M.M.; Kheir, A.; Ibrahim, K.M. Molecular genetic diversity and line × tester analysis for resistance to late wilt disease and grain yield in maize. Agronomy 2021, 11, 898. [Google Scholar] [CrossRef]
  28. Celliers, P.; Labuschagne, M.; Van Deventer, C. Combining ability effects of some spring wheat cultivars at two different temperature levels. S. Afr. J. Plant Soil 1999, 16, 15–17. [Google Scholar] [CrossRef] [Green Version]
  29. Sharma, S.; Menon, U.; Sain, R. Combining ability for physiological traits in spring wheat over environments. Acta Agron. Hung. 2004, 52, 63–68. [Google Scholar] [CrossRef]
  30. Al-Ashkar, I.; Alotaibi, M.; Refay, Y.; Ghazy, A.; Zakri, A.; Al-Doss, A. Selection criteria for high-yielding and early-flowering bread wheat hybrids under heat stress. PLoS ONE 2020, 15, e0236351. [Google Scholar] [CrossRef]
  31. Adel, M.; Ali, E. Gene action and combining ability in a six parent diallel cross of wheat. Asian J. Crop Sci. 2013, 5, 14–23. [Google Scholar] [CrossRef]
  32. Kumar, A.; Mishra, V.; Vyas, R.; Singh, V. Heterosis and combining ability analysis in bread wheat (Triticum aestivum L.). J. Plant Breed. Crop Sci. 2011, 3, 209–217. [Google Scholar]
  33. Borghi, B.; Perenzin, M. Diallel analysis to predict heterosis and combining ability for grain yield, yield components and bread-making quality in bread wheat (T. aestivum). Theor. Appl. Genet. 1994, 89, 975–981. [Google Scholar] [CrossRef]
  34. Hei, N.; Hussein, S.; Laing, M. Heterosis and combining ability analysis of slow rusting stem rust resistance and yield and related traits in bread wheat. Euphytica 2016, 207, 501–514. [Google Scholar] [CrossRef]
  35. Sharma, D.; Jaiswal, J.P.; Gahtyari, N.C.; Chauhan, A.; Singh, N.K. Genetic dissection of physiological traits over trait based breeding in bread wheat conferring terminal heat tolerance. Cereal Res. Commun. 2021, 1–9. [Google Scholar] [CrossRef]
  36. Garg, B.; Lata, C.; Prasad, M. A study of the role of gene TaMYB2 and an associated SNP in dehydration tolerance in common wheat. Mol. Biol. Rep. 2012, 39, 10865–10871. [Google Scholar] [CrossRef]
  37. Zotova, L.; Kurishbayev, A.; Jatayev, S.; Khassanova, G.; Zhubatkanov, A.; Serikbay, D.; Sereda, S.; Sereda, T.; Shvidchenko, V.; Lopato, S. Genes encoding transcription factors TaDREB5 and TaNFYC-A7 are differentially expressed in leaves of bread wheat in response to drought, dehydration and ABA. Front. Plant Sci. 2018, 9, 1441. [Google Scholar] [CrossRef]
  38. Lai, K.; Duran, C.; Berkman, P.J.; Lorenc, M.T.; Stiller, J.; Manoli, S.; Hayden, M.J.; Forrest, K.L.; Fleury, D.; Baumann, U. Single nucleotide polymorphism discovery from wheat next-generation sequence data. Plant Biotechnol. J. 2012, 10, 743–749. [Google Scholar] [CrossRef] [Green Version]
  39. Edae, E.A.; Byrne, P.F.; Manmathan, H.; Haley, S.D.; Moragues, M.; Lopes, M.S.; Reynolds, M.P. Association mapping and nucleotide sequence variation in five drought tolerance candidate genes in spring wheat. Plant Genome 2013, 6, 1–13. [Google Scholar] [CrossRef] [Green Version]
  40. Rustamova, S.; Shrestha, A.; Naz, A.A.; Huseynova, I. Expression profiling of DREB1 and evaluation of vegetation indices in contrasting wheat genotypes exposed to drought stress. Plant Gene 2021, 25, 100266. [Google Scholar] [CrossRef]
  41. Saghai-Maroof, M.A.; Soliman, K.M.; Jorgensen, R.A.; Allard, R. Ribosomal DNA spacer-length polymorphisms in barley: Mendelian inheritance, chromosomal location, and population dynamics. Proc. Natl. Acad. Sci. USA 1984, 81, 8014–8018. [Google Scholar] [CrossRef] [PubMed] [Green Version]
  42. Badr, S.; Bahieldin, A.; Abdelgawad, B.; Badr, A. Construction of a dehydrin gene cassette for drought tolerance from wild origin for wheat transformation. Int. J. Bot. 2005, 1, 175–182. [Google Scholar] [CrossRef]
  43. Wang, Y.; Xu, H.; Zhu, H.; Tao, Y.; Zhang, G.; Zhang, L.; Zhang, C.; Zhang, Z.; Ma, Z. Classification and expression diversification of wheat dehydrin genes. Plant Sci. 2014, 214, 113–120. [Google Scholar] [CrossRef] [PubMed]
  44. Kumar, S.; Stecher, G.; Li, M.; Knyaz, C.; Tamura, K. MEGA X: Molecular evolutionary genetics analysis across computing platforms. Mol. Biol. Evol. 2018, 35, 1547–1549. [Google Scholar] [CrossRef] [PubMed]
  45. Gomez, K.A.; Gomez, A.A. Statistical Procedures For Agricultural Research; John Wiley & Sons: Hoboken, NJ, USA, 1984. [Google Scholar]
  46. Griffing, B. Concept of general and specific combining ability in relation to diallel crossing systems. Aust. J. Biol. Sci. 1956, 9, 463–493. [Google Scholar] [CrossRef]
  47. Hayman, B. The analysis of variance of diallel tables. Biometrics 1954, 10, 235–244. [Google Scholar] [CrossRef]
  48. Mather, K.; Jinks, J.L. Components of Means: Additive and Dominance Effects. In Biometrical Genetics; Springer: Berlin/Heidelberg, Germany, 1971; pp. 65–82. [Google Scholar]
  49. Fonsecca, S.; Patterson, F. Hybrid vigour in seven-parent diallel cross in common wheat (T. aestivum L.). Crop Sci. 1968, 2, 85–88. [Google Scholar] [CrossRef]
  50. Rosielle, A.; Hamblin, J. Theoretical aspects of selection for yield in stress and non-stress environment 1. Crop Sci. 1981, 21, 943–946. [Google Scholar] [CrossRef]
  51. Fernandez, G.C. Effective selection criteria for assessing plant stress tolerance. In Proceedings of the International Symposium on Adaptation of Vegetables and other Food Crops in Temperature and Water Stress, Shanhua, Taiwan, 13–16 August 1992; pp. 257–270. [Google Scholar]
  52. Gavuzzi, P.; Rizza, F.; Palumbo, M.; Campanile, R.; Ricciardi, G.; Borghi, B. Evaluation of field and laboratory predictors of drought and heat tolerance in winter cereals. Can. J. Plant Sci. 1997, 77, 523–531. [Google Scholar] [CrossRef]
  53. Ward, J.H., Jr. Hierarchical grouping to optimize an objective function. J. Am. Stat. Assoc. 1963, 58, 236–244. [Google Scholar] [CrossRef]
  54. Gharib, M.A.A.H.; Qabil, N.; Salem, A.H.; Ali, M.M.A.; Awaad, H.A.; Mansour, E. Characterization of wheat landraces and commercial cultivars based on morpho-phenological and agronomic traits. Cereal Res. Commun. 2021, 49, 149–159. [Google Scholar] [CrossRef]
  55. Shaukat, S.; Khan, A.S.; Hussain, M.; Kashif, M.; Ahmed, N. Selection of superior parents and cross combinations for quality traits in bread wheat (Triticum aestivum L.) under normal and heat stressed conditions. Pak. J. Agric. Sci. 2018, 55, 801–807. [Google Scholar]
  56. Fleitas, M.C.; Mondal, S.; Gerard, G.S.; Hernández-Espinosa, N.; Singh, R.P.; Crossa, J.; Guzmán, C. Identification of CIMMYT spring bread wheat germplasm maintaining superior grain yield and quality under heat-stress. J. Cereal Sci. 2020, 93, 102981. [Google Scholar] [CrossRef]
  57. Aziz, A.; Mahmood, T.; Mahmood, Z.; Shazadi, K.; Mujeeb-Kazi, A.; Rasheed, A. Genotypic variation and genotype × environment interaction for yield-related traits in synthetic hexaploid wheats under a range of optimal and heat-stressed environments. Crop Sci. 2018, 58, 295–303. [Google Scholar] [CrossRef]
  58. Tadesse, W.; Suleiman, S.; Tahir, I.; Sanchez-Garcia, M.; Jighly, A.; Hagras, A.; Thabet, S.; Baum, M. Heat-tolerant QTLs associated with grain yield and its components in spring bread wheat under heat-stressed environments of Sudan and Egypt. Crop Sci. 2019, 59, 199–211. [Google Scholar] [CrossRef] [Green Version]
  59. Haque, M.S.; Kjaer, K.H.; Rosenqvist, E.; Sharma, D.K.; Ottosen, C.-O. Heat stress and recovery of photosystem II efficiency in wheat (Triticum aestivum L.) cultivars acclimated to different growth temperatures. Environ. Exp. Bot. 2014, 99, 1–8. [Google Scholar] [CrossRef]
  60. Singh, J.P.; Shambhoo, P.; Singh, K.; Randhir, S. Screening of heat tolerant wheat varieties by membrane thermostability index in relation to yield and yield attributing traits. Int. J. Plant Sci. 2007, 2, 159–165. [Google Scholar]
  61. Schittenhelm, S.; Langkamp-Wedde, T.; Kraft, M.; Kottmann, L.; Matschiner, K. Effect of two-week heat stress during grain filling on stem reserves, senescence, and grain yield of European winter wheat cultivars. J. Agron. Crop Sci. 2020, 206, 722–733. [Google Scholar] [CrossRef] [Green Version]
  62. Talukder, A.; McDonald, G.K.; Gill, G.S. Effect of short-term heat stress prior to flowering and early grain set on the grain yield of wheat. Field Crops Res. 2014, 160, 54–63. [Google Scholar] [CrossRef]
  63. Akter, N.; Islam, M.R. Heat stress effects and management in wheat. A review. Agron. Sustain. Dev. 2017, 37, 1–17. [Google Scholar] [CrossRef]
  64. Khan, M.I.; Amin, M.; Shah, S.T. Agronomic evaluation of different bread wheat (Triticum aestivum L.) genotypes for terminal heat stress. Pak. J. Bot. 2007, 39, 2415–2425. [Google Scholar]
  65. Fasahat, P.; Rajabi, A.; Rad, J.; Derera, J. Principles and utilization of combining ability in plant breeding. Biom. Biostat. Int. J. 2016, 4, 1–24. [Google Scholar] [CrossRef]
  66. Gracia, M.; Mansour, E.; Casas, A.; Lasa, J.; Medina, B.; Cano, J.L.M.; Moralejo, M.; López, A.; Fuster, P.L.; Escribano, J. Progress in the Spanish National Barley Breeding Program. Span. J. Agric. Res. 2012, 741–751. [Google Scholar] [CrossRef] [Green Version]
  67. Desoky, E.-S.M.; Mansour, E.; Yasin, M.A.; El Sobky, E.-S.E.; Rady, M.M. Improvement of drought tolerance in five different cultivars of Vicia faba with foliar application of ascorbic acid or silicon. Span. J. Agric. Res. 2020, 18, 16. [Google Scholar] [CrossRef]
  68. Joshi, R.K.; Nayak, S. Gene pyramiding-A broad spectrum technique for developing durable stress resistance in crops. Biotechnol. Mol. Biol. Rev. 2010, 5, 51–60. [Google Scholar]
  69. Mwadzingeni, L.; Shimelis, H.; Tsilo, T.J. Combining ability and gene action controlling yield and yield components in bread wheat (Triticum aestivum L.) under drought-stressed and nonstressed conditions. Plant Breed. 2018, 137, 502–513. [Google Scholar] [CrossRef]
  70. Desoky, E.-S.M.; Mansour, E.; Ali, M.M.A.; Yasin, M.A.T.; Abdul-Hamid, M.I.E.; Rady, M.M.; Ali, E.F. Exogenously used 24-epibrassinolide promotes drought tolerance in maize hybrids by improving plant and water productivity in an arid environment. Plants 2021, 10, 354. [Google Scholar] [CrossRef]
  71. Zhou, M.; Zheng, S.; Liu, R.; Lu, J.; Lu, L.; Zhang, C.; Liu, Z.; Luo, C.; Zhang, L.; Yant, L. Genome-wide identification, phylogenetic and expression analysis of the heat shock transcription factor family in bread wheat (Triticum aestivum L.). BMC Genom. 2019, 20, 505. [Google Scholar] [CrossRef]
  72. Barakat, M.N.; Al-Ashkar, I.M.; Al-Doss, A.A.; Moustafa, K.A.; Motawei, M.I.; Alamri, M.S.; Mergoum, M.; Sallam, M.S. Identification of genotyping-by-sequencing tags associated with bread-making quality traits in spring wheat under heat stress. Cereal Res. Commun. 2020, 48, 347–353. [Google Scholar] [CrossRef]
  73. Baloch, M.J.; Dunwell, J.; Khan, N.U.; Khakwani, A.A.; Dennett, M.; Jatoi, W.A. Profiling dehydrin gene sequence and physiological parameters in drought tolerant and susceptible spring wheat cultivars. Pak. J. Bot. 2012, 44, 801–806. [Google Scholar]
  74. Chen, Z.-X.; Deng, M.; Wang, J.-R. SNP Mining in functional genes from nonmodel species by next-generation sequencing: A case of flowering, pre-harvest sprouting, and dehydration resistant genes in wheat. BioMed Res. Int. 2016, 2016, 1–10. [Google Scholar] [CrossRef] [Green Version]
  75. Longmei, N.; Gill, G.K.; Zaidi, P.H.; Kumar, R.; Nair, S.K.; Hindu, V.; Vinayan, M.T.; Vikal, Y. Genome wide association mapping for heat tolerance in sub-tropical maize. BMC Genom. 2021, 22, 154. [Google Scholar] [CrossRef]
  76. Singh, M.; Sharma, P.; Tyagi, B.; Singh, G. Heterosis for yield component traits and protein content in bread wheat under normal and heat-stress environment. Cereal Res. Commun. 2014, 42, 151–162. [Google Scholar] [CrossRef]
  77. Singh, M.; Sharma, P. Relationship of heterosis for protein content with yield component trait (s) under normal/heat-stress environment in spring wheat. Crop Improv. 2012, 39, 8–17. [Google Scholar]
  78. Farooq, J.; Khaliq, I.; Akbar, M.; Kashif, M.; Mahpara, S. Hybrid vigor studies for different yield contributing traits in wheat under normal and heat stress conditions. Comun. Sci. 2013, 4, 139–152. [Google Scholar]
  79. EL-Hendawy, S.; Hu, Y.; Sakagami, J.-I.; Schmidhalter, U. Screening Egyptian wheat genotypes for salt tolerance at early growth stages. Int. J. Plant Prod. 2011, 5, 283–298. [Google Scholar]
  80. Mansour, E.; Moustafa, E.S.; Desoky, E.-S.M.; Ali, M.; Yasin, M.A.; Attia, A.; Alsuhaibani, N.; Tahir, M.U.; El-Hendawy, S. Multidimensional evaluation for detecting salt tolerance of bread wheat genotypes under actual saline field growing conditions. Plants 2020, 9, 1324. [Google Scholar] [CrossRef]
  81. Mansour, E.; Moustafa, E.S.; El-Naggar, N.Z.; Abdelsalam, A.; Igartua, E. Grain yield stability of high-yielding barley genotypes under Egyptian conditions for enhancing resilience to climate change. Crop Pasture Sci. 2018, 69, 681–690. [Google Scholar] [CrossRef]
  82. Mansour, E.; Desoky, E.-S.M.; Ali, M.M.; Abdul-Hamid, M.I.; Ullah, H.; Attia, A.; Datta, A. Identifying drought-tolerant genotypes of faba bean and their agro-physiological responses to different water regimes in an arid Mediterranean environment. Agric. Water Manag. 2021, 247, 106754. [Google Scholar] [CrossRef]
  83. Sareen, S.; Bhusal, N.; Singh, G.; Tyagi, B.; Tiwari, V.; Singh, G.; Sarial, A. Genetics of grain yield and its components in wheat under heat stress. Cereal Res. Commun. 2018, 46, 448–459. [Google Scholar] [CrossRef]
  84. Modarresi, M.; Mohammadi, V.; Zali, A.; Mardi, M. Response of wheat yield and yield related traits to high temperature. Cereal Res. Commun. 2010, 38, 23–31. [Google Scholar] [CrossRef]
  85. Pandey, G.C.; Mamrutha, H.; Tiwari, R.; Sareen, S.; Bhatia, S.; Siwach, P.; Tiwari, V.; Sharma, I. Physiological traits associated with heat tolerance in bread wheat (Triticum aestivum L.). Physiol. Mol. Biol. Plants 2015, 21, 93–99. [Google Scholar] [CrossRef] [Green Version]
  86. Yıldırım, M.; Koç, M.; Akıncı, C.; Barutçular, C. Variations in morphological and physiological traits of bread wheat diallel crosses under timely and late sowing conditions. Field Crops Res. 2013, 140, 9–17. [Google Scholar] [CrossRef]
Figure 1. Daily maximum and minimum temperatures (A), solar radiation (B), and precipitation (C) at the two locations.
Agronomy 11 01450 g001
Figure 2. Boxplots with minimum, maximum, median, and mean values for days to heading (A), plant height (B), chlorophyll content (C), spike length (D), number of spikes per plant (E), number of grains per spike (F), Thousand grain weight (G), and grain yield per plant (H).
Agronomy 11 01450 g002
Figure 3. Mean performance of the 21 wheat genotypes for days to heading (A), plant height (B), chlorophyll content (C), and spike length (D). The bars on the top of the columns correspond to LSD (p ≤ 0.05).
Agronomy 11 01450 g003
Figure 4. Mean performance of the 21 wheat genotypes the for number of spikes per plant (A), number of grains per spike (B), thousand grain weight (C), and grain yield per plant (D). The bars on the top of the columns correspond to LSD (p ≤ 0.05).
Agronomy 11 01450 g004
Figure 5. Effect of late sowing on each trait scored on the 21 wheat genotypes. Blue columns refer to the reduction on the trait and red column refers to the earliness in heading.
Agronomy 11 01450 g005
Figure 6. Dendrogram of the phenotypic distances among six wheat genotypes and their fifteen F1s based on four heat tolerance indices (geometric mean productivity GM, mean productivity MP, and yield index YI and stress tolerance index STI). The genotypes were classified into four groups; a is heat-tolerant, b intermediate heat-tolerant, c intermediate heat- sensitive, and d is heat-sensitive under Sakha (A) and El-Kharga (B).
Agronomy 11 01450 g006
Figure 7. AMMI biplot for grain yield of six wheat genotypes and their fifteen F1s were tested in four environments at Kafr El-Sheikh at El-Kharga under recommended sowing date and late sowing.
Agronomy 11 01450 g007
Figure 8. Constructed phylogenetic tree based on the dehydrin gene sequence. The tree contains two clades, the first one displayed heat-tolerant, and the second clade contains the sensitive ones.
Agronomy 11 01450 g008
Figure 9. Single nucleotide polymorphisms (SNPs) in dehydrin gene between tested parental genotypes and other tolerant species (Triticum aestivum, Triticum dicoccoides, and Aegilops tauschii).
Agronomy 11 01450 g009
Figure 10. Biplot of principal component analysis displaying the relationship among the studied traits.
Agronomy 11 01450 g010
Table 1. Combined analysis of variance for all studied traits across tested environments.
Source of VarianceDFDTHPHCHLCSLNSPPNGPSTGWGYPP
Location (L)130,426 **66,110 **333.3 **156.8 **1031 **20,858 **7641 **15,967 **
Replication/L48.5612.1710.440.743.6049.0028.4410.02
Sowing date (D)16131 **11,544 **846.8 **446.9 **505.4 **8157 **8480 **6005 **
L × D16.042.203.817.22 *2.354.950.084.37
Error 43.5810.468.150.372.7629.267.318.00
Genotype (G)2056.59 **126.9 **61.63 **3.17 **24.13 **302.9 **119.5 **142.7 **
GCA515.79 **156.7 **30.85 **3.89 **11.34 **425.9 **94.66 **46.53 **
SCA1570.18 **117.0 **71.89 **2.93 **28.40 **261.9 **127.8 **174.8 **
G × L2073.42 **52.37 **5.78 *7.52 **20.15 **188.7 **92.98 **170.9 **
GCA × L553.88 **30.12 **7.19 *6.63 **24.95 **161.7 **121. 0 **155.6 **
SCA × L1579.93 **59.79 **5.31 *7.82 **18.55 **197.7 **83.64 **175.9 **
G × D205.56 **20.46 **6.70 **0.60 *2.12 *49.15 **14.03 **11.29 **
GCA × D58.23 **12.635.980.591.7467.72 **11.82 *8.52 *
SCA × D154.68 **23.07 **6.95 **0.61 *2.24 *42.95 **14.77 **12.21 **
G × D × L203.02 **15.39 **10.23 **0.61 *2.24 *84.78 **15.90 **9.95 **
GCA × L × D53.92 *7.9213.60 **0.574.41 **78.15 **8.253.71
SCA × L × D152.72 *17.88 **9.11 **0.62 *1.5186.99 **18.45 **12.03 **
Pooled Error1601.437.392.950.331.227.254.253.73
GCA/SCA 0.231.340.431.330.401.630.740.27
GCA × L/SCA × L 0.670.501.350.851.350.821.450.88
GCA × D/SCA × D 1.760.550.860.960.781.580.800.70
* and ** indicate p-value < 0.05 and 0.01, respectively. DF is degree of freedom, DTH is days to heading, PH is plant height (cm), CHLC is chlorophyll content (SPAD reading), SL is spike length (cm), NSPP is number of spikes per plant, NGPS is number of grains per spike, TGW is 1000-grain weight (g) and GYPP is grain yield per plant (g).
Table 2. General combining ability effects (GCA) of the used parents for all evaluated traits under tested environments.
TraitEnvironmentParentsLSD (gi) 0.05LSD (gi) 0.01
P1P2P3P4P5P6
DTHE10.10−1.53 **−0.280.390.97 **0.350.490.66
E2−0.54 *−1.17 **1.33 **−0.08−0.170.63 *0.480.64
E31.06 **0.89 **0.14−0.99 **0.43−1.53 **0.440.58
E40.67 **0.92 **0.42 *−0.79 **0.21−1.42 **0.400.53
Combined0.32 **−0.22 *0.40 **−0.37 **0.36 **−0.49 **0.220.29
PHE1−0.380.512.56 **−3.60 **0.640.271.181.58
E20.570.731.23 *−1.85 **−0.810.131.071.43
E30.181.09 *0.66−1.90 **1.27 **−1.31 **0.941.25
E4−0.051.42 **0.91 *−1.54 **0.71−1.44 **0.881.18
Combined0.080.94 **1.34 **−2.22 **0.45−0.58 *0.500.66
CHLCE10.361.08 **0.41−0.61 *−0.42−0.82 **0.610.81
E20.52−0.71 *0.85 *−0.390.30−0.560.680.92
E30.58−0.200.470.02−0.36−0.510.690.92
E4−0.080.561.13 **0.95 **−0.76 *−1.80 **0.610.81
Combined0.34*0.180.71 **−0.01−0.31−0.92 **0.320.42
SLE1−0.130.71 **−0.13−0.03−0.34 **−0.080.220.30
E2−0.090.74 **−0.56 **−0.24 *−0.24 *0.39 **0.220.30
E3−0.36 **−0.17−0.180.21 *0.30 **0.20 *0.180.25
E4−0.25 *−0.25 *−0.130.140.27 *0.210.240.32
Combined−0.21 **0.26 **−0.25 **0.020.000.18 **0.110.14
NSPPE11.26 **−0.260.43−1.23 **−0.410.220.440.59
E21.44 **0.21−0.21−0.56 *−0.88 **−0.010.520.70
E3−0.40 *−0.040.370.50 *−0.17−0.260.390.52
E4−0.77 **0.29 *0.62 **−0.14−0.39 **0.39 **0.270.37
Combined0.38 **0.050.30 **−0.36 **−0.46 **0.090.200.27
NGPSE13.74 **−0.100.27−2.22 **2.62 **−4.32 **1.041.39
E25.57 **0.61−2.48 **−2.56 **1.07 *−2.22 **0.961.28
E32.60 **0.63−5.19 **0.113.70 **−1.85 **1.041.39
E4−0.041.01−1.98 **1.11 *−0.600.501.021.36
Combined2.97 **0.54 *−2.35 **−0.89 **1.70 **−1.97 **0.490.65
TGWE1−2.02 **1.60 **−0.890.541.10 *−0.330.911.22
E2−3.19 **0.800.270.141.63 **0.350.861.15
E3−0.240.041.42 **1.92 **−3.01 **−0.120.710.95
E4−1.10 **0.040.212.06 **−2.24 **1.03 **0.590.78
Combined−1.64 **0.62 **0.251.16 **−0.63 **0.230.380.50
GYPPE11.57 **−1.76 **0.28−2.21 **2.23 **−0.100.861.15
E21.52 **−0.69−0.05−1.50 **1.64 **−0.92 *0.791.06
E3−0.141.42 **−0.101.35 **−0.53−2.01 **0.670.90
E4−0.85 **2.63 **−0.100.91 **−0.81 **−1.79 **0.550.74
Combined0.53 **0.40 *0.01−0.36 *0.63 **−1.21 **0.350.47
* and ** indicate p-value < 0.05 and 0.01, respectively. DTH is days to heading, PH is plant height, CHLC is chlorophyll content, SL is spike length, NSPP is number of spikes per plant, NGPS is number of grains per spike, TGW is 1000-grain weight and GYPP is grain yield per plant. E1: recommended sowing date at Sakha, E2: late sowing date at Sakha, E3: recommended sowing date at El-Kharga, and E4: late sowing date at El-Kharga.
Table 3. Specific combining ability effects (SCA) of 15 F1 hybrids for all studied traits under tested environments.
CrossesDays to HeadingPlant HeightChlorophyll ContentSpike Length
E1E2E3E4Comb.E1E2E3E4Comb.E1E2E3E4Comb.E1E2E3E4Comb.
P1 × P2−0.510.99−3.21 **−2.01 **−1.18 **−0.72−0.41−4.97 **−4.80 **−2.72 **−1.2−0.41−4.19 **−2.15 *−1.99 **−0.68 *−0.42−0.29−0.30−0.42 **
P1 × P30.910.16−6.46 **−8.18 **−3.39 **−8.47 **−9.29 **−2.04−3.00 *−5.70 **0.06−2.73 **0.44−2.41* *−1.16 **−0.340.261.21 **0.94 **0.52 **
P1 × P4−3.09 **−0.761.99 **2.70 **0.214.68 **2.465.86 **4.52 **4.38 **2.70 **1.90 *2.07 *3.56 **2.56 **0.44−0.450.07−0.010.01
P1 × P51.66 *0.33−1.09−0.640.074.78 **4.09 **−0.310.252.20 **−0.741.521.752.00 *1.13 *1.53 **1.47 **−0.52 *−0.350.53 **
P1 × P62.62 **1.87 **−0.46−0.350.92 **−0.524.14 **−4.07 **−1.12−0.390.654.60 **3.13 **1.212.40 **1.61 **1.22 **−1.86 **−1.30 **−0.09
P2 × P35.54 **5.12 **1.37 *2.24 **3.57 **2.863.05 *−2.62 *0.580.971.96 *4.47 **2.86 **3.74 **3.26 **0.88 **−0.40−1.22 **−1.09 **−0.46 **
P2 × P41.87 **0.2−5.51 **−4.55 **−2.00 **−0.322.46−2.72 *−1.97−0.640.481.131.35−1.520.360.430.94 **0.64 *0.66 *0.67 **
P2 × P55.95 **4.62 **0.410.782.94 **1.89−6.34 **1.282.55 *−0.16−0.41−2.72 **−0.811.22−0.681.12 **−0.29−0.80 **−0.69 *−0.16
P2 × P60.24−0.843.04 **0.070.63 *−3.07−1.123.77 **2.170.440.19−2.26 *−0.190.96−0.33−0.010.320.150.140.15
P3 × P40.290.71.58 *0.950.88 **−9.59 **−8.41 **−3.96 **−0.78−5.68 **−5.77 **−3.72 **−4.99 **−6.08 **−5.14 **−0.07−1.10 **−0.11−0.13−0.35 *
P3 × P5−7.96 **−4.21 **0.160.28−2.93 **−0.082.423.71 **2.74 *2.20 **−1.15−0.44−3.28 **0.46−1.10 *0.230.10−0.65 *−0.67 *−0.25
P3 × P60.66−0.34−2.88 **−2.76 **−1.33 **5.50 **−5.19 **2.281.090.923.30 **4.91 **2.87 **2.67 **3.44 **−0.38−1.09 **2.56 **2.18 **0.82 **
P4 × P52.04 **−1.80 **−3.71 **−4.85 **−2.08 **0.86−3.50 *−2.90 *−3.51 **−2.26 **−0.270.460.181.74 *0.53−0.36−0.221.56 **1.40 **0.59 **
P4 × P6−1.67 *−0.59−3.76 **−2.55 **−2.14 **−6.31 **−0.44−2.49−1.11−2.59 **−2.88 **−5.19 **−3.67 **−1.16−3.22 **−0.040.530.02−0.030.12
P5 × P6−1.26−0.17−3.51 **−3.22 **−2.04 **4.42 **1.52−0.65−0.921.090.680.631.38−3.78 **−0.27−0.490.73 *0.260.290.2
LSD Sij 0.051.351.311.21.090.603.242.942.572.431.371.661.881.891.670.870.610.610.500.650.29
LSD Sij 0.011.81.751.61.450.804.333.943.443.251.822.222.512.532.231.150.820.820.680.870.39
CrossesNumber of Spikes per PlantNumber of Grains per SpikeThousand-Grain WeightGrain Yield per Plant
E1E2E3E4Comb.E1E2E3E4Comb.E1E2E3E4Comb.E1E2E3E4Comb.
P1 × P2−2.09 **−1.22−0.86−0.48−1.16 **−0.38−1.970.763.30 *0.43−0.95−3.15 *−8.43 **−8.18 **−5.17 **−4.24 **−4.31 **−4.50 **−2.10 **−3.79 **
P1 × P3−1.17−2.19 **−2.47 **−3.16 **−2.25 **1.022.79 *−7.34 **−3.38 *−1.73 *−0.3−0.453.71 **0.960.98−0.39−0.58−6.03 **−2.09 **−2.27 **
P1 × P4−1.87 **−1.90 *0.051.40 **−0.58 *2.753.45 *−8.25 **−0.8−0.71−0.45−6.78 **−2.13 *−0.56−2.48 **−0.47−0.46−0.37−2.52 **−0.95
P1 × P53.72 **3.53 **−0.620.291.73 **2.463.62 **0.790.821.92 **0.45−1.770.091.560.088.06 **6.73 **−0.153.58 **4.56 **
P1 × P64.68 **5.22 **0.560.88 *2.83 **8.40 **9.71 **−7.32 **−1.192.40 **2.380.453.47 **−0.521.44 **10.29 **7.96 **−1.772.45 **4.73 **
P2 × P34.47 **2.15 **1.93 **1.93 **2.62 **4.99 **6.65 **−0.67−3.10 *1.97 **−0.982.230.732.44 **1.10 *10.49 **9.01 **1.97 *−0.675.20 **
P2 × P43.45 **3.10 **−0.470.201.57 **6.47 **5.67 **−6.96 **−2.740.613.86 **6.32 **8.67 **4.81 **5.91 **7.01 **7.25 **2.20 *4.48 **5.24 **
P2 × P50.901.42−0.94−0.710.170.57−9.83 **−9.01 **−0.56−4.71 **0.001−0.804.79 **1.61 *1.40 **7.20 **6.93 **−2.42 *−2.11 **2.40 **
P2 × P6−0.600.690.790.160.26−8.09 **−6.77 **−5.29 **0.87−4.82 **3.29 *−0.650.023.54**1.55 **−8.26 **−9.17 **1.93 *0.96−3.64 **
P3 × P4−2.20 **−0.55−0.670.06−0.84 **−11.66 **−15.64 **−2.010.14−7.29 **−6.45 **−12.58 **1.900.7 5−4.10 **−8.45 **−10.78 **1.48−2.06 **−4.95 **
P3 × P5−0.75−1.351.09 *1.94 **0.233.33 *−3.84 **7.53 **2.85 *2.47 **0.282.133.96 **4.96 **2.84 **−4.15 **−6.86 **10.26 **8.41 **1.91 **
P3 × P6−1.96 **−3.26**−0.11−0.67−1.50 **8.01 **2.422.585.08 **4.52 **0.25−0.38−6.48 **−4.16 **−2.69 **2.64 *0.86−0.6−1.96 *0.23
P4 × P5−0.10−1.040.040.57−0.134.75 **4.21 **−0.68−1.581.68 *1.523.23 **−3.26 **−2.29 **−0.20−0.48−0.260.23−3.11 **−0.9
P4 × P6−1.030.26−0.280.92*−0.03−8.97 **−14.43 **−11.09 **−4.17 **−9.67 **−7.51 **−7.49 **−3.25 **2.71 **−3.89 **−2.22−2.44 *−7.87 **−4.25 **−4.19 **
P5 × P6−0.33−0.100.08−0.02−0.09−2.281.57−4.27 **2.41−0.642.50 *3.59 **2.09 *1.61 *2.44 **−1.75−0.413.06 **−1.02−0.03
LSD Sij 0.051.211.441.060.750.562.852.642.862.791.362.502.361.941.611.042.362.171.841.510.97
LSD Sij 0.011.621.931.421.010.743.813.533.833.731.83.343.162.602.151.383.162.92.462.021.29
* and ** reveal p-value < 0.05 and 0.01, in the same order. E1: recommended sowing date at Sakha, E2: late sowing date at Sakha, E3: recommended sowing date at El-Kharga, and E4: late sowing date at El-Kharga.
Table 4. Heterosis percentages relative to mid (MP) and better (BP) parent for all the evaluated traits under recommended and late sowing dates across the two locations.
CrossDays to HeadingPlant HeightChlorophyll ContentSpike Length
M.PB.PM.PB.PM.PB.PM.PB.P
RecLateRecLateRecLateRecLateRecLateRecLateRecLateRecLate
P1 × P2−1.93 **−0.55 1.60 1.79 −4.65 **−4.59 **−3.84 *−3.44 −4.62 *−0.21 −5.76 **−0.90 −2.38 −3.50 −6.86 **−9.35 **
P1 × P3−5.16 **−6.96 **−4.36 **−5.97 **−8.30 **−11.18 **−5.66 **−8.19 **0.82 −3.78 −1.36 −7.21 **6.82 **6.01 6.58 *5.17
P1 × P4−3.09 **−1.38 −2.45 **−1.28 2.80 2.46 4.31 *3.96 3.50 5.93 **0.95 1.01 5.80 **0.98 4.49 0.47
P1 × P5−1.77 *−2.55 **−1.68 *−2.13 *3.61 *2.28 5.18 **3.13 1.66 6.86 **1.53 6.08 *7.07 **9.11 **5.94 *8.10 *
P1 × P6−0.85 −1.39 0.57 −1.28 −3.63 *1.35 −2.51 3.01 7.21 **10.44 **4.27 8.15 **1.97 4.54 0.23 2.28
P2 × P34.37 **4.85 **7.19 **8.48 **−2.19 −0.98 −0.25 1.11 4.18 *10.74 **3.14 7.51 **0.92 −9.47 **−3.93 −14.32 **
P2 × P4−2.23 **−3.49 **0.60 −1.12 −4.80 **−2.03 −2.56 0.61 −0.93 −2.33 −2.22 −6.23 **6.72 **8.04 **3.05 1.98
P2 × P53.95 **3.15 **7.78 **6.03 **3.00 −3.29 5.47 **−1.29 −2.06 −0.73 −3.11 −0.77 3.23 −3.78 −0.51 −8.82 **
P2 × P62.25 **−0.87 4.39 **1.34 −0.42 −0.11 1.61 2.77 1.54 −0.04 −2.38 −2.77 2.50 4.28 −0.57 0.03
P3 × P4−1.32 −1.58 *−1.14 −0.64 −11.66 **−10.47 **−7.74 **−6.06 **−15.23 **−13.46 **−15.49 **−14.45 **4.01 −5.39 2.49 −5.66
P3 × P5−6.38 **−4.83 **−5.49 **−4.23 **2.11 0.51 6.68 **4.79 *−6.53 **0.60 −8.43 **−2.29 2.32 −1.85 1.01 −1.98
P3 × P6−3.24 **−4.33 **−2.68 **−3.21 **2.45 −5.62 **6.65 **−0.79 7.38 **10.30 **2.24 4.25 12.56 **7.76 *10.40 **6.26
P4 × P5−3.37 **−7.32 **−2.64 **−7.02 **−1.75 −6.68 **−1.71 −6.10 **−3.75 *0.29 −6.00 **−3.68 9.15 **10.02 **8.94 **9.55 **
P4 × P6−5.51 **−5.12 **−4.79 **−4.91 **−7.73 **−3.01 −7.45 **−2.85 −8.76 **−9.54 **−13.38 **−15.43 **4.25 *8.10 **3.76 6.29
P5 × P6−4.72 **−4.99 **−3.26 **−4.49 **3.92 *0.12 4.28 *0.90 3.13 −2.81 0.18 −5.50 *2.75 10.82 **2.08 9.43 **
Number of Spikes per PlantNumber of Grains per SpikeThousand-Grain WeightGrain Yield per Plant
M.PB.PM.PB.PM.PB.PM.PB.P
RecLateRecLateRecLateRecLateRecLateRecLateRecLateRecLate
P1 × P2−3.90 2.52 −11.32 **−2.36 −4.32 *3.18 −6.54 **0.94 −7.49 **−18.65 **−8.07 **−20.28 **−10.37 **−4.63−17.06 **−6.89
P1 × P3−11.11 **−19.50 **−12.02 **−23.47 **−5.41 *2.06 −15.38 **−2.37 2.06−6.64 *−1.05−8.05 **−7.84 *−5.70−12.34 **−12.63 *
P1 × P4−7.28 *3.05 −9.39 **−2.35 −11.90 **0.25 −12.74 **−3.06 −4.84 *−18.46 **−10.13 **−23.07 **−4.90−10.99 *−4.98−19.97 **
P1 × P511.20 **20.65 **4.41 10.43 *1.69 8.40 **−0.24 7.46 *3.37−1.91−0.21−7.58 *23.30 **44.72 **13.93 **42.09 **
P1 × P616.11 **26.91 **11.79 **23.84 **−5.97 **11.56 **−10.90 **9.32 **4.62 *−6.48 *2.43−8.11 **12.90 **30.29 **8.61 *28.35 **
P2 × P322.22 **15.64 **11.74 **4.97 1.14 −0.07 −7.58 **−6.39 *1.677.51 **−0.833.7932.36 **23.63 **28.57 **17.16 **
P2 × P411.75 **22.20 **5.38 21.56 **−10.38 **−5.29 *−11.62 **−6.41 *13.28 **12.87 **7.62 **4.4817.58 **26.58 **8.71 *16.31 **
P2 × P57.55 *14.35 **5.57 9.67 *−9.14 **−12.26 **−9.55 **−14.90 **11.51 **9.02 **6.99 **4.7324.56 **29.28 **24.37 **23.99 **
P2 × P67.09 *13.48 **2.46 10.69 *−19.57 **−9.01 **−22.03 **−12.73 **5.36 *6.08 *3.802.17−8.64 *−20.21 **−12.27 **−20.93 **
P3 × P4−11.35 **−3.43 −14.23 **−12.75 **−17.38 **−23.36 **−25.45 **−29.00 **−6.89 **−19.29 **−9.37 **−22.73 **−12.88 **−42.35 **−17.20 **−44.20 **
P3 × P51.88 1.59 −5.26 −11.17 **10.89 **−2.68 0.92 −6.12 *6.85 **13.10 **0.125.0424.39 **7.5720.65 **−2.00
P3 × P6−5.85 −13.87 **−10.24 **−20.00 **4.28 5.13 −1.90 2.58 −7.87 **−7.50 **−8.79 **−7.72 **4.91−11.71 *3.68−17.04 **
P4 × P5−0.16 5.62 −4.16 1.80 −3.02 −3.78 −3.94 −7.74 **−0.411.88−9.02 **−9.11 **4.45−10.09 *−3.56−20.47 **
P4 × P6−4.73 10.88 **−6.17 7.61 −27.97 **−25.48 **−31.12 **−29.34 **−12.95 **−9.82 **−16.09 **−13.47 **−23.17 **−29.82 **−26.15 **−36.04 **
P5 × P62.96 7.75 0.31 0.91 −10.05 **2.81 −13.19 **1.62 7.31 **11.42 **1.503.259.59*−0.595.09−3.83
* and ** reveal p-value < 0.05 and 0.01, in the same order. Rec: recommended sowing date and late: late sowing date.
Table 5. Components of genetic variance for all the evaluated traits under tested environments.
TaitEnv.Genetic Components
DH1H2h2FE(H1/D) 0.5(H2/4H1)KD/KRh2/H2r r2h2 (b.s)h2 (n.s)
DTHE117.0758.36 * 46.29 * 7.7328.210.541.850.202.620.17−0.950.8995.673.71
E211.79 * 29.99 * 21.62 * 3.8918.170.601.600.182.870.18−0.90.8291.3814.12
E33.54 * 50.10 **48.54 **73.25 **0.350.483.760.241.031.510.60.3796.8215.84
E41.4950.73 **49.39 **73.51 **−1.130.585.830.240.881.490.80.6496.113.27
PHE121.54115.17 **87.07 **0.7529.663.192.310.191.850.010.790.6390.8728.58
E216.6101.61 **83.33 **30.3530.473.032.470.212.180.360.920.8588.388.48
E34.4743.67 **41.28 **13.49 **−0.412.003.130.240.970.33−0.680.4787.4822.78
E43.9822.43 **21.74 **0.64−1.571.86 * 2.370.240.850.030.060.0082.1629.95
CHLCE11.9320.76 *17.57 *0.412.540.853.280.211.500.020.190.0487.0319.75
E21.7540.00 **35.06 **0.084.411.124.780.221.720−0.40.1689.8710.32
E32.229.95 **26.19 **−0.645.431.483.690.222.01−0.020.30.0982.153.19
E47.59 * 30.22 **28.36 **−0.435.220.8320.231.42−0.02−0.580.3391.7221.08
SLE10.62.73 **2.41 **2.21 **0.390.112.140.221.360.92−0.910.8388.5527.00
E20.87 **3.53 **2.39 **0.310.890.132.010.171.680.13−0.250.0689.7143.62
E30.425.84 **4.76 **0.121.020.093.750.201.970.02−0.740.5594.3315.80
E40.153.89 **3.21 **0.090.480.135.030.211.910.03−0.720.5288.4316.14
NSPPE13.74 * 28.20 **24.17 **3.714.440.492.750.211.550.15−0.020.0094.0320.28
E23.6328.43 **22.16 **3.066.40.662.80.191.920.14−0.10.0191.7421.98
E30.534.163.380.290.820.442.810.21.760.090.280.0871.1715.93
E41.307.03 * 6.17 * 1.560.990.172.320.221.390.250.370.1392.5525.36
NGPSE15.51170.98 **146.78 **18.05−20.642.725.570.210.50.12−0.590.3495.7938.97
E23.48294.60 **237.60 **21.97−4.982.429.20.200.860.09−0.220.0597.4434.62
E390.68 **261.58 **203.55 **395.44 **110.99 **2.491.70.192.131.940.520.2796.5526.11
E414.60 **31.95 **23.83 **−1.1119.88 * 3.12* 1.480.192.71−0.050.570.3270.2513.5
TGWE18.9251.38 * 36.78−0.6514.412.412.40.182.01−0.020.80.6585.0628.18
E212.17138.82 * 102.7338.0429.732.093.380.182.130.370.80.6494.3625.02
E321.37 * 86.65 **77.21 **4.5520.391.252.010.221.620.06−0.320.195.1520.22
E412.2459.53 **48.85 **12.5112.390.782.210.211.60.26−0.210.0495.7328.83
GYPPE112.45182.21 **159.44 **34.38 **17.981.743.830.221.470.22−0.710.5096.5417.16
E29.72183.77 **154.93 **0.9826.211.544.350.211.900.01−0.630.3996.6913.29
E324.85 * 107.82 **74.99 *0.4249.531.072.080.172.830.010.230.0595.5417.07
E415.44 * 54.35 **45.58 **0.2114.340.711.880.211.660.000.670.4595.8428.96
* and ** indicate p-value < 0.05 and 0.01, respectively. DTH: days to 50% heading, PH: plant height, CHLC: chlorophyll content, SL: spike length, NSPP: number of spikes/plant, NGPS: number of grains/spike, TGW: thousand-grain weight, and GYPP grain yield/plant. E1: recommended sowing date at Sakha, E2: late sowing date at Sakha, E3: recommended sowing date at El-Kharga, and E4: late sowing date at El-Kharga.
Publisher’s Note: MDPI stays neutral with regard to jurisdictional claims in published maps and institutional affiliations.

