Article

Development of a Co-Dominant Cleaved Amplified Polymorphic Sequences Assay for the Rapid Detection and Differentiation of Two Pathogenic Clarireedia spp. Associated with Dollar Spot in Turfgrass

by
Tammy Stackhouse
1,
Sumyya Waliullah
1,
Alfredo D. Martinez-Espinoza
2,
Bochra Bahri
2,3 and
Md Emran Ali
1,*
1
Department of Plant Pathology, University of Georgia, Tifton, GA 31793, USA
2
Department of Plant Pathology, University of Georgia, Griffin, GA 30223, USA
3
Institute of Plant Breeding, Genetics and Genomics, University of Georgia, Griffin, GA 30223, USA
*
Author to whom correspondence should be addressed.
Agronomy 2021, 11(8), 1489; https://doi.org/10.3390/agronomy11081489
Submission received: 8 June 2021 / Revised: 21 July 2021 / Accepted: 25 July 2021 / Published: 27 July 2021
(This article belongs to the Section Pest and Disease Management)

Abstract

:
Dollar spot is one of the most destructive diseases in turfgrass. The causal agents belong to the genus Clarireedia, which are known for causing necrotic, sunken spots in turfgrass that coalesce into large damaged areas. In low tolerance settings like turfgrass, it is of vital importance to rapidly detect and identify the pathogens. There are a few methods available to identify the genus Clarireedia, but none of those are rapid enough and characterize down to the species level. This study produced a co-dominant cleaved amplified polymorphic sequences (CAPS) test that differentiates between C. jacksonii and C. monteithiana, the two species that cause dollar spot disease within the United States. The calmodulin gene (CaM) was targeted to generate Clarireedia spp. specific PCR primers. The CAPS assay was optimized and tested for specificity and sensitivity using DNA extracted from pure cultures of two Clarireedia spp. and other closely related fungal species. The results showed that the newly developed primer set could amplify both species and was highly sensitive as it detected DNA concentrations as low as 0.005 ng/µL. The assay was further validated using direct PCR to speed up the diagnosis process. This drastically reduces the time needed to identify the dollar spot pathogens. The resulting assay could be used throughout turfgrass settings for a rapid and precise identification method in the US.

1. Introduction

Turfgrass is a 40 billion-dollar industry reaching around the world. In the United States alone it is estimated that there are over 62 million acres of turfgrass [1]. There is a large number of studies showing greenscapes, including turfgrass, have positive impacts on the surrounding environment, including area temperature reduction, erosion control, and energy use reduction [2,3,4,5,6].
One of the most economically important turfgrass diseases is dollar spot caused by Clarireedia spp. [7]. This disease can be caused by at least five species within the genera Clarireedia, C. bennettii, C. homoeocarpa, C. jacksonii, C. monteithiana, and C. paspali [8,9]. Four of these species were reclassified in 2018 into this novel genus [9]. Previously all dollar spot-causing fungi were classified as Sclerotinia homoeocarpa, with various name challenges since the initial naming in 1937 [9,10]. The newest identified Clarireedia species, C. paspali, is so far only found in China [8]. Clarireedia homoeocarpa has only been reported within the United Kingdom. C. bennettii has been reported in the Netherlands, New York, in the US, and the United Kingdom. The last two species, C. jacksonii and C. monteithiana, are found on grasses worldwide, including the US. Reclassification has rejuvenated research into this pathogen [11,12].
Turfgrass used in sports fields and golf courses are often heavily managed to control pests and pathogens and have an extremely low tolerance for damage from dollar spot [13]. Symptoms include small white to straw foliar lesions with a brown border [14]. These lesions can grow together, coalescing and eventually leading to blighted, sunken spots on the turf, often killing the grass to the soil surface (Figure 1). These spots are often the size of silver dollar coin, giving this disease its name. Mycelium or infected tissues can often be moved by equipment, people, wind, or water, allowing the disease to spread quickly over larger areas [15,16]. Damage is also often worse on turf facing abiotic stressors, such as low fertility and high moisture [17,18]. Dollar spot damage is unsightly and can reduce the playability of sports fields and golf courses [19]. Control management can be costly and requires an extremely rapid diagnosis of problems when they do occur [20]. Control can be achieved with cultural and chemical controls [21,22].
Although C. jacksonii is typically found on C3 plants and C. monteithiana on C4 plants [9,23]; artificial inoculation studies have found that each of the species can grow on either type of grasses [8,24]. These two species are also both found throughout transitional areas in the United States [24]. In areas with both cool and warm season stands near one another both species can be found in close proximity [24]. These pathogens could have varying resistance based on genetic factors, making species differentiation important [25,26,27]. These genetic factors for fungicide resistance differences have not yet been studied since the reclassification of the dollar spot causing pathogens. Of the studies that have published since the reclassification, some focus on one species, mainly C. jacksonii, while the others simply refer to older nomenclature or the genus [24,28,29].
Pathogen detection of dollar spot has mainly been symptoms, signs, and morphologically based [9]. Dollar spot disease can sometimes be confused with other pathogenic diseases or various abiotic factors, making diagnosis by symptoms alone difficult [7]. The common dollar spot diagnosis method includes collecting samples, microscopic analysis and culturing, DNA extraction, amplicon sequencing and Blast analysis against GenBank database have been used [8,9,30]. This process is labor intensive and can take several days. Beyond time requirements, determining Clarireedia species requires the knowledge to search GenBank for samples under the new nomenclature while all the previously named samples are still present. The three genes being used presently for Clarireedia spp. identification are ITS, and the calmodulin gene (CaM), and the DNA replication licensing factor (Mcm7); these genes can be used to distinguish Clarireedia based on specific SNPs present [9]. More recently, a new qPCR method was described by Groben et al. for general diagnosis [12]. This is sensitive method is extremely useful for identifying dollar spot disease caused by Clarireedia spp.; however, this method cannot distinguish between the different species causing dollar spot [12]. This limits studies of the prevalence of each species and their characterization. Because fungicide resistance can vary by pathogen species, it is important to be able to identify down to species, which is not possible with the current qPCR approach and the PCR method without an additional sequencing step.
Understanding the specific species causing a disease can allows for better chemical treatment and fungicide resistance studies. Species-specific PCR allows for specific identification of a species without sequencing [31]. This method has been used widely in plant pathology [30,31,32]. Primers are typically tested in vitro and in silico to ensure specificity [33]. This allows specific species detection within complex samples that often contain other pathogens and plant or soil impurities. This aggregation makes the commonly used universal primers difficult to utilize without pathogen isolation and can take weeks to sort them out [31,34]. Using species specific primers can reduce pathogen identification to a few hours, depending on the protocol. Co-dominant cleaved amplified polymorphic sequences (CAPS) allows for secondary testing of a PCR reaction to identify specific single nucleotide polymorphisms (SNPs) [34,35,36]. In some cases, these specific SNPs can be used to identify specific mutations or differentiate species, strains, or cultivars [37,38,39,40,41]. The method could be a valuable tool in identifying dollar spot pathogens.
It is critical to identify dollar spot quickly for prompt control measures. This research focuses on creating a novel molecular assay to identify Clarireedia species and differentiate between the two dollar spot causing species found in southeastern United States, C. jacksonii and C. monteithiana, using CAPS approach. This assay would allow for faster response and therefore reduced treatment delay time and reduced chemical control costs to turfgrass professionals.

2. Materials and Methods

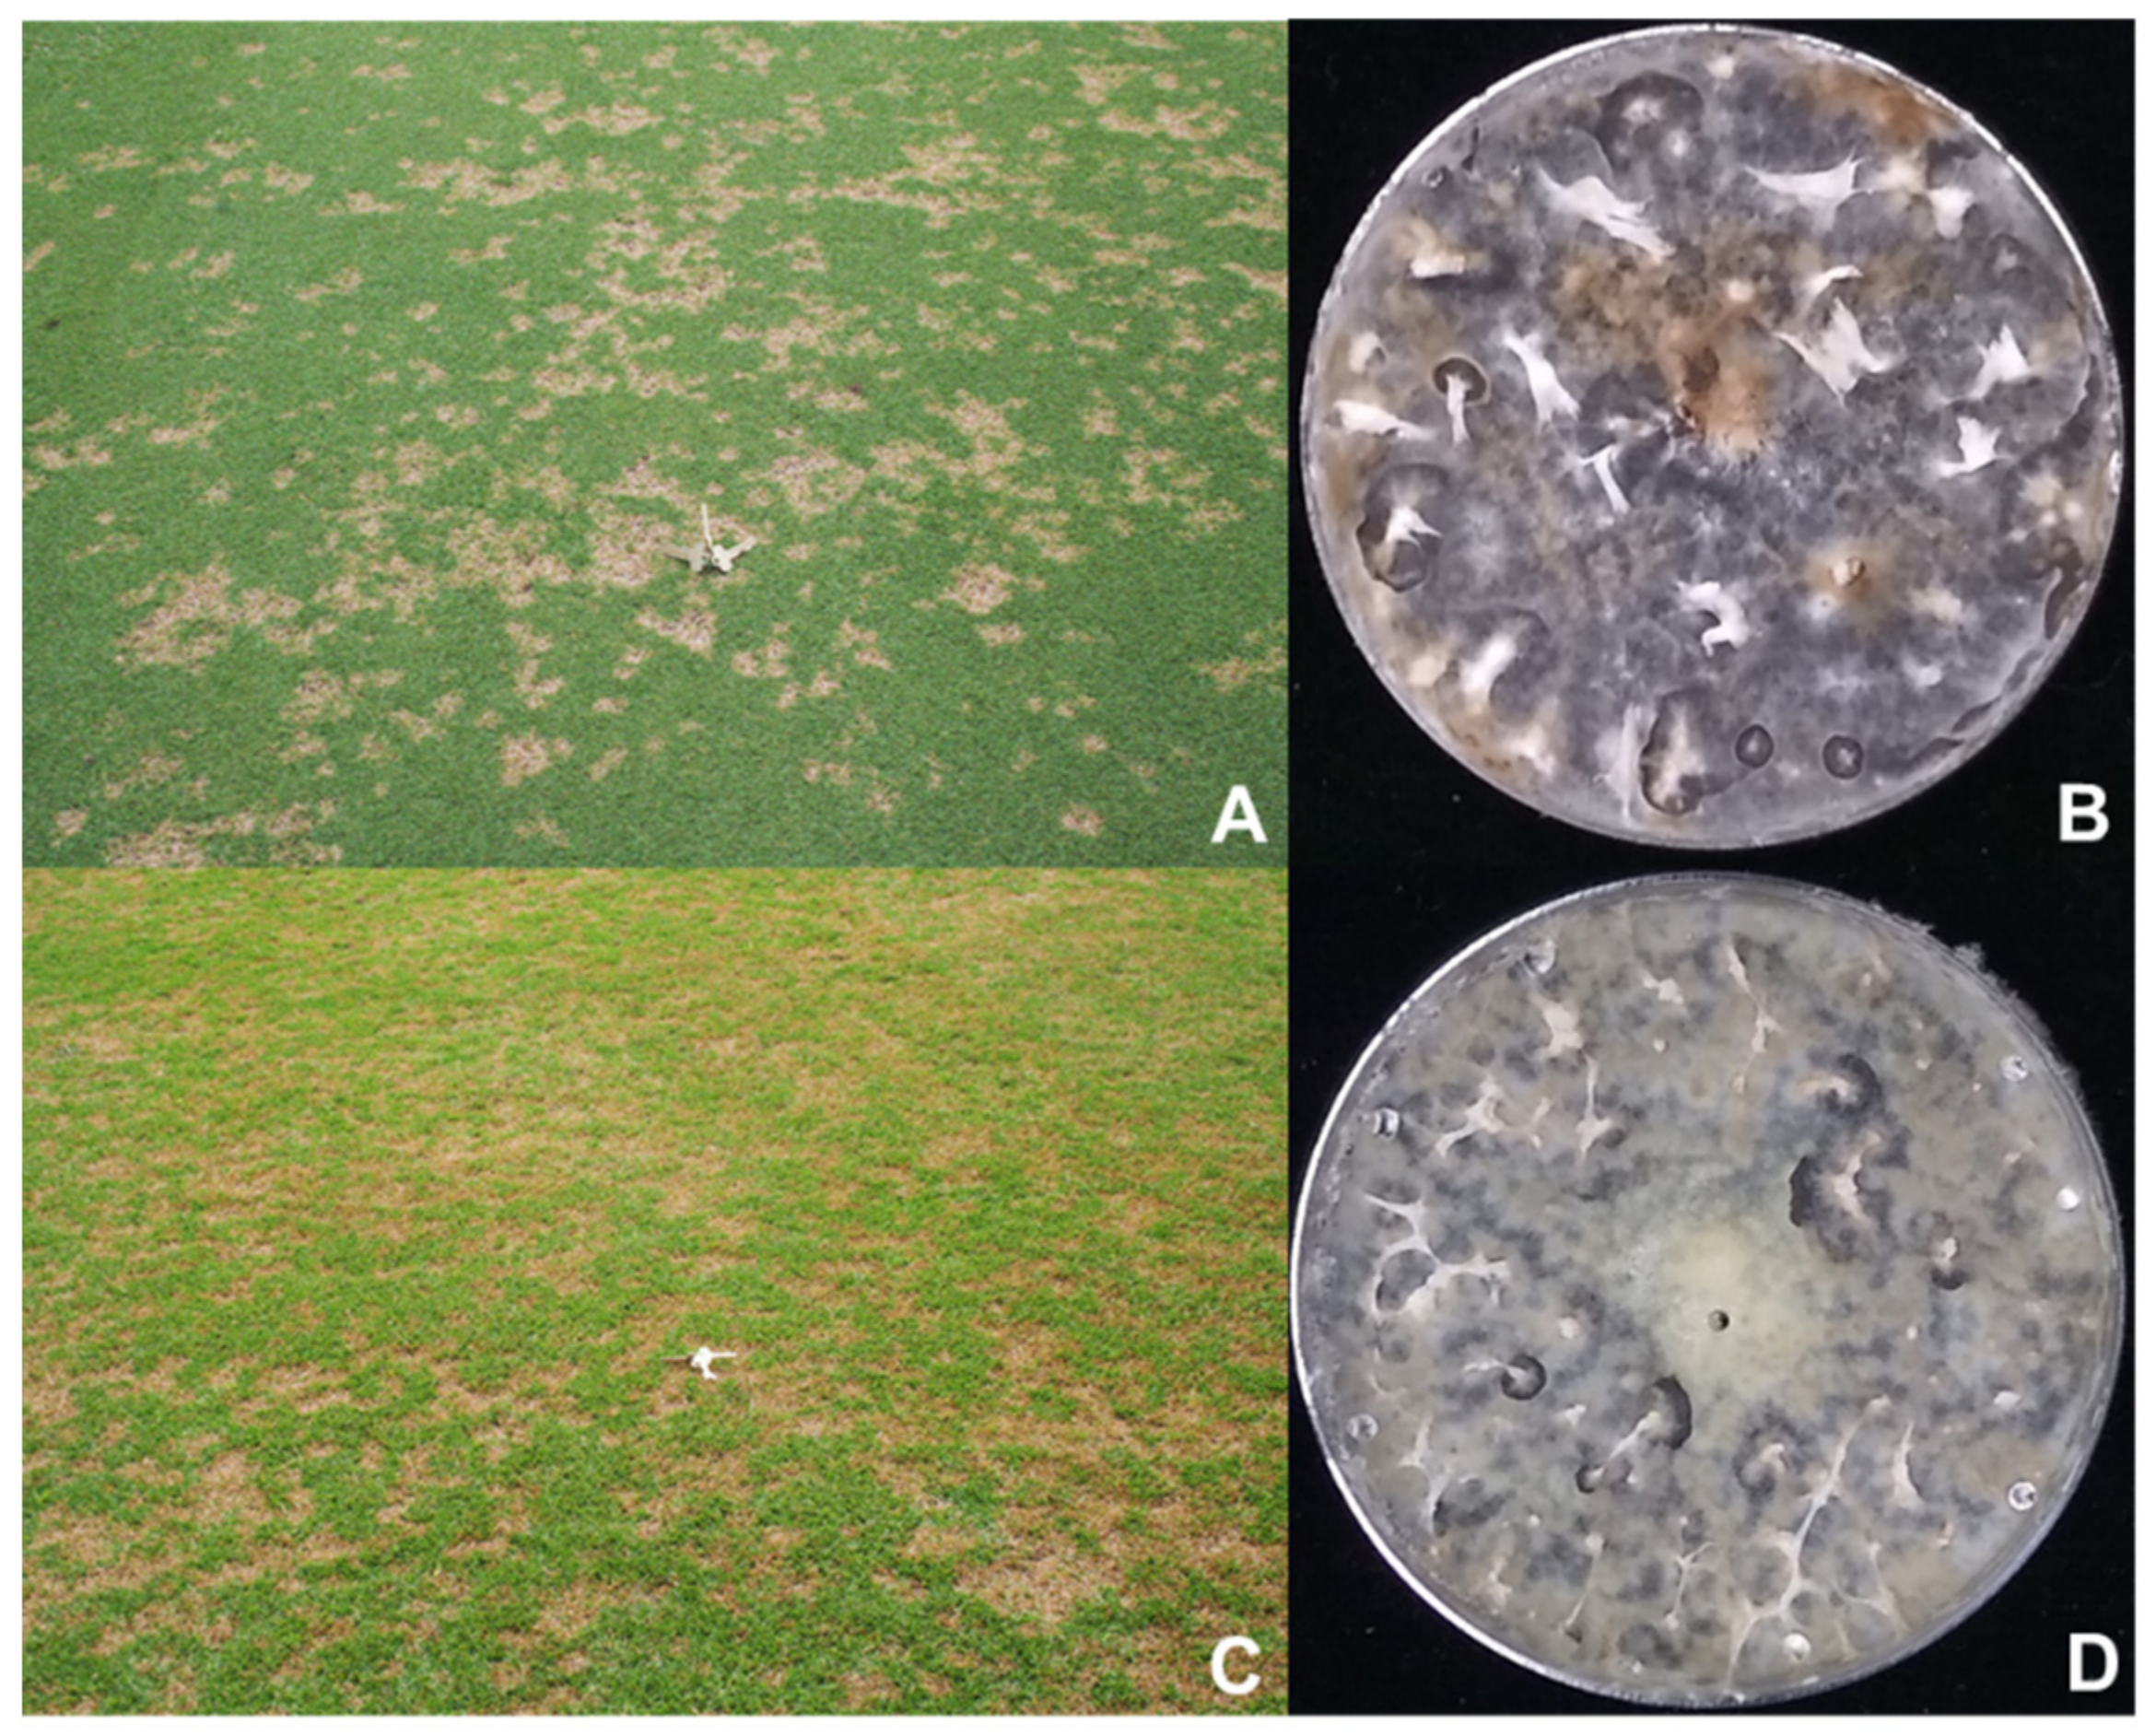
2.1. Sample Collection

Dollar spot symptomatic samples used in this study were collected within the state of Georgia (USA) from various cool season and warm season grasses in the years 2019 and 2020 (Table 1). All samples were identified using morphological features and sequencing of the calmodulin gene (CaM) and internal transcribed spacer (ITS) [9,42]. Eleven non-target fungal species samples were taken from various hosts and locations to test the newly designed primers for specificity. These non-target pathogens included Bipolaris spp. Botrytis sp., Cladosporium sp., Colletotrichum spp., Fusarium sp., Leptosphaerulina sp., Magnaporthe poae Ophiosphaerella korrae, Phytophthora sojae, Pyricularia grisea, and Rhizotonia solani. These samples were all isolated from of turfgrass samples taken in Georgia. All nontarget species identifications were performed using ITS primers with either ITS1/4 or ITS 4/5.
Fungal pathogens were isolated from plant samples and grown on potato dextrose agar (PDA) plates at 28 °C for 4 to 7 days. Isolates were selected and transferred until pure cultures were obtained. Samples were used for DNA extraction detailed below and placed in glycerol stocks at −80 °C for future experiments.

2.2. DNA Extraction

For extraction, 100 mg of pure culture samples were taken from plates via scraping with a sterile scalpel and placed in a 1.5 mL tube. DNA extraction was performed using the QIAGEN DNeasy Plant Mini Kit (Qiagen, Valencia, CA, USA) per the manufacturer’s instructions. The only modification to the manufacturer’s protocol were to elute DNA with prewarmed (65 °C) AE buffer [43]. The DNA samples were quantified using a NanoDrop™ Lite Spectrophotometer (FisherScientific, Waltham, MA, USA) before storage at −20 °C.

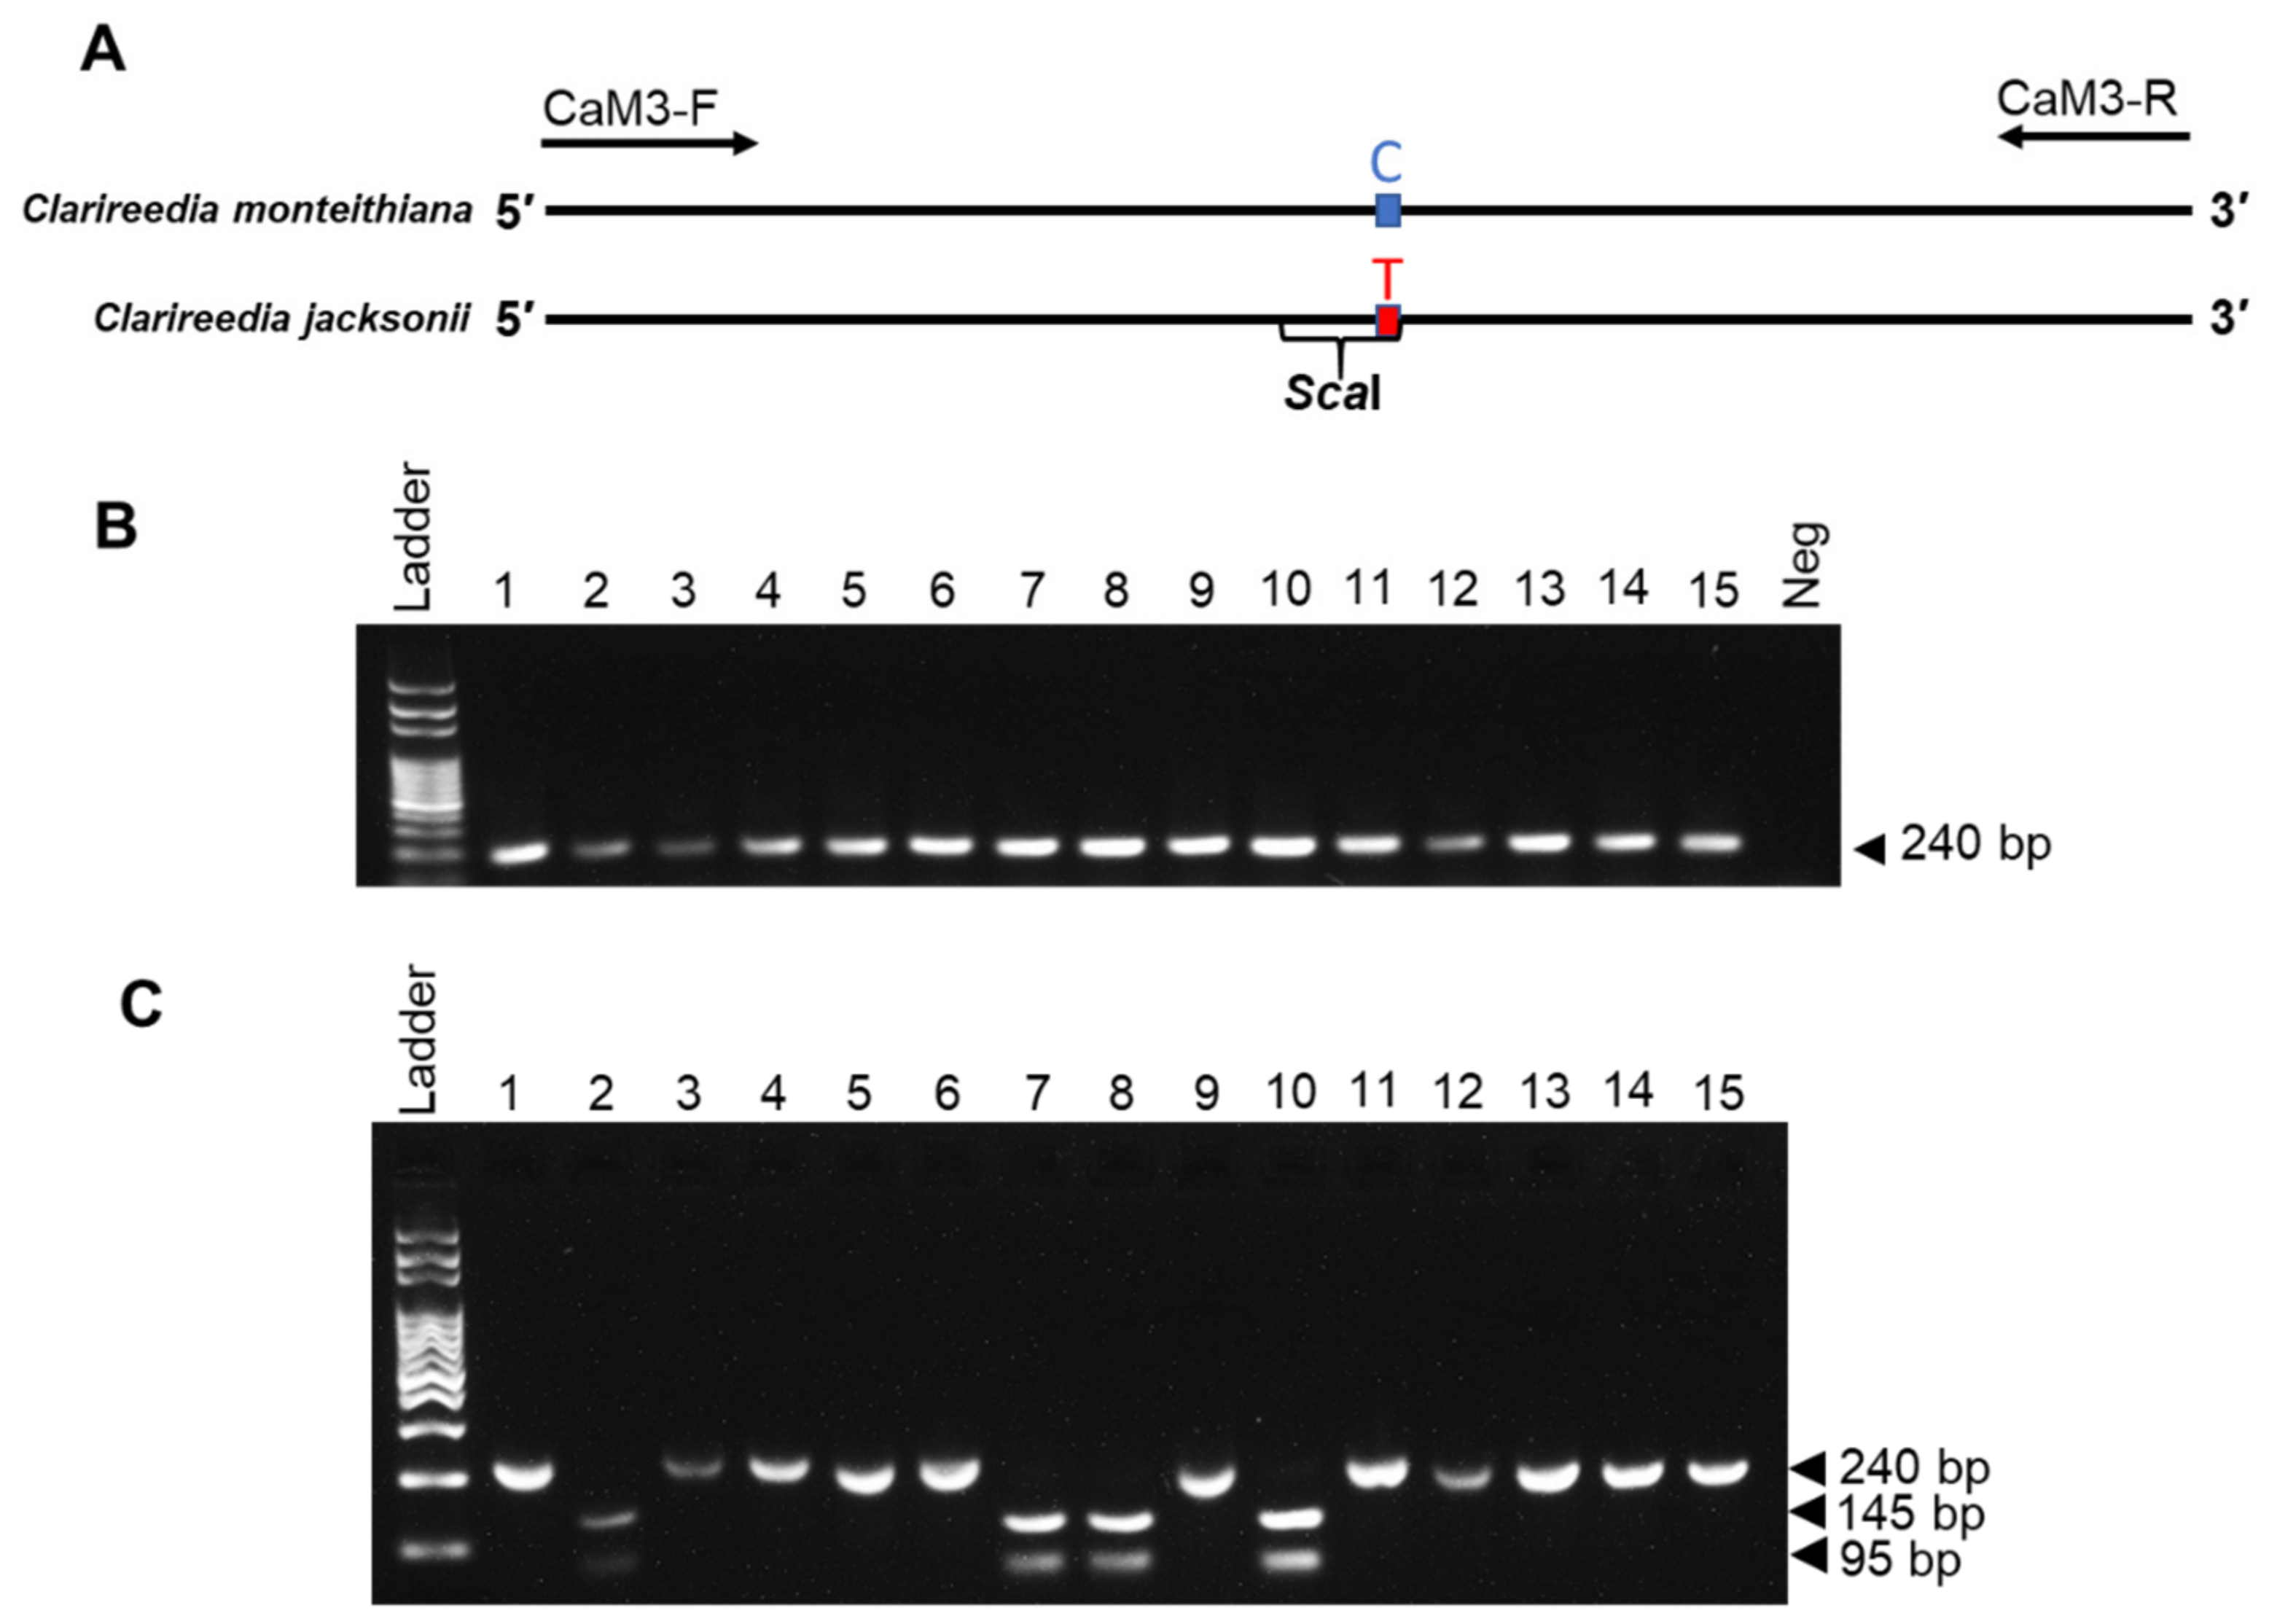
2.3. PCR Primer Design

Previously published gene sequences were used to design novel, specific PCR primers [9]. Novel PCR primers were designed manually based on partial gene sequences of the ITS, CaM and Mcm7 of C. jacksonii and C. monteithiana. Twelve primer pairs (Table 2), including CaM3_F and CaM3_R primer set (Table 2), were created manually in Geneious Prime then checked for quality and content using the Integrated DNA Technologies PrimerQuest Tool software. The melting temperature (Tm) distance between forward and reverse was low and the percent GC content closest to 50% (determined by Geneious Prime). Primer pairs sequences were used to query NCBI GenBank database using BLASTn to provide an in silco assessment of primer binding specificity against turfgrass pathogens. Primers were synthesized by Sigma-Aldrich (St. Louis, MO, USA), dissolved in DNase/RNase free PCR-grade water to produce 100 µm solutions, and stored at −20 °C.

2.4. PCR Amplification and Optimization

Firstly, PCR testing was performed using GoTaq® Green Master Mix (Promega, Madison, WI, USA) per the manufacturer’s instructions. Each 20 µL reaction contained: 10 µL of GoTaq master mix (1×), 1 µL of forward primer (500 nm), 1 µL of reverse primer (500 nm), 1µL of DNA (5 ng µL−1) sample and rest was filled with PCR grade H2O. Annealing temperatures tested for optimization were 55 °C to 68 °C, as is common with newly designed primers. The optimal temperature was selected for the highest temperature with strong bands, to encourage specificity. The thermocycler settings for PCR were: initial denaturing of 95 °C for 3 m; 35 cycles of 95 °C 30 s, 55 to 68 °C for 30 s (gradient), 72 °C for 1 m; and final extension of 72 °C for 5 m. PCR products were run on 1% agarose gels with GelGreen® Nucleic Acid Gel Stain (Biotium, Fremont, CA, USA) for 25 min at 65 V before confirming the presence or absence of bands with an Analytik Jena UV transilluminator (Upland, CA, USA). Secondly, the PCR primers were preliminarily tested, at the optimal temperature selected, with 15 samples of dollar spot to ensure the primers were functional. Thirdly, the PCR primers were next tested for specificity using thirteen samples of nontarget plant pathogens, with eleven different species, all standardized to 5 ng/µL. Finally, the PCR sensitivity was tested using three dollar spot samples starting at 5 ng µL−1 and preforming a 10:1 dilution with water to 0.0005 ng µL−1.

2.5. CAPS Analysis of the PCR Product

Co-dominant cleaved amplified polymorphic sequences (CAPS) assay was designed to distinguish between C. jacksonii and C. monteithiana. Each of the three PCR primer sets (ITS4, CaM2 and CaM3 primers) that did not have nonspecific amplification for other non-Clarireedia spp., were examined for single nucleotide polymorphisms between C. jacksonii and C. monteithiana that would cause unique restriction digest sites. To find unique restriction sites between C. jacksonii and C. monteithiana, the gene sequences were imported in Geneious v10.1.2 (Biomatters Ltd., Auckland, New Zealand) software for sequence alignment. Utilizing “Find Restriction Sites” with default settings and for enzymes that allowed for one to two cuts, a unique restriction site of ScaI enzyme was identified and produced distinguishable bands in a 2% TBE agarose gel using the CaM3 primers. The selected PCR-RLFP assay were carried out using 15 known dollar spot isolates. The assay was performed by mixing a 30 µL solution comprising of 2 µL of restriction digest enzyme ScaI (Sigma-Aldrich, St. Louis, MO, USA), 2 µL of 10× buffer, 8 µL of DNase/RNase free water, and 20 µL of PCR product. The solution was incubated at 37 °C for 30 min. The CAPS reaction products were run on a 2% agarose gel for 30 min at 65 V.

2.6. Direct PCR Testing

To speed up the diagnosis process, direct PCR was used on pure cultures from each dollar spot isolate. The direct PCR was performed using the Phire Plant PCR Direct Kit (ThermoFisher, Waltham, MA, USA) per the manufacturer’s instructions. To proceed the assay, a 10 µL pipette tip was used to collect a small amount (as little as possible) of mycelium which was placed in 20 µL of Phire Direct digestion solution, vortexed, then placed in −20 °C until frozen. This digestion solution contained mycelium that was used in PCR. Each 20 µL reaction incorporates 10 µL of 2× Phire Plant PCR Buffer, 1 µL of CaM3_F primer, 1 µL of CaM3_R primer, 0.4 µL of Phire Hot Start II DNA Polymerase, 6.6 µL of sterile water, and 1 µL of digested mycelium solution. The PCR reaction was performed with initial denaturation at 98 °C for 5 min, 40 cycles of 98 °C for 5 s, 63 °C for 5 s, and 72 °C for 20 s, with a final extension of 72 °C for 1 m. These are different thermocycler settings based on the Phire Direct Kit specifications. The resulting PCR product was put through the CAPS testing detailed above. These are repeated with each strain four times to ensure consistency with this method.

3. Results

3.1. PCR Primer Design

Clarireedia spp. isolates were further confirmed via Sanger sequencing using PCR products from the CAL-228F/CAL-737R and ITS4/ITS5 primers using the previously published sequences for comparison [9,42,44]. Each of the designed primers were systematically tested for single band amplification, specificity, and CAPS assay targets (Table 2). From these results (Supplemental Figure S1) the CaM3-F/CaM3-R primers were selected for use.

3.2. Optimization of PCR Primers

Our newly designed PCR primer set (CaM3-F/CaM3-R) was able to amplify all dollar spot samples successfully and produced a 240 base pair band as expected from Clarireedia spp. (Figure 2A,C). PCR assay was optimized by using various temperatures (between 55–68 °C) and the reaction with the primer set amplified best at 63 °C annealing temperature, as defined by highest temperature with a consistent, bright band with a standardized sample (Figure 2B). Therefore, 63 °C was selected as the optimal temperature. The newly designed CaM3 primer set amplified all the Clarireedia spp. samples, without amplifying the nontarget pathogen samples which demonstrated correct and definitive specificity of this marker (Figure 2C,D). The sensitivity limit of the PCR reaction was tested using a serial dilution of target DNA started from 5 ng μL−1 down to 0.0005 ng μL−1 and the sensitivity limit was shown to be 0.005 ng μL−1 (Figure 2E).

3.3. CAPS Analysis of PCR Fragment

The CAPS assay was able to distinguish between C. jacksonii and C. monteithiana via product band size. The ScaI restriction enzyme was used to cut the 240 base pair (bp) band at the 95th base of C. jacksonii isolates. This gave C. jacksonii two digested products, 145 and 95 bps long; while C. monteithiana remain uncut and only produced the original 240 bp PCR product band (Figure 3A,C). There were 15 Clarireedia spp. isolates tested with the novel PCR-CAPS method, 11 was C. monteithiana and 4 was C. jacksonii isolates. All the C. jacksonii isolates produced two bands of 145 and 95 bps and all of the C. monteithiana produced a single band of 240 bp (Figure 3C).

3.4. Direct PCR Testing

The 15 Clarireedia spp. isolates were tested with the modified CAPS assay method described in the method Section 2.6 following direct PCR (Figure 4). This was repeated with all strains four times as technical replications (Supplemental Figure S2). Of the total of 60 runs, all runs produced a band denoting Clarireedia spp. and only one run had too light of a band for species differentiation. The 11 C. monteithiana and 4 C. jacksonii isolates all yielded the same results seen in the CAPS assay seen above. All the C. jacksonii samples produced two bands (145 and 95 bp) and all the C. monteithiana produced one band (240 bp).

4. Discussion

Rapid identification of Clarireedia spp. is necessary for better and accurate management of dollar spot. This disease causes extensive damage each year to turfgrass and requires heavy, expensive control measures. The two species of Clarireedia, C. jacksonii and C. monteithiana, observed throughout the United States, need to be differentiated in order to better understand the spread and affected hosts for each of the pathogens [9]. This requires a fast, accessible method to identify and differentiate between the two species. The diagnosis of dollar spot disease s is currently accomplished by morphological and microscopic techniques, which requires symptoms and expertise that can limit timely disease management decisions [7,13,21,45]. Additionally, species differentiation cannot be obtained with morphological identification alone. This severely restricts studies on species characterization, fungicide resistance, and species prevalence.
Molecular diagnosis based on PCR and qPCR methods also exist for this pathogen; however, these methods of diagnosis won’t ascertain what species we are dealing with [9]. While originally it was thought that species identifying was possible via knowledge of the host, there is now data showing the host may not always coincide to a specific pathogen species [8,24]. Additionally, DNA sequencing approach can take several days and is particularly difficult with Clarireedia spp., as the reclassification provides inadequate labeling of most of the dollar spot sequences in GenBank.
In this study, we have developed a quick, reliable and specific PCR identification of Clarireedia spp. PCR primers were produced from the calmodulin (CaM) gene region that had preestablished sequences in GenBank for various Clarireedia spp. (Figure 2). This universal region is commonly used for species identification and species-specific primer design [46,47]. The Internal transcribed spacer (ITS) and Mcm7 gene (DNA replication licensing factor) regions were both examined for this purpose, but the CaM gene yielded better species-specific primers (Table 2). Primers were tested for temperature optimization, selecting the highest temperature to have a strong and neat band (63 °C) (Figure 2B). This metric was used because higher temperatures often confer higher specificity [48]. Specificity was tested against various nontarget species to ensure no nontarget amplification (Figure 2D). Sensitivity was tested to determine the lower limits of DNA concentration of the assay. The novel CaM3 primer set had a detection limit of 0.005 ng/µL−1 (Figure 2E), which is comparable to other CaM region primer sets reported with a detection limit of 0.01–0.012 ng µL−1 on other pathogenic species [46,47].
Next, a CAPS method was designed and tested for differentiating the two species. The CaM3 primer set was selected from the three primer sets that amplified only target samples, due to a unique ScaI restriction digest site at the 95th base of the PCR product. With CaM3 primers, PCR amplified both C. jacksonii and C. monteithiana. Adding the CAPS assay allowed for differentiation (Figure 3 and Figure 4). There is a long history of using CAPS markers for species differentiation, but to the best of our knowledge the method has not been used in turfgrass pathosystems. [37,49]. This CAPS assay allows for rapid species differentiation without sequencing (about three hours).
The CAPS method was also examined in silico against the Clarireedia spp. sequences from Salgado-Salazar et al. study and found that of the sixteen sequences in GenBank, all but one sample of C. jacksonii is expected to produce two bands [11]. That one sample had a point mutation within the restriction digest region. That sample was from the Netherlands and had several SNPs that were not present in any other C. jacksonii sequences. No US isolates from that study had that SNPs, and none of the US samples were found to have the point mutation that would limit the CAPS method from species differentiation.
Direct PCR allows for plant pathogen identification with a rapid sample processing time. This method has been used previously in plant pathogens and on various fungi samples [50,51,52]. It removes the need for DNA extraction and typically halves the time required in a thermocycler. In our study, it cuts the sampling processing time by 40% compared to the same method with a DNA extraction step (Figure 4). Additionally, this reduces labor and material costs in addition to training required.
Overall, the potential benefit of the CAPS assay will allow for faster and accurate pathogen diagnosis for dollar spot. We hope that having a rapid species differentiation protocol will allow for more studies on pathogen distribution and hosts affected by each pathogen. We expect this method to be used by diagnostic clinics for rapid disease detection. This method is simple and requires only basic molecular tools, making it easily accessible to all diagnosticians. Allowing growers to rapidly know the species of Clarireedia present will allow for swift disease response and species targeted fungicide applications, reducing fungicide use and potential for new resistances to form.

Supplementary Materials

The following are available online at https://www.mdpi.com/article/10.3390/agronomy11081489/s1, Figure S1: Agarose gels for preliminary primer testing, Figure S2: Agarose gels for CAPS assay on direct PCR CaM3 amplification products using ScaI.

Author Contributions

Conceptualization, M.E.A.; Data curation, T.S.; Funding acquisition, M.E.A. & A.D.M.-E.; Investigation, M.E.A.; Project administration, M.E.A.; Resources, M.E.A., A.D.M.-E., and B.B.; Supervision, M.E.A.; Writing—original draft, T.S., S.W., and M.E.A.; Writing—review & editing, T.S., S.W., A.D.M.-E., B.B. and M.E.A. All authors have read and agreed to the published version of the manuscript.

Funding

This work was supported by a Georgia Department of Agriculture Specialty Crop Block Grant Program (SCBGP) Grant no. AWD00011205.

Acknowledgments

The authors wish to thank all the Molecular Diagnosis Laboratory members for their assistance and guidance for writing this article. Thanks to Suraj Sapkota and Brian Vermeer for assistance in sample collections.

Conflicts of Interest

The authors declare that none of the authors has competing interest.

References

  1. Chawla, S.; Roshni, A.; Patel, M.; Patil, S.; Shah, H. Turfgrass: A billion dollar industry. In Proceedings of the National Conference on Floriculture for Rural and Urban Prosperity in the Scenerio of Climate Change-2018, Pakyong, India, 16–18 February 2018. [Google Scholar]
  2. Dousset, B.; Gourmelon, F. Surface temperatures of the Paris Basin during summertime, using satellite remote sensing data. In Proceedings of the 5th International Conference on Urban Climate, Lodz, Poland, 1–5 September 2003. [Google Scholar]
  3. McPherson, E.G. Cooling urban heat islands with sustainable landscapes. In The Ecological City: Preserving and Restoring Urban Biodiversity; Platt, R.H.R., Rowan, A., Muick, P.C., Eds.; University of Massachusetts Press: Amherst, MA, USA, 1994; pp. 151–171. [Google Scholar]
  4. Kowalczyk, A.; Twardy, S.; Kuźniar, A. Permanent turf grass as the factor alleviating water erosion in the Carpathian Mountains. J. Water Land Dev. 2011, 15, 41–51. [Google Scholar] [CrossRef]
  5. Krenitsky, E.; Carroll, M.; Hill, R.; Krouse, J. Runoff and sediment losses from natural and man-made erosion control materials. Crop Sci. 1998, 38, 1042–1046. [Google Scholar] [CrossRef]
  6. Monteiro, J.A. Ecosystem services from turfgrass landscapes. Urban For. Urban Green. 2017, 26, 151–157. [Google Scholar] [CrossRef]
  7. Vargas, J.M. Management of Turfgrass Diseases, 2nd ed.; CRC Press: Boca Raton, FL, USA, 2018; ISBN 1351434187. [Google Scholar]
  8. Hu, J.; Zhou, Y.; Geng, J.; Dai, Y.; Ren, H.; Lamour, K. A new dollar spot disease of turfgrass caused by Clarireedia paspali. Mycol. Prog. 2019, 18, 1423–1435. [Google Scholar] [CrossRef]
  9. Salgado-Salazar, C.; Beirn, L.A.; Ismaiel, A.; Boehm, M.J.; Carbone, I.; Putman, A.I.; Tredway, L.P.; Clarke, B.B.; Crouch, J.A. Clarireedia: A new fungal genus comprising four pathogenic species responsible for dollar spot disease of turfgrass. Fungal Biol. 2018, 122, 761–773. [Google Scholar] [CrossRef]
  10. Bennett, F. Dollar spot disease of turf and its causal organism Sclerotinia homoeocarpa n. sp. Ann. Appl. Biol. 1937, 24, 236–257. [Google Scholar] [CrossRef]
  11. Crouch, J.A.; Beirn, L.; Boehm, M.; Carbone, I.; Clarke, B.B.; Kerns, J.P.; Malapi, M.; Mitchell, T.; Venu, R.; Tredway, L. Genome resources for seven fungal isolates that cause dollar spot disease in turfgrass, including Clarireedia jacksonii and C. monteithiana. Plant Dis. 2020. [Google Scholar] [CrossRef]
  12. Groben, G.; Clarke, B.B.; Murphy, J.A.; Koch, P.L.; Crouch, J.A.; Lee, S.; Zhang, N. Real-time PCR detection of Clarireedia spp., the causal agents of dollar spot in turfgrasses. Plant Dis. 2020. [Google Scholar] [CrossRef]
  13. Stowell, L.; Gelernter, W. Diagnosis of turfgrass diseases. Annu. Rev. Phytopathol. 2001, 39, 135–155. [Google Scholar] [CrossRef]
  14. Smiley, R.; Dernoeden, P.; Clarke, B. Compendium of Turfgrass Diseases, 3rd ed.; American Phytopathological Society: St. Paul, MN, USA, 2005; ISBN 9780890543306. [Google Scholar]
  15. Williams, D.W.; Powell, A.J.; Vincelli, P.; Dougherty, C.T. Dollar Spot on bentgrass influenced by displacement of leaf surface moisture, nitrogen, and clipping removal. Crop Sci. 1996, 36. [Google Scholar] [CrossRef]
  16. Horvath, B.; Kravchenko, A.; Robertson, G.; Vargas, J., Jr. Geostatistical analysis of dollar spot epidemics occurring on a mixed sward of creeping bentgrass and annual bluegrass. Crop Sci. 2007, 47, 1206–1216. [Google Scholar] [CrossRef]
  17. Martínez-Espinoza, A.D.; Burpee, L.L.; Waltz, C. Abiotic injuries and disorders of turfgrasses in Georgia. In University of Georgia; Georgia, U.O., Ed.; University of Georgia: Athens, GA, USA, 2009; Volume 1258. [Google Scholar]
  18. Couch, H.B.; Bloom, J.R. Influence of environment on diseases of turf-grasses. II. Influence of nutrition, pH and soil moisture on Sclerotinia dollar spot. Phytopathology 1960, 50, 761–763. [Google Scholar]
  19. Baird, P.R. Determining Dollar Spot Fungicide Resistance in Tennessee and Northern Mississippi. Master’s Thesis, University of Tennessee, Knoxville, TN, USA, 2005. [Google Scholar]
  20. Little, E.L. 2017 Georgia plant disease loss estimates (102-10). In University of Georgia; Georgia, U.O., Ed.; Annual Publication: Athens, GA, USA, 2019; pp. 1–21. [Google Scholar]
  21. Walsh, B.; Ikeda, S.S.; Boland, G.J. Biology and management of dollar spot (Sclerotinia homoeocarpa); an important disease of turfgrass. HortScience 1999, 34, 13–21. [Google Scholar] [CrossRef] [Green Version]
  22. Goodman, D.; Burpee, L. Biological control of dollar spot disease of creeping bentgrass. Phytopathology 1991, 81, 1438–1446. [Google Scholar] [CrossRef]
  23. Sapkota, S.; Martinez Espinoza, A.; Ali, E.; Vermeer, B.; Bahri, B. Taxonomical identification of Clarireedia species causing dollar spot disease of turfgrass in Georgia. Plant Dis. 2020. [Google Scholar] [CrossRef]
  24. Aynardi, B.A.; Jiménez-Gasco, M.; Uddin, W. Effects of isolates of Clarireedia jacksonii and Clarireedia monteithiana on severity of dollar spot in turfgrasses by host type. Eur. J. Plant Pathol. 2019, 155, 817–829. [Google Scholar] [CrossRef]
  25. DeVries, R.E.; Trigiano, R.N.; Windham, M.T.; Windham, A.S.; Sorochan, J.C.; Rinehart, T.A.; Vargas, J.M. Genetic analysis of fungicide-resistant Sclerotinia homoeocarpa isolates from Tennessee and Northern Mississippi. Plant Dis. 2007, 92, 83–90. [Google Scholar] [CrossRef] [Green Version]
  26. Hsiang, T.; Mahuku, G.S. Genetic variation within and between southern Ontario populations of Sclerotinia homoeocarpa. Plant Pathol. 1999, 48, 83–94. [Google Scholar] [CrossRef] [Green Version]
  27. Jo, Y.-K.; Niver, A.L.; Rimelspach, J.W.; Boehm, M.J. Fungicide sensitivity of Sclerotinia homoeocarpa from golf courses in Ohio. Plant Dis. 2006, 90, 807–813. [Google Scholar] [CrossRef] [PubMed]
  28. Hu, J.; Wu, J.; Gu, M.; Geng, J.; Guo, C.; Yang, Z.; Lamour, K. Baseline sensitivity and control efficacy of fluazinam against Clarireedia homoeocarpa. J. Crop Prot. 2020, 137, 105290. [Google Scholar] [CrossRef]
  29. Marvin, J.W.; Kerr, R.A.; McCarty, L.B.; Bridges, W.; Martin, S.B.; Wells, C.E. Curative evaluation of biological control agents and synthetic fungicides for Clarireedia jacksonii. HortScience 2020, 55, 1622–1625. [Google Scholar] [CrossRef]
  30. Flores, F.; Walker, N. First Report of dollar spot of sandbur caused by Sclerotinia homoeocarpa in Oklahoma. Plant Dis. 2014, 98, 1160. [Google Scholar] [CrossRef] [PubMed]
  31. Oren, E.; Klingeman, W.; Gazis, R.; Moulton, J.; Lambdin, P.; Coggeshall, M.; Hulcr, J.; Seybold, S.J.; Hadziabdic, D. A novel molecular toolkit for rapid detection of the pathogen and primary vector of thousand cankers disease. PLoS ONE 2018, 13, e0185087. [Google Scholar] [CrossRef] [PubMed] [Green Version]
  32. Palacio-Bielsa, A.; Cambra, M.A.; López, M.M. PCR detection and identification of plant-pathogenic bacteria: Updated review of protocols (1989–2007). J. Plant Pathol. 2009, 249–297. [Google Scholar] [CrossRef]
  33. Abd-Elsalam, K.A. Bioinformatic tools and guideline for PCR primer design. Afr. J. Biotechnol. 2003, 2, 91–95. [Google Scholar]
  34. Vincelli, P.; Tisserat, N. Nucleic acid-based pathogen detection in applied plant pathology. Plant Dis. 2008, 92, 660–669. [Google Scholar] [CrossRef] [PubMed] [Green Version]
  35. Michaels, S.D.; Amasino, R.M. A robust method for detecting single-nucleotide changes as polymorphic markers by PCR. Plant J. 1998, 14, 381–385. [Google Scholar] [CrossRef]
  36. Kaundun, S.S.; Marchegiani, E.; Hutchings, S.-J.; Baker, K. Derived polymorphic amplified cleaved sequence (dPACS): A novel PCR-RFLP procedure for detecting known single nucleotide and deletion–insertion polymorphisms. Int. J. Mol. Sci. 2019, 20, 3193. [Google Scholar] [CrossRef] [Green Version]
  37. Szalanski, A.L.; Sui, D.D.; Harris, T.S.; Powers, T.O. Identification of cyst nematodes of agronomic and regulatory concern with PCR-RFLP of ITS1. J. Nematol. 1997, 29, 255–267. [Google Scholar]
  38. Adachi, M.; Sako, Y.; Ishida, Y. Restriction fragment length polymorphism of ribosomal DNA internal transcribed spacer and 5.8s regions in Japanese Alexandrium species (dinophyceae). J. Phycol. 1994, 30, 857–863. [Google Scholar] [CrossRef]
  39. Park, E.-J.; Fukuda, S.; Endo, H.; Kitade, Y.; Saga, N. Genetic polymorphism within Porphyra yezoensis (Bangiales, Rhodophyta) and related species from Japan and Korea detected by cleaved amplified polymorphic sequence analysis. Eur. J. Phycol. 2007, 42, 29–40. [Google Scholar] [CrossRef] [Green Version]
  40. Reale, S.; Doveri, S.; Díaz, A.; Angiolillo, A.; Lucentini, L.; Pilla, F.; Martín, A.; Donini, P.; Lee, D. SNP-based markers for discriminating olive (Olea europaea L.) cultivars. Genome 2006, 49, 1193–1205. [Google Scholar] [CrossRef] [PubMed]
  41. Zhang, Y.; Iaffaldano, B.J.; Zhuang, X.; Cardina, J.; Cornish, K. Chloroplast genome resources and molecular markers differentiate rubber dandelion species from weedy relatives. BMC Plant Bio. 2017, 17, 1–14. [Google Scholar] [CrossRef] [PubMed] [Green Version]
  42. White, T.J.; Bruns, T.; Lee, S.; Taylor, J. Amplification and direct sequencing of fungal ribosomal RNA genes for phylogenetics. PCR Protoc. A Guide Methods Appl. 1990, 18, 315–322. [Google Scholar]
  43. Waliullah, S.; Hudson, O.; Oliver, J.E.; Brannen, P.M.; Ji, P.; Ali, M.E. Comparative analysis of different molecular and serological methods for detection of Xylella fastidiosa in blueberry. PLoS ONE 2019, 14, e0221903. [Google Scholar] [CrossRef] [Green Version]
  44. Carbone, I.; Kohn, L.M. A method for designing primer sets for speciation studies in filamentous ascomycetes. Mycologia 1999, 91, 553–556. [Google Scholar] [CrossRef]
  45. Stackhouse, T.; Martinez-Espinoza, A.D.; Ali, M.E. Turfgrass disease diagnosis: Past, present, and future. Plants 2020, 9, 1544. [Google Scholar] [CrossRef] [PubMed]
  46. Susca, A.; Stea, G.; Mulé, G.; Perrone, G. Polymerase chain reaction (PCR) identification of Aspergillus niger and Aspergillus tubingensis based on the calmodulin gene. Food Addit. Contam. 2007, 24, 1154–1160. [Google Scholar] [CrossRef] [Green Version]
  47. Mulè, G.; Susca, A.; Stea, G.; Moretti, A. A species-specific PCR assay based on the calmodulin partial gene for identification of Fusarium verticillioides, F. proliferatum and F. subglutinans. Eur. J. Plant Pathol. 2004, 110, 495–502. [Google Scholar] [CrossRef]
  48. Roux, K.H. Optimization and troubleshooting in PCR. Cold Spring Harb. Protoc. 2009, 2009, 66. [Google Scholar] [CrossRef] [Green Version]
  49. Sialer, M.F.; Cillo, F.; Barbarossa, L.; Gallitelli, D. Differentiation of cucumber mosaic virus subgroups by RT-PCR RFLP. J. Plant Path. 1999, 81, 145–148. [Google Scholar]
  50. Chaffin, A.; Dee, M.; Boggess, S.; Trigiano, R.; Bernard, E.; Gwinn, K. First report of Chaetomium globosum causing a leaf spot of hemp (Cannabis sativa) in Tennessee. Plant Dis. 2020, 104, 1540. [Google Scholar] [CrossRef]
  51. Ben-Amar, A.; Oueslati, S.; Mliki, A. Universal direct PCR amplification system: A time-and cost-effective tool for high-throughput applications. 3 Biotech 2017, 7, 1–7. [Google Scholar] [CrossRef] [PubMed]
  52. Jumpponen, A.; Newsham, K.K.; Neises, D.J. Filamentous ascomycetes inhabiting the rhizoid environment of the liverwort Cephaloziella varians in Antarctica are assessed by direct PCR and cloning. Mycologia 2003, 95, 457–466. [Google Scholar] [CrossRef]
Figure 1. Signs and cultures of Clarireedia jacksonii and C. monteithiana. (A) Symptoms of dollar spot caused by C. jacksonii on Agrostis stolonifera (bentgrass). (B) Culture of C. jacksonii grown on potato dextrose agar (PDA) for 14 days. (C) Symptoms of dollar spot caused by C. monteithiana on Paspalum vaginatum (seashore paspalum). (D) Culture of C. monteithiana grown on potato dextrose agar (PDA) for 14 days.
Agronomy 11 01489 g001
Figure 2. CaM PCR primer design and optimization. (A) New primer design for CaM3 PCR primers amplifying Clarireedia spp. (B) Temperature optimization of CaM3 primers from 55–68 °C using 2020-DS2 dollar spot sample. (C) Testing CaM3 PCR primers, at the optimal annealing temperature of 63 °C, with eight Clarireedia spp. samples (1: 2020-DS2, 2: 2020-DS3, 3: 2020-DS4, 4: 2020-DS5, 5: 2020-DS6, 6: 2020-DS8, 7: 2020-DS10, 8: 2020-DS15). (D) Specificity test against one Clarireedia spp. isolate (1: 2020-DS2) and 11 nontarget species (2: Phytophthora sojae, 3: Fusarium sp., 4: Colletotrichum spp., 5: Bipolaris spp. 6: Botrytis sp., 7: Cladosporium sp., 8: Rhizotonia solani, 9: Leptosphaerulina sp., 10: Fusarium sp., 11: Pyricularia grisea, 12: Rhizotonia solani, 13: Ophiosphaerella korrae, and 14: Magnaporthe poae). (E) Sensitivity test of CaM3 primers using a serial dilution of targeted DNA from 5 ng μL−1 to 0.0005 ng μL−1 using 2020-DS2 dollar spot sample. Here, Ladder: 100 bp as ladder marker, Neg: dH20 as negative control.
Agronomy 11 01489 g002
Figure 3. CAPS assay on CaM3 amplification products using ScaI. (A) ScaI restriction site (AGT^ACT) was only identified in C. jacksonii at the 95th base pair. (B) 240 bp amplification products using CaM3 primer set of fifteen Clarireedia spp. samples. (C) CAPS assay results targeting a SNP in C. jacksonii at the 95th base pair. The result was a (240 bp) band in C. monteithiana isolates (samples 1, 3–6, 9, 11–15) and two (95 and 145 bp) bands in C. jacksonii isolates (samples 2, 7–8, 10). (B,C) were performed on 11 isolates of C. monteithiana (1:2020-DS2, 3: 2020-DS4, 4: 2020-DS5, 5: 2020-DS6, 6: 2020-DS7, 9: 2020-DS11, 11: 2020-DS16, 12: 2020-DS17, 13: 2020-DS18, 14: 2020-DS19, 15: 2020-DS21) and 4 C. jacksonii (2: 2020-DS3, 7: 2020-DS8, 8: 2020-DS10, 10: 2020-DS15). 100 bp ladder marker was used, Neg: dH20.
Agronomy 11 01489 g003
Figure 4. Step by step of modified CAPS assay using direct PCR to detect specifically C. jacksonii and C. monteithiana. The estimated time for this protocol was 3 h.
Agronomy 11 01489 g004
Table 1. Georgia (GA) 2019–2020 Clarireedia spp. samples used in this study.
PathogenMDL NameGrass SpeciesGrass TypeGA, US County
C. monteithiana2020-DS2Zoysia sp.WarmSpalding
C. jacksonii2020-DS3Agrostis stolonifera L.CoolSpalding
C. monteithiana2020-DS4Zoysia sp.WarmFulton
C. monteithiana2020-DS5Cynodon dactylon L.WarmCook
C. monteithiana2020-DS6Paspalum vaginatum SwartzWarmCook
C. monteithiana2020-DS7Cynodon dactylon L.WarmSpalding
C. jacksonii2020-DS8Digitaria sp.WarmSpalding
C. jacksonii2020-DS10Festuca arundinacea SchreberCoolSpalding
C. monteithiana2020-DS11Zoysia sp.WarmFulton
C. jacksonii2020-DS15Agrostis stolonifera L. CoolSpalding
C. monteithiana2020-DS16Cynodon dactylon L.WarmSpalding
C. monteithiana2020-DS17Paspalum vaginatum SwartzWarmSpalding
C. monteithiana2020-DS18Zoysia sp.WarmSpalding
C. monteithiana2020-DS19Cynodon dactylon L.WarmCoweta
C. monteithiana2020-DS21Zoysia sp.WarmUpson
Table 2. All primers designed for this study.
Primer Set NameGene TargetForward Primer Sequence
(F)
Reverse Primer Sequence
(R)
Recommended Annealing Temperatures
F/R (°C)
Produced Bands at Recommended Temperatures?Only One, Correctly Sized Band?Amplified Only Target Samples? (Specificity)Had a Good CAPS Assay Target?
MCM1Mcm7GCTGGAATTTCGATGCCCTAGAGCCGACCGTTGAAGTTAATG66.7/65No---
MCM3Mcm7CTGTTCAATCCGTCTAAACACGACCAGTTGGTCATATTCCGAG63.3/62.7No---
ITS1ITSTTTGGCAGGCTGCTGCCACCCTGTAACGAGAGGTATGT69/59No---
CaM4CaMCTATTTCAGCCCTATGTGAACCAGCATGATATTCAAGATCGC57.8/62.1No---
MCM2Mcm7CATCGAGATGGCCGTAGATCGATGTCGTAGATGTCGCCG64.5/64.4YesNo--
MCM4Mcm7GCAAGAATATGCCGGCGACCGCCAGACTGCAAGGTCA67.7/66.6YesNo--
ITS2ITSTTTGGCCGGCTGCTCGAACCCTGTAACGAGAGGTATGTGT71.8/62.5YesYesNo-
ITS3ITSGCTTTGGCAGGCTGCTGGAGCCCTGTAACGAGGTGTATGT71.2/62.3YesYesNo-
CaM1CaMAGTCCTCCGCTACCATCCCAGCATGATATTCAAGATCGC61.7/62.1YesYesNo-
ITS4ITSCTTTGGCCGGCTGCTCGAACCCTGTAACGAGAGGTATGTGT72.2/62.5YesYesYesNo
CaM2CaMCTTGGACCACTATCGCGACCTGCAAACGTCAGTCTACAGC66.8/61.7YesYesYesNo
CaM3CaMCTATTTCAGCCCTTTGCGAAGCAGCATGATATTCAAGGTCGC64.7/64.4YesYesYesYes
Publisher’s Note: MDPI stays neutral with regard to jurisdictional claims in published maps and institutional affiliations.

