Abstract
The physicochemical and microbial properties of soil under long-term monoculture of winter wheat were studied to assess the effects of two tillage systems of different intensities: reduced (RT) and conventional (CT). The research was carried out on an 18-year-old experimental field at Grabów (eastern Poland) between 2018 and 2020. The RT (ploughless) and the CT (mouldboard ploughing) systems with machine operating depths of up to 10 and 25 cm, respectively, were used. The analysed parameters were as follows: soil texture, pH, readily dispersible clay content (RDC), soil organic matter (SOM), carbon from particulate organic matter (POM-C), hot- and cold-water-extractable organic carbon (HWEC, CWEC) and nitrogen (HWEN, CWEN), soil basal respiration (SBR), microbial biomass carbon (MBC) and nitrogen (MBN), nitrification potential (NP), dehydrogenases (DEH), and acid (ACP) and alkaline (ALP) phosphatases activities. Several single soil quality indices, including: metabolic (qCO2) and microbial (MicQ) quotients, enzymatic pH level indicator (EpHI), stratification ratio (SR), and metabolic potential index (MP) were calculated. The use of RT resulted in increased SOM and, therefore, in decreased RDC and increased values of soil stability, POM-C, HWEC, CWEC, HWEN, CWEN, MBC, and MBN in relation to CT. The MicQ, EpHI, SR, and MP well reflected the effects of RT and CT systems on soil and appeared to be useful in soil quality assessment. The results showed the beneficial effects on soil of the less intensive RT system in comparison with CT. Statistical analysis showed the significance of differences between tillage systems and interrelationships between the studied soil quality parameters.
1. Introduction
Different tillage practices may cause changes in soil physical, chemical, and microbiological properties, and have a major impact on soil sustainability and fertility [1]. Tillage practices may also influence the distribution pattern of organic carbon in soil, the most valid indicator of soil quality due to its crucial effect on soil properties [2,3,4]. Conventional tillage practices, which routinely include a deep soil inversion, may adversely affect long-term soil productivity by contributing to the loss of organic matter and increase the risk of soil erosion along with further negative environmental effects, such as decrease in biodiversity [1,5,6]. No-tillage (conservation tillage) practices contribute mainly to stratification of soil organic matter, and thus to reduction of soil erosion processes, promotion of water retention in soil [7,8], and soil stability in water [9,10]. Several authors [4,6,10] reported a significant increase in soil bulk density in no-tillage in comparison with 10 cm reduced tillage. However, crop response under 10 cm reduced tillage was positively affected compared with no-tillage. In the last decade, reduced tillage is increasingly being used to maintain soil quality and reduce soil disturbance [11,12].
To better understand changes in soil organic matter, its labile fractions have been recognized as important in a study on changes in agricultural soils influenced by tillage practice or climate conditions [2,13,14,15]. Soil labile organic matter fractions providing nutrients and protection for soil microorganisms can bind to extracellular enzymes to preserve them from proteolysis and chemical degradation [14,15,16].
Soil microorganisms activity is a key factor to maintain nutrient cycling, decomposition of agrochemicals and pollutants, and control plant pest; therefore, it has often been indicated as an essential component of soil fertility [17]. Soil tillage practices modify the soil microbial communities and affect intensity of microbiological processes in various ways, e.g., the rate of organic matter decomposition, nitrogen mineralization, biodiversity level, and microbial metabolic activity. Possible consequences include nitrogen losses, soil organic carbon decomposition, and plant growth disorders [18].
Soil enzyme activities are also greatly influenced by soil management and organic matter stratification pattern in soil [19,20]. Soil enzymes play a key role in the decomposition of soil organic matter [21,22], respond quickly to soil disturbances, and reflect changes in activity of soil microbial communities. They are also relatively easily measurable parameters that can be used to examine the processes related to the active labile carbon fractions in soil [23]. For example, dehydrogenases activities are one of the most commonly used biological indicators for evaluation of soil quality [4,15]. Measurement of activities of soil dehydrogenases, a class of intracellular enzymes, provides information about the status of environment and activity of microbial communities inhabiting the soil, especially under different agricultural practices [23,24]. Phosphatases, a broad class of enzymes, are frequently used as valid biological indicators of soil fertility. By their abilities to catalyse hydrolysis of esters and anhydrides of phosphoric acid, they play a key role in the phosphorus cycle. Acid and alkaline phosphatases differ in their pH optimum and substrate specificity [25,26,27,28].
In the context of the complex interactions and dynamics of soil properties changes, many researchers have stressed the practical need to developed indices of soil quality, using a combination of variables reflecting a range of soil functions, such as mineralization processes, metabolism, and nutrient cycling [24,29]. Despite many attempts, it has not yet been possible to develop a universal indicator of soil quality. Therefore, in the papers published during last two decades, the close relations among physical, chemical, and biological variables, confirmed by using already introduced indices, were frequently discussed [30,31,32,33]. These indices are helpful mostly in assessing soil environment changes and worthy to be tested in various pedological and climatic conditions.
Considering the above, the aim of the study was to evaluate changes of several soil physicochemical and microbial properties as the consequences of reduced (RT) and conventional (CT) tillage systems under long-term monoculture of winter wheat. Our hypothesis was that the ploughless RT system would improve the soil condition, thus increasing the organic matter in the topsoil and related soil properties, measured with studied parameters, in relation to a highly intensive CT system. To better assess changes in soil physicochemical and biological properties, several single indices were used for the evaluation of soil quality.
2. Materials and Methods
2.1. Field Experiment Description and Soil Sampling
The long-term field experiment was established at the Grabów Experimental Station (51°21′18″ N, 21°40′09″ E) at an altitude of 166 m above sea level [10], belonging to the Institute of Soil Science and Plant Cultivation State Research Institute (IUNG-PIB) in Puławy, Poland. The 3-year study (2018–2020) was carried out on an ongoing long-term (since 2002 until now) experimental field located on a loamy sand soil [34] classified as an Eutric Fluvisol according to the Food and Agriculture Organization of the United Nations (FAO) and World Reference Base for Soil Resources (WRB) [35]. At each field, the soil with initial soil organic carbon (SOC) content 7.1 g kg−1 at 0–10 cm depth and 6.1 g kg−1 at 10–20 cm depth was cultivated continuously with the same tillage system (RT, and CT) (RT and CT), in which the winter wheat was grown in monoculture [4]. Some characteristics of the soil are given in Table 1.

Table 1.
Basic soil characteristics at 0–20 cm depth under different tillage systems for years 2018–2020.
The reduced tillage system is based on soil crushing–loosening equipment and a rigid-tine cultivator to 10 cm depth. The conventional tillage system is based on the mouldboard plough to 25 cm depth and traditional soil tillage equipment. The pre-plant ploughing was usually performed in the first decade of October, followed by disking to a depth of 8 cm and rolling. Tillage started when the soil water content reached or was close to the optimum (about 0.19–0.20 kg kg−1 of dry soil), as calculated from the water retention curve [36]. In both treatments, the soil surface was mulched with chopped straw (0.4 kg m−2). The long-term tillage experiment was set up on 1.0 ha experimental plots in a randomized block design in four replicates, so it was possible to use real agricultural practices. Winter wheat was sown in the first decade of October, at a density of 400 seeds per m2, and at a sowing depth of 3–4 cm.
Nitrogen, phosphorus and potassium were applied under both treatments as follows: the fall-applied mineral fertilizer delivered 18 kg N ha−1, 60 kg P ha−1, and 90 kg K ha−1; spring-applied fertilizer (ammonium nitrate) delivered 150 kg N ha−1 in three doses: 70 kg N ha−1 at the beginning of spring growth phase of winter wheat plants (tillering) (26–27 BBCH scale, the abbreviation for German Biologische Bundesanstalt, Bundessortenamt und Chemische Industrie), 55 kg N ha−1 at the stem elongation (BBCH 32–33), and 25 kg N ha−1 at the heading phase (BBCH 55–56) [37]. Two different herbicides at the volume of 1.0 dm3 ha−1 were applied post-emergence in mid-late October and early April in both tillage systems, while fungicides were applied at the rate of 0.5 dm3 ha−1 and 1.0 dm3 ha−1 in late April and May, respectively. Fertilization and full chemical plant protection of winter wheat plants were applied according to agrotechnical recommendations generally used in Poland.
Each year, samples of soils under each treatment were taken in every growing season of winter wheat, just before harvest, from four depths: 0–5, 5–10, 15–20, and 30–35 cm. Undisturbed soil samples were collected in 100 cm3 cylinders for soil water content measurement. For other properties, disturbed field-moist soil samples were thoroughly mixed and transferred in coolers to the laboratory at a temperature of 6–8 °C. For microbiological analysis, soil was hand sieved through 2 mm sieve within 24 h, and plant roots were removed carefully. For further analysis, soil samples were stored at 4 °C for maximally 1 month. The soil was analysed, using chosen parameters as: physical and chemical (soil texture, pH, RDC, SOM, POM-C, HWEC, CWEC and HWEN, CWEN), and microbiological activity (SBR, MBC, MBN, NP), and soil enzyme activities (DEH, ACP and ALP), and calculated soil quality indicators (qCO2, MicQ, EpHI, SR, MP).
2.2. The Weather Conditions
The weather conditions during the experimental period (2018–2020) in comparison with long-term (1976–2016) average air temperature and sum of precipitation are shown in Figure 1. At the experimental site, the climate is temperate with a mean annual rainfall of 631.7 mm and a mean annual temperature of 8.0 °C, according to observations for the 40-year period.
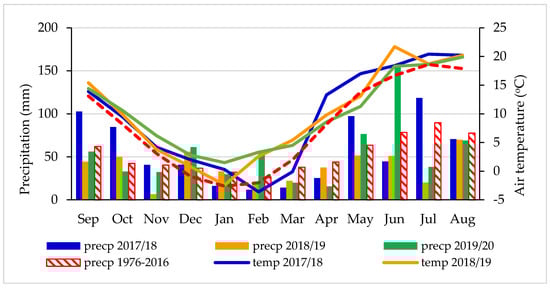
Figure 1.
Monthly sums of precipitation (mm) and average air temperatures (°C) and long-term means (1976–2016) at the Grabów Experimental Station.
The data of precipitation and temperature were obtained from the Grabów Experimental Station based on direct measurements from a meteorological station located next to the fields. The years of the study, 2018–2020, showed higher mean air temperatures (by 1.6, 1.8 and 2.0 °C, respectively) than was the long-term average (Figure 2).
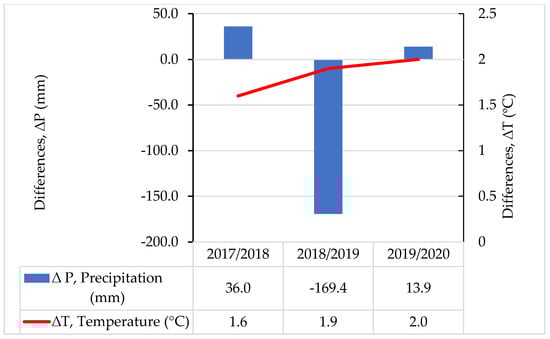
Figure 2.
Differences ∆P (mm) between annual sum of precipitation and long-term (1976–2016) mean annual precipitation (at the value of long-term mean, 631.7 mm, ∆P = 0). Differences ∆T (°C) between mean annual air temperature and the long-term (1976–2016) mean annual temperature (at value of long-term mean air temperature = 8.0 °C, ∆T = 0).
The sums of precipitation were higher by 36.0 mm for the year 2017/2018 and by 13.9 mm for 2019/2020 than the long-term average of 631.7 mm. However, year 2018/2019 was very dry and the sum of precipitation was lower by 169.4 mm in comparison with the long-term (1976–2016) sum of precipitation (Figure 2). The required amount of precipitation for winter wheat during the vegetation period oscillates close to 400 mm on sandy soils. The water request for wheat increases as the plant develops (for the flowering and heading phase), reaching the highest values in the second part of May and throughout June. It is important to note that in November 2018, the monthly sum of precipitation was the lowest during the 3-year research period and reached only 6.6 mm.
2.3. Methods of Soil Analyses
2.3.1. Soil Physical Analyses
The soil particle size distribution was analysed using the Mastersizer 2000 laser diffraction particle size analyser (Malven Instrument, Malven, UK). The soil classification was based on particle size distribution, according to the recommendations of the United States Department of Agriculture (USDA). Soil water content (SWC) was determined using gravimetric method. Soil stability in water was measured in terms of readily dispersible clay (RDC) content expressed in g per 100 g of soil, using a Hach 2100 AN ratio turbidimeter [10].
2.3.2. Soil Chemical Analyses
The soil pHKCl was measured potentiometrically (volume fraction 1:2.5 solid:liquid mixture w/v) in a suspension of soil within a 1 mol dm−3 KCl solution, using a pH meter. The Egner–Riehm method was used to measure available P and K, and Schachtschabel method for available Mg. Mineral nitrogen (Nmin) was determined with the colorimetric method, using flow auto-analyser (QuAAtro39 SealAutoAnalyzer Analytical, Mequon, WI, USA). The content of total soil organic carbon (SOC) was measured by sulfochromic oxidation of organic carbon, followed by titration of the excess K2Cr2O7 with FeSO4(NH4)2SO4 6H2O.
Particulate organic matter (POM) (53–2000 µm) fraction in the soil was estimated as described in Gajda et al. [15]. Carbon from POM (POM-C) was calculated dividing the assessed POM values by the conversion factor 1.724, assuming that the percentage of organic carbon in POM was 58% [38].
Quantities of hot-water-extractable carbon (HWEC) and nitrogen (HWEN), and cold-water-extractable carbon (CWEC) and nitrogen (CWEN) were determined according to Ghani et al. [39]. HWEC and HWEN were determined by heating (in a water bath) of soil with distilled water (1:10 w/v soil to solution ratio) for 24 h at 80 °C, while CWEC and CWEN were determined by shaking the soil with distilled water (1:10 w/v soil to solution ratio) for 24 h in 4 °C. The soil extracts were centrifuged (4000 rpm for 10 min), decanted, filtered (through a prewashed 0.45 μm cellulose filter) and split into two subsamples (i) for carbon estimation by thermal oxidation, using CN Analyzer (Multi N/C 2100/2100 Jena Analytics, Jena, Germany), and (ii) for inorganic nitrogen (NH4+ and NO3) measurement by colorimetric method using flow auto-analyser (QuAAtro39 SealAutoAnalyzer Analytical, Mequon, WI, USA).
2.3.3. Soil Microbial Activity Analyses
The soil basal respiration (SBR) was determined according to the ISO 16072 method [40]. Field-moist soil subsamples of 20 g were incubated for the 24 h at the temperature of 20 ± 2 °C in darkness. Carbon dioxide (CO2) released during incubation was absorbed in NaOH solution (0.05 mol dm−3) and precipitated as barium carbonate (BaCO3) by adding a BaCl2 solution (0.5 mol dm−3). The non-consumed NaOH was titrated with a HCl solution (0.1 mol dm−3) in the presence of phenolphthalein as indicator, and the amount of CO2 was calculated [40]. SBR was expressed as a µg of released CO2 per gram of dry weight of soil per hour.
Soil microbial biomass carbon (MBC), and microbial biomass nitrogen (MBN) contents were determined by the chloroform-fumigation-extraction modified method PN-EN ISO 14240-2 [41]. After 24 h fumigation, soil was extracted with 0.5 mol dm−3 K2SO4, and C and N contained in soil extracts were determined on a CN Analyzer (Multi N/C 2100 Jena Analytics, Jena, Germany). The quantities of MBC and MBN were calculated from the difference in extractable carbon (EC) and extractable nitrogen (EN), before and after fumigation according to the following formulas: MBC = EC/kEC, and MBN = EN/kEN. The extraction efficiency factors kEC and kEN represented the fractions of the killed microbial biomass extracted as C and N, respectively. Under standardized conditions, they were used as conversion factors to convert obtained C and N values to microbial biomass. The results were expressed as µg of C or N per g of dry weight of soil.
The activity of dehydrogenases (DEH) [1.1.1.56] was measured, using TTC (2,3,5-triphenyltetrazolium chloride) as a substrate, as described in Gajda et al. [15], and expressed as µg of TPF (triphenyl formazan) per g of soil (oven-dried at 105 °C) per 24 h.
The soil phosphomonoesterases—as acid phosphatase (ACP, E.C.3.1.3.2) and alkaline phosphatase (ALP, E.C.3.1.3.1) activities—were determined using the Tabatabai and Bremner method [42], with the synthetic compound p-nitrophenyl phosphate as a substrate. p-Nitrophenyl phosphate is hydrolysed to p-nitrophenol (pNP) and inorganic phosphate by both enzymes. The intensity of the yellow colour of pNP was identified spectrophotometrically at a wavelength of 400 nm for both enzymes and expressed as µg of pNP per g of soil (oven-dried at 105 °C) per 1 h. The results were calculated based on a standard curve we prepared.
The nitrification potential (NP) was determined according to the ISO 15685 method [43]. Field-moist soil subsamples (of 25 g each) were mixed with a mineral medium containing 1.5 mmol dm−3 (NH4)2SO4 as a substrate, 1.0 mmol dm−3 potassium phosphate buffer (KH2PO4 and K2HPO4) and 5.625 mmol dm−3 NaClO3. After 24 h incubation with shaking (125 rpm, 20 °C), 4.0 mol dm−3 KCl was added to the soil slurry, and the suspension was filtered (390-grade filter paper). Subsequently, the filtrate was mixed with the colour reagent (mixture of sulphanilamide and N-(1-naphthyl)ethylenediamine dihydrochloride). The amount of nitrite formed in the nitrification process was determined using Lambda 45 UV–VIS spectrophotometer (Perkin Elmer, Waltham, MA, USA) at λ = 543 nm, and expressed as μg NO2– per gram of dry weight of soil.
All microbial activity analyses of soil were performed in three independent replicates.
2.3.4. Indices for Soil Quality Assessment
Several single soil quality indices were chosen to assess the soil condition under different tillage systems:
Metabolic quotient (qCO2) was calculated as the ratio between microbial respiration as soil basal respiration (SBR) and microbial biomass (MBC) and expressed as milligram of CO2-C released per gram of biomass C per hour [40,44].
Microbial quotient (MicQ) was expressed as the microbial biomass carbon (Cmic) and SOC ratio according to Anderson and Domsch [45].
The enzymatic pH level indicator was expressed as the ALP:ACP activity ratio, as described by Dick et al. [31].
Stratification ratio (SR) is defined as a soil property in the surface soil divided by the value at a lower depth [46]. In our study, for soils under both treatments, the SRs of summarized labile organic carbon fractions at the surface layer (0–5 cm) was divided by the corresponding values at lower layers (5–10 cm, 15–20 cm, and 30–35 cm). The stratification ratios, denoted SR1 [(0–5 cm) : (5–10 cm)], SR2 [(0–5 cm) : (15–20 cm)], and SR3 [(0–5 cm) : (30–35 cm)] for the RT system and SR4 [(0–5 cm) : (5–10 cm)], SR5 [(0–5 cm) : (15–20 cm)], and SR6 [(0–5 cm) : (30–35 cm)] for the CT system, were calculated according to Franzluebbers [46]:
Index of metabolic potential (MP) was calculated as the ratio of dehydrogenases activities (reflecting the size and activity of viable soil microorganisms) and concentration of water-extractable carbon in soil [30].
2.4. Statistical Analysis
To evaluate the results, the software package Statgraphics Centurion version XVIII (Statpoint Technologies, The Plains, VA, USA) was applied. The analysis of variance (ANOVA) was used to evaluate the effects of different tillage systems on the measurable variables, and the Tukey’s HSD (honest significant differences) test was used to calculate significant differences at p ≤ 0.05.
Pearson’s correlation coefficients were used as a measure of the strength of linear association between studied parameters at p ≤ 0.05.
3. Results and Discussion
3.1. Effects on Soil Stability
The RDC content decreased in the soil under RT throughout the soil profile and thus soil stability in water increased in comparison with the soil under CT (Figure 3). Under RT, contents of RDC at the 0–5, 5–10 and 10–15 cm soil layers were half as low as in CT. Similarly, Czyż and Dexter [10] and Gajda et al. [4,6] found that soils under reduced tillage and no-tillage showed lower contents of RDC, thus increased soil stability in water and improved physical soil quality compared with traditional tillage. Moreover, an earlier study of a long-term field experiment on a silt loam soil at the Krasne Research Station near Rzeszów, Poland, showed that reduced tillage (non-inversion system) decreased significantly the RDC content, contrary to traditional tillage involving soil inversion treatment [47].
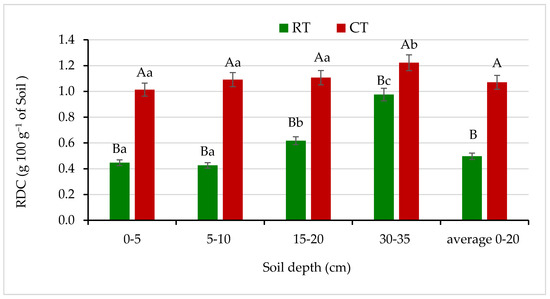
Figure 3.
Readily dispersible clay (RDC) content in soil under different tillage systems in 2018–2020 (expressed as means for the 3 years, n = 12). Different letters represent significant differences (p ≤ 0.05) across treatments according to Tukey’s HSD test; lowercase letters within the same tillage system indicate significant differences between soil depths; uppercase letters indicate differences between tillage systems. RT—reduced tillage system; CT—conventional tillage system; n—number of samples. Vertical bars represent standard errors.
3.2. Effects on Soil Organic Carbon
Different tillage practices produce differences in soil organic carbon resources [4,46,47,48]. Figure 4 shows that accumulations of SOC at the 0–5 and 5–10 cm depths of soil under RT were significantly greater—by 33% and 26%, respectively—than under CT. In the deeper soil layers, SOC was significantly different between RT and CT and decreased with increasing soil depth in both tillage systems. The lower SOC content in the deeper soil layers of 15–20 and 30–35 cm in the RT was most likely the result of the no inversion tillage, which favors the accumulation of SOC in the surface soil layers. In CT, during the plowing SOC is introduced from the upper into the deeper layers of the soil profile, what result in the higher concentraction compare to RT. Moreover, Stanek-Tarkowska et al. [47], in a Haplic Luvisol soil under RT, observed accumulation of SOC higher by 25% and 7% at the 0–5 and 5–10 cm depths, respectively, compared with CT. Similarly, Gajda et al. [4], and Małecka et al. [48] found an increase in SOC content by 19.5% and 23% at the 0–5 cm soil layer under RT in comparison with CT. Earlier, Franzluebbers [46], evaluating zero- or no-tillage also found significant SOC increase in the top layers of soil. The results obtained by Czyż and Dexter [10] indicated that the RT system improved some soil conditions, e.g., soil stability in water. Moreover, the higher SOC concentration in soil under RT induced a decrease in RDC content, as compared with that of the CT system.
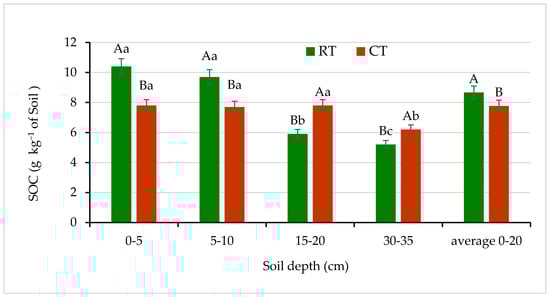
Figure 4.
Soil organic carbon (SOC) content in soil under different tillage systems in 2018–2020 (expressed as means for the 3 years, n = 12). Different letters represent significant differences (p ≤ 0.05) across treatments according to Tukey’s HSD test; lowercase letters within the same tillage system indicate significant differences between soil depths; uppercase letters indicate differences between tillage systems. RT—reduced tillage system; CT—conventional tillage system; n—number of samples. Vertical bars represent standard errors.
3.3. Effects on Particulate Organic Matter Carbon
The POM measurement can indicate the direction of long-term changes in soil organic matter in response to agricultural management [49]. Cambardella and Elliott [13] reported that carbon contained in POM fraction shows a faster turnover rate than total SOC, and thus responds relatively rapidly to changes caused by soil tillage. The effects of tillage systems on changes of POM-C content in soil are presented on Figure 5.
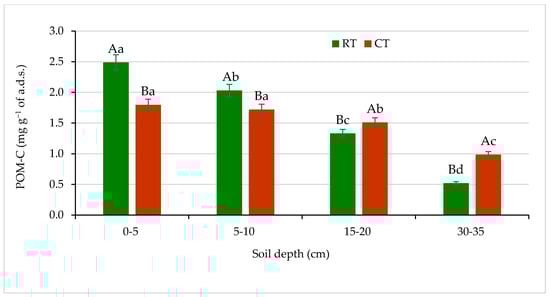
Figure 5.
Content of carbon in particulate organic matter (POM-C) in soil under different tillage systems in 2018–2020 (expressed as means for the 3 years, n = 12). Different letters represent significant differences (p ≤ 0.05) across treatments according to Tukey’s HSD test; lowercase letters within the same tillage system indicate significant differences between soil depths; uppercase letters indicate differences between tillage systems. RT—reduced tillage system; CT—conventional tillage system; n—number of samples; a.d.s.—air-dried soil. Vertical bars represent standard errors.
The assessed quantities of POM-C were the most different between the RT and CT systems in the surface soil at 0–5 cm depth. The POM-C content under RT at the surface soil amounted to 2.5 mg g−1 a.d.s., which was 28% more compared with CT. In the lower soil layers, 5–10 and 15–20 cm, under RT, the POM-C content decreased significantly by 20% and 48% in relation to 0–5 cm depth, respectively. Under, CT no significant differences in POM-C quantities between 0–5 and 5–10 cm depths were noticed. At the soil layers 15–20 and 30–35 cm under CT, the POM-C content was 13% and 50% higher, respectively, as compared with RT. In the soil under RT, the clearer spatial differentiation in POM-C content was observed in relation to CT. The lowest amounts of POM-C were found in both the RT and CT system at the sub-arable layer of 30–35 cm (Figure 5). Other researchers [16,33,50] have also reported significantly higher concentrations of POM and POM-C at 0–5 cm depth in no-till soil compared with conventionally tilled soil. Previous studies recognized POM as an important parameter of soil quality due to its functions and associations with multitude processes in soil, e.g., soil aggregation and formation of water-soluble carbon, and an energy source for soil microorganisms [51].
3.4. Effects on Hot-Water-Extractable Carbon and Nitrogen, and Cold-Water-Extractable Carbon and Nitrogen Fractions
HWEC, HWEN, CWEC and CWEN are labile fractions of soil organic matter, more sensitive and responding faster to soil changes than total SOC and organic N [51,52]. The continuous application of RT and CT resulted in different distribution of water-extractable C fractions in the studied soil, differentiating clearly both tillage systems and soil depths (Figure 6A). The highest quantities of both fractions (HWEC and CWEC) were assessed in the surface soil depth of 0–5 cm in the RT system as 1484.4 and 673.5 µg g−1 d.w. of soil, respectively, which were 26% higher, on average than the quantities measured in soil under CT. Both fractions, HWEC and CWEC, showed similar patterns of spatial variability in soil, depending on the tillage system, but CWEC quantities were 44–62% smaller compared with HWEC. The HWEC values measured at the arable layer (0–20 cm) were on average 6–25% higher in the soil under RT than under CT (Figure 6A). Our results revealed that, relative to the way of soil cultivation with no plough operations, such as the RT system, the CT, involving intensive plough operations, resulted in a loss of about 26% HWEC content in the surface soil. Similar findings published by Hamkalo and Bedernichek [53] support our results. They also indicated that quantities of HWEC and CWEC were significantly lower in arable than in uncultivated soils. Higher average contents of HWEC compared with CWEC assessed in soils cultivated without plough operation suggest that HWEC fraction is a much more informative indicator of soil organic matter quality. Similarly, several studies reported an increase the concentration of labile organic carbon fractions in soils under reduced tillage compared with intensive tillage with plough operation [33,54].
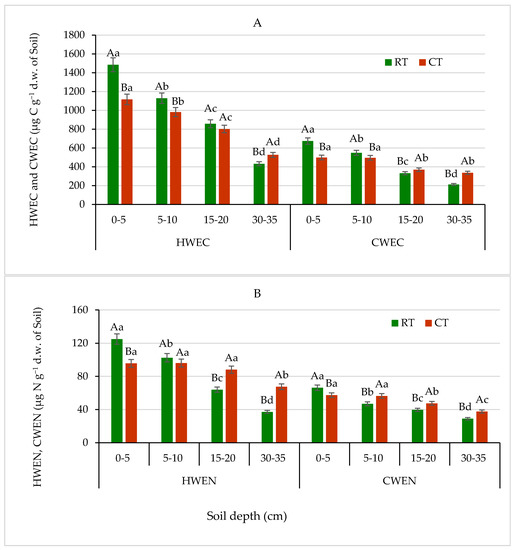
Figure 6.
(A)—Hot-water-extractable carbon (HWEC) and cold-water-extractable carbon (CWEC), (B)—hot-water-extractable nitrogen (HWEN) and cold-water-extractable nitrogen (CWEN) fractions in soil under different tillage systems in 2018–2020 (expressed as means for the 3 years, n = 12). Different letters represent significant differences (p ≤ 0.05) across treatments according to Tukey’s HSD test; lowercase letters within the same tillage system indicate significant differences between soil depths; uppercase letters indicate differences between tillage systems. RT—reduced tillage system; CT—conventional tillage system; d.w.—dry weight of soil; n—number of samples. Vertical bars represent standard errors.
The extractable and dissolved organic N in soil is used as an indicator of N mineralization, leaching and to evaluate agricultural management practices [52,55]. The effects of the RT and CT on content of HWEN and CWEN fractions differed from that on contents of HWEC and CWEC fractions. As shown in Figure 6B, the HWEN and CWEN fractions content measured in the RT system was significantly lower than that obtained under CT, except for surface soil 0–5 cm depth. At 0–5 cm layer, HWEN and CWEN values were 24% and 14% higher, respectively, for RT than CT. In deeper soil layers, at 15–20 and 30–35 cm, the HWEN and CWEN contents were on average 7–45% and 12–23% higher, respectively, for CT than RT. Our results are in accordance with results reported earlier by Martyniuk et al. [55].
3.5. Effects on Soil Basal Respiration
SBR reflects the overall activity of soil microorganisms and gives evidence of the soil carbon availability to microorganisms. SBR is a central process in the terrestrial carbon cycle and is recognized as a bio-indicator of soil quality [56,57,58]. In our study, the values of soil basal respiration varied from 1.79 to 2.47 µg CO2 g −1 d.w. soil h−1. Compared with CT, the RT system had 16% and 31% higher SBR in a depth of 0–5 and 5–10 cm, respectively (Figure 7).

Figure 7.
Soil basal respiration (SBR) under different tillage systems in 2018–2020 (expressed as means for the 3 years, n = 12). Different letters represent significant differences (p ≤ 0.05) across treatments according to Tukey’s HSD test; lowercase letters within the same tillage system indicate significant differences between soil depths; uppercase letters indicate differences between tillage systems. RT—reduced tillage system; CT—conventional tillage system; d.w.—dry weight of soil; n—number of samples. Vertical bars represent standard errors.
The opposite trend was observed in deeper soil layers (15–20 and 30–35 cm), where 21% and 13% increase in SBR under CT was found. Our earlier study [59] showed 21–25% higher basal respiration in the 0 to 15 cm soil layer under zero tillage than under conventional tillage in a wheat-based cropping system. According to Saikia et al. [58], higher SBR under residue retention and zero or reduced tillage may be ascribed to a higher amount of microbial biomass under these treatments. Conversely, the reduction in SBR at grater depths may be related to a corresponding decrease in organic matter and MBC [60]. Reported data on the impact of tillage system on soil respiration are rather inconclusive. For example, Jiang et al. [61] reported higher respiration rate in the soil depth of 0–20 cm under combination of ridge with no-tillage than under conventional tillage. On the contrary, in the study by Lamptey et al. [62], higher CO2 release was noted in soil under conventional tillage, while subsoiling and no-till decreased carbon emissions by 20% on average. Other authors [63] have not demonstrated significant differences in SBR between the CT and NT (no-till) systems.
3.6. Effects on Microbial Biomass Carbon and Nitrogen
The soil microbial biomass is small, but it is the only living fraction of organic matter, serving as an important reservoir of C, N, P, and S nutrients. Therefore, microbial biomass plays a fundamental role in nutrient cycling in agricultural soils to sustain their fertility [25]. As was expected, soil under RT showed 13% and 15% higher C, and 14% and 11% higher N contents in microbial biomass, especially at 0–5 and 5–10 cm layers, respectively, compared with CT (Figure 8). In lower layers, 15–20 and 30–35 cm, the MBC contents were found to be 40% and 52% higher, respectively in CT in comparison with RT. Similarly, at the same depths the MBN contents were 20% and 79% higher, respectively in CT in relation to RT. Similar pattern of MBC and MBN spatial distribution in RT and CT was observed, except that the MBN contents were about 10–13 times lower, on average, than the contents of MBC (Figure 8). Our results demonstrate that the RT system can enhance the accumulation of labile soil organic matter fractions in the surface depths, especially in 0–5 cm, as compared with the CT. The previous study [15,25,33] confirmed our findings and stay in agreement with the results discussed. Farther, our results demonstrated that MBC and MBN pools were more sensitive for detecting effects of long-lasting different tillage systems use on soil environment and responded more quickly than, e.g., the total soil organic carbon. Similar findings published by Hazarika et al. [64] showed that microbial biomass contents in soil under no-till and/or reduced tillage systems were markedly higher compared with conventionally tilled soil, which also supports our results.
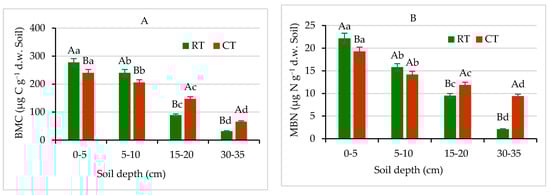
Figure 8.
(A) Microbial biomass carbon (MBC) and (B) microbial biomass nitrogen (MBN) contents in soil under different tillage systems in 2018–2020 (expressed as means for the 3 years, n = 12). Different letters represent significant differences (p ≤ 0.05) across treatments according to Tukey’s HSD test; lowercase letters within the same tillage system indicate significant differences between soil depths; uppercase letters indicate differences between tillage systems. RT—reduced tillage system; CT—conventional tillage system; d.w.—dry weight of soil; n—number of samples. Vertical bars represent standard errors.
3.7. Effects on Soil Enzyme Activities
A high influence of the application of different long-term tillage systems on microbial activity was observed. Soil microbial activity, measured based on dehydrogenases and phosphatases, differed significantly (p ≤ 0.05) between tillage systems and soil depths (Figure 9 and Figure 10). The DEH activity is a measure of metabolic state of soil microbial populations. Activity of these enzymes is one of the most adequate and sensitive bioindicators, relating to soil fertility [65,66]. In our study, the DEH activity showed considerable variability (Figure 9).
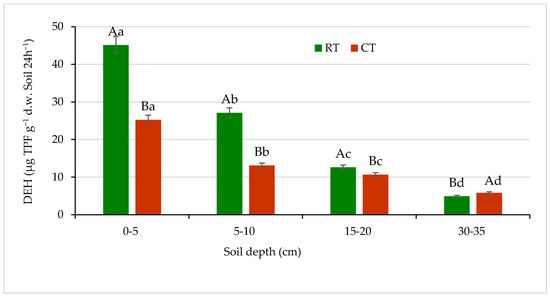
Figure 9.
Dehydrogenases (DEH) activity in soil under different tillage systems in 2018–2020 (expressed as means for the 3 years, n = 12). Different letters represent significant differences (p ≤ 0.05) across treatments according to Tukey’s HSD test; lowercase letters within the same tillage system indicate significant differences between soil depths; uppercase letters indicate differences between tillage systems. RT—reduced tillage system; CT—conventional tillage system; d.w.—dry weight of soil; n—number of samples. Vertical bars represent standard errors.
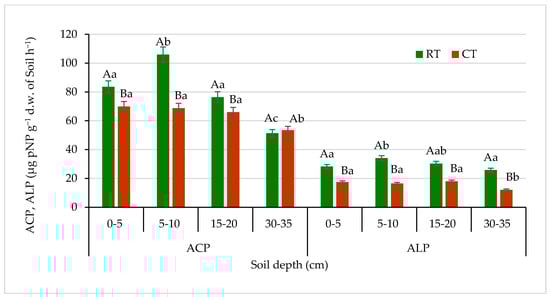
Figure 10.
Acid phosphatase (ACP) and alkaline phosphatase (ALP) activities in soil under different tillage systems in 2018–2020 (expressed as means for the 3 years, n = 12). Different letters represent significant differences (p ≤ 0.05) across treatments according to Tukey’s HSD test; lowercase letters within the same tillage system indicate significant differences between soil depths; uppercase letters indicate differences between tillage systems. RT—reduced tillage system; CT—conventional tillage system; d.w.—dry weight of soil; n—number of samples. Vertical bars represent standard errors.
The highest activity of DEH for both tillage systems, RT and CT, was found in the surface soil layer (0–5 cm): 45.1 and 25.2 µg TPF g−1 d.w. of soil 24 h−1, respectively. The enzymes activity decreased with increasing soil depth. In the lower 5–10 and 15–20 cm layers, the DEH activity decreased by about 50% and 70% of that measured in the surface soil at 0–5 cm depth, respectively. In the sub-arable layer (30–35 cm), activity of this enzyme dropped greatly (about 9 and 4 times lower under RT and CT, respectively) and was found at a level of 4.9 µg TPF g−1 d.w. of soil 24 h−1 under RT and 5.8 µg TPF g−1 d.w. of soil 24h−1 under CT. The differences between studied tillage systems in the DEH activities were seen the most in the surface 0–5 and subsurface 5–10 cm soil layers by 44% and 52%, respectively. The decrease in DEH activity along with the depth increase in soil profile is most likely related to the spatial distribution of organic matter and soil microorganisms activity connected with tillage system and decreasing amount of carbon substrates available for both microorganisms and enzymes [65]. Similar relationship between soil properties and enzyme activities was reported by Błońska et al. [67], who recorded the lowest activities of dehydrogenases and urease in the arable soils, which contained significantly less organic matter due to tillage. Moreover, Gajda et al. [6] measured higher dehydrogenases activities in the soil under reduced treatment compared with conventional. Nyawade et al. [68] noticed that dehydrogenases activities were directly proportional to the microbial biomass. The observation was related to the residue quantity contribution, and the increase in plant residue decomposition reflected the increase in dehydrogenases activity.
Trends slightly different than those of the DEH activities in soil were observed in case of phosphatases (acid—ACP and alkaline—ALP) (Figure 10). In the RT system, the ACP activities were significantly higher in all studied soil layers up to 30 cm depth, in comparison with CT, by about 22% on average. The highest difference in ACP activities between tillage systems was noticed in soil at 5–10 cm depth, by about 35% in favour of the RT system. In the sub-arable soil layer, 30–35 cm, ACP activities were the lowest and not significantly different between the studied tillage systems. ACP activities in the RT and CT system ranged from 51.3 to 106.0 μg pNP g−1 d.w. of soil h−1 and 53.5 to 69.9 μg pNP g−1 d.w. of soil h−1, respectively.
The level of ALP activity was about four times lower than the activity level of ACP. In the soil under RT, in all studied soil depths, the enzyme activities were significantly lower—by about 50% as compared with CT. There was no significant decrease in ACP nor ALP activities observed along with the depth increase, especially under CT in the arable soil layer of 0–20 cm. The ALP activities ranged from 27.2 to 34.0 μg pNP g−1 d.w. of soil h−1 in RT and from 12.1 to 18.0 μg pNP g−1 d.w. of soil h−1 under CT. Such an activity can be related mostly to the way of soil tillage and pH. The higher activity of ACP was due to the fact that phosphomonoesterases are the most sensitive enzymes to changes in soil pH. The optimum pH for ALP is 9.0–11.0, and for ACP it is 4.0–6.5 [69]. Our results for ALP were in agreement with other authors, who reported that conventional tillage and fertilizers application significantly depressed the activity of ALP [26]. Muhammadi et al. [70] reported significant increase in phosphatase activities in minimum and no-tillage treatments as compared with conventional tillage. That can be explained by the suppressive effects of chemical fertilizers used in conventional tillage on the acid and alkaline phosphatase activities, considering the fact that phosphate synthesis is inhibited by available phosphorus [71].
3.8. Effects on Potential Nitrification
Nitrogen is the main limiting factor in crop productivity, and soil management systems may change the mineralization and nitrification rates [72]. The soil nitrification potential (NP) reflects the activity of a specialized group of autotrophic bacteria—ammonia-oxidizing bacteria (AOB)—dominated by the two genera, Nitrosomonas and Nitrosospira [73,74]. Ammonia oxidation is the first and rate-limiting step of nitrification, a primary process controlling soil nitrate concentrations [73]. The soil NP is a highly sensitive parameter, which reflects the response of soil microorganisms to soil characteristics (pH, soil texture, and aeration), environmental factors (temperature, moisture), and agricultural practices, e.g., soil tillage [75,76].
The presented results clearly indicate that soil tillage system significantly affected the activity of nitrifying bacteria (Figure 11). Similar results were reported by Li et al. [73], who found that the nitrification rate was significantly higher in conventional tillage (3.40 µg N g−1 day−1) than RNT (ridge with no-tillage) (2.96 µg N g−1 day−1). Authors [73] explained that RNT may increase soil N retention by keeping N longer in the NH4+ state, thus decreasing the potential for N loss by leaching. Contrary to our results, Cardoso et al. [72] and Krauss et al. [77] reported a lower nitrification rate in a conventional tillage system, explaining it partly by a more accelerated decomposition due to the more intensive attack of microorganisms on the incorporated organic material and the shorter period of N mineralization. Furthermore, Krauss et al. [77] found lower abundance of ammonium-oxidizing bacteria (responsible for the nitrification process) under a conventional tillage system.
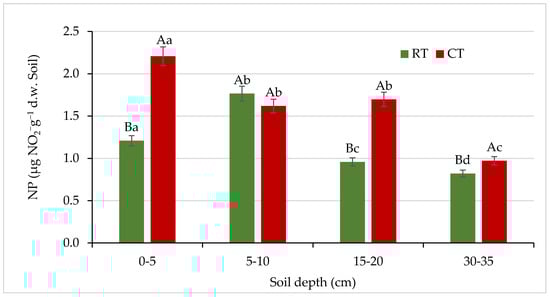
Figure 11.
Nitrification potential (NP) in soil under different tillage systems in 2018–2020 (expressed as means for the 3 years, n = 12). Different letters represent significant differences (p ≤ 0.05) across treatments according to Tukey’s HSD test; lowercase letters within the same tillage system indicate significant differences between soil depths; uppercase letters indicate differences between tillage systems. RT—reduced tillage system; CT—conventional tillage system; d.w.—dry weight of soil; n—number of samples. Vertical bars represent standard errors.
In our study, nitrifying bacteria activity decreased with increasing soil depth (Figure 11), and the lowest NP values were observed in both systems at the 30–35 cm soil layer, where a decrease in the activity of nitrifying bacteria by 32% (RT) and 56% (CT) was observed, compared with the surface (0–5 cm) layer. Nitrification is an aerobic process, thus such changes in activity can be related to changes in soil aeration status and oxygen availability, resulting in a predominant denitrification processes in deeper soil layers [75,76]. Similarly to our study, Cardoso et al. [72] found higher nitrification rate in the 2.5–5 cm layer in conventional and minimum tillage systems, and no differences in the 5–10 cm layer irrespective of the type of tillage. It demonstrates that the transformation processes are closely related to the upper centimetres of the soil, which are more influenced by the crop residues [72]. On the other hand, as a consequence of intensive nitrification in soils, potential greenhouse gases (NOx, N2O) can be produced [74,75,77]. To decrease N losses and to reduce bacterial nitrification, it is recommended to use nitrification inhibitors that avoid the conversion of ammonium into nitrates and their subsequent leaching [76].
3.9. Single Soil Quality Indices
3.9.1. Effects on Metabolic Quotient and Microbial Quotient
The metabolic quotient (qCO2), defined as microbial respiration per unit of microbial biomass [44], is used as a measure of the ecophysiological status of soil microorganisms; it reflects the efficiency of utilization of C resources by the soil microbial biomass and the degree of substrate limitation for soil microbes [29,57,58]. The metabolic processes driving heterotrophic respiration depend on both environmental (e.g., substrate availability, soil texture, or water content) and biological (e.g., microbial community structure, microbial biomass, and basal respiration) factors [78].
We observed a significant effect (p ≤ 0.05) of the studied tillage systems on qCO2 (Figure 12A). The qCO2 varied from 10.12 to 54.26 and from 9.33 to 31.41 mg CO2-C g−1 MBC h−1 in the RT and CT system, respectively. Generally, the qCO2 increased with soil depth, and the lowest values were observed in both systems at the 0–5 and 5–10 cm soil layers, while in the 15–20 and 30–35 cm depths, it was was 2–3-fold or 3–5-fold higher, respectively. A more pronounced increase was observed in the RT system. Opposite results were reported by Jiang et al. [61], who observed significant increase in qCO2 in the 0–20 cm soil layer under a conventional tillage system. Similarly, in the study of Aziz et al. [63], the qCO2 was up to 50% higher in a conventional tillage than in a no-tillage system. These authors have shown that irrespective of tillage treatments, the qCO2 increased with increase in soil depth, and this was also observed in our study. The qCO2 is based on the concept of Odum’s ecosystem succession theory, which is increasingly being applied as an indicator of ecosystem development (where it declines), and of disturbance (where it theoretically increases) [29]. A lower qCO2 reflected improved physiological conditions resulting from amended organic matter, while a higher qCO2 indicated soil degradation under intensive land use [79]. On the other hand, an increase in qCO2 might not only be attributed to microbial stress but could be interpreted as a positive priming on decomposition of the labile soil organic carbon pool, following addition of readily degradable carbon substrates to soil [56,57]. In our study, high qCO2 was associated with low values of MBC in a soil layer below 15 cm and was likely to reflect stress and poor conditions related to physical soil disturbance.
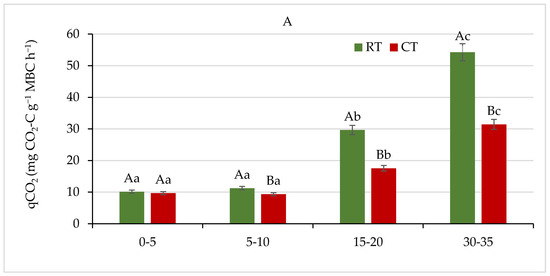
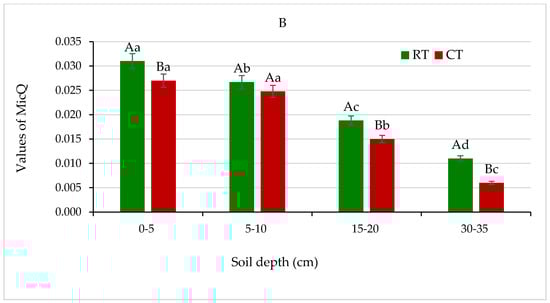
Figure 12.
(A) Metabolic quotient (qCO2), and (B) microbial quotient (MicQ) for soil under different tillage systems in 2018–2020 (expressed as means for the 3 years, n = 12). Different letters represent significant differences (p ≤ 0.05) across treatments according to Tukey’s HSD test; lowercase letters within the same tillage system indicate significant differences between soil depths; uppercase letters indicate differences between tillage systems. RT—reduced tillage system; CT—conventional tillage system; d.w.—dry weight of soil; n—number of samples. Vertical bars represent standard errors.
The microbial quotient (MicQ), defined as a proportion of total soil organic carbon (SOC) present in microbial biomass (MB), has been proposed as an indicator of the ongoing changes of organic matter in soil and its availability to soil microorganism [23,45]. In the presented field trial, the MicQ values in all studied depths were higher in soil under RT and ranged from 0.011 to 0.031, compared with soil under CT (0.006–0.027) (Figure 12B).
The percentage of MB in total SOC content ranged from 1% to 3% in soil under both tillage systems and was markedly higher in favour of the RT system (data not shown). The higher MicQ values indicate a larger pool of soil MB in RT and show that the RT system creates a more beneficial environment for proliferation and activity of microbial communities in soil (Figure 12B). Similar results were obtained and discussed earlier by Gajda [16] and Melero et al. [23].
3.9.2. Effects on Enzymatic pH Level Indicator
The enzymatic pH level indicator (EpHI), a ratio of ALP and ACP activities, was first proposed by Dick et al. [31] as a helpful tool to assess soil acidity. In our study, the values of the ALP:ACP ratio in the profile of soil under RT ranged from 0.39 to 0.52 and was significantly higher in comparison with the ratio under CT, where it ranged from 0.16 to 0.24 (Figure 13). Dick et al. [31] published changes of the ALP:ACP ratio obtained for five soils differing in pH and organic matter content. They noticed that the ratio lower than 0.5 indicated that the soil was acidic. Their results were confirmed with potentiometric measurements of soil pH. They suggested that the enzymatic pH level indicator could be recommended as a more effective tool to determine changes in soil. In our study, this enzymatic indicator (EpHI) seemed to confirm the influence of the cultivation system on soil pH, which was 6.4 under RT and 5.9 under CT (Table 2). Changes in the ALP:ACP ratio responding to changes in soil were also published by Oprica et al. [27] and Piotrowska–Długosz et al. [28].
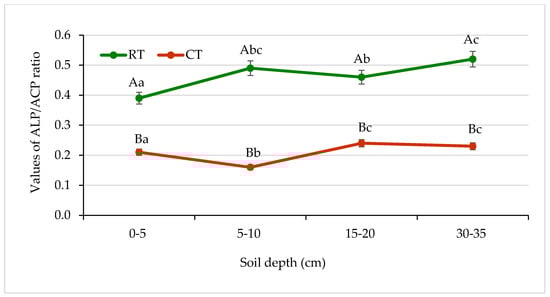
Figure 13.
Changes in alkaline phosphatase (ALP) and acid phosphatase (ALP) activities ratio in soil under different tillage systems in 2018–2020 (expressed as means for the 3 years, n = 12). Different letters represent significant differences (p ≤ 0.05) across treatments according to Tukey’s HSD test; lowercase letters within the same tillage system indicate significant differences between soil depths; uppercase letters indicate differences between tillage systems. RT—reduced tillage system; CT—conventional tillage system; d.w.—dry weight of soil; n—number of samples. Vertical bars represent standard errors.
Table 2.
Effects of different tillage systems on stratification ratios of summarized labile carbon fractions content (POM-C, HWEC, CWEC, MBC) and soil organic carbon in 2018–2020.
3.9.3. Effects on Stratification Ratio for Soil Organic Carbon and Summarized Labile Carbon Fractions
According to the definition, stratification ratio (SR) is the value of a soil property in the surface soil divided by the value at a lower depth [46,80]. The SR of carbon was calculated and introduced by Franzluebbers [46]. The SR was proposed as an indicator to evaluate the effects of management practices on changes in soil carbon resources, especially carbon sequestration. It is a meaningful and effective indicator for assessment of soil quality because it normalizes inherent differences in soils, including the subsoil properties [80,81]. In our study, SR was calculated to confirm the differentiation effects of two different tillage systems on soil properties changes in analysed layers related to organic carbon content (Table 2). SR values of labile carbon concentration in soil ranged from 1.09 to 5.12 and were 1.2–2.3 times higher in soil under RT (SR1, SR2, SR3) as compared with CT (SR4, SR5, SR6). An increase in SR values along with soil depth was observed in both treatments. This trend was related to the observed decrease in summarized labile carbon concentrations from surface layer (0–5 cm) to the sub-arable soil layer (30–35 cm). Similar results were discussed by Bongiorno et al. [33]. The SR values of SOC concentration in soil ranged from 1.00 to 2.00 and were 1.1–1.6 times higher in soil under RT (SR2, SR3) as compared with CT (SR5, SR6). An increase in the SR values of SOC along with soil depth was observed in the RT system (SR1, SR2, SR3). In the CT system, there was no significant difference between the SR4 and SR5 values. The SR6 appeared to be a valuable indicator of SOC changes in soil caused by tillage. Similar results were published by Yu et al. [81]. Furthermore, results published by Zhang et al. [82] for mono-cropping system support our findings. Franzluebbers [46], introducing SR indices, noticed that 2 was a limit value, and all values > 2 indicated improvement in soil quality. In our study, SR2 and SR3 of labile carbon in soil under RT and SR6 in soil under CT reached values > 2, while SR1, SR4, and SR5 showed values < 2 in both tillage systems. Only SR3 of SOC in a soil under RT reached a value equal to 2. Under CT, all SR values of SOC were <2. The SR values we obtained indicate that the RT system contributes to the improvement of soil quality as compared with CT (Table 2).
3.9.4. Effects on Metabolic Potential Index
The dehydrogenase activity measurement, especially in relation to the energetic and easily available C substrate, suggests a metabolic potential of soil in soil recultivation. The metabolic potential (MP) index was calculated as the ratio between the activity of the viable soil microbial community, measured as DEH activity, and the sources of energy for microorganisms, expressed as a water-soluble carbon concentration, according to Masciandaro et al. [30]. In our study, the MP values were 1.3–1.9 times higher for the soil under RT with respect to the soil under CT (Figure 14).
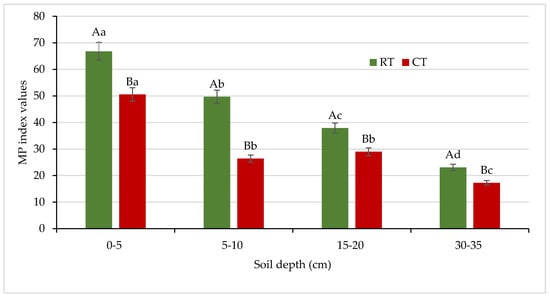
Figure 14.
Values of metabolic potential index in soil under different tillage systems in 2018–2020 (means for the 3 years are presented in each column, n = 12). Different letters represent significant differences (p ≤ 0.05) across treatments according to Tukey’s HSD test; lowercase letters within the same tillage system indicate significant differences between soil depths; uppercase letters indicate differences between tillage systems. MP—metabolic potential index; DEH—dehydrogenase activity; WEC—water-extractable carbon; RT—reduced tillage system; CT—conventional tillage system; n—number of samples. Vertical bars represent standard errors.
Caravaca et al. [83] reported that it could be explained by usually lower microbial activity in intensively cultivated soils, mainly due to the decline in the content of easily decomposable organic compounds through tillage and soil disturbance. For the first time, we examined the MP index for comparison of the effects of different management practices on soil in relation to no-tilled soil, and MP was identified as a useful indicator to compare the differences in soils between crop production systems and no-tilled soil [15]. In this study, we included MP again for better monitoring the ongoing changes in soil environment and to compare the effects of different tillage systems intensity. The obtained results were satisfactory for our purpose, and the MP index can be recommended for assessing soil quality under different agricultural use.
The data in Table 3 showed a high sensitivity of the studied parameters to changes in soil caused by different intensity tillage systems, and confirmed the strong interrelationships within heterogeneous physical, chemical, and microbiological soil properties. Positive correlations between SOM and the studied soil parameters as well as positive correlations in-between analysed parameters of chemical and microbiological soil properties (p ≤ 0.001; p ≤ 0.05) were obtained for soil under both RT and CT. High negative correlations were obtained only between SOM and RDC, and between RDC and other studied soil parameters, confirming the beneficial effect of SOM on soil environment. Similar correlations were obtained in an earlier study [6,10,47].
Table 3.
Pearson’s correlation coefficients between physical, chemical, and microbiological properties of the analysed soil.
The results of the correlation analysis showed also a significant correlation between enzymatic activity and physicochemical properties of soil (Table 3). Significant correlations were obtained between enzymatic activity DEH and soil pH; however, their strength appeared to be higher for RT compared with CT. The relationship between microbial activity—measured as DEH, ACP, and ALP activities—and soil pH level may vary with the intensity of the tillage system, as indicated by different stratification patterns of SOM resulting from a different depth and different intensity of machinery operation. The higher soil pH under RT was reflected in a higher activity of microbial communities than under CT. This could be attributed also to the different level of soil chemical properties and nutrients, resulting from a different tillage system use. That may indicate that the RT system is better to maintain and improve soil environment condition than CT. Similar findings, supporting our results, were published by Monsalud et al. [84].
4. Conclusions
The study demonstrated that tillage intensity is a critical factor in improvement of soil condition. The soil under lower intensity tillage, such as in the RT system, showed higher concentration of organic matter and, therefore, decreased significantly the content of readily dispersible clay, increasing soil stability in water. Moreover, the greater content of organic matter, especially in the topsoil, resulted in greater contents of labile organic carbon and nitrogen fractions and enzyme activities compared with the same soil under the high intensity tillage, such as in the CT system. These findings were supported by values of some selected, already-introduced indices. These appeared to be helpful in assessing changes in the environment in a Eutric Fluvisol soil, such as effects of different tillage intensity in the climatic conditions of eastern Poland. As compared with RT, greater nitrification potential found in CT may be explained by an increase in soil N retention by keeping N longer in the NH4+ state, thereby decreasing the potential for N loss by leaching. The obtained correlations showed high sensitivity of the studied parameters to changes in soil caused by different tillage intensity, and demonstrated the strong interrelationships within heterogeneous physical, chemical, and microbiological soil properties.
The results discussed contribute to a better understanding of the mutual relationships in the soil–plant–tillage system and the influence of tillage intensity on the quality and quantity of soil organic matter and, therefore, on the activity and ecological stability of soil microbial communities.
Due to the ongoing climate changes and the observed gradual decrease in the content of organic matter in soils, in Poland and in Europe more generally, it seems that lower-intensity tillage systems (e.g., ploughless) are currently the best way to counteract soil degradation and preserve resources of organic matter and, therefore, should be recommended for widespread agricultural practice. Control of the health and fertility of soils, especially under agricultural use, is important and needed, and should be constantly carried out.
Author Contributions
Conceptualization, A.M.G., E.A.C. and A.K.-P.; formal analysis, A.M.G., E.A.C. and A.K.-P.; investigation and methodology, A.M.G., E.A.C. and A.K.-P.; resources, A.M.G., E.A.C. and A.K.-P.; writing—original draft, A.M.G., E.A.C. and A.K.-P. All authors have read and agreed to the published version of the manuscript.
Funding
This research was supported by the Ministry of Science and Higher Education of Poland and the Ministry of Agriculture and Rural Development of Poland in the frames of Task 1.3 Multi-Annual Program IUNG-PIB (2018–2020). It was conducted within the statutory activities of IUNG-PIB (2.38) and as a part of the statutory activities of the Department of Soil Science, Environmental Chemistry and Hydrology (2019–2024), “The influence of agriculture on changes in physical, chemical and biological properties of selected soils and waters”, University of Rzeszow in Rzeszow.
Institutional Review Board Statement
Not applicable.
Informed Consent Statement
Not applicable.
Data Availability Statement
Data presented in this study are available on request from the corresponding author. The data are not publically available due to the ongoing research project till 2024.
Acknowledgments
Research was founded by the Ministry of Agriculture and Rural Development, and the Ministry of Science and Higher Education of Poland.
Conflicts of Interest
The authors declare no conflict of interest.
References
- Doran, J.W.; Sarrantonio, M.; Liebig, M. Soil health and sustainability. Adv. Agron. 1996, 56, 1–54. [Google Scholar] [CrossRef]
- Lal, R. Challenges and opportunities in soil organic matter research. Eur. J. Soil Sci. 2009, 60, 158–169. [Google Scholar] [CrossRef]
- Liebig, M.A.; Tanaka, D.L.; Wienhold, B.J. Tillage and cropping effects on soil quality indicators in the northern Great Plains. Soil Tillage Res. 2004, 78, 131–141. [Google Scholar] [CrossRef] [Green Version]
- Gajda, A.M.; Czyż, E.A.; Stanek-Tarkowska, J.; Dexter, A.R.; Furtak, K.M.; Grządziel, J. Effect of long-term tillage practices on the quality of soil under winter wheat. Plant Soil Environ. 2017, 63, 236–242. [Google Scholar] [CrossRef] [Green Version]
- Dexter, A.R. Soil physical quality. Part III: Unsaturated hydraulic conductivity and general conclusions about S-theory. Geoderma 2004, 120, 227–239. [Google Scholar] [CrossRef]
- Gajda, A.M.; Czyż, E.A.; Dexter, A.R.; Furtak, K.M.; Grządziel, J.; Stanek-Tarkowska, J. Effects of different soil management practices on soil properties and microbial diversity. Int. Agrophys. 2018, 32, 81–91. [Google Scholar] [CrossRef] [Green Version]
- Dexter, A.R.; Czyż, E.A.; Niedźwiecki, J. Water run-off as affected by the distributions of values of hydraulic conductivity of the soil. Ann. Rev. Agric. Eng. 2004, 3, 87–96. [Google Scholar]
- Gaţe, O.P.; Czyż, E.A.; Dexter, A.R. Soil physical quality, S, as a basis for relationships between key physical properties of arable soils. In Soil Management for Sustainability; Horn, R., Fleige, H., Peth, S., Peng, X., Eds.; Advances in GeoEcology; Catena Verlag: Reiskirchen, Germany, 2006; Volume 38, pp. 102–109. ISBN 978-3-510-65376-8. [Google Scholar]
- Czyż, E.A.; Dexter, A.R.; Terelak, H. Content of readily-dispersible clay in the arable layer of some Polish soils. In Sustainable Land Management-Environmental Protection. A Soil Physical Approach; Pagliai, M., Jones, R., Eds.; Advances in GeoEcology; Schweizerbart and Borntraeger Science Publishers: Stuttgart, Germany, 2002; Volume 35, pp. 115–124. [Google Scholar]
- Czyż, E.A.; Dexter, A.R. Soil physical properties under winter wheat grown with different tillage systems at selected locations. Int. Agrophys. 2008, 22, 191–201. [Google Scholar]
- Soane, B.D.; Ball, B.C.; Arvidsson, J.; Basch, G.; Moreno, F.; Roger-Estrade, J. No-till in northern, western and south-western Europe: A review of problems and opportunities for crop production and the environment. Soil Tillage Res. 2012, 118, 66–87. [Google Scholar] [CrossRef] [Green Version]
- Brennan, J.; Hackett, R.; McCabe, T.; Grant, J.; Fourtune, R.A.; Forristal, A.C. The effect of tillage system and residues management on grain yield and nitrogen use efficiency in winter wheat in cool Atlantic climate. Eur. J. Agron. 2014, 54, 61–69. [Google Scholar] [CrossRef]
- Cambardella, C.A.; Elliott, E.T. Particulate soil organic-matter changes across a grassland cultivation sequence. Soil Sci. Soc. Am. J. 1992, 56, 777–783. [Google Scholar] [CrossRef]
- Cambardella, C.A.; Gajda, A.M.; Doran, J.W.; Wienhold, B.J.; Kettler, T.A. Estimation of particulate and total organic matter by weight loss-on-ignition. In Assessment Methods for Soil Carbon; Lal, R., Kimble, J.M., Follett, R.F., Stewart, B.A., Eds.; CRC Press: Boca Raton, FL, USA, 2001; pp. 349–359. [Google Scholar]
- Gajda, A.M.; Czyż, E.A.; Ukalska-Jaruga, M. Comparison of the effects of different crop production systems on soil physico-chemical properties and microbial activity under winter wheat. Agronomy 2020, 10, 1130. [Google Scholar] [CrossRef]
- Gajda, A.M. Microbial activity and particulate organic matter content in soils with different tillage system use. Int. Agrophys. 2010, 24, 129–138. [Google Scholar]
- Stockdale, E.A.; Brookes, P.C. Detection and quantification of the soil microbial biomass impacts on the management of agricultural soils. J. Agric. Sci. 2006, 144, 285–302. [Google Scholar] [CrossRef]
- Andrade, D.S.; Colozzi-Filho, A.; Giller, K.E. The soil microbial community and soil tillage. In Soil Tillage in Agroecosystems; El Titi, A., Ed.; CRC Press: Boca Raton, FL, USA, 2003; pp. 51–81. Available online: https://www.taylorfrancis.com/books/9780429125850/chapters/10.1201/9781420040609-5 (accessed on 26 December 2002).
- Bandick, A.K.; Dick, P.P. Field management effects on soil enzyme activities. Soil Biol. Biochem. 1999, 31, 1471–1479. [Google Scholar] [CrossRef]
- Moreno, F.; Murillo, J.M.; Pelegrın, F.; Giron, I.F. Long-term impact of conservation tillage on stratification ratio of soil organic carbon and loss of total and active CaCO3. Soil Tillage Res. 2006, 85, 86–93. [Google Scholar] [CrossRef]
- Trivedi, P.; Delgado-Baquerizo, M.; Jeffries, T.C.; Trivedi, C.; Anderson, I.C.; Lai, K.; Minkey, D. Soil aggregation and associated microbial communities modify the impact of agricultural management on carbon content. Environ. Microbiol. 2017, 19, 3070–3086. [Google Scholar] [CrossRef]
- Tian, Q.; Taniguchi, T.; Shi, W.-Y.; Li, G.; Yamanaka, N.; Du, S. Land-use types and soil chemical properties influence soil microbial communities in the semiarid Loess Plateau region in China. Sci. Rep. 2017, 7, 45289. [Google Scholar] [CrossRef] [PubMed] [Green Version]
- Melero, S.; López-Garrido, R.; Murillo, J.M.; Moreno, F. Conservation tillage: Short-and long-term effects on soil carbon fractions and enzymatic activities under Mediterranean conditions. Soil Tillage Res. 2009, 104, 292–298. [Google Scholar] [CrossRef] [Green Version]
- Doni, S.; Macci, C.; Peruzzi, E.; Ceccanti, B.; Masciandaro, G. Factors Controlling Carbon Metabolism and Humification in Different Soil Agroecosystems. Sci. World J. 2014, 416074. [Google Scholar] [CrossRef] [PubMed] [Green Version]
- Balota, E.L.; Colozzi-Filho, A.; Andrade, D.S.; Dick, R.P. Microbial biomass in soils under different tillage and crop rotation systems. Biol. Fertil. Soils 2003, 38, 15–20. [Google Scholar] [CrossRef]
- Nannipieri, P.; Giagnoni, L.; Landi, L.; Renella, G. Role of Phosphatase Enzymes in Soil. In Phosphorus in Action, Soil Biology; Bunemann, E.K., Bünemann, E., Oberson, A., Frossard, E., Eds.; Springer: Berlin/Heidelberg, Germany, 2011; pp. 215–243. [Google Scholar] [CrossRef]
- Oprica, L.; Olteanu, Z.; Dunca, S.I.; Marius, S.; Zamfirache, M.M. The tillage effect on the soil acid and alkaline phosphatase activity. In Sectiunea Geneticasi Biologie Moleculara; Analele Stiintifice ale Universitatii Alexandru Ioan Cuza; Alexandru Ioan Cuza” University of Iași: Iaşi, Romania, 2011; Volume 12, pp. 103–110. Available online: https://www.researchgate.net/publication/237073526 (accessed on 9 June 2021).
- Piotrowska-Długosz, A.; Lemanowicz, J.; Długosz, J. The spatial pattern and seasonal changes in the soil phosphorus content in relation to the phosphatase activity: A case study of Luvisols. Arch. Agron. Soil Sci. 2020, 66, 1583–1597. [Google Scholar] [CrossRef]
- Bastida, F.; Zsolnay, A.; Hernández, T.; García, C. Past, present and future of soil quality indices: A biological perspective. Geoderma 2008, 147, 159–171. [Google Scholar] [CrossRef]
- Masciandaro, G.; Ceccanti, B.; Gallardo-Lancho, J.F. Organic matter properties in cultivated versus set-aside arable soils. Agric. Ecosyst. Environ. 1998, 67, 267–274. [Google Scholar] [CrossRef]
- Dick, W.A.; Cheng, L.; Wang, P. Soil acid and alkaline phosphatase activity as pH adjustment indicators. Soil Biol. Biochem. 2000, 32, 1915–1919. [Google Scholar] [CrossRef]
- Winding, A.; Hund-Rinke, K.; Rutgers, M. The use of microorganisms in ecological soil classification and assessment concepts. Ecotox. Environ. Saf. 2005, 62, 230–248. [Google Scholar] [CrossRef]
- Bongiorno, G.; Bünemann, E.K.; Oguejiofor, C.U.; Meier, J.; Gort, G.; Comans, R.; Mäder, P.; Brussaard, L.; de Goede, R. Sensitivity of labile carbon fractions to tillage and organic matter management and their potential as comprehensive soil quality indicators across pedoclimatic conditions in Europe. Ecol. Indic. 2019, 99, 38–50. [Google Scholar] [CrossRef]
- Polish Society of Soil Science, PTG. Particle size distribution and textural classes of soils and mineral materials—Classification of Polish Society of Soil Science (PTG in Polish). Soil Sci. Ann. 2009, 60, 5–16. [Google Scholar]
- IUSS Working Group WRB. World Reference Base for Soil Resources 2006, First Update 2007; World Soil Resources Reports No.103; FAO: Rome, Italy, 2007. [Google Scholar]
- Dexter, A.R.; Bird, N.R.A. Methods for predicting the optimum and the range of soil water contents for tillage based on the water retention curve. Soil Tillage Res. 2001, 57, 203–212. [Google Scholar] [CrossRef]
- Hack, H.; Bleiholder, H.; Buhr, L.; Meier, U.; Schnock-Fricke, U.; Weber, E.; Witzenberger, A. Einheitliche Codierung der phanologischen Entwicklungsstadien mono- und dikotyler Pflanzen—Erweiterte BBCH-Skala, Allgemein. Nachrichtenbl. Deut. Pflanzenschutzd. 1992, 44, 265–270. [Google Scholar]
- Howard, P.J.A. The carbon-organic matter factor in various soil types. Oikos 1965, 15, 229–236. [Google Scholar] [CrossRef]
- Ghani, A.; Dexter, M.; Perrott, K.W. Hot-water extractable carbon in soils: A sensitive measurement for determining impacts of fertilisation, grazing and cultivation. Soil Biol. Biochem. 2003, 35, 1231–1243. [Google Scholar] [CrossRef]
- ISO 16072. Soil Quality—Laboratory Methods for Determination of Microbial Soil Respiration; International Organization for Standardization: Geneva, Switzerland, 2002.
- PN-EN ISO 14240-2. Soil Quality—Laboratory Method for Determination of Microbial Biomass in Soil. Part 2: Fumigation—Extraction Method; Polish Committee for Standardization: Warsaw, Poland, 2011.
- Tabatabai, M.A.; Bremner, J.M. Use of p-nitrophenol phosphate for assay of soil phosphatases. Soil Biol. Biochem. 1969, 1, 301–307. [Google Scholar] [CrossRef]
- ISO 15685. Soil Quality—Determination of Potential Nitrification and Inhibition of Nitrification—Rapid Test. by Ammonium Oxidation; International Organization for Standardization: Geneva, Switzerland, 2012.
- Anderson, T.H.; Domsch, K.H. Application of eco-physiological quotients (qCO2 and qD) on microbial biomasses from soils of different cropping histories. Soil Biol. Biochem. 1990, 2, 251–255. [Google Scholar] [CrossRef]
- Anderson, T.H.; Domsch, K.H. Ratios of microbial biomass carbon to total organic-C in arable soils. Soil Biol. Biochem. 1989, 21, 471–479. [Google Scholar] [CrossRef]
- Franzluebbers, A.J. Soil organic matter stratification ratio as an indicator of soil quality. Soil Tillage Res. 2002, 66, 95–106. [Google Scholar] [CrossRef]
- Stanek-Tarkowska, J.; Czyż, E.A.; Dexter, A.; Sławiński, C. Effect of reduced and traditional tillage on soil properties and diversity of diatoms under winter wheat. Int. Agrophys. 2018, 32, 403–409. [Google Scholar] [CrossRef]
- Małecka, I.; Blecharczyk, A.; Sawińska, Z.; Swędrzyńska, D.; Piechota, T. Winter wheat yield and soil properties response to long-term non-inversion tillage. J. Agric. Sci. Technol. 2015, 17, 1571–1584. Available online: https://www.researchgate.net/publication/282847504 (accessed on 9 June 2021).
- Sarkar, I.; Khan, M.Z.; Hanif, M. Soil organic fractions in cultivated and uncultivated soils of Costal area in Bangladesh. J. Agric. Chem. Environ. 2019, 8, 129–144. [Google Scholar] [CrossRef] [Green Version]
- Guimarães, D.V.; Gonzaga, M.I.S.; Silva, T.O.; Silva, T.L.; Dias, N.; Matias, M.I. Soil organic matter pools and carbon fractions in soil under different land uses. Soil Tillage Res. 2013, 126, 177–182. [Google Scholar] [CrossRef] [Green Version]
- Awale, R.; Emerson, M.A.; Machado, S. Soil organic carbon pools as early indicators for soil organic matter stock changes under different tillage practices in Inland Pacific Northwest. Front. Ecol. Evol. 2017. [Google Scholar] [CrossRef] [Green Version]
- Curtin, D.; Wright, C.E.; Beare, M.H.; McCallum, F.M. Hot water-extractable nitrogen as an indicator of soil nitrogen availability. Soil Sci. Soc. Am. J. 2006, 70, 1512–1521. [Google Scholar] [CrossRef]
- Hamkalo, Z.; Bedernichek, T. Total, cold and hot water extractable organic carbon in soil profile: Impact of land-use change. Zemdirb. Agric. 2014, 101, 125–132. [Google Scholar] [CrossRef] [Green Version]
- Liu, E.; Teclemariam, S.G.; Yan, C.; Yu, J.; Gu, R.; Liu, S.; He, W.; Liu, Q. Long-term effects of no-tillage management practice on soil organic carbon and its fractions in the northern China. Geoderma 2014, 213, 379–384. [Google Scholar] [CrossRef]
- Martyniuk, S.; Koziel, M.; Stalenga, J.; Jończyk, K. Labile factions of soil organic matter and microbial characteristics of soil under organic and conventional crop management systems. Biol. Agric. Hortic. 2015, 32, 1–6. [Google Scholar] [CrossRef]
- Nielsen, M.N.; Winding, A. Microorganisms as Indicators of Soil Health; Technical Report 388; National Environmental Research Institute: Aarhus Universitet, Denmark, 2002; Available online: https://www.dmu.dk/1_viden/2_Publikationer/3_fagrapporter/rapporter/FR388.pdf (accessed on 9 June 2021).
- Cardoso, E.J.B.N.; Vascocellos, R.L.F.; Bini, D.; Miyauchi, M.Y.H.; dos Santos, C.A.; Alves, P.R.L.; de Paula, A.M.; Nakatani, A.S.; Pereira, J.M.; Nogueira, M.A. Soil health: Looking for suitable indicators. What should be considered to assess the effects of use and management on soil health? Sci. Agric. 2013, 274–289. [Google Scholar] [CrossRef] [Green Version]
- Saikia, R.; Sharma, S.; Thind, H.S.; Singh, Y. Tillage and residue management practices affect soil biological indicators in a rice-wheat cropping system in north-western India. Soil Use Manag. 2019, 36, 157–172. [Google Scholar] [CrossRef]
- Gajda, A.M.; Przewłoka, B.; Gawryjołek, K. Changes in soil quality associated with tillage system applied. Int. Agrophys. 2013, 27, 133–141. [Google Scholar] [CrossRef]
- Gajda, A.M.; Przewłoka, B. Soil biological activity as affected by tillage intensity. Int. Agrophys. 2012, 26, 15–23. [Google Scholar] [CrossRef]
- Jiang, X.; Wright, A.L.; Wang, J.; Li, Z. Long-term tillage effects on the distribution patterns of microbial biomass and activities within soil aggregates. Catena 2011, 87, 276–280. [Google Scholar] [CrossRef]
- Lamptey, S.; Li, L.; Xie, J.; Zhang, R.; Luo, Z.; Cai, L.; Liu, J. Soil respiration and net ecosystem production under different tillage practices in semi-arid Northwest China. Plant. Soil Environ. 2017, 63, 14–21. [Google Scholar]
- Aziz, I.; Mahmood, T.; Islam, K.R. Effect of long term no-till and conventional tillage practices on soil quality. Soil Tillage Res. 2013, 131, 28–35. [Google Scholar] [CrossRef]
- Hazarika, S.; Parkinson, R.; Bol, R.; Dixon, L.; Russell, P.; Donovan, S.; Allen, D. Effect of tillage system and straw management on organic matter dynamics. Agron. Sustain. Dev. 2009, 29, 525–533. [Google Scholar] [CrossRef]
- Merino, C.; Godoy, R.; Matus, F. Soil enzymes and biological activity at different levels of organic matter stability. J. Soil Sc. Plant. Nutr. 2016, 16, 14–30. [Google Scholar] [CrossRef] [Green Version]
- Wolińska, A.; Górniak, D.; Zielenkiewicz, U.; Goryluk-Salmonowicz, A.; Kuźniar, A.; Stępniewska, Z.; Błaszczyk, M. Microbial biodiversity in arable soils is affected by agricultural practices. Int. Agrophys 2017, 31, 259–271. [Google Scholar] [CrossRef] [Green Version]
- Błońska, E.; Lasota, J.; Zwydak, M. The relationship between soil properties, enzyme activity and land use. Leśne Prace Badaw. 2017, 78, 39–44. [Google Scholar] [CrossRef] [Green Version]
- Nyawade, S.O.; Karanja, N.N.; Gachene, C.K.K.; Harun, I.; Gitari, H.I.; Schulte-Geldermann, E.; Parker, M.L. Short-term dynamics of soil organic matter fractions and microbial activity in smallholder potato-legume intercropping systems. Appl. Soil Ecol. 2019, 142, 123–135. [Google Scholar] [CrossRef]
- Wittmann, C.; Kähkönen, M.A.; Ilvesniemi, H.; Kurola, J.; Salkinoja-Salonen, M.S. Areal activities and stratification of hydrolytic enzymes involved in the biochemical cycles of carbon, nitrogen, sulphur and phosphorus in podsolized boreal forest soils. Soil Biol. Biochem. 2004, 36, 425–433. [Google Scholar] [CrossRef]
- Mohammadi, K.; Heidari, G.; Karimi Nezhad, M.T.; Ghamari, S.; Sohrabi, Y. Contrasting soil microbial responses to fertilization and tillage systems in canola rhizosphere. Saudi J. Biol. Sci. 2012, 19, 377–383. [Google Scholar] [CrossRef] [Green Version]
- Wang, J.B.; Chen, Z.H.; Chen, L.J.; Zhu, A.N.; Wu, Z.J. Surface soil phosphorus and phosphatase activities affected by tillage and crop residue input amounts. Plant Soil Environ. 2011, 57, 251–257. [Google Scholar] [CrossRef] [Green Version]
- Cardoso, E.G.; de Moraes Sá, J.C.; Briedis, C.; de Oliveira Ferreira, A.; Borszowskei, P.R.; Santos, J.B.; Massinham, A.; Ferreira, C.F.; Siuta Júnior, D.; Baranek, E.J. Nitrogen dynamics in soil management systems. II—mineralization and nitrification rates. Rev. Bras. Ciência Solo 2011, 35, 1651–1660. [Google Scholar] [CrossRef] [Green Version]
- Li, S.; Jiang, X.; Wang, X.; Wright, A.L. Tollage effects on soil nitrification and the dynamic changes in nitrifying microorganisms in a subtropical rice-based ecosystem: A long-term field study. Soil Tillage Res. 2015, 150, 132–138. [Google Scholar] [CrossRef]
- Liu, X.; Shi, Y.; Zhang, Q.; Li, G. Effects of biochar on nitrification and denitrification-mediated N2O emissions and the associated microbial community in an agricultural soil. Environ. Sci. Poll. Res. 2021, 28, 6649–6663. [Google Scholar] [CrossRef] [PubMed]
- Mei, K.; Wang, Z.; Huang, H.; Zhang, C.; Shang, X.; Dahlgren, R.A.; Zhang, M.; Xia, F. Stimulation of N2O emission by conservation tillage management in agricultural lands: A meta-analysis. Soil Tillage Res. 2018, 182, 86–93. [Google Scholar] [CrossRef] [Green Version]
- Corrochano-Monsalve, M.; Huérfano, X.; Menéndez, S.; Torralbo, F.; Fuertes-Mendizábal, T.; Estavillo, J.-M.; González-Murua, C. Relationship between tillage management and DMPSA nitrification inhibitor efficiency. Sci Total Environ. 2020, 718, 134748. [Google Scholar] [CrossRef]
- Krauss, M.; Krause, H.-M.; Spangler, S.; Kandeler, E.; Behrens, S.; Kappler, A.; Mäder, P.; Gattinger, A. Tillage system affects fertilizer-induced nitrous oxide emissions. Biol. Fertil. Soils 2017, 53, 49–59. [Google Scholar] [CrossRef]
- Cao, Y.; Xu, L.; Zhang, Z.; Chen, Z.; He, N. Soil Microbial Metabolic Quotient in Inner Mongolian Grasslands: Patterns and Influence Factors. Chin. Geogr. Sci. 2019, 29, 1001–1010. [Google Scholar] [CrossRef] [Green Version]
- Zhou, H.; Zhang, D.; Wang, P.; Liu, X.; Cheng, K.; Li, L.; Zheng, J.; Zhang, X.; Zheng, J.; Crowley, D.; et al. Changes in microbial biomass and the metabolic quotient with biochar addition to agricultural soils: A meta-analysis. Agric. Ecosyst. Environ. 2017, 239, 80–89. [Google Scholar] [CrossRef] [Green Version]
- Xu, M.X.; Wang, Z.; Zhao, Y.G. Stratification ratio of soil organic carbon as an indicator of carbon sequestration and soil quality in ecological restoration. Restor. Ecol. 2018, 26, 555–562. [Google Scholar] [CrossRef]
- Yu, P.; Liu, S.; Ding, Z.; Zhang, A.; Tang, X. Changes in storage and the stratification ratio of soil organic carbon under different vegetation types in Northeastern China. Agronomy 2020, 10, 290. [Google Scholar] [CrossRef] [Green Version]
- Zhang, S.; Li, H.; Yang, X.; Sun, B. Effects of soil management regimes on biochemical properties of a loess soil. J. Soil Sci. Plant. Nutr. 2015, 15, 711–725. [Google Scholar] [CrossRef] [Green Version]
- Caravaca, F.; Masciandaro, G.; Ceccanti, B. Land use in relation to soil chemical and biochemical properties in a semiarid Mediterranean environment. Soil Tillage Res. 2002, 68, 23–30. [Google Scholar] [CrossRef]
- Monsalud, R.G.; Arguelles, E.D.L.R.; Brown, M.B.; Pedro, M.S.; Nepomuceno, R.A.; Villadiego, S.A.D.; Monsalud, F.C. Relationship between microbial soil quality indicators and soil productivity under cassava-based farming systems in various sites in the Philippines. J. ISSAAS 2021, 27, 87–105. Available online: https://www.researchgate.net/publication/352192391 (accessed on 9 June 2021).
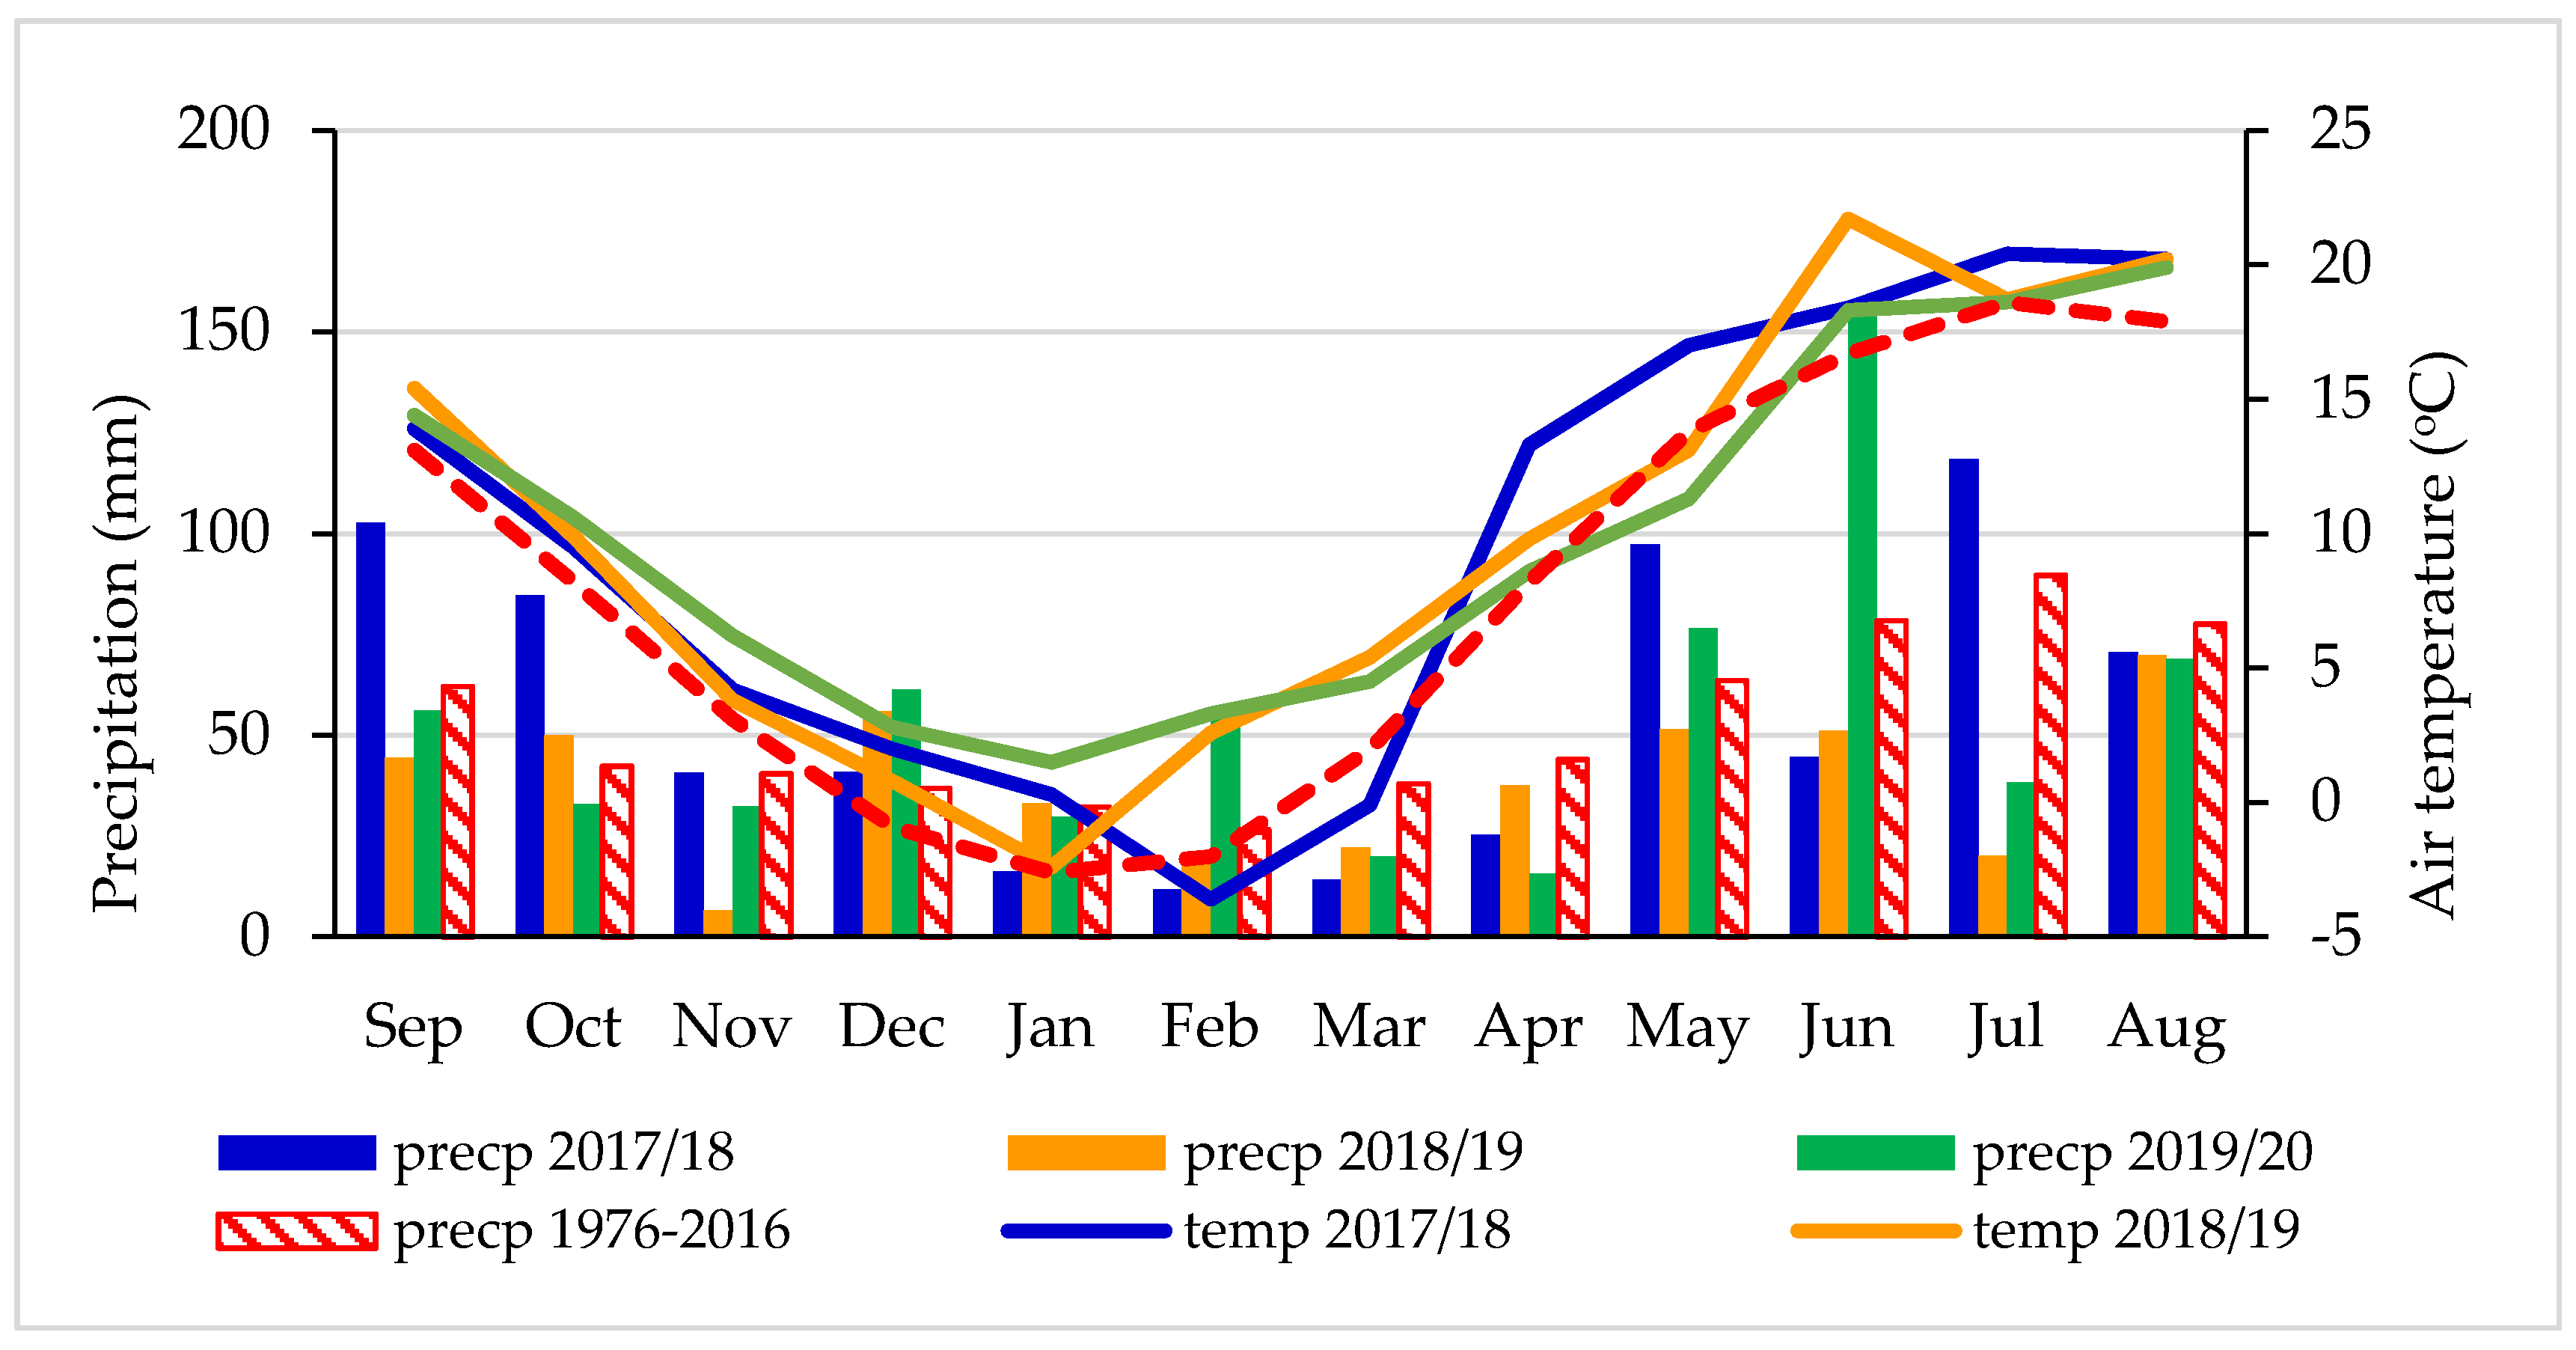
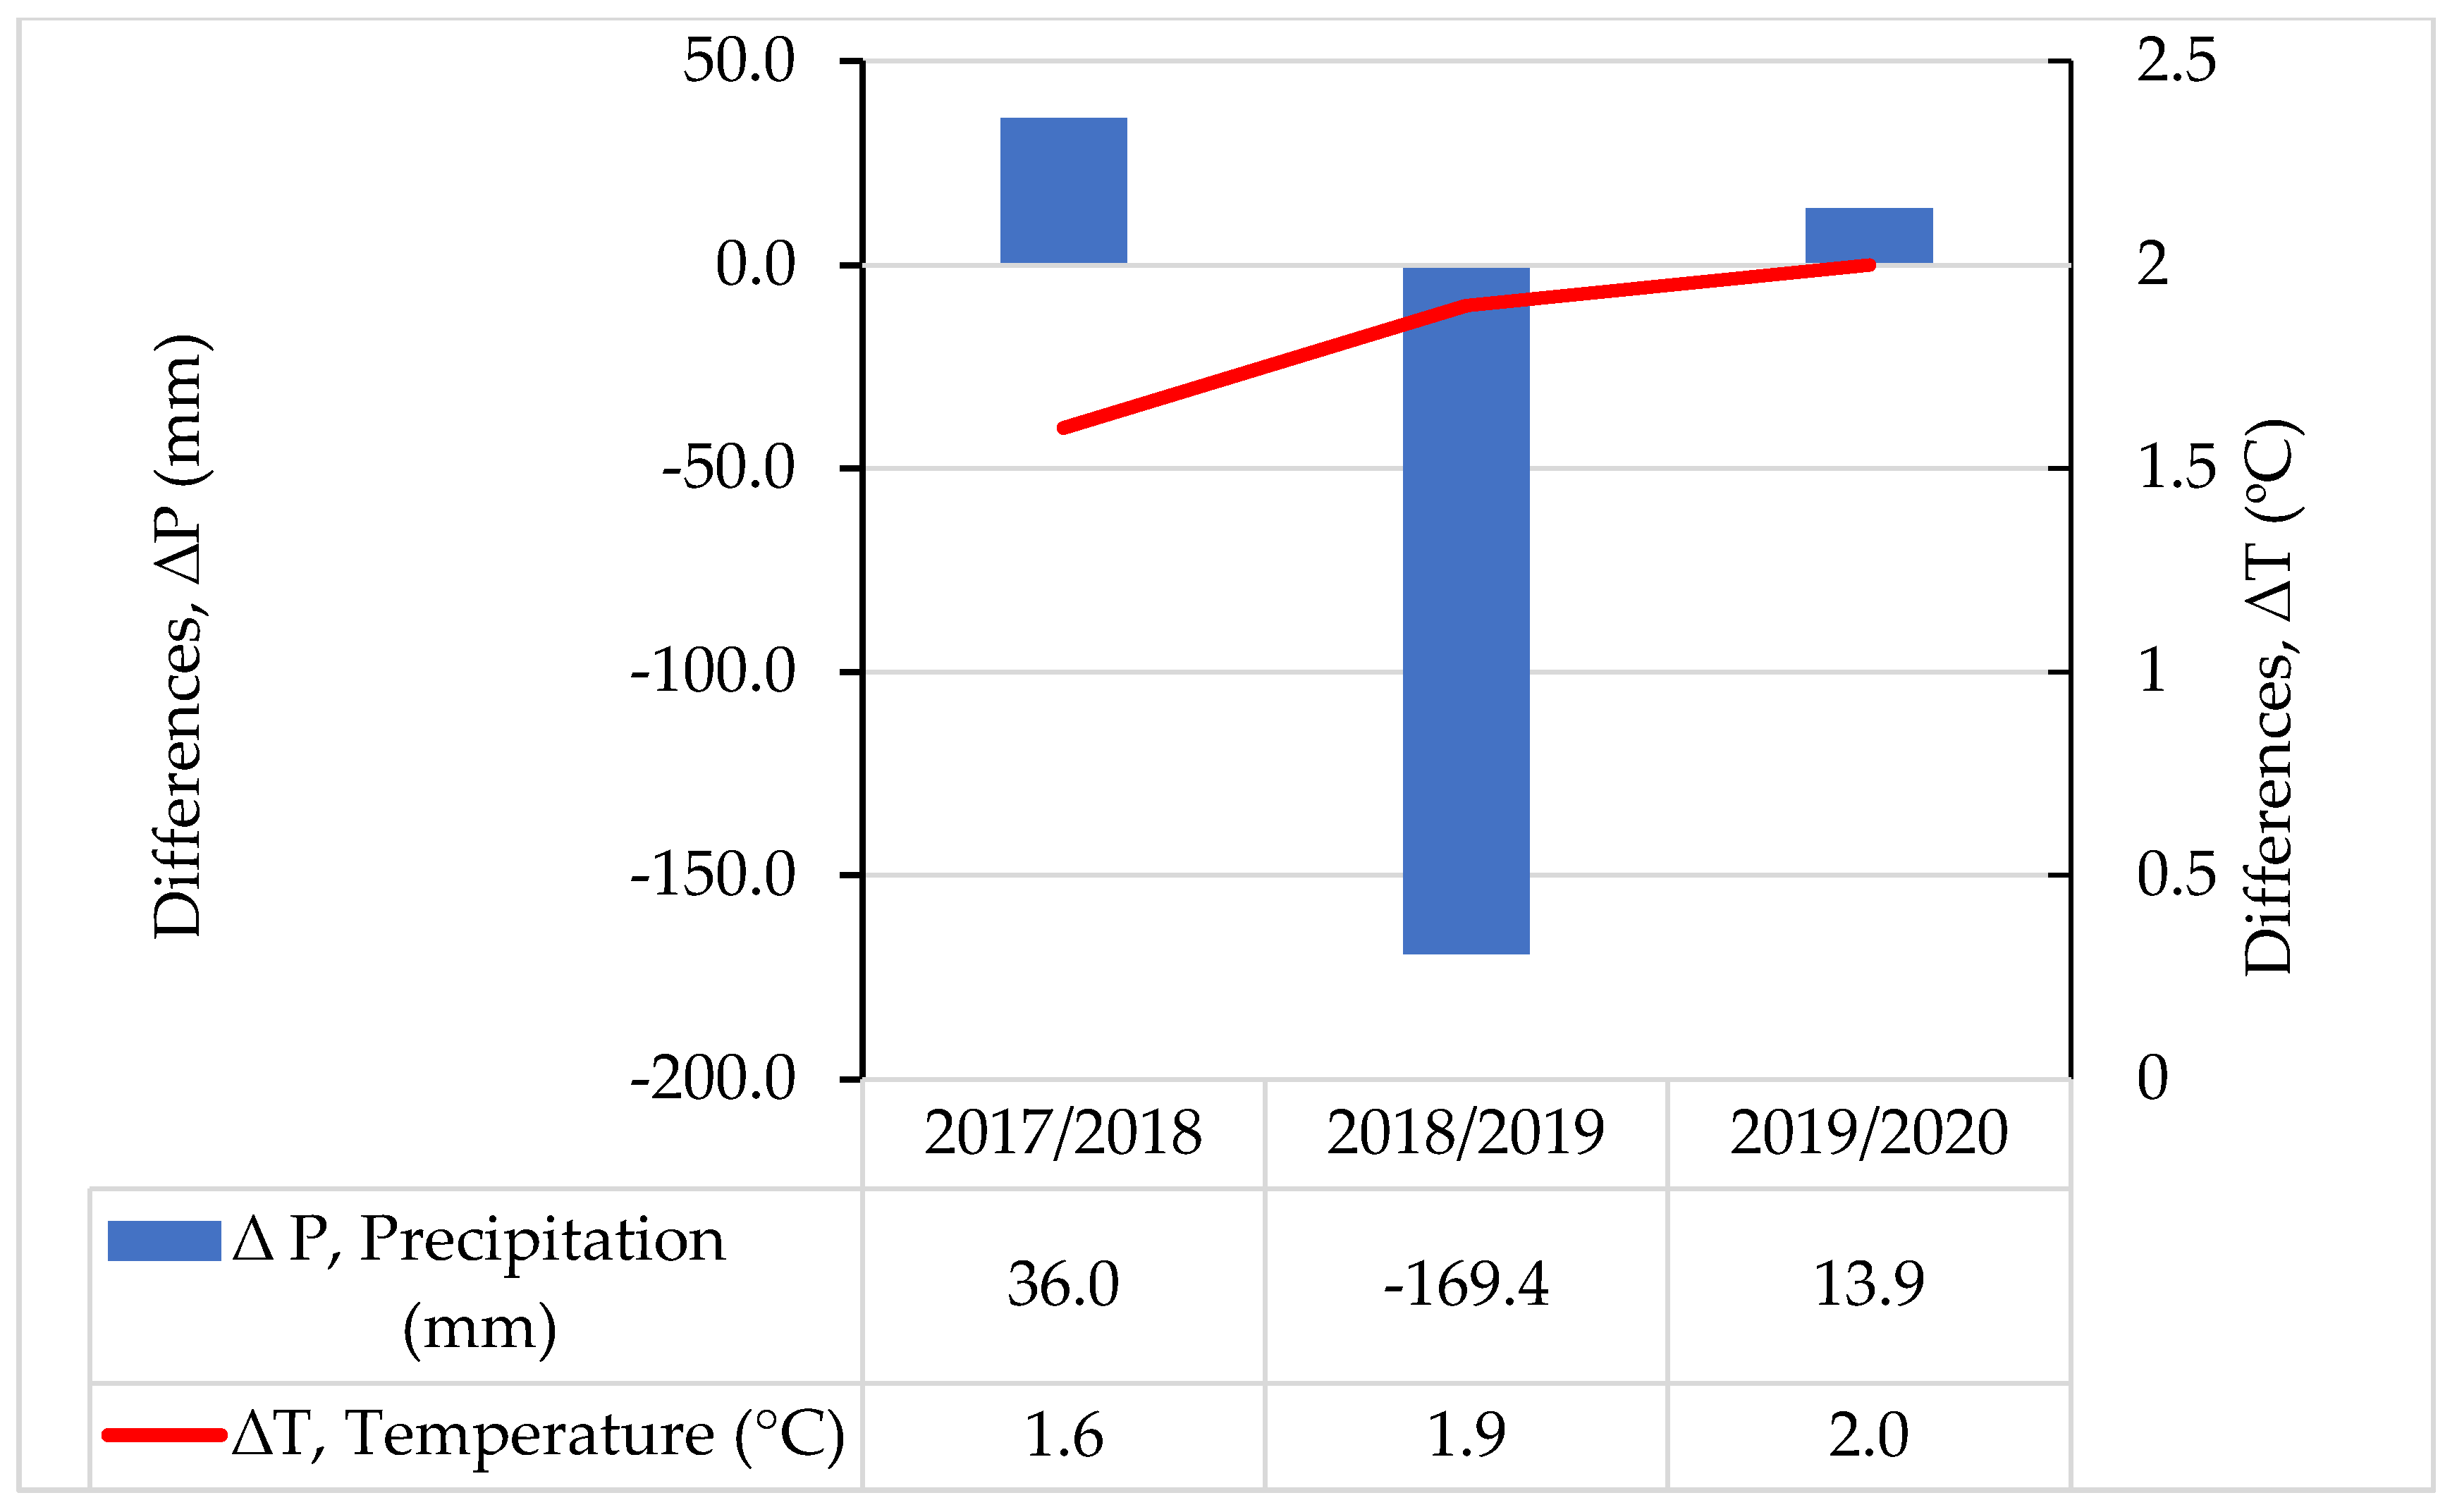

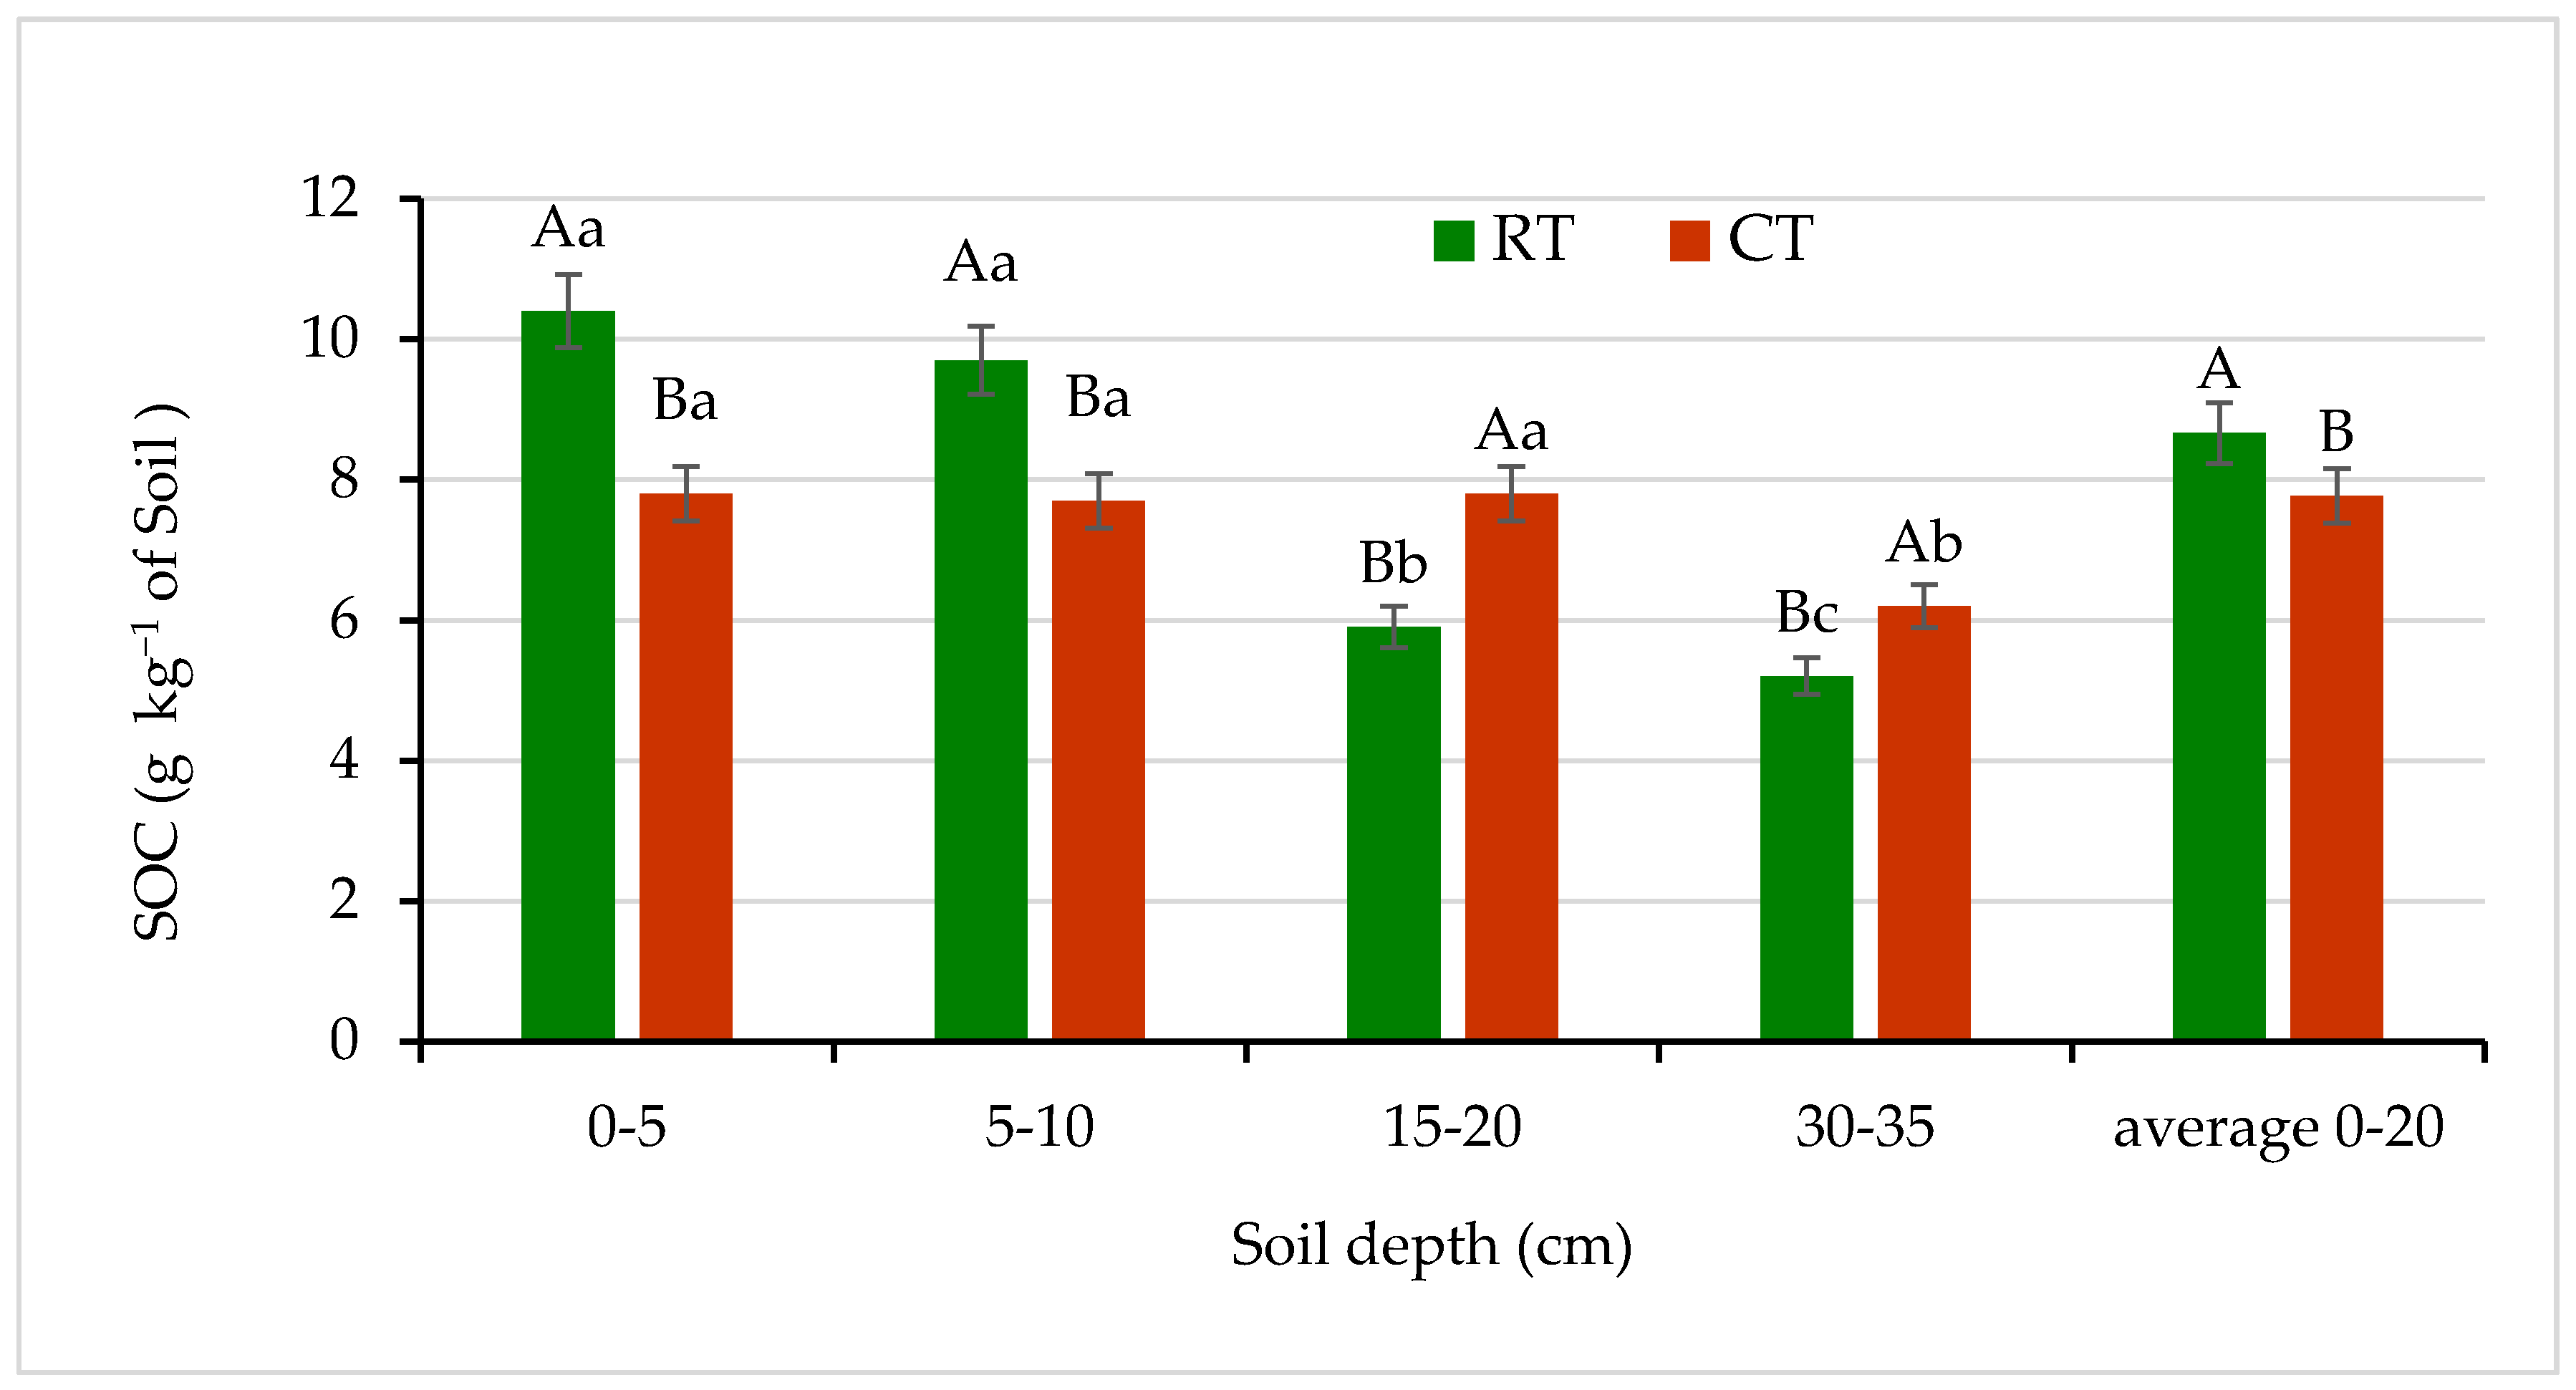
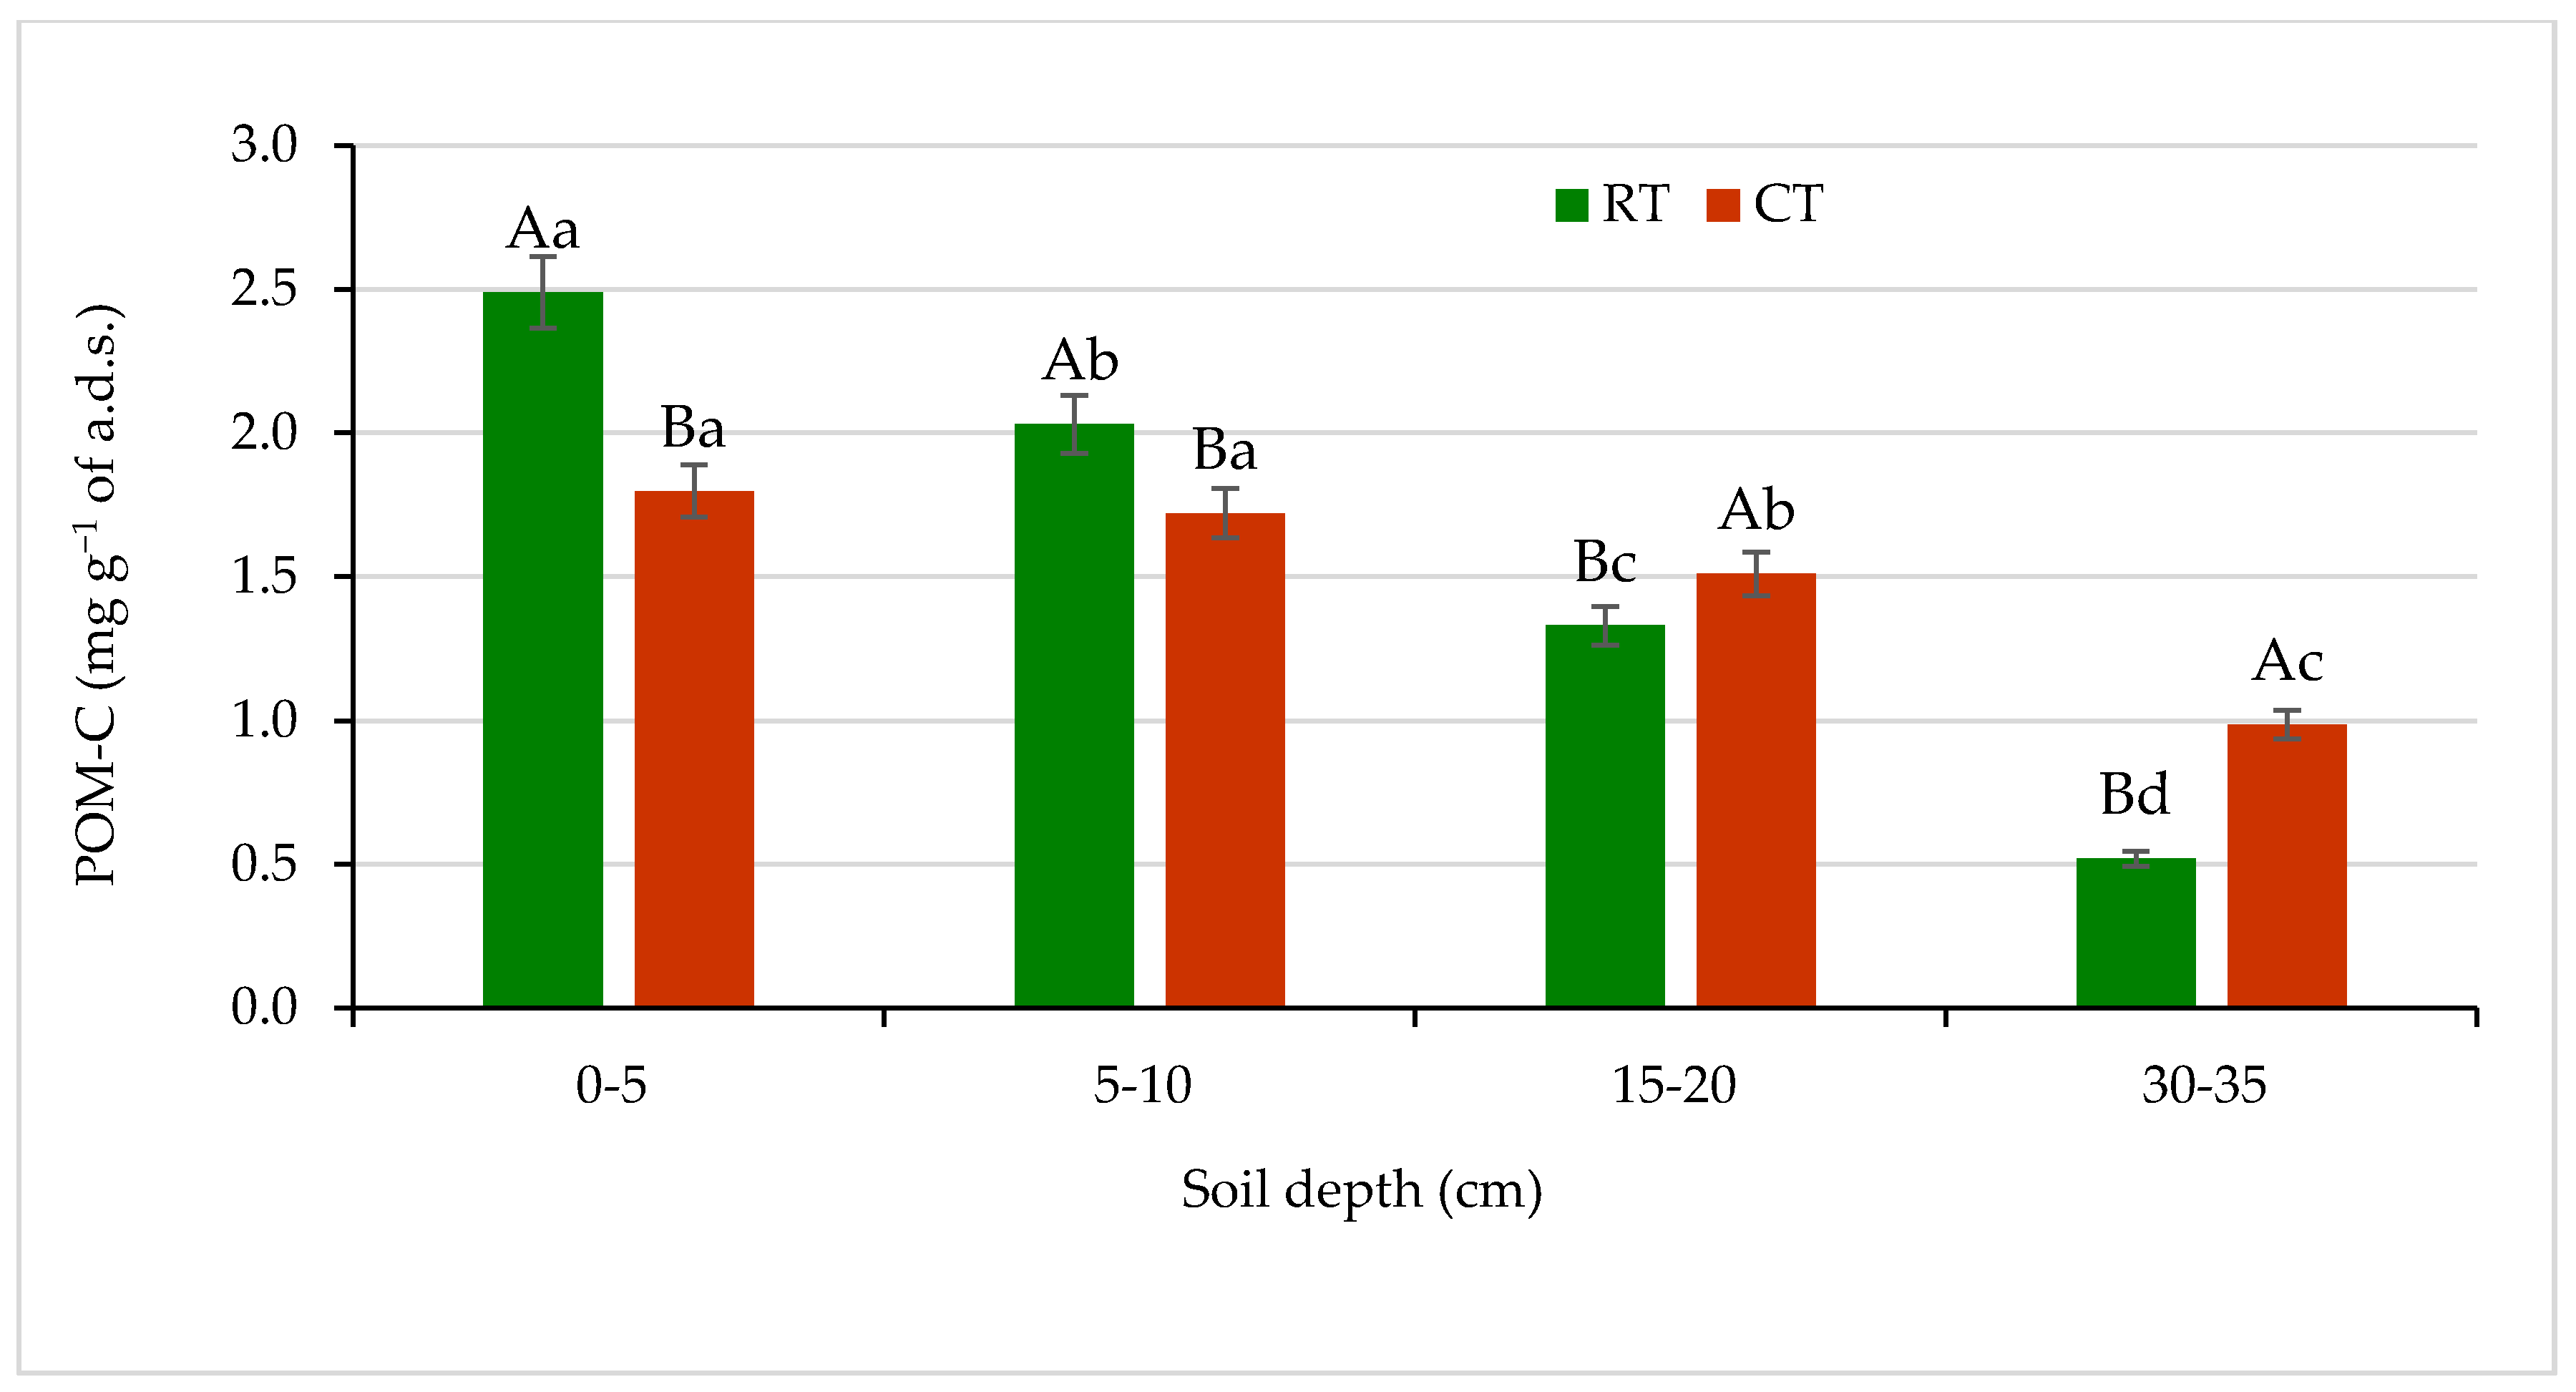

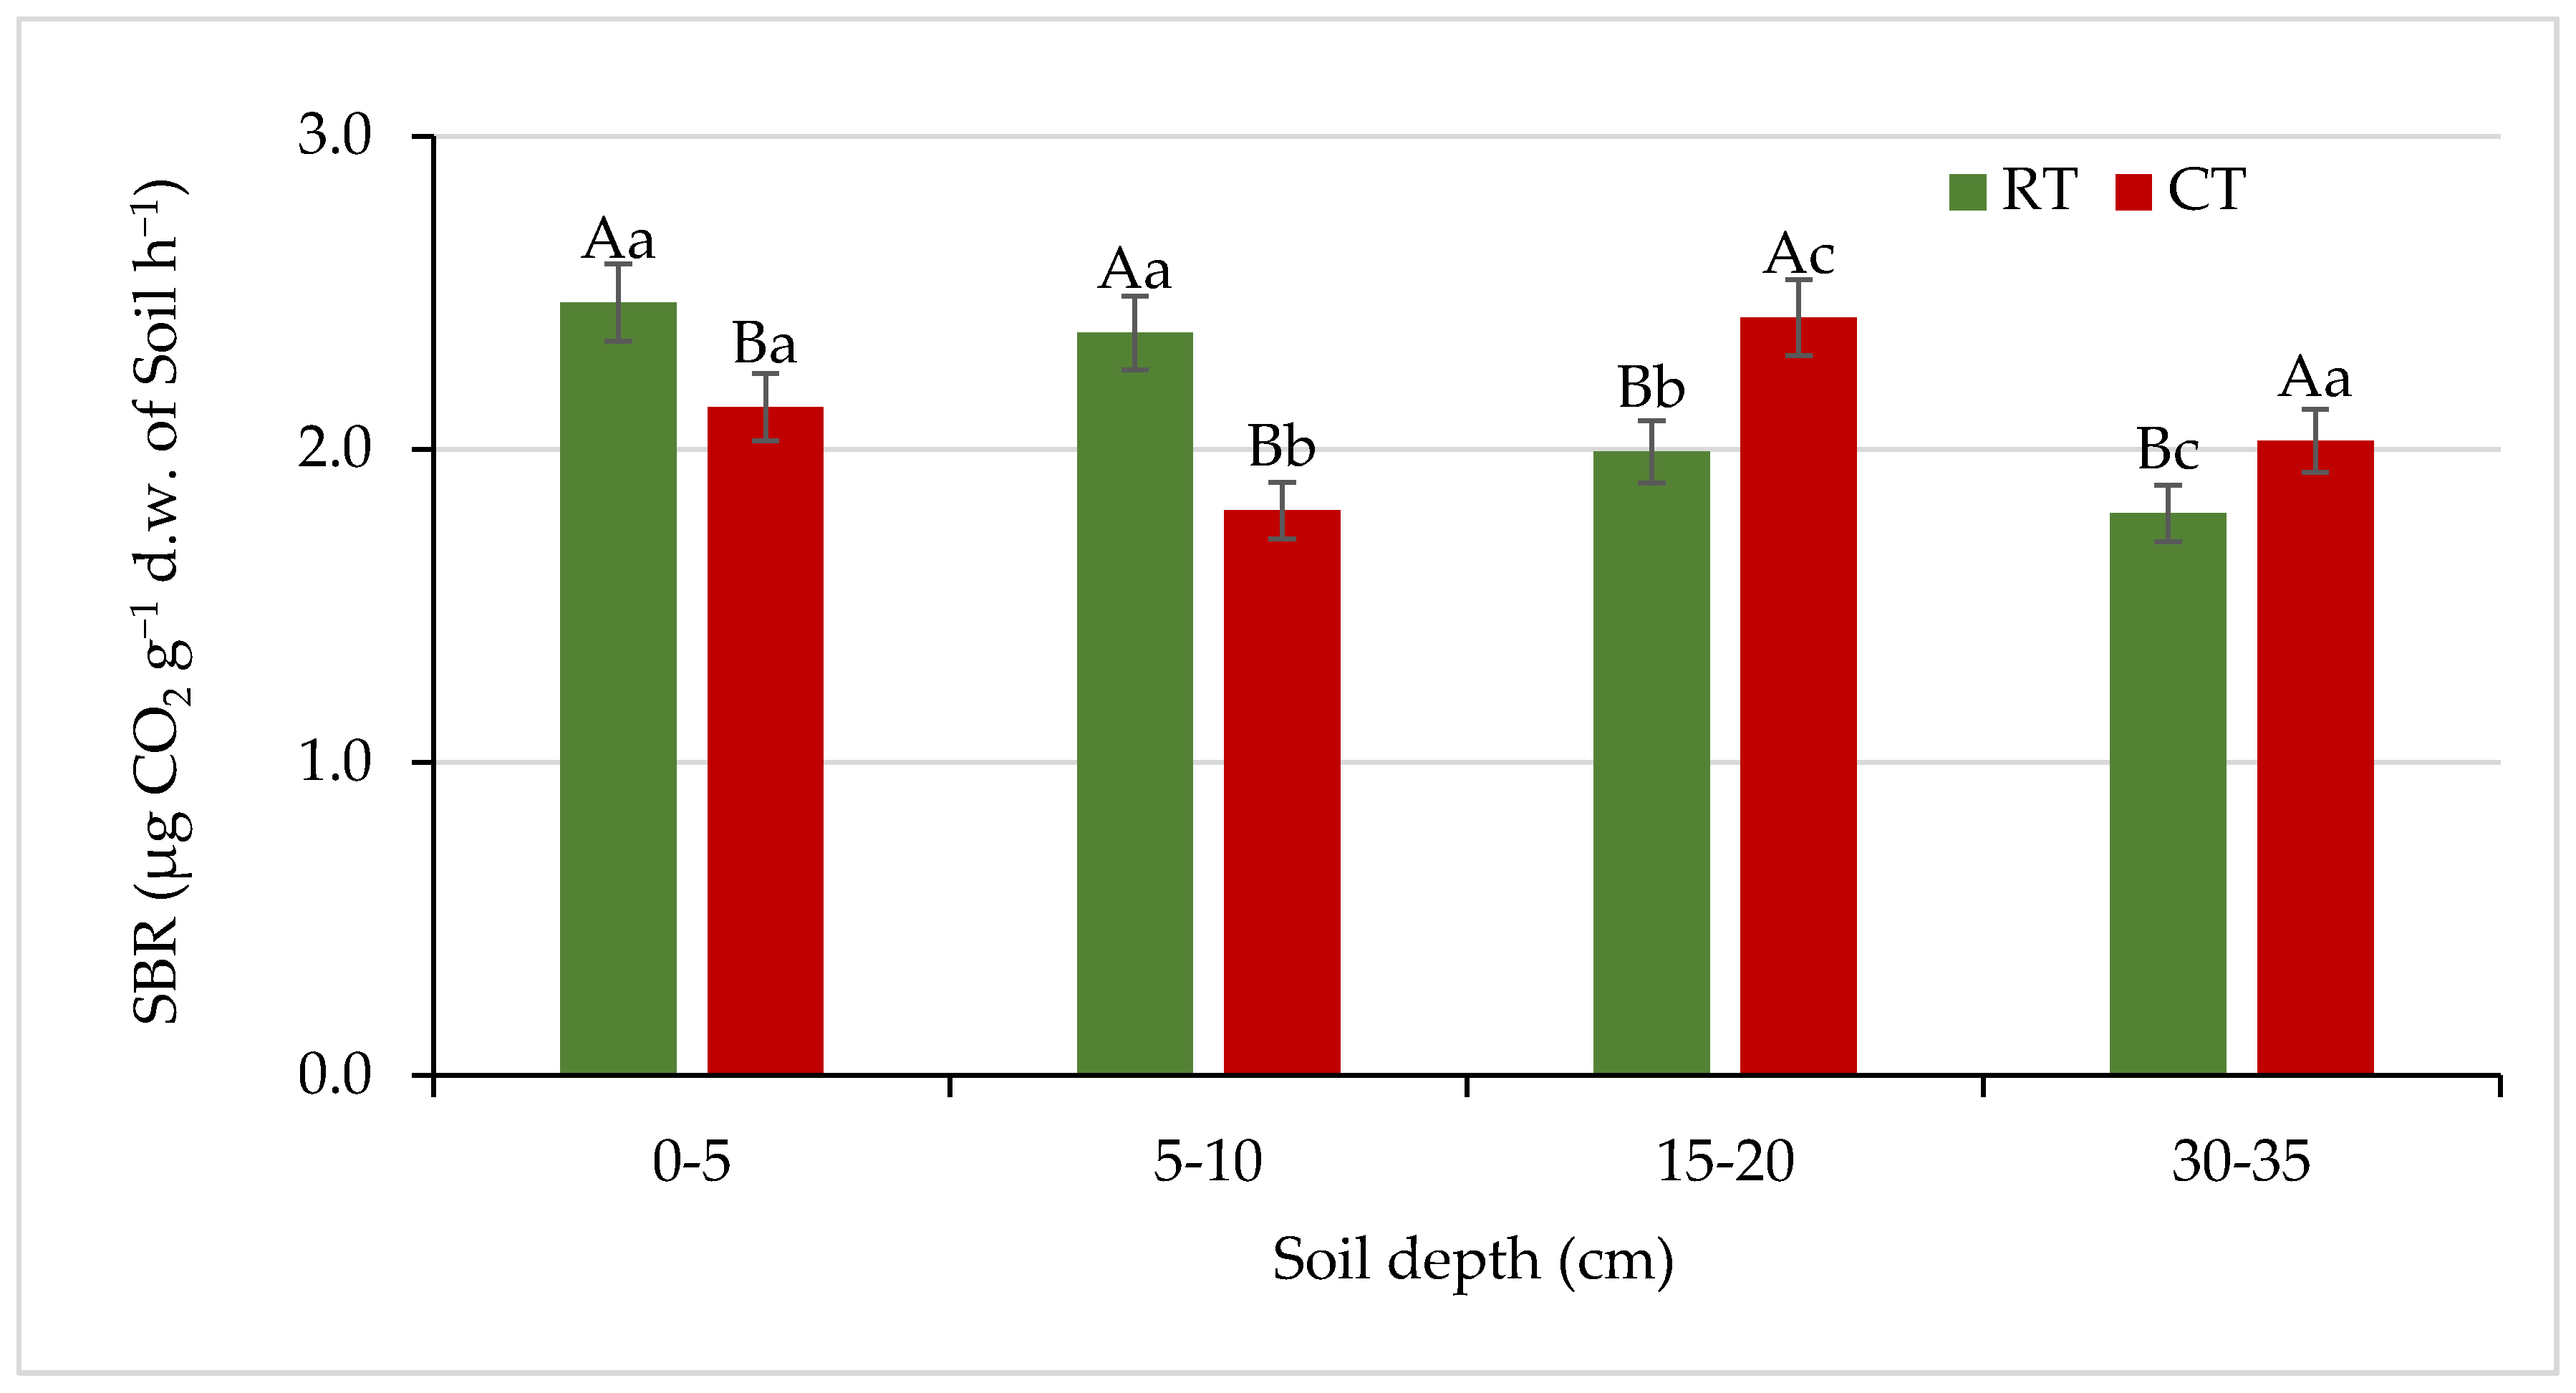


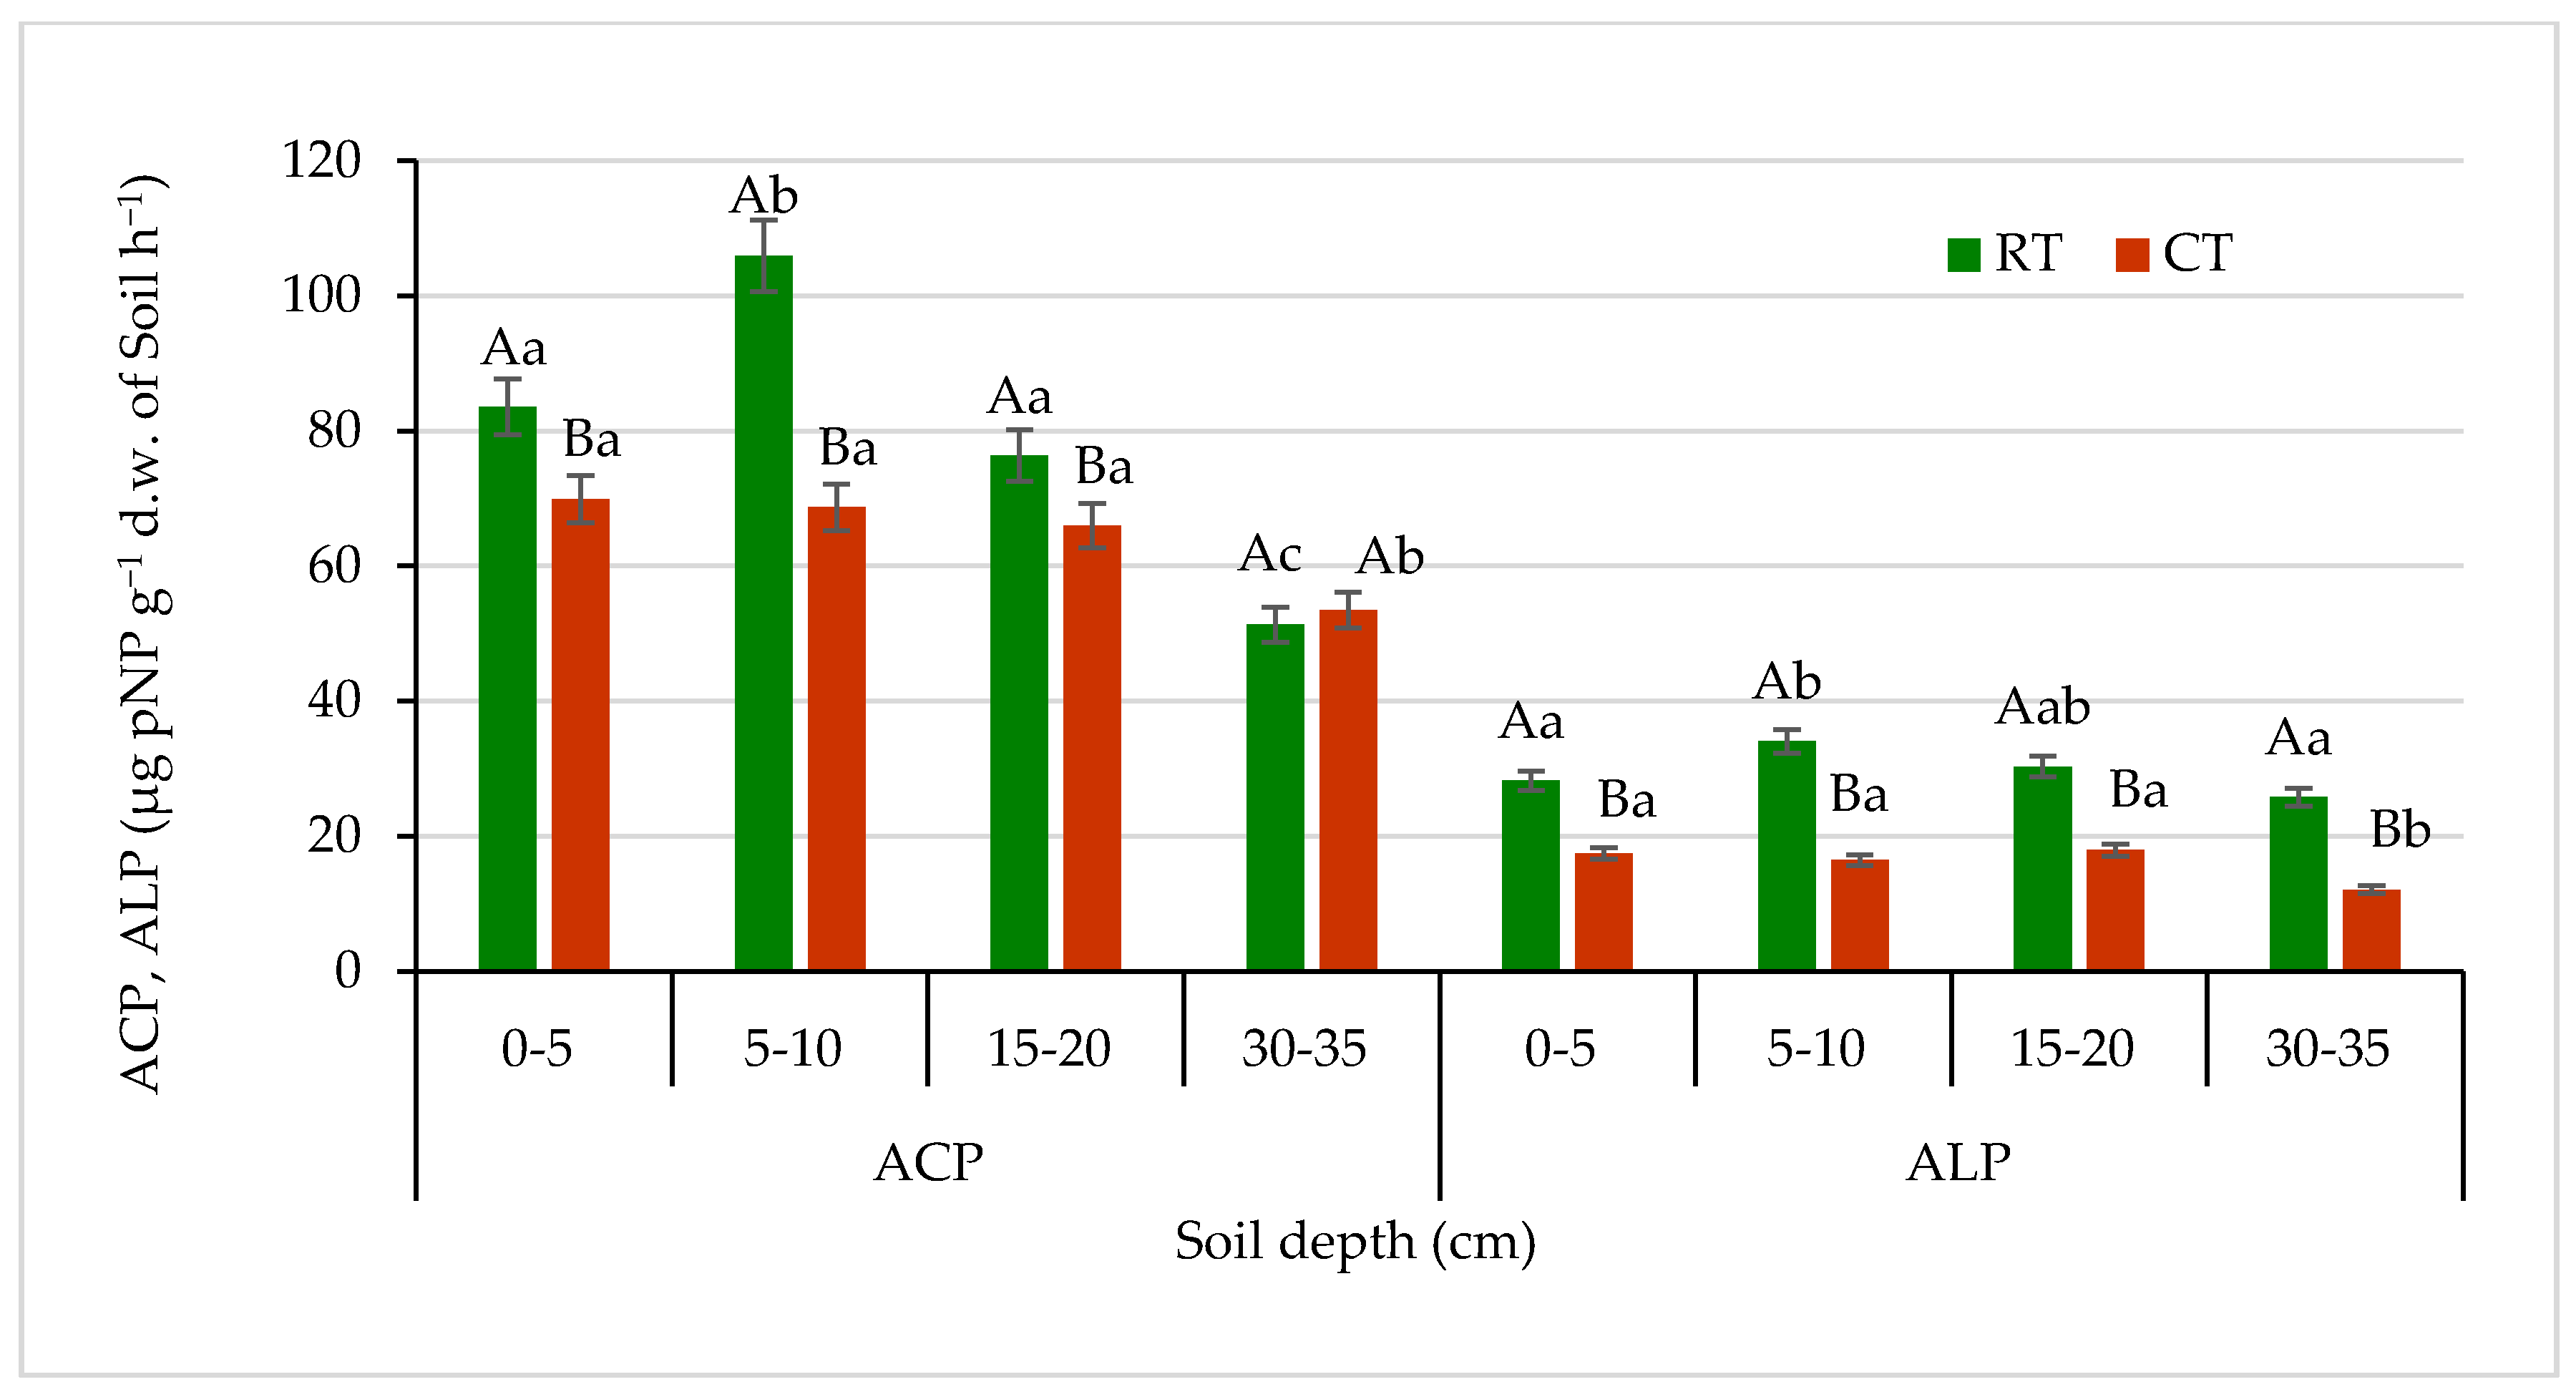

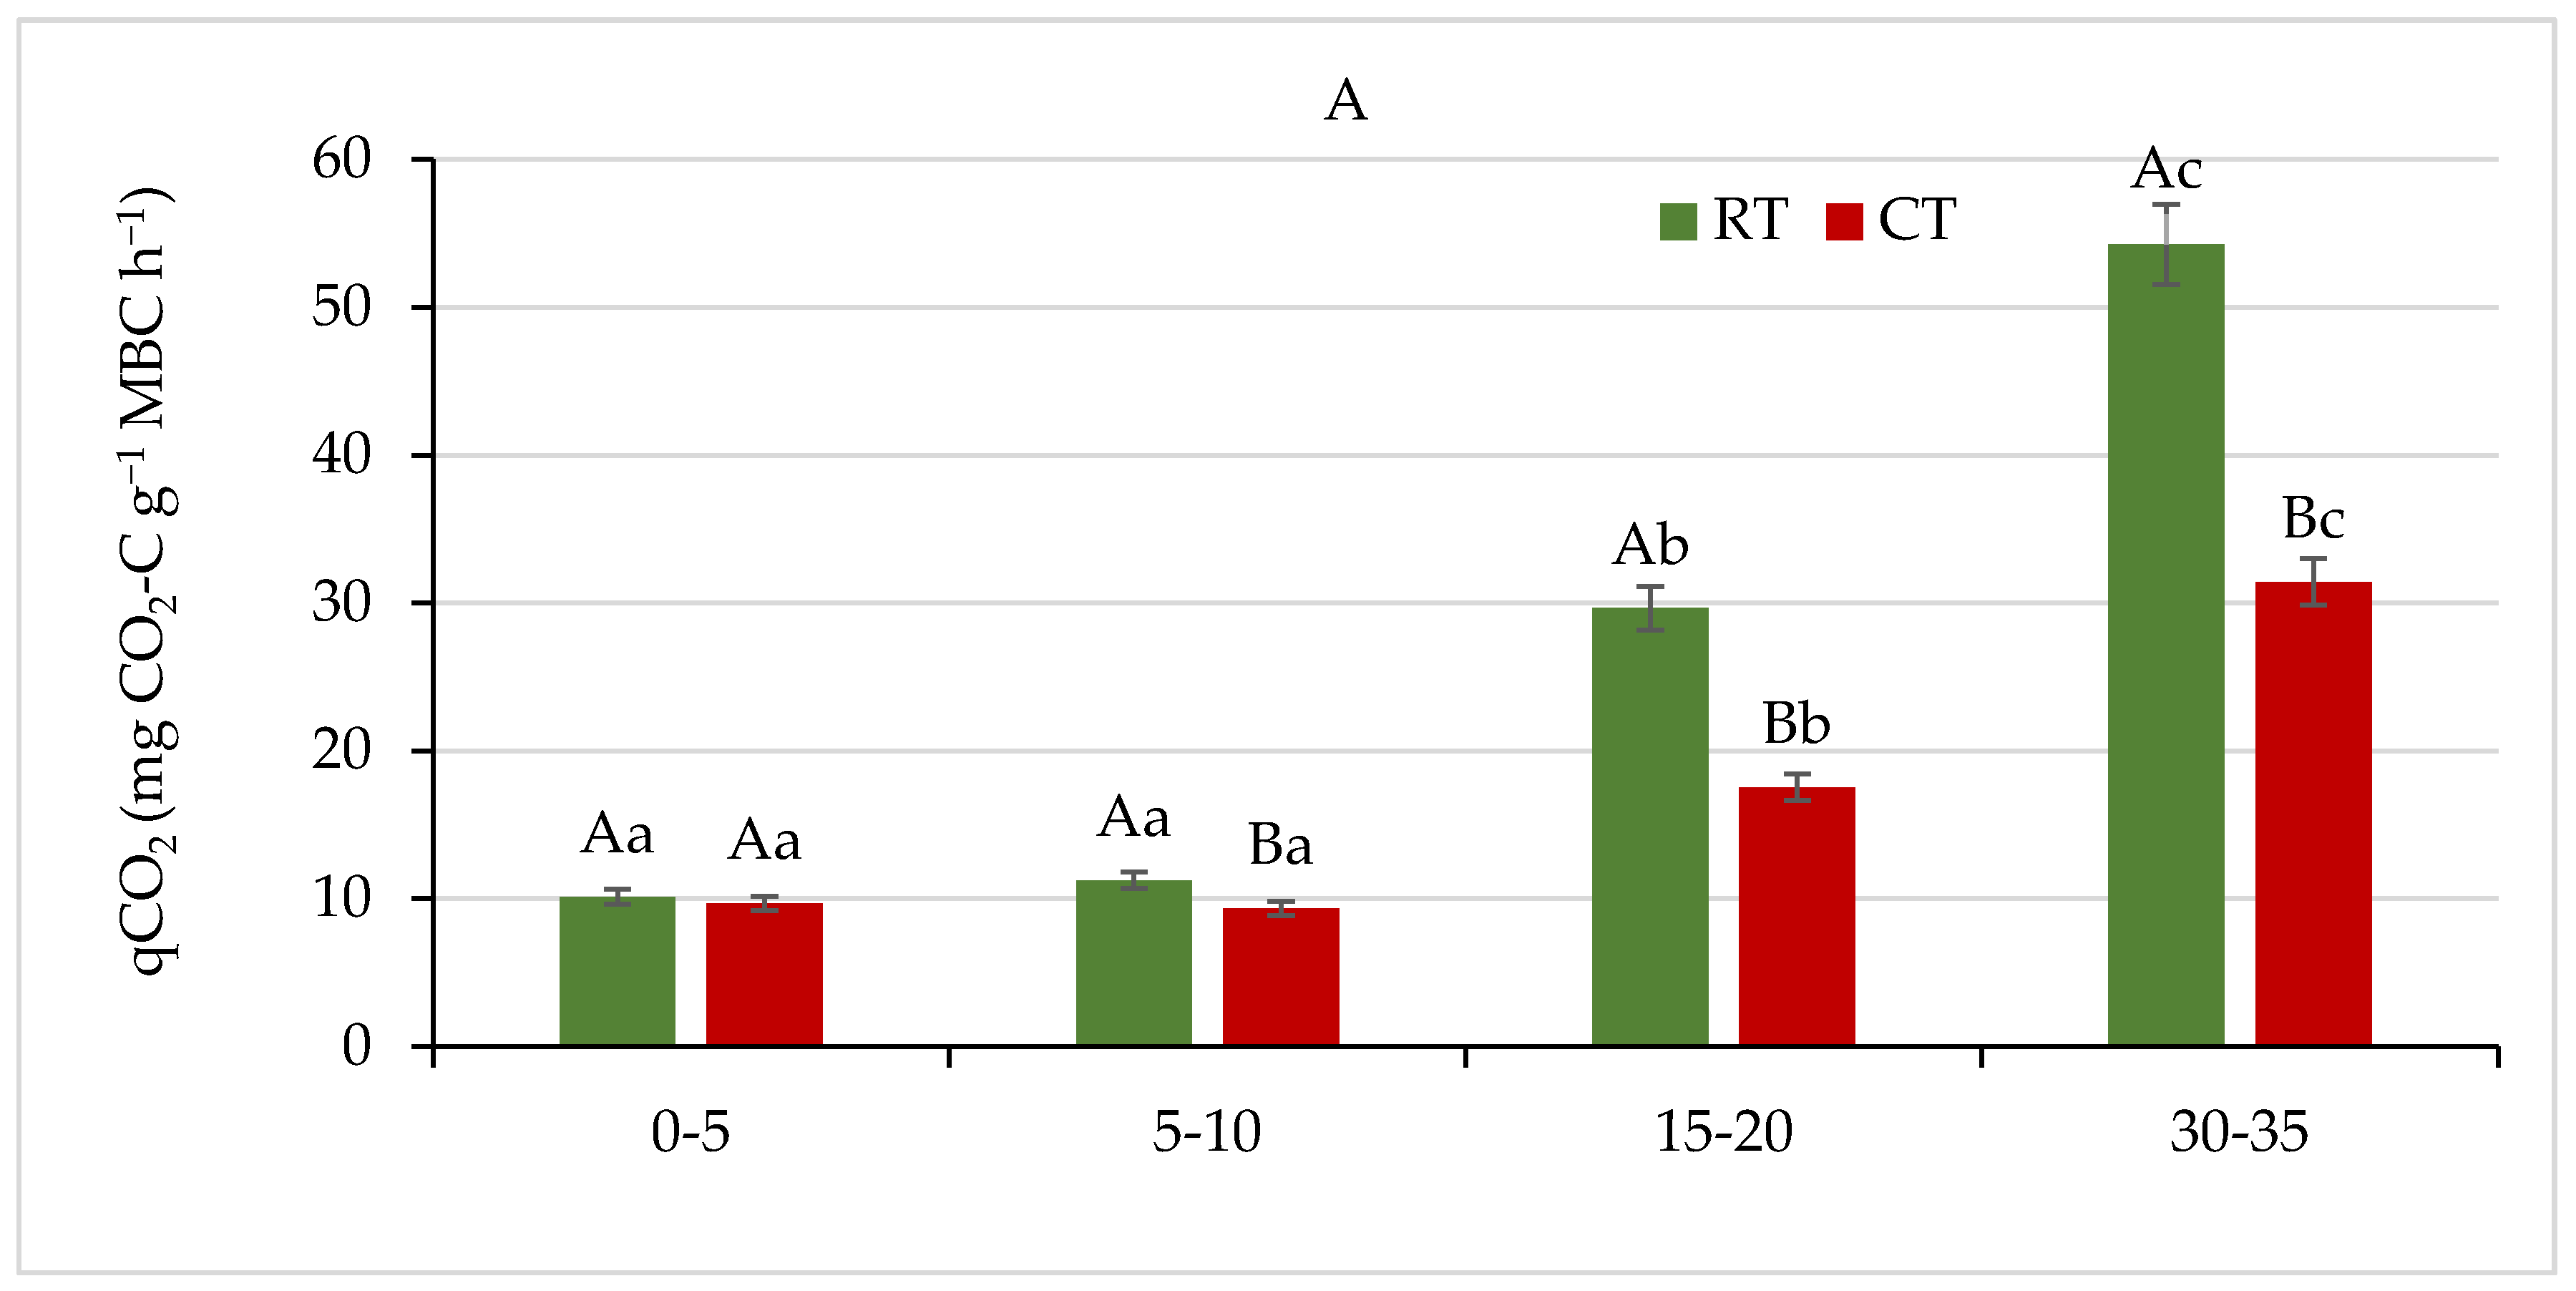

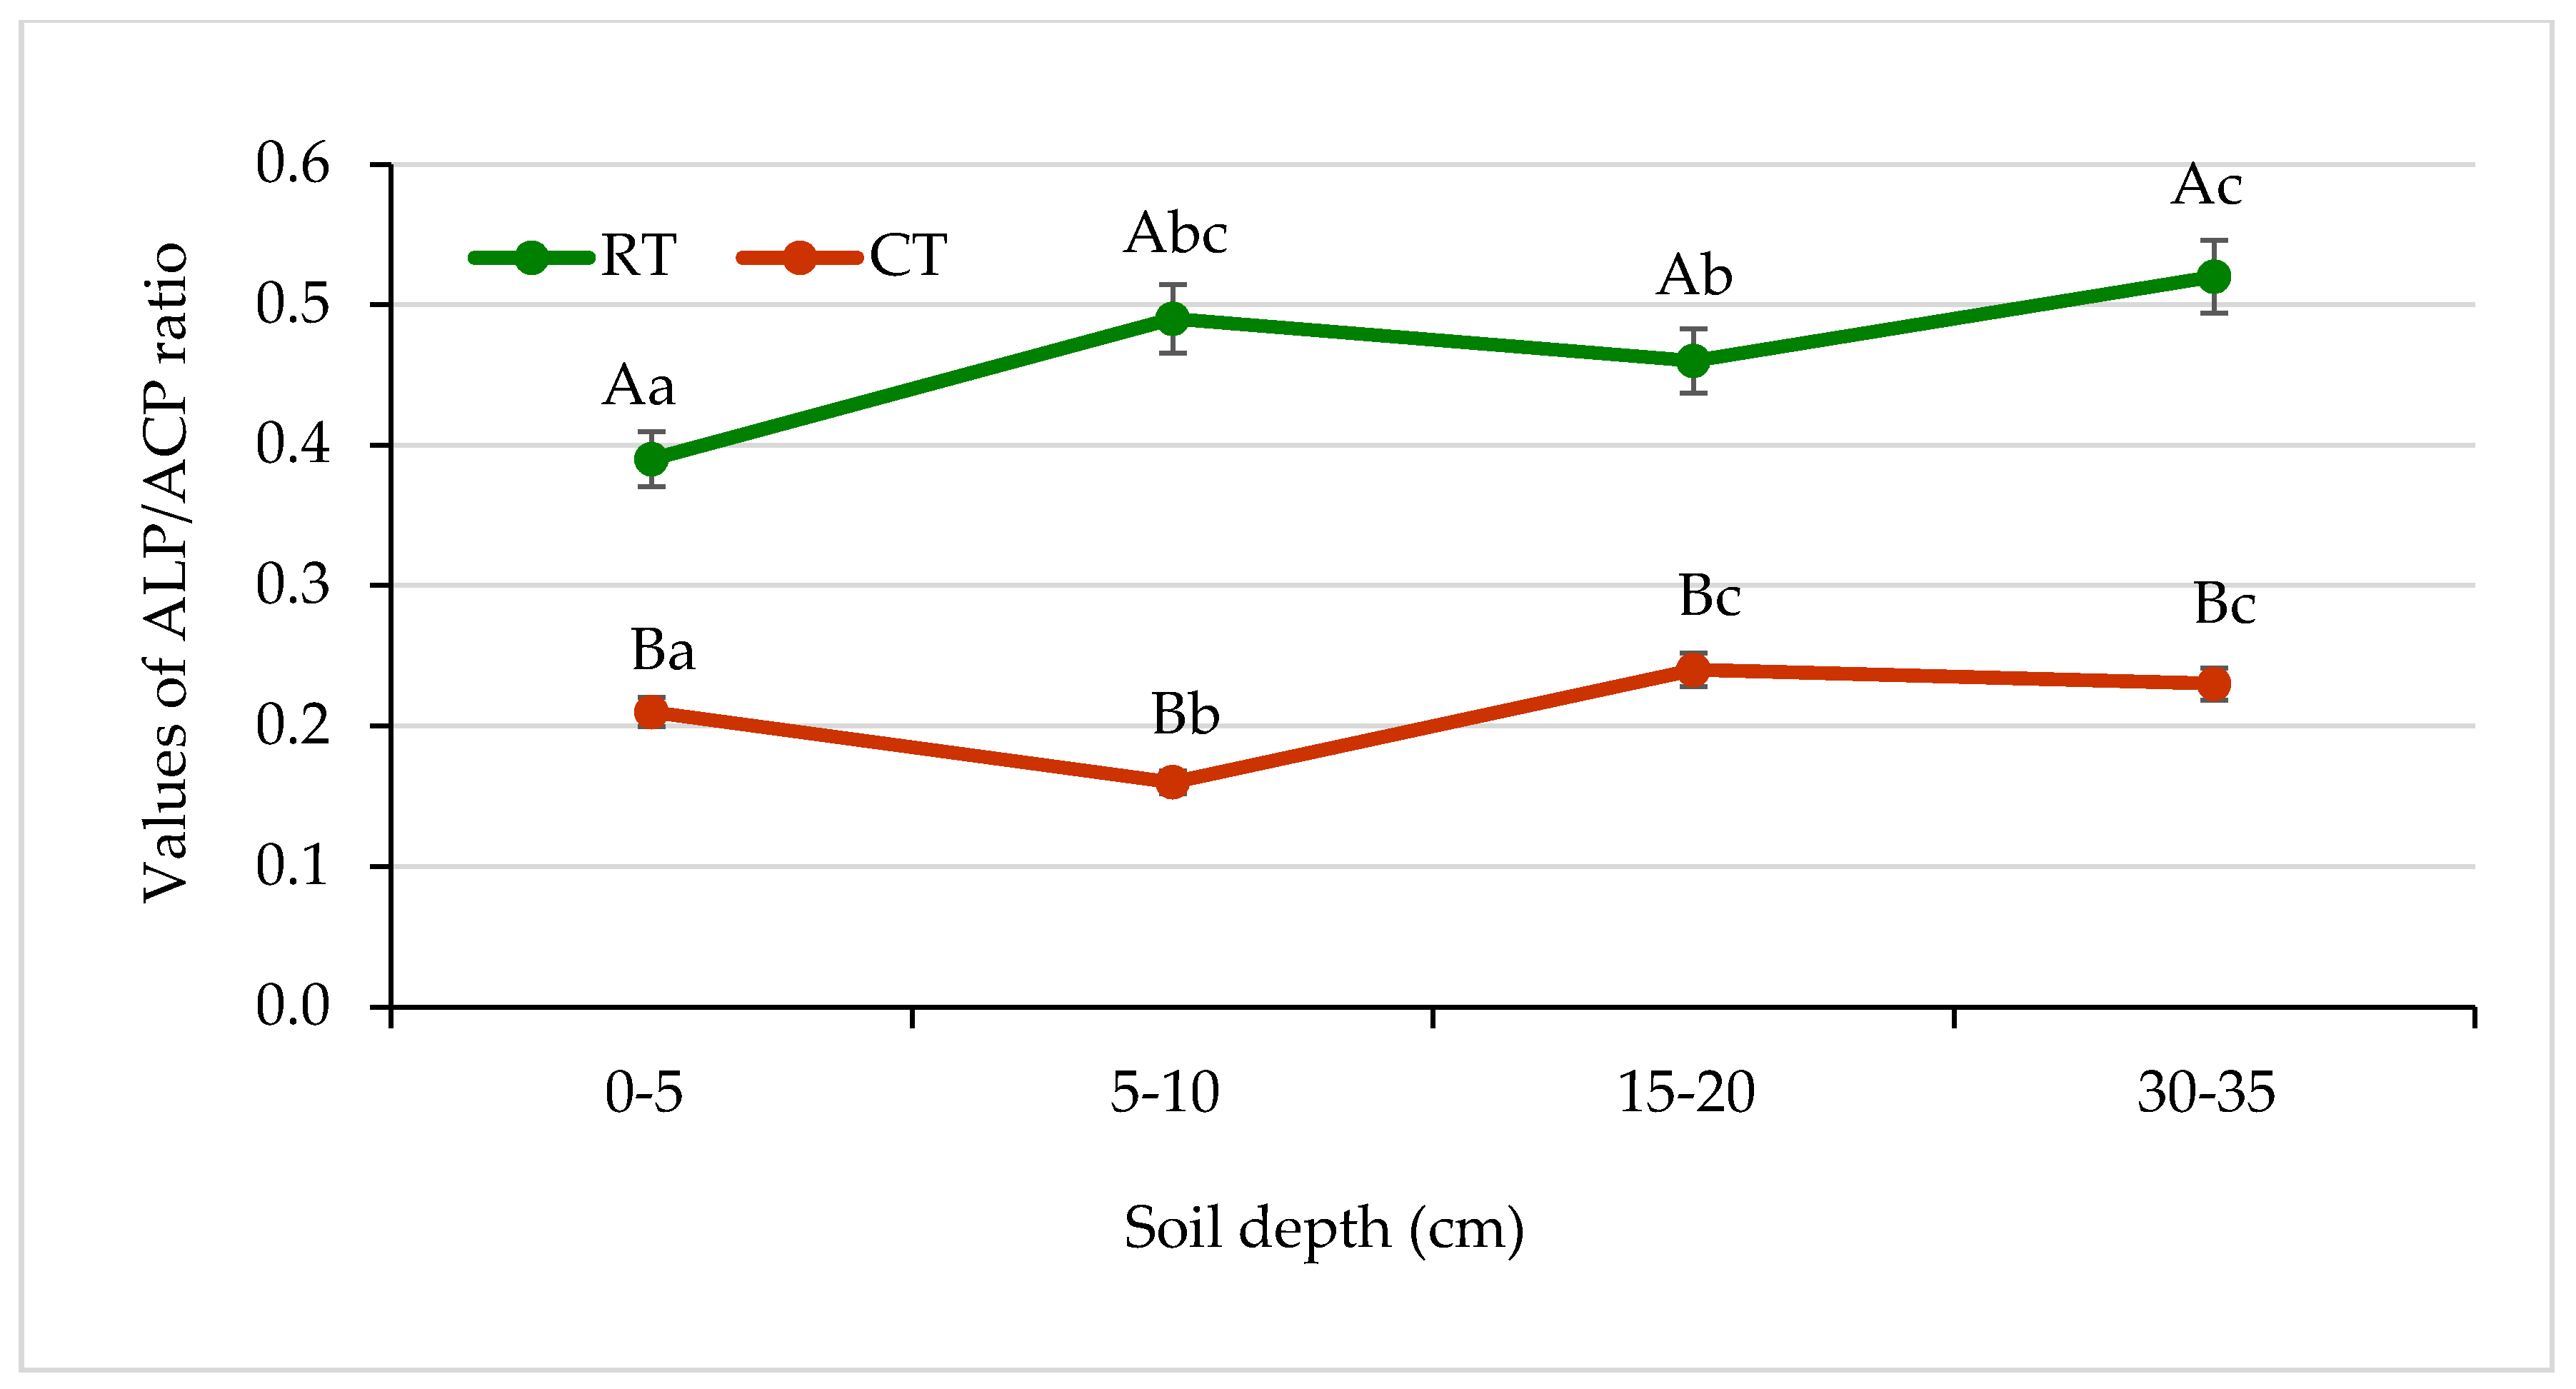

Publisher’s Note: MDPI stays neutral with regard to jurisdictional claims in published maps and institutional affiliations. |
© 2021 by the authors. Licensee MDPI, Basel, Switzerland. This article is an open access article distributed under the terms and conditions of the Creative Commons Attribution (CC BY) license (https://creativecommons.org/licenses/by/4.0/).