
Does Complex Soil Enhance Grain Yield under Cropping System?


1
Key Laboratory of Degraded and Unused Land Consolidation Engineering, Ministry of Land and Resources of China, Xi’an 710075, China
2
College of Life Science, Yulin University, Yulin 719000, China
3
State Key Laboratory of Soil Erosion and Dryland Farming on the Loess Plateau, Institute of Soil and Water Conservation, Chinese Academy of Sciences and Ministry of Water Resources, Yangling 712100, China
*
Author to whom correspondence should be addressed.
Agronomy 2021, 11(8), 1502; https://doi.org/10.3390/agronomy11081502
Submission received: 16 June 2021
/
Revised: 26 July 2021
/
Accepted: 27 July 2021
/
Published: 28 July 2021
(This article belongs to the Section Crop Breeding and Genetics)
Abstract
:Global climate change and the increasing population have increased the difficulties associated with grain production. Several measures have been established to maintain a high crop yield, while preserving or increasing soil health, including biochar application to soil, and producing new complex soil with soil amendment application, e.g., biochar and soft rocks. However, previous studies have focused on the effect of complex soil on a single crop but have not considered crop rotation. In this study, field plots with foxtail millet cultivated for two years under biochar and soft rock application were selected for licorice cultivation to detect the effects of biochar and soft rock application on soil properties and licorice yield. The results showed that the biochar-treated plot had the highest licorice biomass (251.76 g/m2), followed by the combined biochar and soft rock treatment, and that the soft rock and control treatments had the lowest licorice biomass (97.65 g/m2). Plants in biochar-treated plots had the highest liquiritin and glycyrrhizic acid contents, followed by those under soft rock treatment. Soft rocks and biochar increased the soil catalase activity, organic matter, oxalic acid, tartaric acid, formic acid, and available phosphorus (AP). Correlation analysis showed that the licorice biomass was significantly positively correlated with oxalic acid and AP and negatively correlated with soil pH. AP was positively correlated with catalase activity and oxalic acid (p < 0.05) and negatively correlated with soil pH (p < 0.05). Therefore, it can be concluded that the addition of biochar and soft rocks for two years could increase soil organic acid contents (especially that of oxalic acid), which function to reduce soil pH, increase soil AP content, and enhance licorice biomass.
1. Introduction
The increasing global population has increased the contradiction between the land used for residential and industrial production and that used for agriculture. Therefore, several measures have been implemented to develop or expand the land that is used for agriculture, including land consolidation and rice cultivation in coastal wetlands, and saline and alkaline land [1,2]. In northern Shaanxi P.R. China, an increasing amount of land that has not previously been used for cultivation is being consolidated for cultivation through application of organic fertilizer, biochar, and soft montmorillonite clay stone, and the planting of leguminous plants [3,4,5]. Among these methods, soft rocks are added to sandy soil to change soil physical properties and produce a new complex soil with a stronger ability to retain water and fertilizer [4]. Currently, more than 7.32 × 10⁴ hm2 of sandy soil land has been modified with soft rocks in the Mu Us Sandy land of northern Shaanxi, and these new land areas have been widely used for cultivating maize, potato, and foxtail millet, with economic benefits [5,6,7]. However, these previous reports focused on the crop grain yield and the effects of soft rock addition on soil properties with rotation of a single crop. In fact, the long-term continuous cropping of potato and foxtail millet could induce increased pests and diseases and reduce soil nutrient elements [8]. Therefore, it is necessary to cultivate other crops after planting foxtail millet or potato for the growth seasons. However, it remains unclear whether the benefits of soil improvement remain after crop replacement, and if it exists, how does it produce.
Crop rotation has been widely used in China to solve problems associated with successive cropping [9]. Long-term simulations showed a higher yield and lower N2O in corn rotation compared to those in a monoculture [10]. Soybean grown in three-year rotations with corn and winter wheat produced the largest yields and the greatest positive impacts on soil health indicators, likely because cereal crops enhance soil carbon inputs into soil [11]. The plant parasite index decreased significantly in alfalfa crop rotation plots, indicating that the harmful effects of plant parasites were reduced in the soil food web [12]. Overall, these results showed that crop rotation, especially rotation with leguminous plants, benefit soil and crops.
Licorice (Glycyrrhiza uralensis Fisch) is used as a traditional Chinese medicine due to its therapeutic properties, has abundant pharmacological activities, is a food flavoring/sweetener additive, and is used in the cosmetics and tobacco industries [13,14]. More than 3,000,000 kg of licorice extract was exported, which accounted for 59.14% of total Chinese exports of Chinese herbal medicines, and which has played an important role in overall poverty alleviation and rural revitalization in 2016 [15]. However, to pursue economic benefits, excess wild G. uralensis was initially excavated, and several plants were grown in sandy soil in arid and semi-arid areas, which functioned to alleviate soil erosion by wind [16]. Licorice also plays a role in safeguarding poultry health and may be used as a feed additive, which would significantly increase licorice consumption [17]. Therefore, development of artificial G. uralensis cultivation is urgently required. In the local area, farmers planted licorice after planting two growth seasons of foxtail millet. A one-year licorice cultivation did not meet the specifications for human medicine, due to the small size of licorice. Licorice is relatively small and has an important role as a feed additive in improving the gastrointestinal function of cattle and sheep [18]. At the same time, as leguminous plants, planting licorice may improve soil fertility. Therefore, crop rotation of foxtail millet and licorice is a popular method for addressing problems associated with successive cropping. However, it remains unclear as to whether planting licorice in sandy soils improved with soft rocks could achieve similar results to those in only sandy soil land.
In our previous study, we reported that soft rock and biochar application could increase the water and fertilizer retention ability of soil and thereby increase the grain foxtail millet yield [4]. However, whether soft rocks and biochar promote crop production continuously during crop rotation is not well understood. Here, we hypothesize that soft rocks and biochar could improve soil properties to enhance the plant–soil interaction to increase plant production after crop rotation. Therefore, land areas that had been planted with foxtail millet for two years [4] were selected to determine the effect of the four different treatments on soils with one-year licorice cultivation. Briefly, in the past two growth seasons (2018 and 2019), soft rocks were added to sandy soils at a depth of 0‒30 cm and a ratio of 1:3, and biochar was added at a concentration of 4500 kg hm−2. Licorice seeds were planted in 2020 and licorice was harvested in 2021 before foxtail millet was planted to reduce the effect of wind erosion of the fields after harvest. Soil nutrients and their relative indices, licorice biomass, and quality-related indicators were analyzed to determine: (1) the effect of different soils on licorice growth; and (2) the feedback that licorice planting provides to different soils. These results provide a basic database for land with similar characteristics, for example, mine restoration and new reclaimed land.
2. Materials and Methods
2.1. Experimental Site and Design
The experimental site was in a field station at the Shaanxi Institute of Sand Control (38°1949″ N, 109°4242″ E, 1201 m a.s.l., Mu Us Sand Land) with a typical warm temperate monsoon climate in Shaanxi Province, China. The annual average temperature is 8.3 °C and the mean annual precipitation is 365.7 mm. The experimental design was described in detail in a previous study [4]. Briefly, four treatments were used, as follows: Sand only (CK), sand and biochar (BC; 4500 kg biochar/hm2); sand and soft rock (SR; sand: soft rock = 3:1), and sand, biochar, and soft rock (BC + SR; 4500 kg biochar/hm2 and sand: soft rocks = 3:1); each treatment had three replicates. Here, the land of normal yield pattern (90 kg N/hm2 and 45 kg P/hm2) used for planting foxtail millet was employed to plant licorice. The properties pH, total nitrogen (TN) and phosphorus (TP) organic matter, and soil bulk density of the soft rock, sandy soil, and biochar used in this experiment have been shown in a previous study in detail [4]. Here, the total nitrogen, total phosphorus, and organic matter are shown in Table S1. To detect the effect of soft rocks on the soil fertilizer retention capacity and because licorice can fix nitrogen, no fertilizer was added in this growth season.
2.2. Field Management
On 12 May 2020, after plowing, the seeds were sown at a level of 3 g/m2. During the entire growth stage, three irrigations were applied through drip irrigation to prevent mortality due to water deficiency. On 25 March 2021, licorice was harvested artificially and the soil was prepared for planting of foxtail millet. After harvest, soils and licorice were sampled to detect relative indices.
2.3. Sample Collection
At the harvest stage (25 March 2021), plants in a 1 m2 quadrant in each plot were manually collected to determine licorice yield. Licorice was dried at 40 °C to a constant weight. After weighing, glycyrrhizic acid, liquiritin, starch, and soluble sugar were measured in licorice. Soil samples at depths of 0–40 cm were collected using a soil borer to measure the soil water content (SWC). Fresh soil weight (FW) was determined immediately after soil collection. Dry weight (DW) was obtained after the samples were dried at 105 °C. The SWC (%) was calculated as follows:
SWC = (FW − DW)/DW × 100.
Rhizosphere soil samples at a 0–30 cm depth were sampled to analyze the soil properties. Fresh soil was used to detect soil enzyme activity, available nitrogen (AN), available phosphorus (AP), and soil organic acid. For analyses of other soil properties, soil samples were placed in the shade to dry.
2.4. Licorice Quality
Glycyrrhizic acid and liquiritin were measured by high-performance liquid chromatography (HPLC, Shimadzu Co., Ltd., Tokyo, Japan) according to the method described by the Chinese Pharmacopeia 2015 Edition. Dried licorice samples were ground manually and sieved through a 100 sieve. Grounded samples (0.2 g) were placed into a 200 mL conical flask, and 100 mL of 70% ethanol solution (V/V) was added to a tightly closed glass plug. The total weight was recorded and the sample was processed for 30 min using 250 W and 40 kHz frequency ultrasonic cleaners. After the sample cooled, the weight was determined and the lost/evaporated solution was replenished during ultrasound. After artificial shaking, the solution was filtered through a 0.45 µm membrane filter. The extracted solution was separated on an Insertsil ODS-3 (5 mm, 4.6 × 250 mm, GL Science Inc., Torrance, CA, USA) under the following program: 0–8 min, 19% acetonitrile, and 81% phosphoric acid (0.05%, v/v); 8–35 min, 50% acetonitrile; 35–36 min, 100% acetonitrile; 36–40 min, 19% acetonitrile at a flow rate of 1.0 mL/min at 35 °C. Glycyrrhizic acid and liquiritin peaks were detected with a UV detector at 237 nm and their contents were calculated using a standard curve. The standard curve was obtained by detecting the standard substances (ammonium glycyrrhizinate and liquiritin). Soluble sugar and starch contents were measured in ground samples using Chen’s method [19].
2.5. Soil Properties
Soil properties, including total nitrogen (TN), total phosphorus (TP), available nitrogen (AN), available phosphorus (AP), soil enzyme activity (urease, EC 3.5.1.5; catalase, EC 1.11.1.6), soil organic acid (oxalic acid, tartaric acid, and formic acid), and soil pH were measured according to soil agrochemical instructions [20]. Briefly, TN was detected by Kjeldahl determination with a Kjeltec 2300 analyzer unit (Foss Tecator AB, Hoganas, Sweden), and TP was detected using the Mo–Sb anti-spectrophotometric method. Soil AN was detected using an automated flow analysis instrument (Seal Auto Analyzer3, Hamburg, Germany). Soil AP was measured using the Olsen method (extraction agent: 0.05 mol L−1 NaHCO3). Soil pH was measured with a 1:2.5 (w:v) suspension of soil in water using a benchtop pH meter (Seven Excellence pH Meter Line, Mettler Toledo, Greifensee, Switzerland). Soil organic matter was measured using the potassium dichromate oxidation heating method.
Urease was measured using the indophenol blue colorimetric method. Fresh soil samples (0.5 g) were placed into 50 mL triangular flasks, 1 mL of toluene was added, and the flasks were shaken uniformly. The solution was added to 10 mL of 10% urea and 20 mL of citrate buffer and was cultivated at 37 °C in an incubator for 24 h. Next, 1 mL of filtrate was placed into a 50 mL volumetric flask and 4 mL of sodium phenol solution and 3 mL of sodium hypochlorite solution were added. The color developed after 20 min. A soilless control was set in the experiment to eliminate the error caused by the sample’s own decomposition, and the operation procedure was the same as adding soil. A spectrophotometer was employed to detect the contents at 578 nm; a standard curve was developed from a standard nitrogen solution.
Catalase was measured by potassium permanganate titration. Soil samples (0.5 g) were weighed and placed in a triangular flask with a stopper (samples without soil were used as a blank control). Thereafter, 0.5 mL of toluene was added. After artificial shaking, the solution was placed in a refrigerator at 4 °C for 30 min. After removal, 25 mL of 3% hydrogen peroxide solution was immediately added to the refrigerator, mixed well, and placed in a refrigerator for 1 h. Then, 25 mL of 2 mol/L of sulfuric acid solution was removed and quickly added to the refrigerator for storage. After artificial shaking, the solution was filtered through a membrane filter. Filtrate liquor was placed in a triangular flask, and 5 mL of distilled water and 5 mL of 2 mol/L of sulfuric acid solution were added by titration with potassium permanganate solution. The approximate amount of decomposed hydrogen peroxide consumed by potassium permanganate was calculated according to the difference between the control and the sample. Catalase activity was expressed as the volume of 0.1 mol/L of potassium permanganate (mL) consumed in 1 h per 1 g of soil.
Soil organic acids were detected using HPLC. Soil samples (5 g) were placed into 50 mL centrifuge tubes containing 20 mL of 0.1% phosphoric acid (v/v), and they were then processed for 30 min with 250 W and 40 kHz frequency ultrasonic cleaners. After cooling the sample, the centrifuge tube was off-center at 25 °C, 6000× g for 20 min. Finally, the liquid supernatant was sampled and filtered through a 0.45 µm membrane filter. The extracted solution was separated on an Insertsil ODS-3 (5 mm, 4.6 × 250 mm, GL Science Inc., United States) under the following program: 98% phosphoric acid (0.1%) and 2% acetonitrile; flow rate 1.0 mL min−1; 35 °C; UV detector at 210 nm. The organic acid contents were calculated using a standard curve, which was obtained by detecting the standard substance. Each treatment contained three replications, and each replication included two technical replications.
2.6. Data Analyses
The effects of the treatments (CK, BC, SR, and BC + SR) were evaluated using one-way ANOVA. When F-values were significant, the least significant difference (LSD) test was used to compare the means. All statistical analyses were performed using SPSS (SPSS Inc., Chicago, IL, USA). Figures were created using SigmaPlot 12.5 (Systat Software Inc., San Jose, CA, USA).
3. Results
3.1. Licorice Biomass and Quality
After 1 year of growth, the BC-treated plot produced the highest licorice biomass (251.76 g/m2), followed by BC + SR, SR, and CK producing the lowest (97.65 g/m2) (Figure 1). There were significant differences between BC, SR, and CK treatments (p < 0.05). However, no significant differences in biomass were detected between BC + SR and BC or between BC + SR and SR (p > 0.05).
Similar to biomass, plants in the BC-treated plot had the highest liquiritin and glycyrrhizic acid contents among all treatments, followed by BC + SR, SR, and CK (Figure 2). There was no significant difference in the liquiritin content between SR and BC + SR (p > 0.05); however, there was a significant difference in the glycyrrhizic acid content between these two treatments (p < 0.05).
For the soluble sugar content, BC + SR and SR had higher indices than BC and CK did (p < 0.05; Figure 3A). There was no significant difference between CK and BC or between SR and BC + SR (p > 0.05). BC + SR had the highest starch content, followed by SR and CK; there was no significant difference in the starch content between BC and BC + SR (p > 0.05) (Figure 3B). CK had a lower starch content than SR (p < 0.05).
3.2. Soil Water and pH
Topsoil (0‒10 cm) had similar SWC, and there were no significant differences among the four treatments (p > 0.05; Figure 4A). However, at the second soil depth (11‒20 cm), there were significant differences among the treatments (p < 0.05); SR and BC + SR had the highest SWC, followed by CK and BC. At the 21‒30 cm depth, SR had the highest SWC followed by BC + SR, BC, and CK, and there was no significant difference between BC and BC + SR (p > 0.05). There were no significant differences among the four treatments at depths of 31‒40 cm.
Compared with CK, BC and BC + SR treatments had significantly lower soil pH (p < 0.05, Figure 4B). The pH was slightly lower in SR than in CK; however, there was no significant difference between SR and CK (p > 0.05). No significant difference was observed with the BC + SR treatment (p > 0.05).
3.3. Soil Nutrients
For soil organic matter, a significant difference was only detected between CK and SR, and SR had the highest organic matter content (Figure 5A). SR also had the highest TN content among the treatments, although there were no significant differences in the TN content among SR, BC, and BC + SR (p > 0.05; Figure 5B). However, the TN contents in these three treatments were significantly higher than that in CK (p < 0.05). No significant differences were detected in AN, including nitrate and ammonium (p > 0.05; Figure 5C,D). There was no significant difference in the TP content among the four treatments (p > 0.05; Figure 5E). However, BC had a higher AP index than CK and SR did (p < 0.05; Figure 5F). There was no significant difference between CK and SR (p > 0.05). All other treatments had a higher AP than CK did (p < 0.05).
3.4. Soil Organic Acid
There was no significant difference in the organic acid content among BC, SR, and BC + SR treatments, and all these treatments had higher oxalic acid contents than CK did (p < 0.05; Figure 6A). SR and BC + SR had significantly higher formic acid contents than BC and CK did (p < 0.05; Figure 6B). The formic acid content was higher in BC than in CK (p < 0.05).
3.5. Soil Enzyme Activity
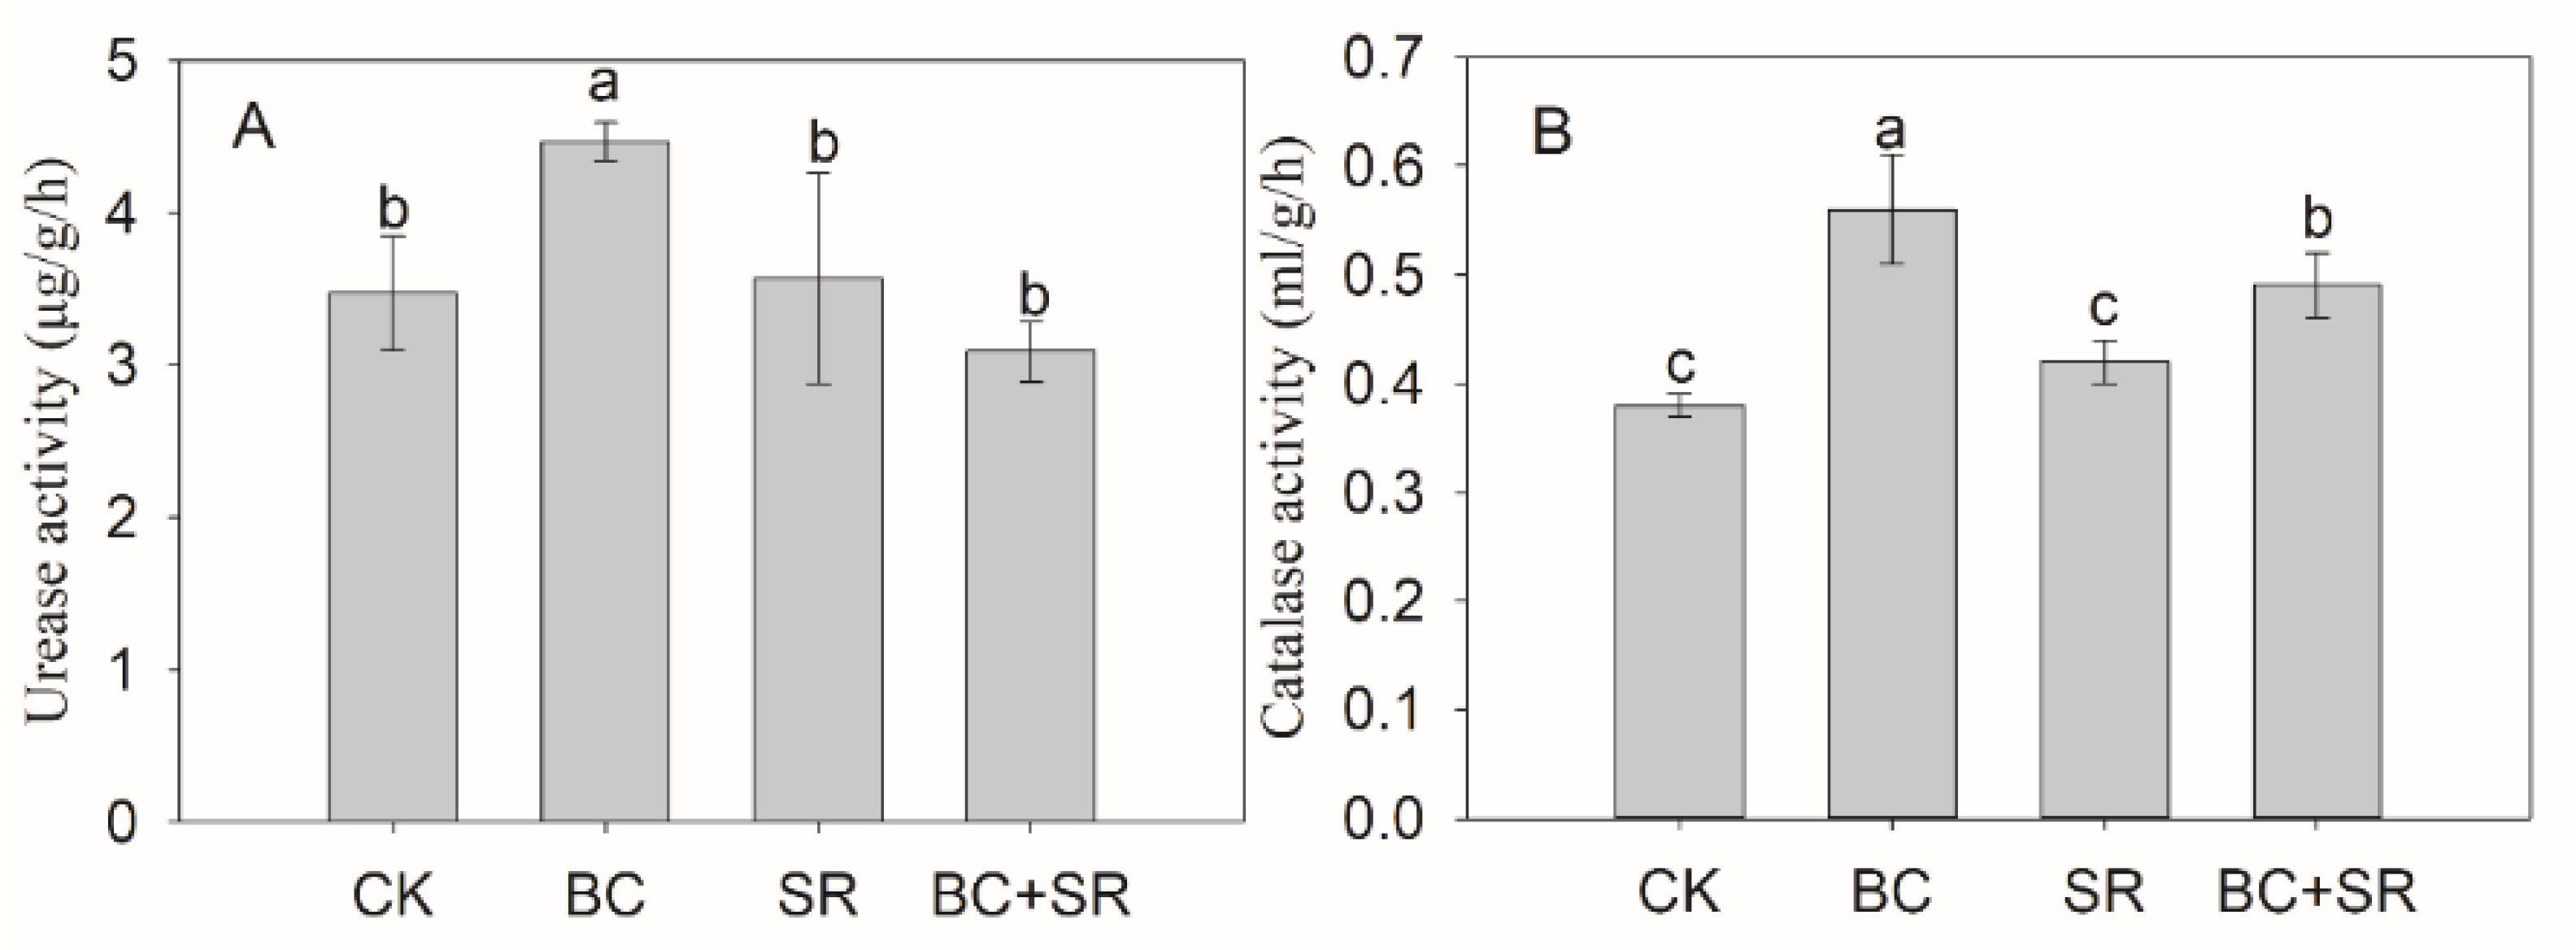
The BC treatment exhibited the highest urease activity among treatments (p < 0.05; Figure 7A). There was no significant difference among the CK, SR, and BC + SR treatments (p > 0.05). The highest catalase activity was in the BC treatment, followed by BC + SR, SR, and CK (Figure 7B; p < 0.05). Catalase activity in SR did not differ significantly from that in CK (p > 0.05).
3.6. Correlation Analysis
Correlation analysis showed that the biomass was significantly positively correlated with glycyrrhizic acid, liquiritin, catalase, urease, oxalic acid, TN, TP, and AP and negatively correlated with soil pH (p < 0.05; Table 1). Glycyrrhizic acid and liquiritin were significantly positively correlated with urease, oxalic acid, TN, TP, and AP, and negatively correlated with soil pH (p < 0.05). Soluble sugar content was significantly affected by SWC (20–30) and oxalic acid, formic acid, SOM, and TN (p < 0.05). Soil pH negatively affected soil catalase activity and oxalic acid content (p < 0.05). The soil AP content was positively regulated by catalase and oxalic acid (p < 0.05) and negatively affected by soil pH (p < 0.05)
4. Discussion
Global climate change has induced a lack of confidence regarding grain production [21]. Several measurements have been performed to maintain grain yield. Biochar has been found to increase soil enzyme activity and SWC, although the opposite results have also been reported [22,23,24]. However, several results have been achieved in the same year of biochar application, and without crop rotation [4,25]. In the present study, although the experiment was conducted after two years of foxtail millet cultivation, the addition of soft rocks and biochar (BC + SR) to sandy soil significantly increased the licorice biomass. Increased soil enzyme activity and decreased SWC of topsoil were observed in the biochar treatment (BC). Soft rocks have been found to increase soil enzyme activity and SWC. The results showed the different mechanisms involved in improved biomass production resulting from soft rock and biochar application. This study demonstrates that the single addition of soft rocks and biochar could be used as novel soil conditioners in sandy soil to obtain sustainable agricultural development.
4.1. Effects of Soft Rocks and Biochar on SWC in Topsoil
In this study, an increase in SWC was found in BC, whereas the BC treatment significantly decreased the SWC of topsoil (Figure 4). Biochar has been shown to increase the soil water holding capacity in the short term [26]. Therefore, in the short term, the increased SWC may initially have been a result of effects on soil physical properties and hydrology. However, with long-term irrigation with alkaline water, soil pH may significantly increase; in this case, the higher pH would be the main reason for the decreased SWC. A previous study confirmed that acidic soils may benefit from biochar amendments more than other soils [27]. Due to their high porosity, sandy soils generally have a higher hydraulic conductivity and lower water holding capacity than finer textured soils do [28]. In the present study, under field conditions, the sandy SWC below 10 cm underground was lower than those in BC and SR treatments. This confirmed that biochar and soft rock application could increase SWC. Several previous studies have confirmed that soft rocks decrease the saturated hydraulic conductivity of soils, which increases the soil water holding capacity [4,29]. Thus, we conclude that biochar and soft rock application may increase SWC in 30 cm-deep soil.
4.2. Effect of Biochar Application on Soil Enzyme Activity
Soil enzymes have been assessed as valuable soil-health indicators; they function in nutrient cycling and improve plant growth [28,30,31]. Biochar has been shown to enhance soil enzyme activity [31]. The results of the present study confirm that biochar and soft rocks significantly increased catalase activity, and that biochar significantly increased urease activity (Figure 7), which is consistent with the results of a previous study [32]. Soil urease participates in hydrolysis of nitrogen-containing organic matter and increases the soil AN content; it is a reliable indicator of the soil nitrogen content [33]. In the present study, urease activity was negatively affected by SWC (Table 1). The main reason for this may be that SWC significantly affected microbial activity [34] and that microbial activity subsequently affected urease activity. Catalase is considered an indicator of aerobic microorganisms, reflects the redox ability in soils, and is closely related to soil fertilizer [33,35]. Moreover, high pH has a significant influence on catalase activity. In the present study, the lower pH in biochar and soft rock treatments may have induced the higher catalase activity. This could be because lower pH creates a suitable growth environment for microorganisms and further leads to an increase in microbial biomasses and enzymatic activities [36]. In addition, the increased organic matter input provides a large amount of raw material for microbial growth and enzyme synthesis, which results in an improvement in the biological activities of the soil [37]. However, here, there was no significant correlation between organic matter and both soil enzyme activity. We thought the main reason was that the organic matter content was too low.
4.3. Soil Amendment Effect on Soil AP Content
In general, a series of complex chemical reactions occur in plant‒soil complexes. For example, plants take up mineral elements from soils and produce secondary metabolites (e.g., organic acids), which modify the rhizosphere microenvironment [38]. In the present study, the rhizosphere soil of licorice in the biochar and soft rock treatments had a higher soil AP than CK did. Correlation analyses showed that the AP was positively affected by oxalic acid (p < 0.05) and negatively affected by soil pH (p < 0.05). Oxalic acid affects the release of soil p [39,40]. In previous studies, decreases in rhizosphere soil pH were found to contribute to increases in the rhizosphere soil AP concentration [41,42]. Thus, it can be concluded that the decreased pH in the rhizosphere soil of licorice induced by high oxalic acid contents contributed to the high AP content in biochar and soft rock treatments in the present study.
4.4. Effects of Biochar and Soft rocks on Licorice Yield and Quality
Biochar and soft rocks have been found to improve grain yield in several studies [4,7,29]. In the present study, after application of biochar and soft rocks for two years, beneficial stimulation was detected in licorice (Figure 1). Correlation analyses showed that the increased yield was significantly affected by urease, oxalic acid, pH, and soil AP (Table 1). This confirms that biochar and soft rocks could continuously improve soil fertility. In a previous study, biochar enhanced the grain yield, mainly by improving the soil environment [43]. Glycyrrhizic acid and liquiritin contents are important indices for measuring licorice quality, and biochar and soft rocks significantly increased the contents of these two substances in the present study. These results showed that the application of biochar and soft rocks for two years could increase both licorice yield and quality.
5. Conclusions
Our results are consistent with those of a previous study that showed that biochar and soft rock application could increase grain yield and improve the soil environment. Moreover, our findings show that the addition of biochar and soft rocks for two years could increase soil organic acid contents, especially those of oxalic acid, which function to reduce soil pH and increase the soil AP content. The improved soil nutrient status played an important role in enhancing licorice yield and quality. This study demonstrates the potential for soft rocks to be used as an amendment to improve soil properties and grain yield in the Mu Us Sandy Land.
Supplementary Materials
The following are available online at https://www.mdpi.com/article/10.3390/agronomy11081502/s1, Table S1: Primary soil properties in the study site.
Author Contributions
Conceptualization, J.Y. and P.L.; methodology formal analysis, investigation, data curation, J.Y.; writing—original draft preparation, J.Y.; writing—review and editing, P.L supervision, J.Y.; project administration, J.Y.; funding acquisition, J.Y. All authors have read and agreed to the published version of the manuscript.
Funding
This research was funded by the Key laboratory of Degraded and Unused Land Consolidation Engineering, the Ministry of Land and Resources SXDJ2018-07 and SXDJ2018-08, the Science and Technology Program of Yulin Science and Technology Bureau 2018-2-50, a PhD Research Start-up Fund from Yulin University 17GK19 and 17GK18, and the Key Research and Development Program of Shaanxi Province 2019TSLNY03-1.
Institutional Review Board Statement
Not Applicable.
Informed Consent Statement
Not Applicable.
Data Availability Statement
The data could be obtained from the corresponding author.
Acknowledgments
We gratefully acknowledge help from students from Yulin University for their assistance in data collecting.
Conflicts of Interest
The authors declare no conflict of interest. The funders had no role in the design of the study; in the collection, analyses, or interpretation of data; in the writing of the manuscript, or in the decision to publish the results.
References
- Liu, Y.; Li, Y. Revitalize the world’s countryside. Nature 2017, 548, 275–277. [Google Scholar] [CrossRef]
- Sultana, N.; Ikeda, T.; Kashem, M.A. Effect of foliar spray of nutrient solutions on photosynthesis, dry matter accumulation and yield in seawater-stressed rice. Environ. Exp. Bot. 2001, 46, 129–140. [Google Scholar] [CrossRef]
- Yang, Y.; Hasi, E.; Sun, B.; Huishi, D.U.; Zhao, Y. Effects of Vegetation Restoration in Different Types on Soil Nutrients in Southern Edge of Mu Us Sandy Land. Agric. Sci. Technol. 2012, 13, 1708–1712. [Google Scholar]
- Sun, Y.; Zhang, N.; Yan, J.; Zhang, S. Effects of Soft Rock and Biochar Applications on Millet (Setaria italica L.) Crop Performance in Sandy Soil. Agronomy 2020, 10, 669. [Google Scholar] [CrossRef]
- Zhang, H.; Guo, Z.; Li, J.; Lu, Y.; Xu, Y. Improvement of aeolian sandy soil in Mu Us, China with soft montmorillonite clay stone. Agron. J. 2021. [Google Scholar] [CrossRef]
- Han, J.C.; Liu, Y.S.; Luo, L.T. Research on the Core Technology of Remixing Soil by Soft Rock and Sand in the Maowusu Sand Land Region. China Land Sci. 2012, 26, 87–94. [Google Scholar]
- Sun, Z.; Han, J. Effect of soft rock amendment on soil hydraulic parameters and crop performance in Mu Us Sandy Land, China. Field Crops Res. 2018, 222, 85–93. [Google Scholar] [CrossRef]
- Wang, P.; Xiong, X.; Lei, Y.; Tang, L.; Liu, M.; Nie, X.; Hu, X. Research Advances in Soil-borne Potato Diseases. Chin. Potato J. 2014, 28, 111–116. [Google Scholar]
- Chen, Q.; Liu, Z.; Zhou, J.; Xu, X.; Zhu, Y. Long-term straw mulching with nitrogen fertilization increases nutrient and microbial determinants of soil quality in a maize—Wheat rotation on China’s Loess Plateau. Sci. Total Environ. 2021, 775, 145930. [Google Scholar] [CrossRef]
- Jiang, R.; Yang, J.Y.; Drury, C.F.; He, W.; Smith, W.N.; Grant, B.B.; He, P.; Zhou, W. Assessing the impacts of diversified crop rotation systems on yields and nitrous oxide emissions in Canada using the DNDC model. Sci. Total Environ. 2021, 759, 143433. [Google Scholar] [CrossRef]
- Agomoh, I.V.; Drury, C.F.; Yang, X.; Phillips, L.A.; Reynolds, W.D. Crop rotation enhances soybean yields and soil health indicators. Soil Sci. Soc. Am. J. 2021. [Google Scholar] [CrossRef]
- Hou, N.; Huang, J.; Geng, D.; Wang, N.; Yang, P.; Zhao, S. Compositions and metabolic footprints of soil nematode communities under different alfalfa-crop planting patterns in semi-arid region of the Loess Plateau, Northwest China. Chin. J. Appl. Ecol. 2021, 32, 1825–1834. [Google Scholar] [CrossRef]
- Hosseini, M.S.; Samsampour, D.; Ebrahimi, M.; Abadía, J.; Najafabadi, A.S.; Igartua, E.; Khanahmadi, M. Evaluation of glycyrrhizin contents in licorice (Glycyrrhiza glabra L.) under drought and soil salinity conditions using nutrient concentrations and biochemical traits as biomarkers. Acta Physiol. Plant. 2020, 42, 103. [Google Scholar] [CrossRef]
- Zhang, W.; Xie, Z.; Wang, L.; Li, M.; Lang, D.; Zhang, X. Silicon alleviates salt and drought stress of Glycyrrhiza uralensis seedling by altering antioxidant metabolism and osmotic adjustment. J. Plant Res. 2017, 130, 611–624. [Google Scholar] [CrossRef] [PubMed]
- Cheng, M.; Li, Y.; Chi, X.; Li, X.; Yang, G. Analysis on international trade competitiveness of licorice extract. Chin. Tradit. Herb. Drugs 2020, 51, 1970–1976. [Google Scholar]
- Li, A.; Zhang, M.; Chen, Y.; Sun, H.; Wu, Y.; Yan, L. Effects of Glycyrrhiza Uralensis Plantation on Soil Texture and Contents of soil Carbon and Nitrogen in Wind Erosion Region of Northwest China. J. Soil Water Conserv. 2016, 30, 286–290. [Google Scholar]
- Alagawany, M.; Elnesr, S.S.; Farag, M.R.; El-Hack, M.E.A.; Khafaga, A.F.; Taha, A.E.; Tiwari, R.; Yatoo, M.I.; Bhatt, P.; Marappan, G.; et al. Use of Licorice (Glycyrrhiza glabra) Herb as a Feed Additive in Poultry: Current Knowledge and Prospects. Animals 2019, 9, 536. [Google Scholar] [CrossRef] [PubMed] [Green Version]
- Pan, Y.; Nie, C.; Zhang, W.; Liu, Y. Effect of feeding different proportions of licorice stem and leaves to substitute roughage made by the fully mixed pellet feed on growth performance, blood index and immune index of Bashbah sheep. J. Shihezi Univ. Nat. Sci. 2018, 36, 705–711. [Google Scholar]
- Chen, D.; Wang, S.; Xiong, B.; Cao, B.; Deng, X. Carbon/Nitrogen Imbalance Associated with Drought-Induced Leaf Senescence in Sorghum bicolor. PLoS ONE 2015, 10, e0137026. [Google Scholar] [CrossRef] [PubMed]
- Bao, S. Soil Agrochemical Analysis; China Agriculture Press: Beijing, China, 2010. [Google Scholar]
- Trenberth, K.E.; Dai, A.; van der Schrier, G.; Jones, P.D.; Barichivich, J.; Briffa, K.R.; Sheffield, J. Global warming and changes in drought. Nat. Clim. Chang. 2013, 4, 17–22. [Google Scholar] [CrossRef]
- Lehmann, J.; Gaunt, J.; Rondon, M. Bio-char Sequestration in Terrestrial Ecosystems—A Review. Mitig. Adapt. Strateg. Glob. Chang. 2006, 11, 403–427. [Google Scholar] [CrossRef]
- Bailey, V.L.; Fansler, S.J.; Smith, J.L.; Bolton, H. Reconciling apparent variability in effects of biochar amendment on soil enzyme activities by assay optimization. Soil Biol. Biochem. 2011, 43, 296–301. [Google Scholar] [CrossRef]
- Song, X.; Razavi, B.S.; Ludwig, B.; Zamanian, K.; Zang, H.; Kuzyakov, Y.; Dippold, M.A.; Gunina, A. Combined biochar and nitrogen application stimulates enzyme activity and root plasticity. Sci. Total Environ. 2020, 735, 139393. [Google Scholar] [CrossRef] [PubMed]
- Song, D.; Chen, L.; Zhang, S.; Zheng, Q.; Ullah, S.; Zhou, W.; Wang, X. Combined biochar and nitrogen fertilizer change soil enzyme and microbial activities in a 2-year field trial. Eur. J. Soil Biol. 2020, 99, 103212. [Google Scholar] [CrossRef]
- Karhu, K.; Mattila, T.; Bergström, I.; Regina, K. Biochar addition to agricultural soil increased CH4 uptake and water holding capacity—Results from a short-term pilot field study. Agric. Ecosyst. Environ. 2011, 140, 309–313. [Google Scholar] [CrossRef]
- Burrell, L.D.; Zehetner, F.; Rampazzo, N.; Wimmer, B.; Soja, G. Long-term effects of biochar on soil physical properties. Geoderma 2016, 282, 96–102. [Google Scholar] [CrossRef]
- Zhang, N.; Yan, J.; Liu, P. Effect of Bacterial Manure on the Properties of Complex Soil and Growth of Ryegrass. Agronomy 2021, 11, 568. [Google Scholar] [CrossRef]
- Sun, Z.; Han, J.; Wang, H. Soft rock for improving crop yield in sandy soil in the Mu Us desert, China. Arid Land Res. Manag. 2019, 33, 136–154. [Google Scholar]
- Jorge, P.F. Biochar modifies the thermodynamic parameters of soil enzyme activity in a tropical soil. J. Soils Sediments 2015, 15, 578–583. [Google Scholar]
- Kaurin, A.; Cernilogar, Z.; Lestan, D. Revitalisation of metal-contaminated, EDTA-washed soil by addition of unpolluted soil, compost and biochar: Effects on soil enzyme activity, microbial community composition and abundance. Chemosphere 2018, 193, 726–736. [Google Scholar] [CrossRef]
- Yao, T.; Zhang, W.; Gulaqa, A.; Cui, Y.; Zhou, Y.; Weng, W.; Wang, X.; Liu, Q.; Jin, F. Effects of Peanut Shell Biochar on Soil Nutrients, Soil Enzyme Activity, and Rice Yield in Heavily Saline-Sodic Paddy Field. J. Soil Sci. Plant Nut. 2021, 21, 655–664. [Google Scholar] [CrossRef]
- Li, Y.; Huang, L.; Zhang, H.; Wang, M.; Liang, Z. Assessment of Ammonia Volatilization Losses and Nitrogen Utilization during the Rice Growing Season in Alkaline Salt-Affected Soils. Sustainability 2017, 9, 132. [Google Scholar] [CrossRef] [Green Version]
- Gömöryová, E.; Střelcová, K.; Škvarenina, J.; Gömöry, D. Responses of soil microorganisms and water content in forest floor horizons to environmental factors. Eur. J. Soil Biol. 2013, 55, 71–76. [Google Scholar] [CrossRef]
- Ogunkunle, C.O.; Falade, F.O.; Oyedeji, B.J.; Akande, F.O.; Vishwakarma, V.; Alagarsamy, K.; Ramachandran, D.; Fatoba, P.O. Short-Term Aging of Pod-Derived Biochar Reduces Soil Cadmium Mobility and Ameliorates Cadmium Toxicity to Soil Enzymes and Tomato. Environ. Toxicol. Chem. 2021. [Google Scholar] [CrossRef] [PubMed]
- Zhang, W.; Qiao, W.; Gao, D.; Dai, Y.; Deng, J.; Yang, G.; Han, X.; Ren, G. Relationship between soil nutrient properties and biological activities along a restoration chronosequence of Pinus tabulaeformis plantation forests in the Ziwuling Mountains, China. Catene 2018, 161, 85–95. [Google Scholar] [CrossRef]
- Lucas-Borja, M.E.; Hedo, J.; Cerdá, A.; Candel-Pérez, D.; Viñegla, B. Unravelling the importance of forest age stand and forest structure driving microbiological soil properties, enzymatic activities and soil nutrients content in Mediterranean Spanish black pine (Pinus nigra Ar. ssp. salzmannii) Forest. Sci. Total Environ. 2016, 562, 145–154. [Google Scholar] [CrossRef] [PubMed]
- Kulmatiski, A.; Beard, K.H.; Stevens, J.R.; Stephanie, M.C. Plant–soil feedbacks: A meta-analytical review. Ecol. Lett. 2010, 11, 980–992. [Google Scholar] [CrossRef]
- Liang, Y.; Huang, Y.; Meng, F.; Zhu, Y. Effect of organic acids on the activation of phosphorus in vegetable garden soils. Acta Ecol. Sin. 2005, 25, 1171–1177. [Google Scholar]
- Schneider, K.; van Straaten, P.; Heidinger, R.M.D.; Glasauer, S.; Trevors, J.; Fallow, D.; Smith, P.S. Comparing phosphorus mobilization strategies using Aspergillus niger for the mineral dissolution of three phosphate rocks. J. Appl. Microbiol. 2010, 108, 366–374. [Google Scholar] [CrossRef]
- Zhang, D.S.; Wang, Y.Y.; Tang, L.; Zheng, Y.; Zuo, J. Effects of wheat and fababean intercropping on available phosphorus of red soils and its relationship with rhizosphere soil pH. Plant Nutr. Fertil. Sci. 2013, 19, 131–137. [Google Scholar]
- Wuest, S.B. Seasonal Variation in Soil Bulk Density, Organic Nitrogen, Available Phosphorus, and pH. Soil Sci. Soc. Am. J. 2015, 79, 1188–1197. [Google Scholar] [CrossRef]
- Sun, H.; Dan, A.; Feng, Y.; Vithanage, M.; Mandal, S.; Shaheen, S.M.; Rinklebe, J.; Shi, W.; Wang, H. Floating duckweed mitigated ammonia volatilization and increased grain yield and nitrogen use efficiency of rice in biochar amended paddy soils. Chemosphere 2019, 237, 124532. [Google Scholar] [CrossRef] [PubMed]
Figure 1.
Effect of different soil types on licorice yield. CK, sand only; BC, biochar; SR, sand and soft rock; BC + SR, sand, biochar, and soft rock. Data are shown in mean ± SD. Different letters indicate significant differences (p < 0.05).
Figure 1.
Effect of different soil types on licorice yield. CK, sand only; BC, biochar; SR, sand and soft rock; BC + SR, sand, biochar, and soft rock. Data are shown in mean ± SD. Different letters indicate significant differences (p < 0.05).
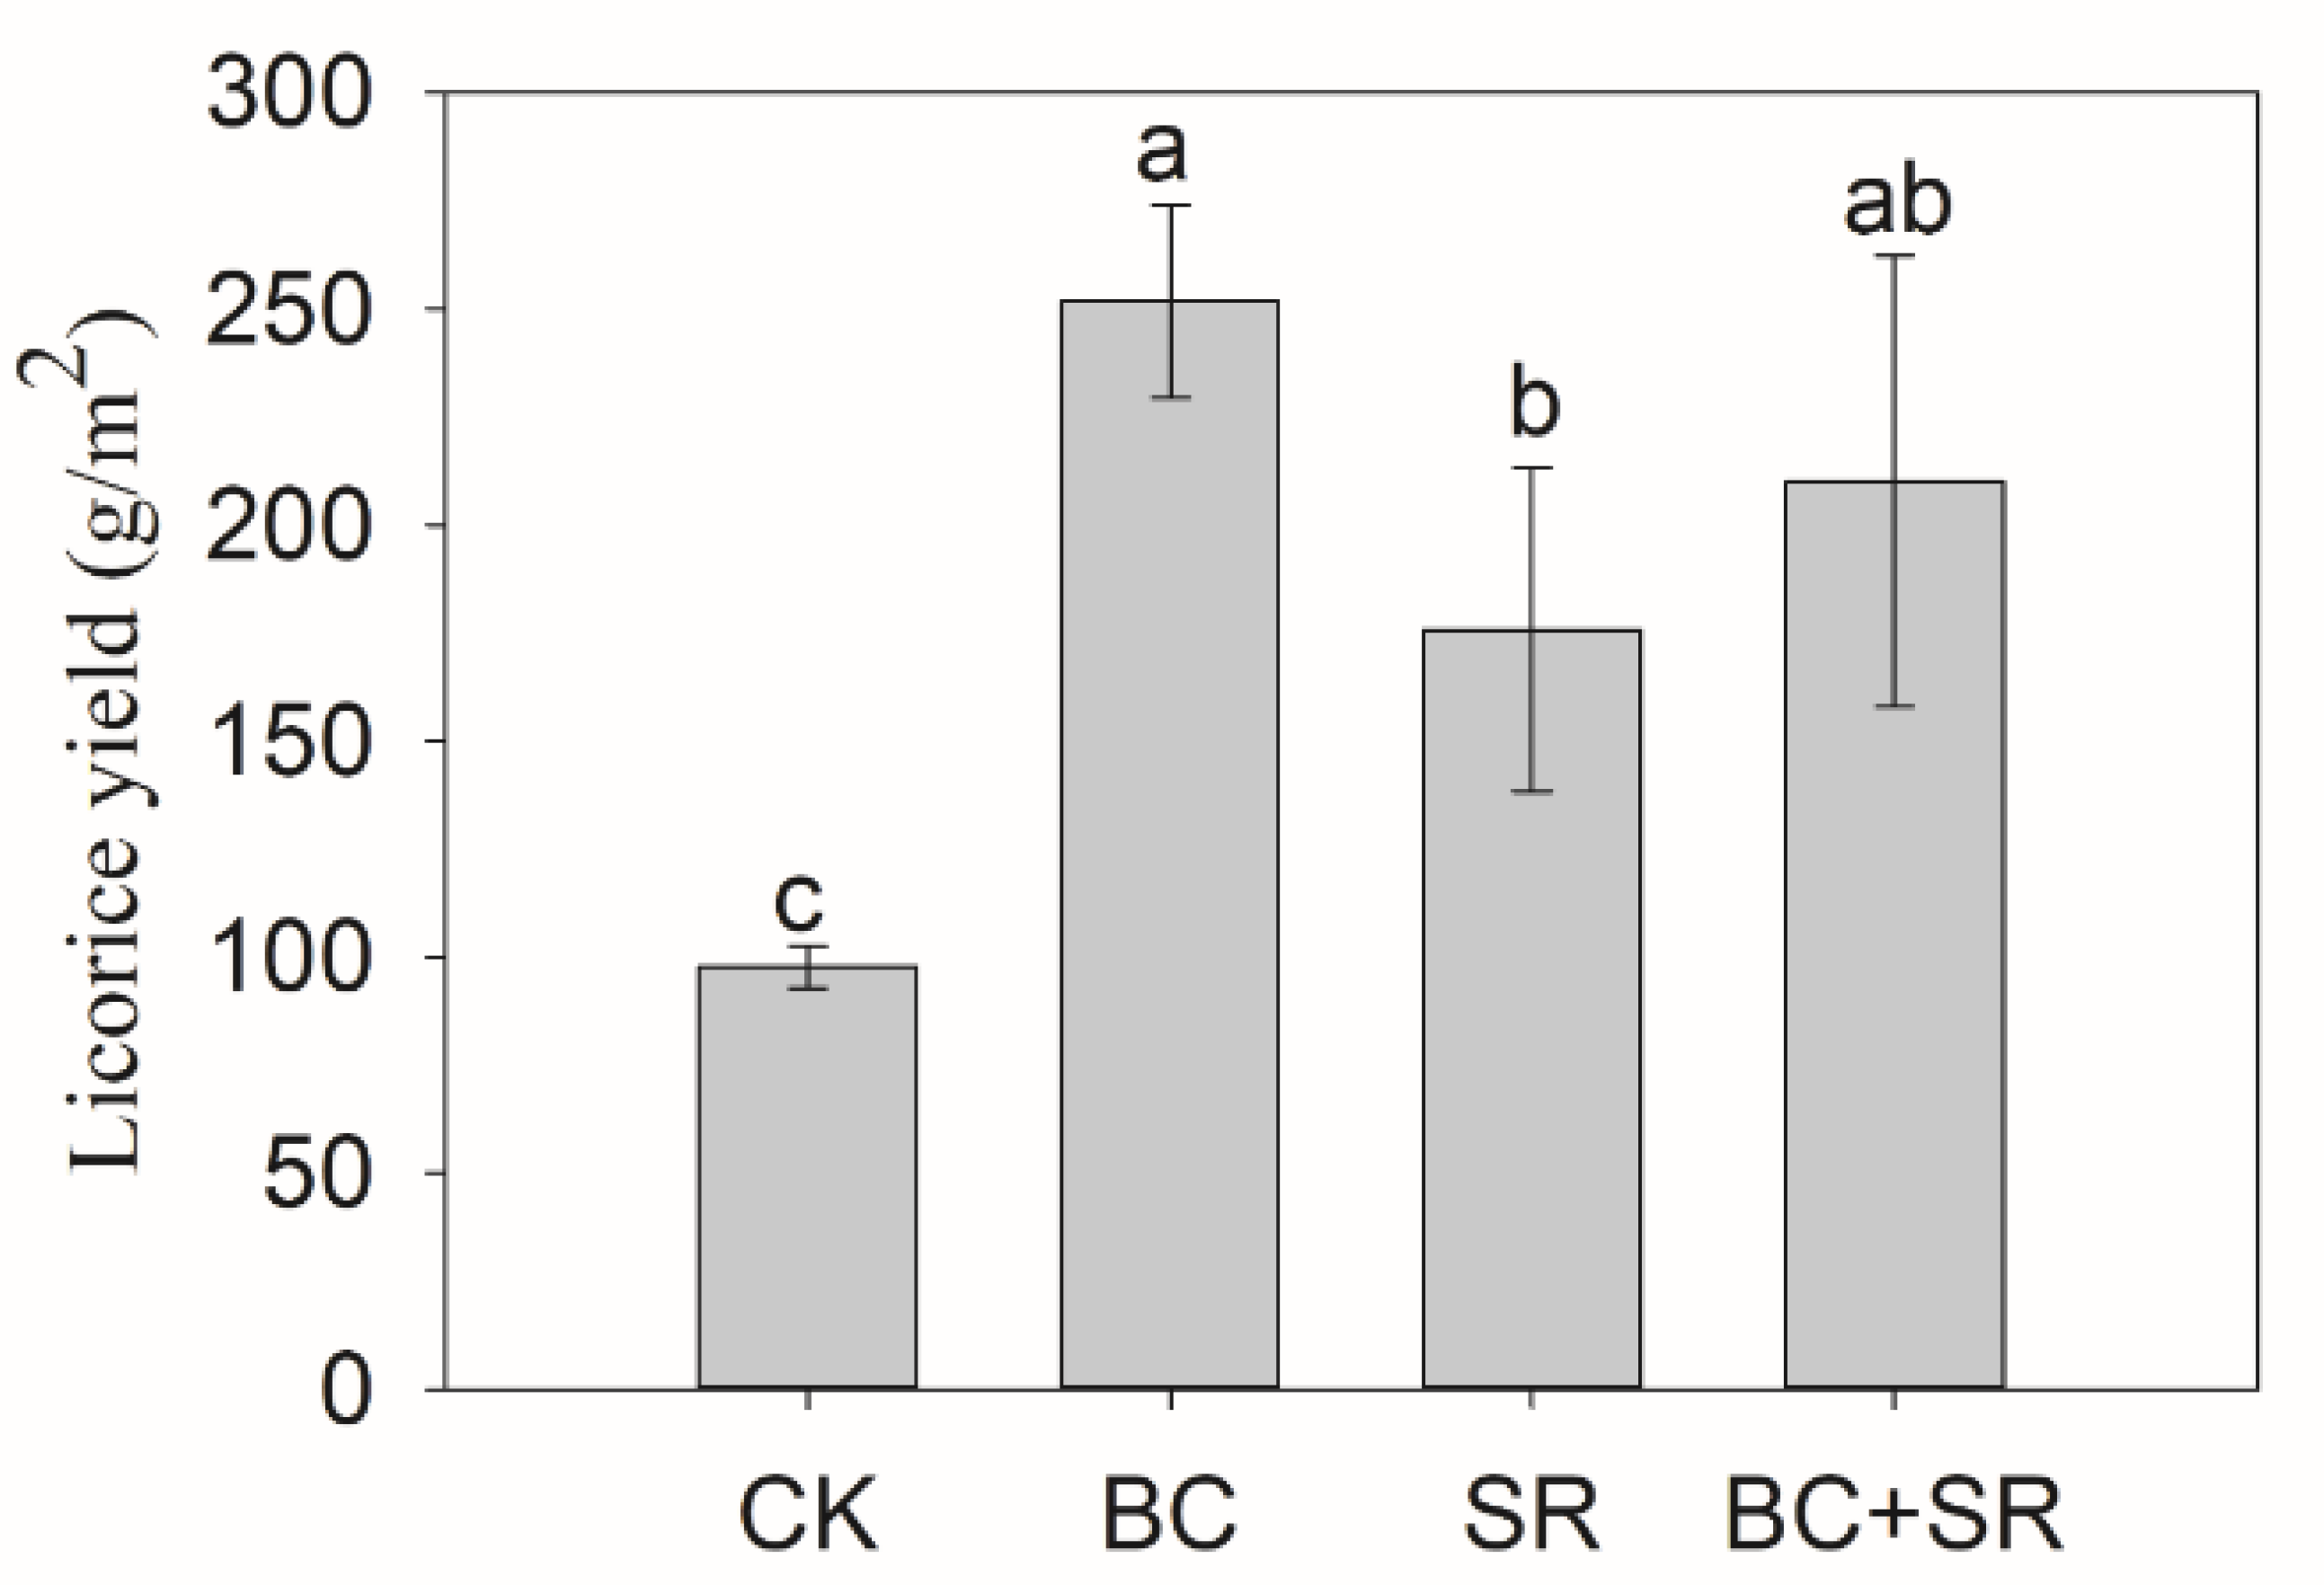
Figure 2.
Effect of different soil types on liquiritin (A) and glycyrrhizic acid (B). CK, sand only; BC, biochar; SR, sand and soft rock; BC + SR, sand, biochar, and soft rock. Data are shown in mean ± SD. Different letters indicate significant differences (p < 0.05).
Figure 2.
Effect of different soil types on liquiritin (A) and glycyrrhizic acid (B). CK, sand only; BC, biochar; SR, sand and soft rock; BC + SR, sand, biochar, and soft rock. Data are shown in mean ± SD. Different letters indicate significant differences (p < 0.05).
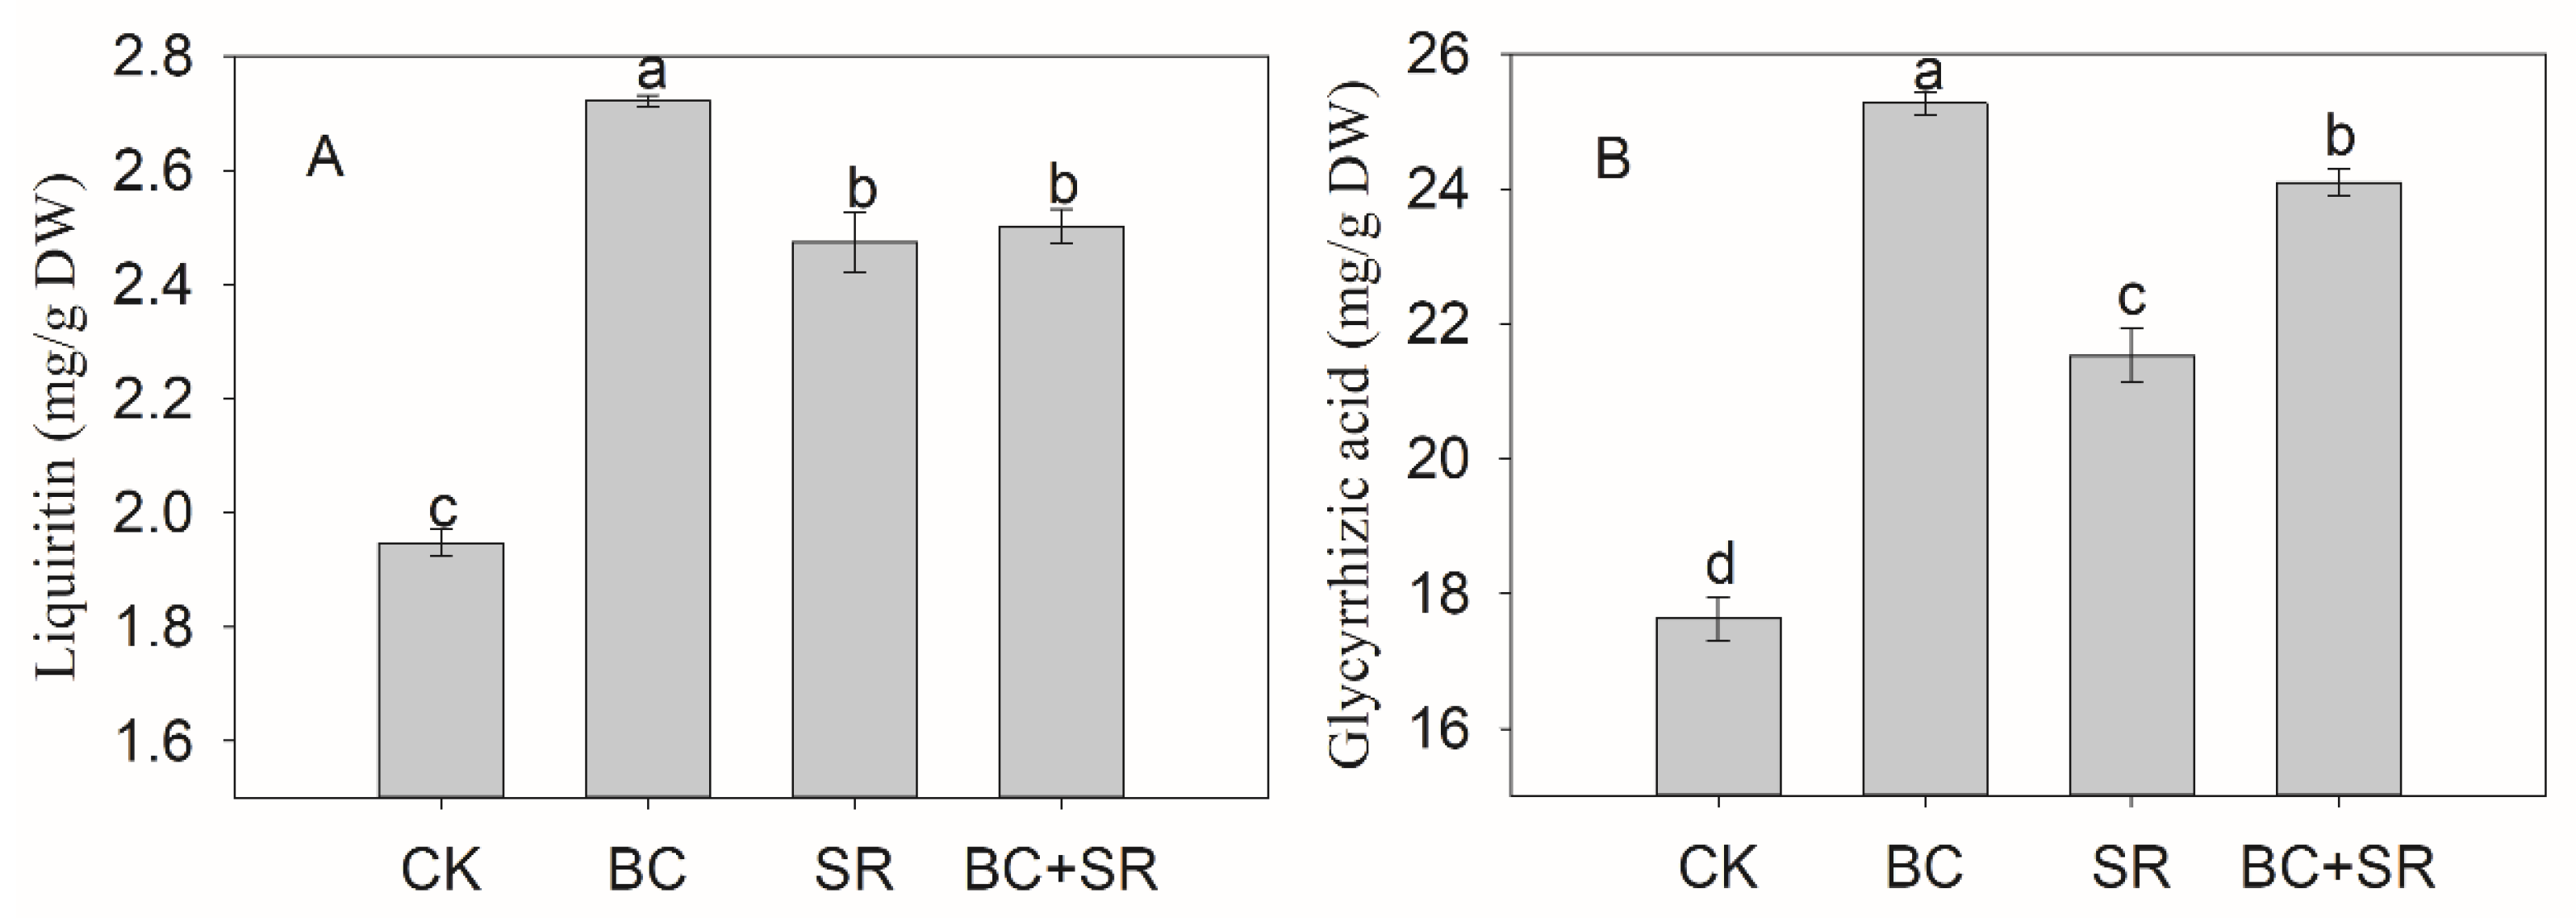
Figure 3.
Effect of different soil types on soluble sugar (A) and starch (B). CK, sand only; BC, biochar; SR, sand and soft rock; BC + SR, sand, biochar, and soft rock. Data are shown in mean ± SD. Different letters indicate significant differences (p < 0.05).
Figure 3.
Effect of different soil types on soluble sugar (A) and starch (B). CK, sand only; BC, biochar; SR, sand and soft rock; BC + SR, sand, biochar, and soft rock. Data are shown in mean ± SD. Different letters indicate significant differences (p < 0.05).

Figure 4.
Effect of different soil types on soil water content (A) and soil pH (B). CK, sand only; BC, biochar; SR, sand and soft rock; BC + SR, sand, biochar, and soft rock. Data are shown in mean ± SD. Different letters indicate significant differences (p < 0.05).
Figure 4.
Effect of different soil types on soil water content (A) and soil pH (B). CK, sand only; BC, biochar; SR, sand and soft rock; BC + SR, sand, biochar, and soft rock. Data are shown in mean ± SD. Different letters indicate significant differences (p < 0.05).
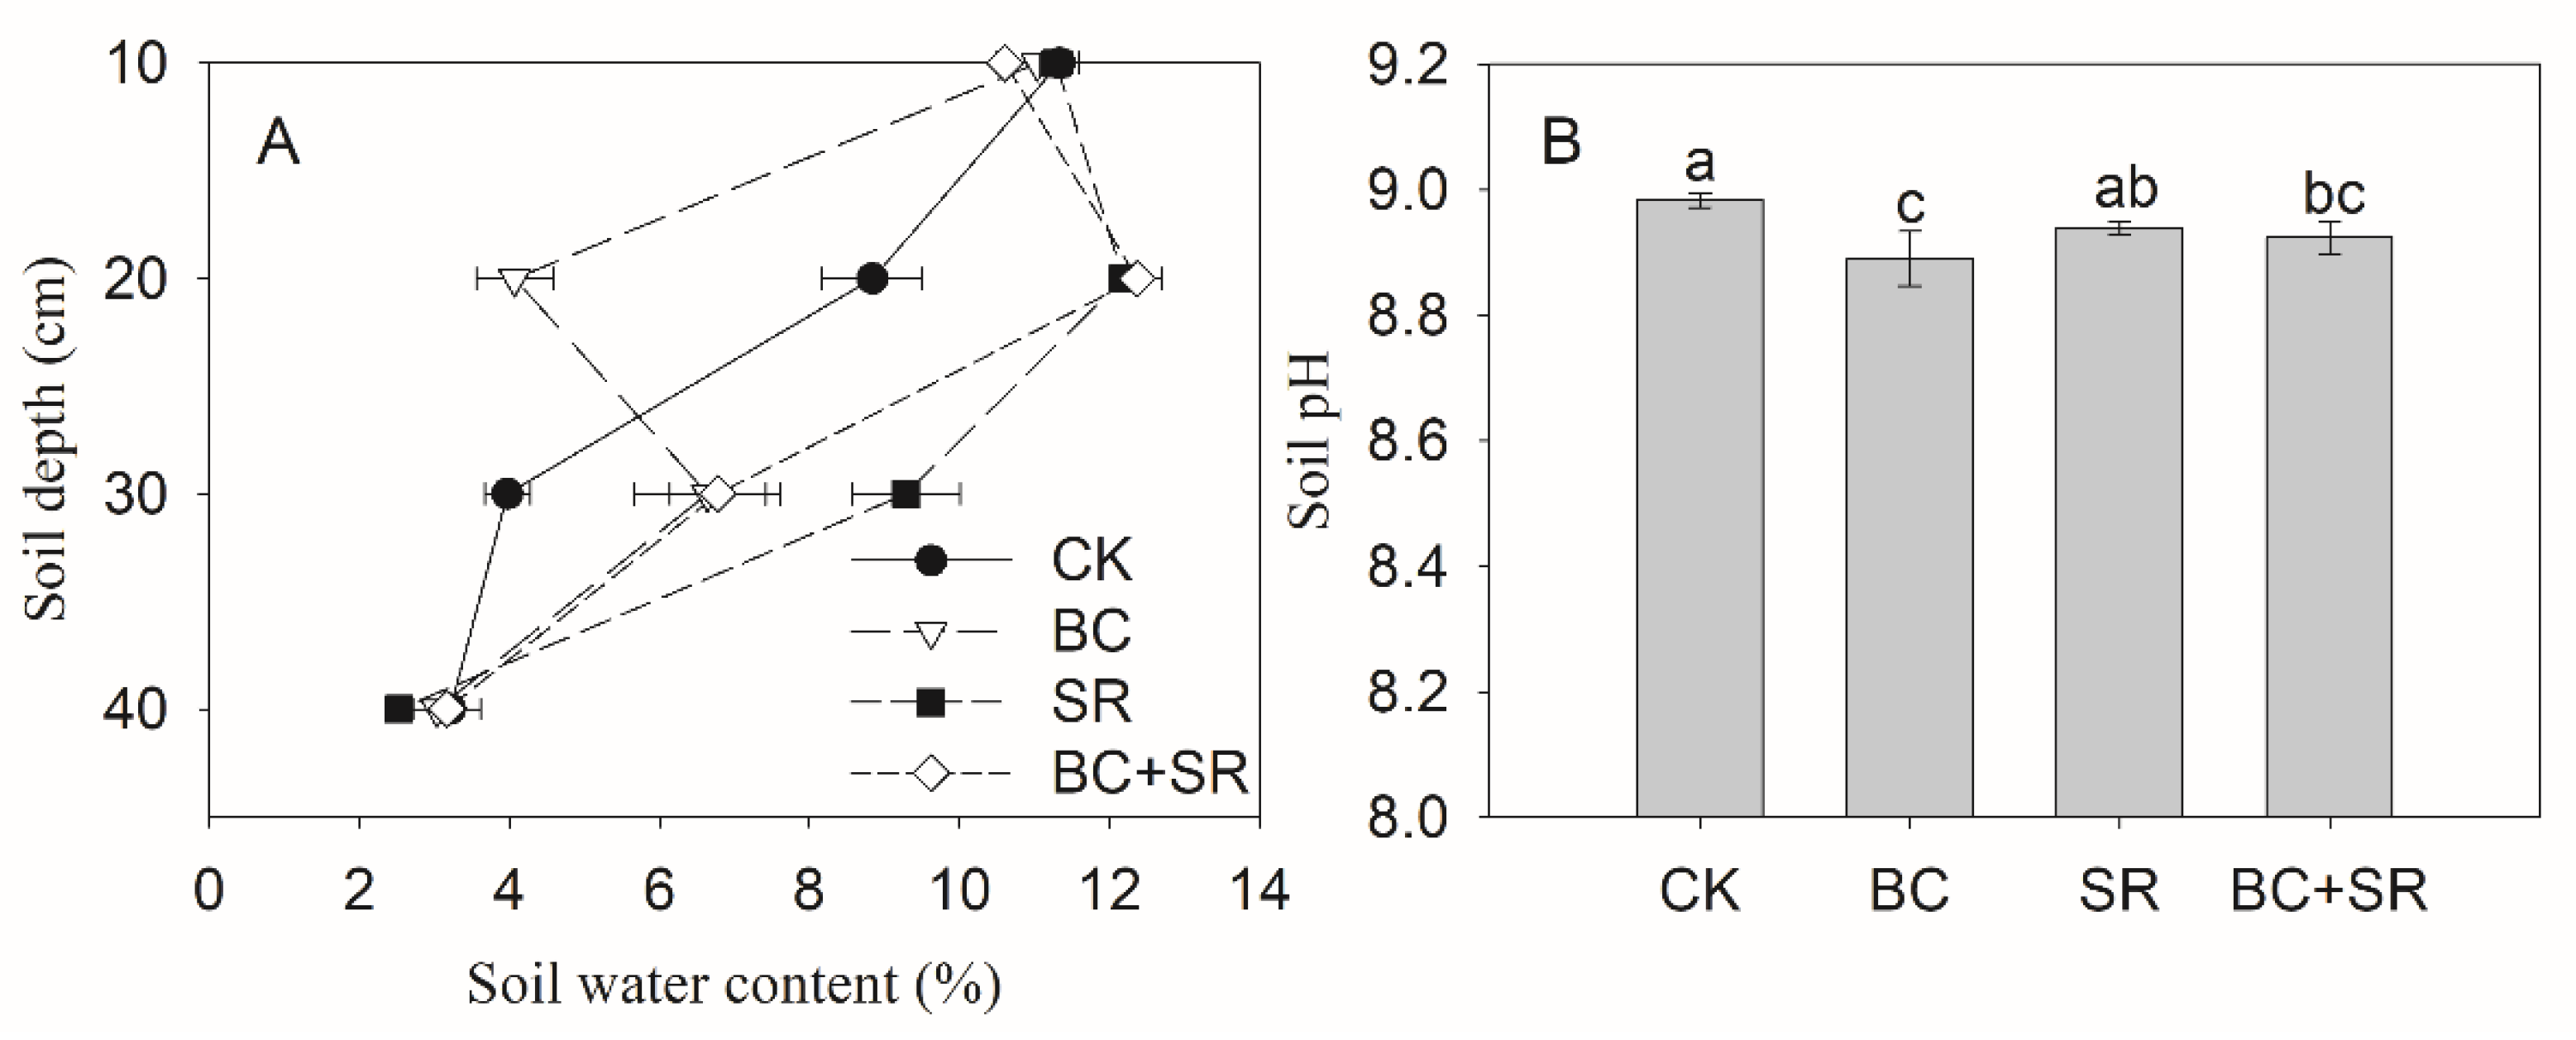
Figure 5.
Effect of different soil types on soil organic matter (A), total nitrogen (B), available nitrogen (C,D), total phosphorus (E), and available phosphorus (F). CK, sand only; BC, biochar; SR, sand and soft rock; BC + SR, sand, biochar, and soft rock. Data are shown in mean ± SD. Different letters indicate significant differences (p < 0.05).
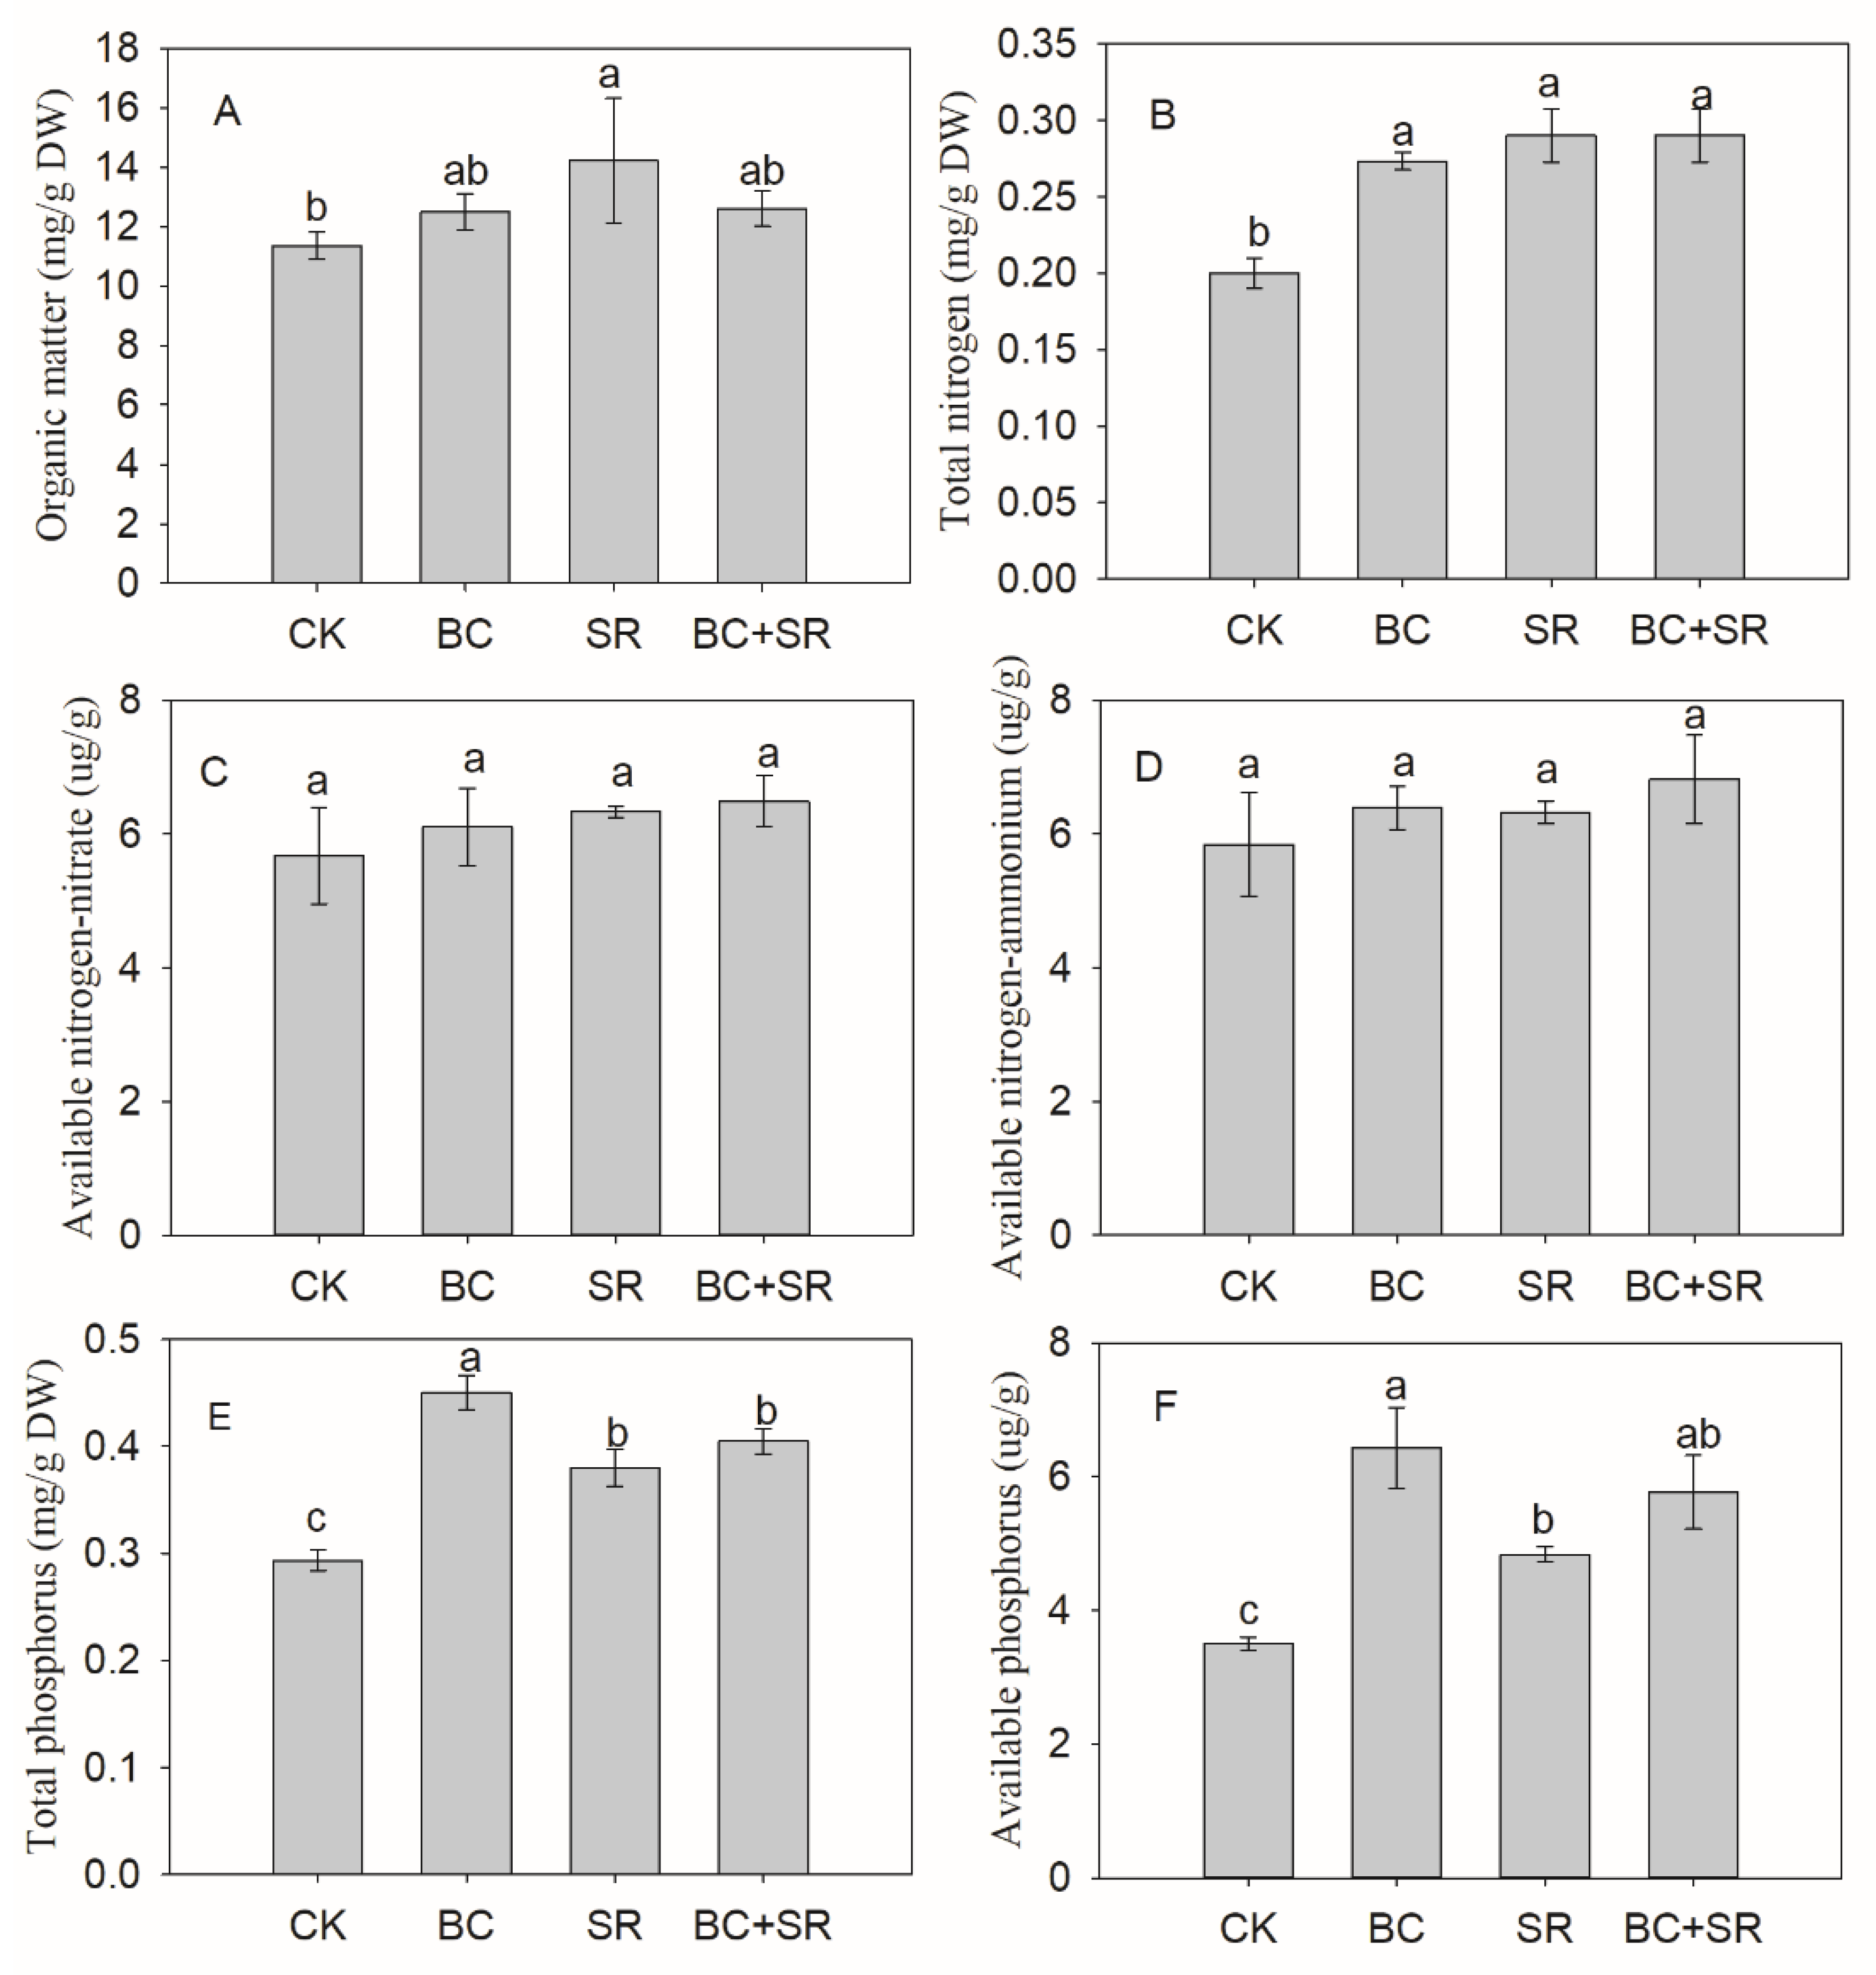
Figure 6.
Effect of different soil types on soil oxalic acid (A), tartaric acid (B), and formic acid (C). CK, sand only; BC, biochar; SR, sand and soft rock; BC + SR, sand, biochar, and soft rock. Data are shown in mean ± SD. Different letters indicate significant differences (p < 0.05).
Figure 6.
Effect of different soil types on soil oxalic acid (A), tartaric acid (B), and formic acid (C). CK, sand only; BC, biochar; SR, sand and soft rock; BC + SR, sand, biochar, and soft rock. Data are shown in mean ± SD. Different letters indicate significant differences (p < 0.05).
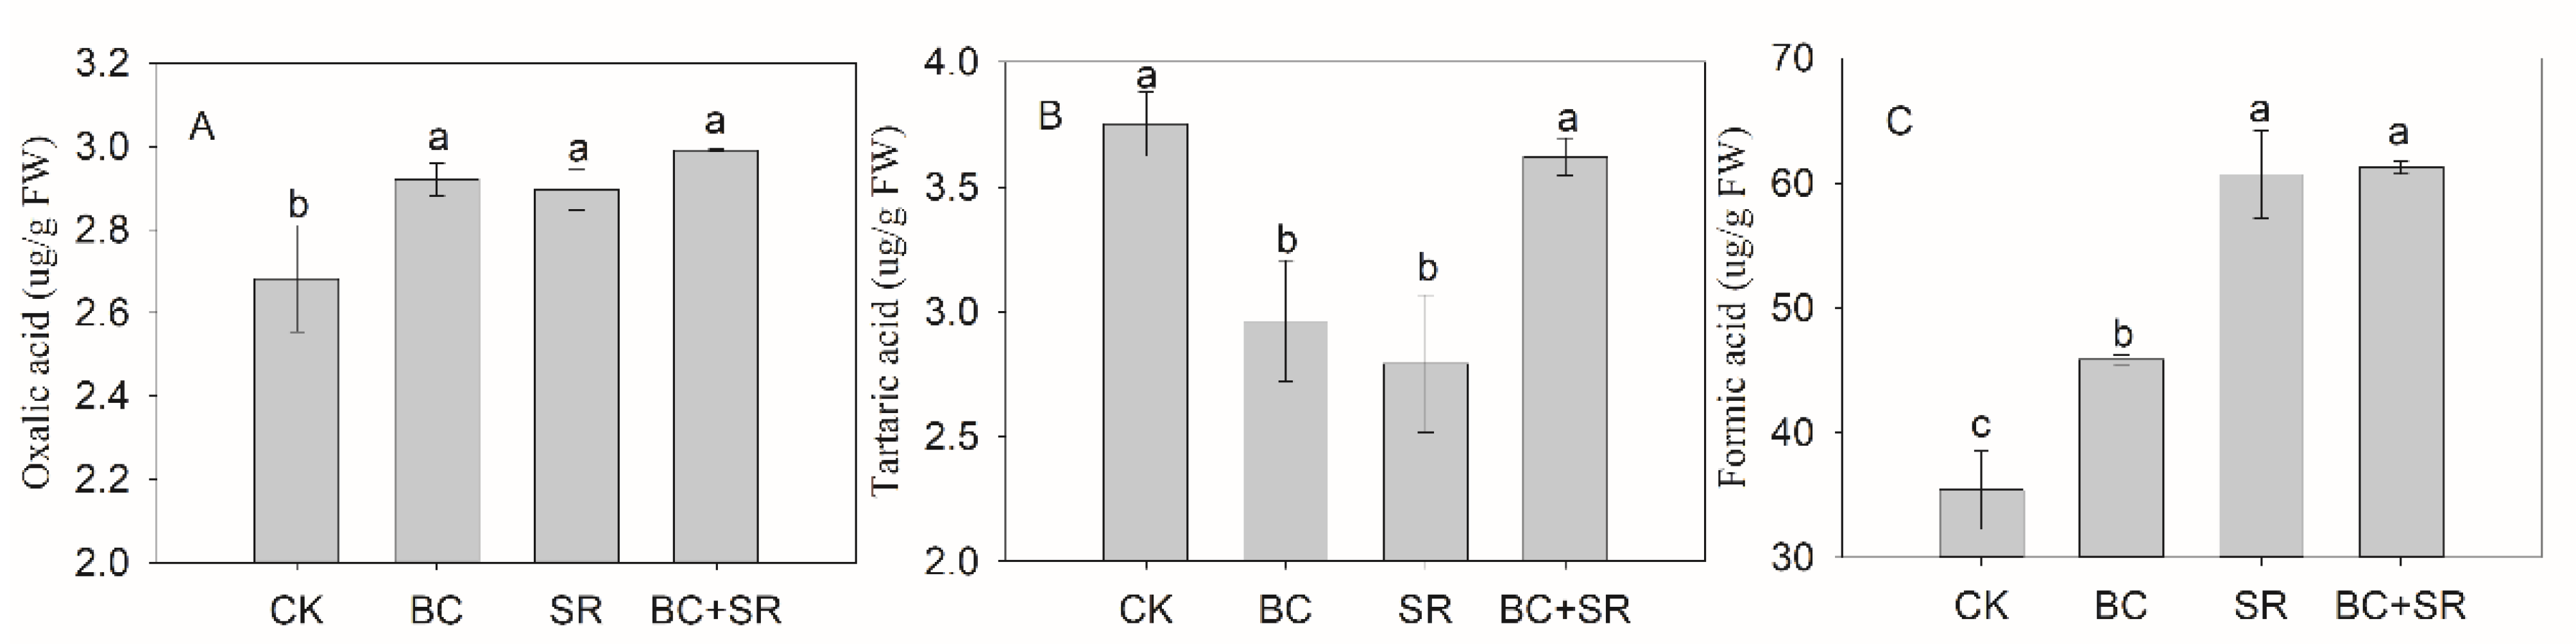
Figure 7.
Effect of different soil types on soil urease activity (A) and catalase activity (B). CK, sand only; BC, biochar; SR, sand and soft rock; BC + SR, sand, biochar, and soft rock. Data are shown in mean ± SD. Different letters indicate significant differences (p < 0.05).
Figure 7.
Effect of different soil types on soil urease activity (A) and catalase activity (B). CK, sand only; BC, biochar; SR, sand and soft rock; BC + SR, sand, biochar, and soft rock. Data are shown in mean ± SD. Different letters indicate significant differences (p < 0.05).

Table 1.
Correlations between biomass, soil properties, and licorice quality characters.
| Glycyrrhizic Acid | Liquiritin | Soluble Sugar | Starch | SWC10 | SWC20 | SWC30 | SWC40 | Catalase | Urease | Oxalic Acid | Formic Acid | pH | SOM | TN | Nitrate | Ammonium | TP | AP | |
|---|---|---|---|---|---|---|---|---|---|---|---|---|---|---|---|---|---|---|---|
| Biomass | 0.87 ** | 0.83 ** | 0.21 | 0.54 | −0.44 | −0.29 | 0.52 | −0.10 | 0.67 * | 0.60 * | 0.80 ** | 0.47 | −0.61 * | 0.39 | 0.59 * | 0.27 | 0.23 | 0.91 ** | 0.74 ** |
| glycyrrhizic acid | 0.96 ** | 0.11 | 0.53 | −0.44 | −0.46 | 0.32 | 0.01 | 0.720 ** | 0.60 * | 0.76 ** | 0.36 | −0.76 ** | 0.38 | 0.65 * | 0.27 | 0.24 | 0.94 ** | 0.77 ** | |
| liquiritin | 0.10 | 0.37 | −0.56 | −0.41 | 0.18 | 0.17 | 0.56 | 0.63 * | 0.75 ** | 0.31 | −0.645 * | 0.45 | 0.58 * | 0.19 | 0.13 | 0.88 ** | 0.61 * | ||
| soluble sugar | 0.45 | −0.27 | 0.76 ** | 0.65 * | −0.33 | −0.13 | −0.42 | 0.64 * | 0.89 ** | −0.11 | 0.66 * | 0.76 ** | 0.45 | 0.29 | 0.23 | 0.17 | |||
| starch | −0.02 | −0.01 | 0.82 ** | −0.50 | 0.730 ** | 0.19 | 0.59* | 0.599 * | −0.74 ** | 0.39 | 0.776 ** | 0.56 | 0.595 * | 0.72 ** | 0.82 ** | ||||
| SWC10 | −0.13 | −0.10 | 0.02 | −0.05 | −0.21 | −0.53 | −0.40 | 0.10 | −0.48 | −0.33 | −0.28 | −0.38 | −0.44 | −0.11 | |||||
| SWC20 | 0.36 | −0.19 | −0.54 | −0.73 ** | 0.17 | 0.625 * | 0.34 | 0.30 | 0.24 | 0.30 | 0.18 | −0.32 | −0.34 | ||||||
| SWC30 | −0.54 | 0.54 | −0.16 | 0.67 * | 0.80 ** | −0.52 | 0.30 | 0.74 ** | 0.56 | 0.56 | 0.55 | 0.64 * | |||||||
| SWC40 | −0.18 | 0.23 | −0.06 | −0.38 | −0.02 | −0.05 | −0.36 | −0.13 | −0.634 * | −0.10 | −0.52 | ||||||||
| Catalase | 0.48 | 0.47 | 0.18 | −0.85 ** | −0.01 | 0.44 | 0.36 | 0.40 | 0.80 ** | 0.83 ** | |||||||||
| Urease | 0.17 | −0.24 | −0.40 | 0.19 | 0.00 | −0.05 | −0.03 | 0.57 | 0.37 | ||||||||||
| oxalic acid | 0.804 ** | −0.58 * | 0.67 * | 0.86 ** | 0.42 | 0.25 | 0.83 ** | 0.61 * | |||||||||||
| formic acid | −0.35 | 0.59 * | 0.84 ** | 0.608 * | 0.51 | 0.50 | 0.44 | ||||||||||||
| pH | −0.12 | −0.62 * | −0.616 * | −0.45 | −0.80 ** | −0.67 * | |||||||||||||
| SOM | 0.66 * | 0.10 | 0.02 | 0.47 | 0.26 | ||||||||||||||
| TN | 0.48 | 0.46 | 0.72 ** | 0.68 * | |||||||||||||||
| nitrate | 0.725 ** | 0.41 | 0.25 | ||||||||||||||||
| ammonium | 0.37 | 0.46 | |||||||||||||||||
| TP | 0.84 ** |
Note: ** p < 0.01, * p < 0.05. Soil water content (0–10), SWC10; soil water content (10–20), SWC20; soil water content (20–30), SWC30; soil water content (30–40), SWC40; soil organic matter, SOM; soil total nitrogen, TN; soil total phosphorus, TP; soil available phosphorus, AP.
Publisher’s Note: MDPI stays neutral with regard to jurisdictional claims in published maps and institutional affiliations. |
© 2021 by the authors. Licensee MDPI, Basel, Switzerland. This article is an open access article distributed under the terms and conditions of the Creative Commons Attribution (CC BY) license (https://creativecommons.org/licenses/by/4.0/).
Share and Cite
MDPI and ACS Style
Yan, J.; Liu, P. Does Complex Soil Enhance Grain Yield under Cropping System? Agronomy 2021, 11, 1502. https://doi.org/10.3390/agronomy11081502
AMA Style
Yan J, Liu P. Does Complex Soil Enhance Grain Yield under Cropping System? Agronomy. 2021; 11(8):1502. https://doi.org/10.3390/agronomy11081502
Chicago/Turabian StyleYan, Jiakun, and Puling Liu. 2021. "Does Complex Soil Enhance Grain Yield under Cropping System?" Agronomy 11, no. 8: 1502. https://doi.org/10.3390/agronomy11081502
Note that from the first issue of 2016, this journal uses article numbers instead of page numbers. See further details here.