
Effects of Fencing on Vegetation and Soil Nutrients of the Temperate Steppe Grasslands in Inner Mongolia

Abstract
:1. Introduction
2. Materials and Methods
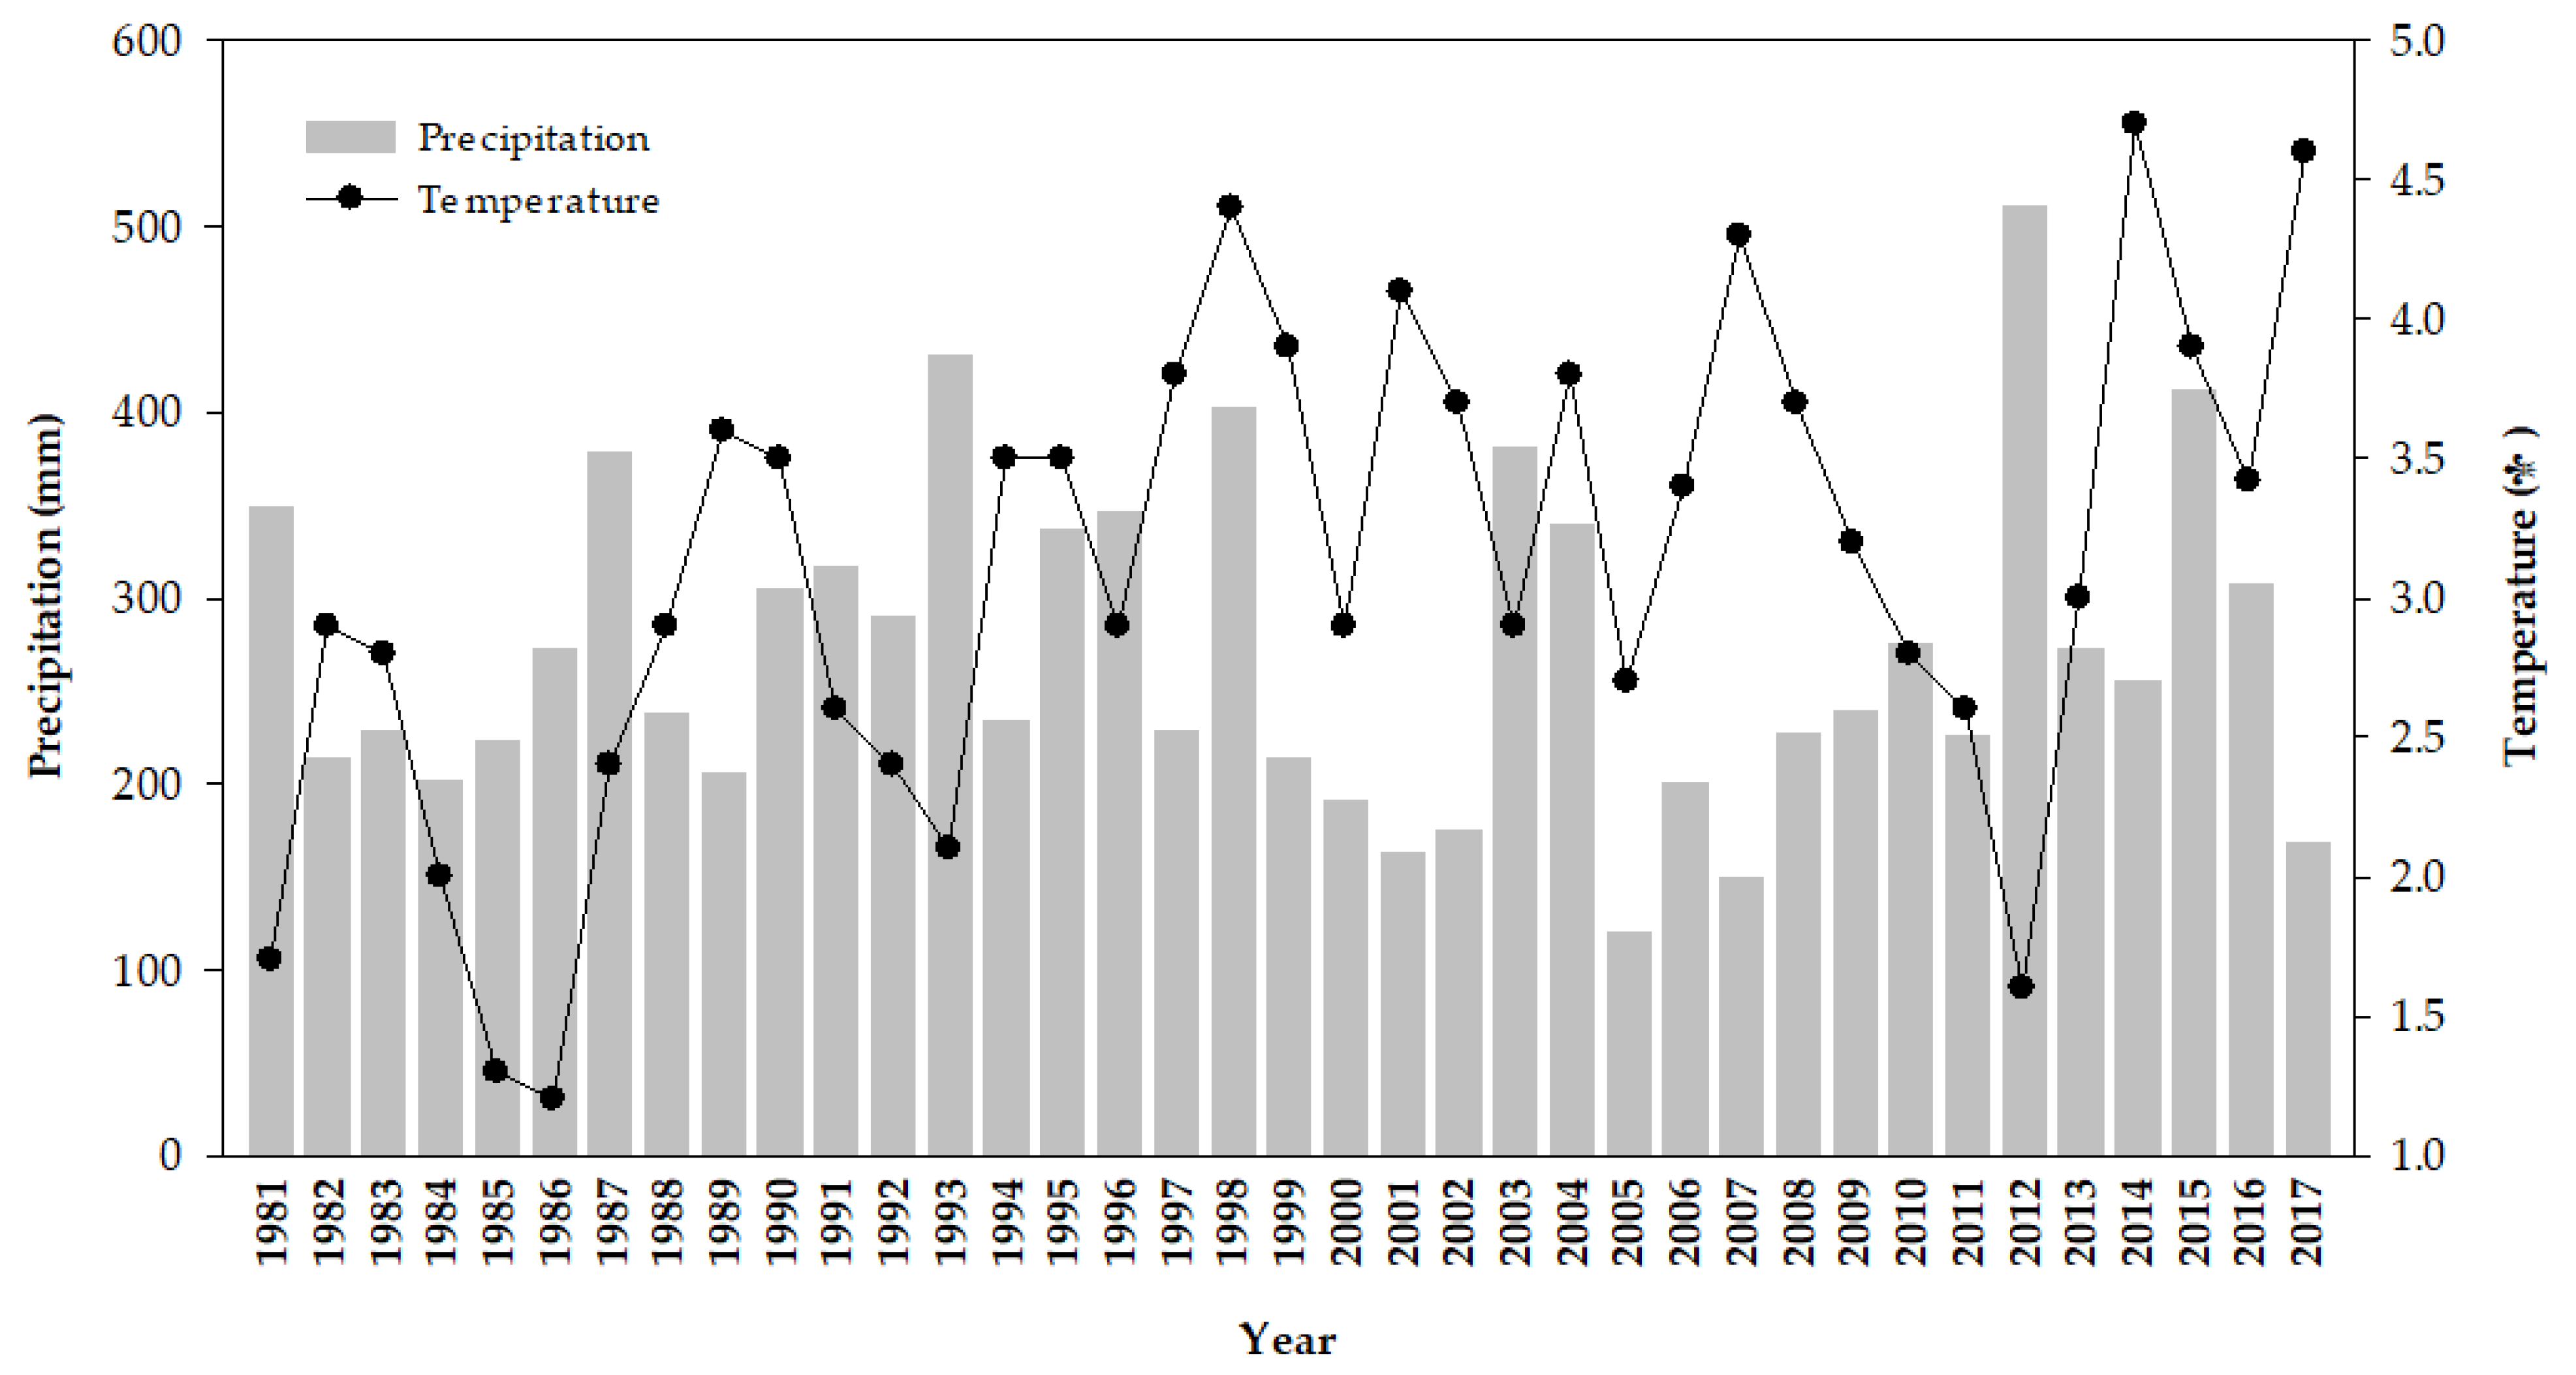
2.1. Experimental Sites
2.2. Sampling and Measurements
2.3. Calculations and Data Analysis
3. Results
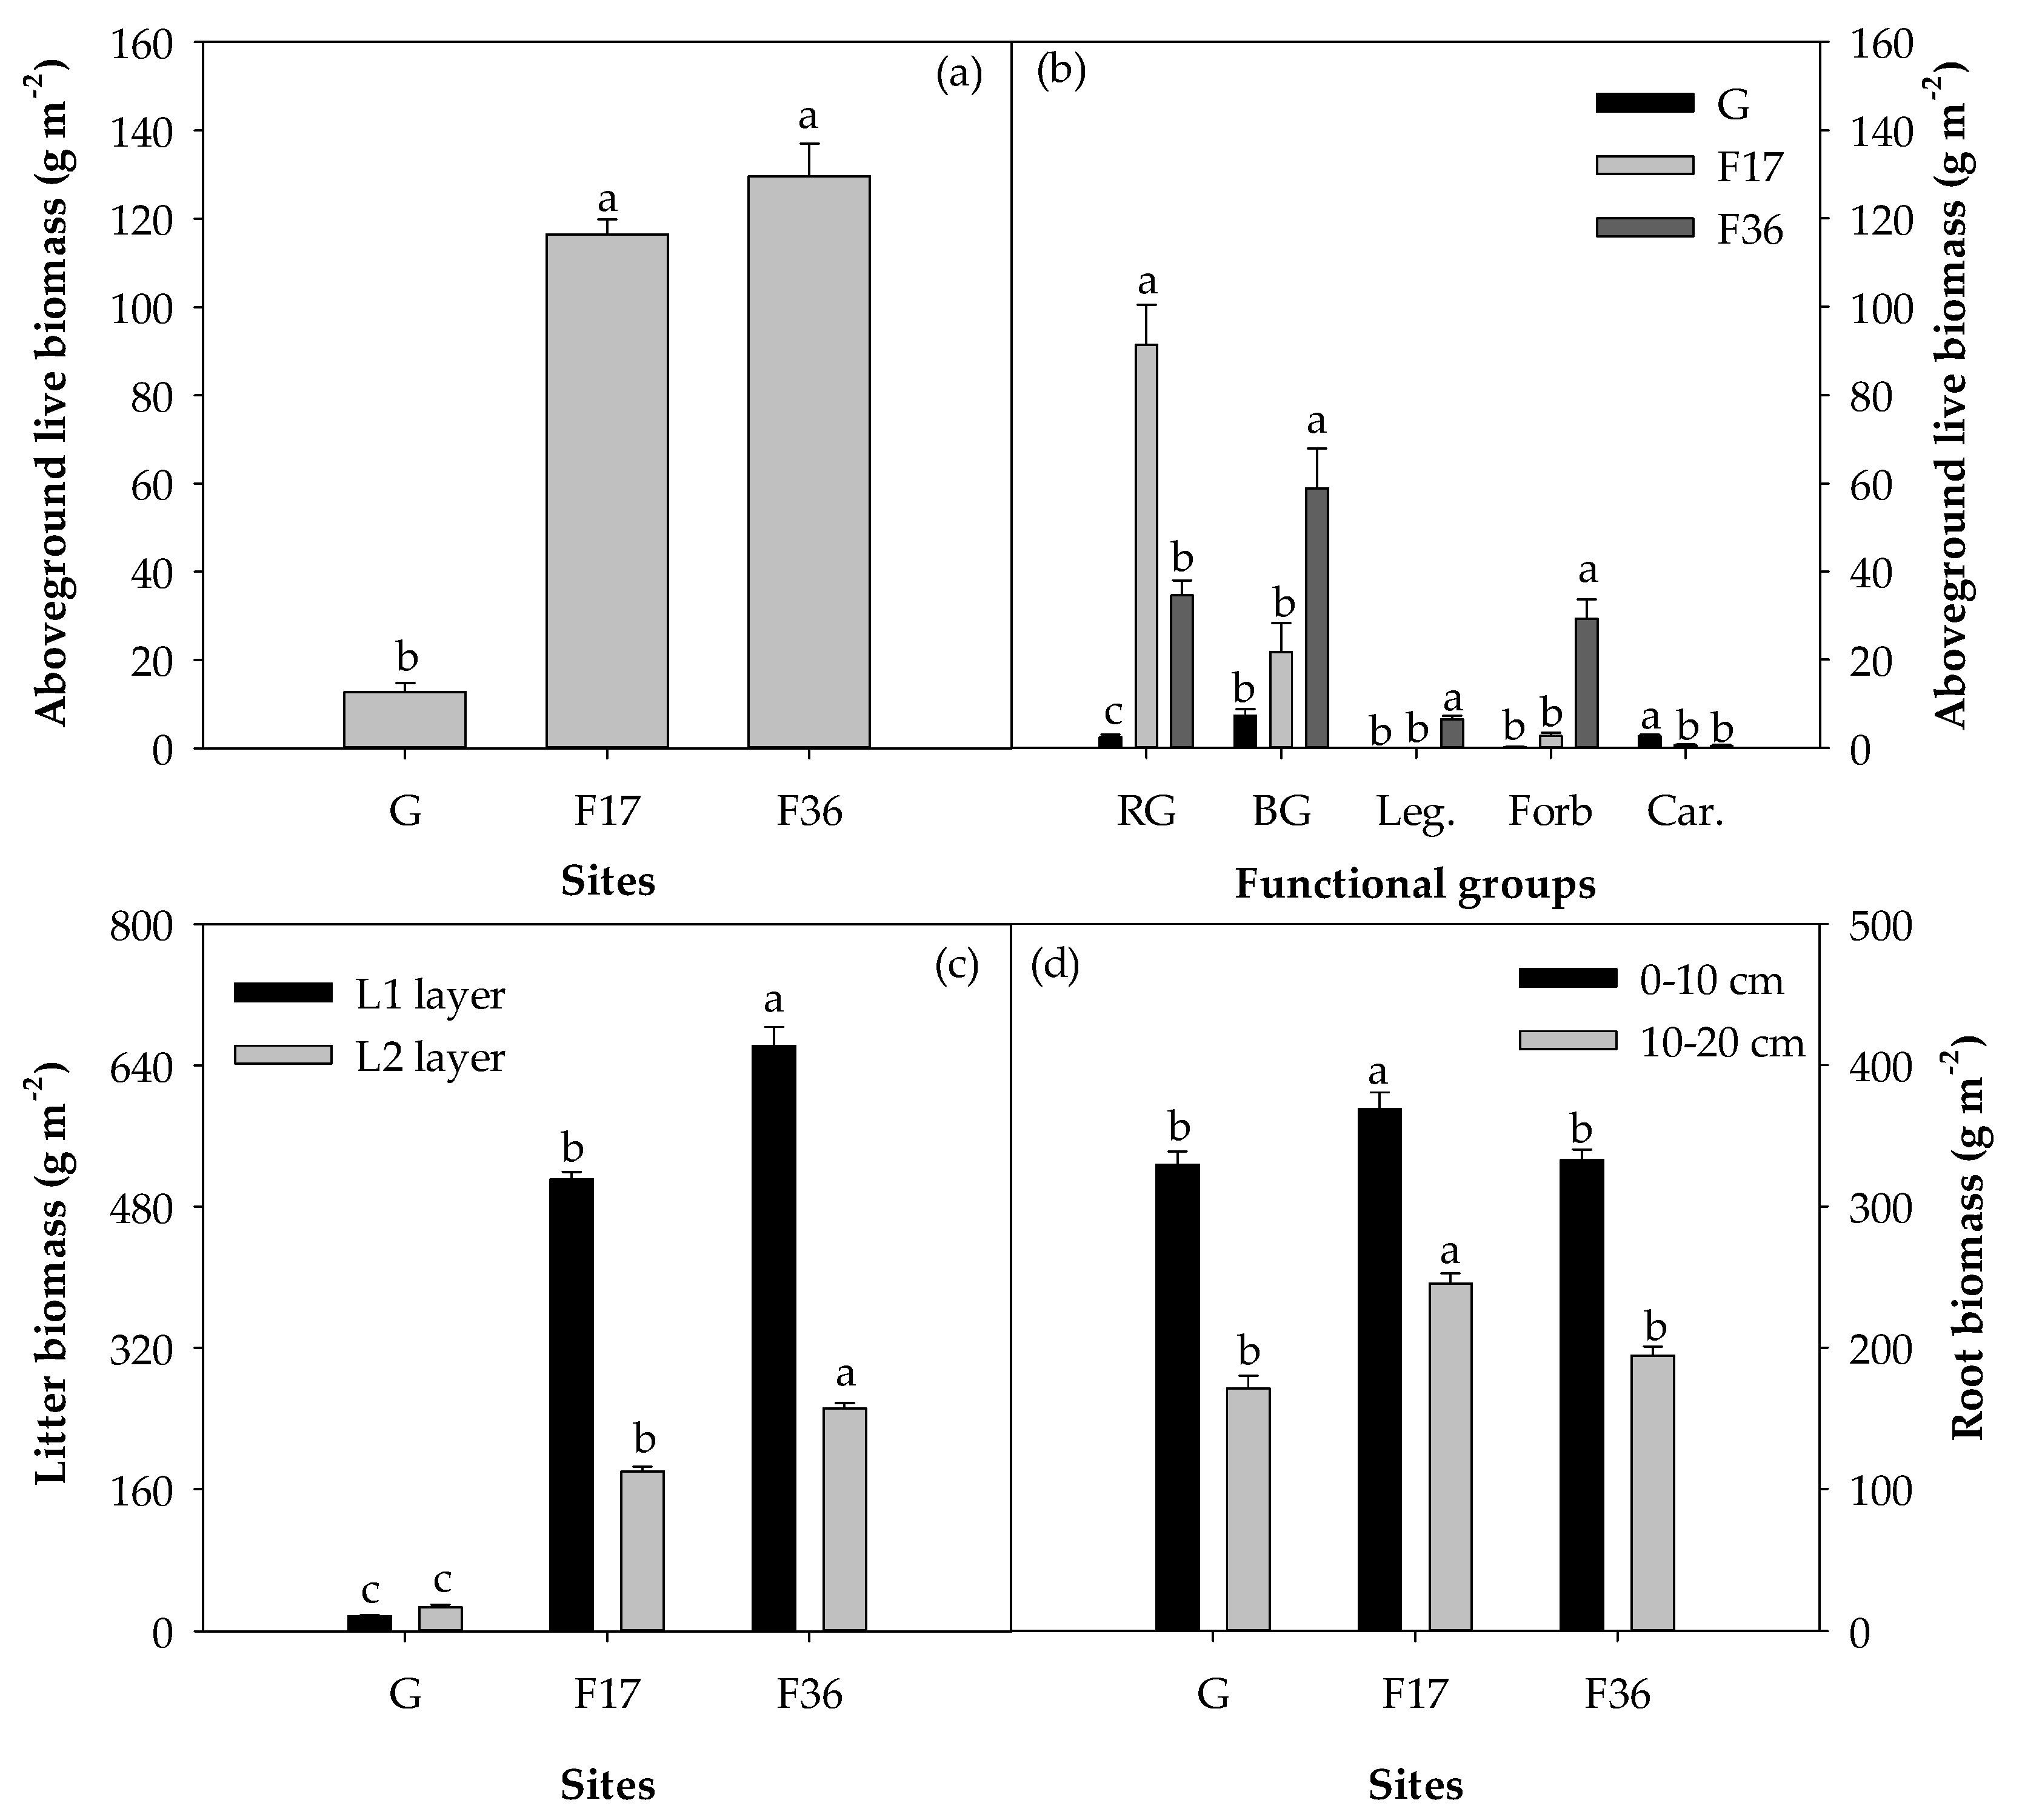
3.1. Plant Biomass
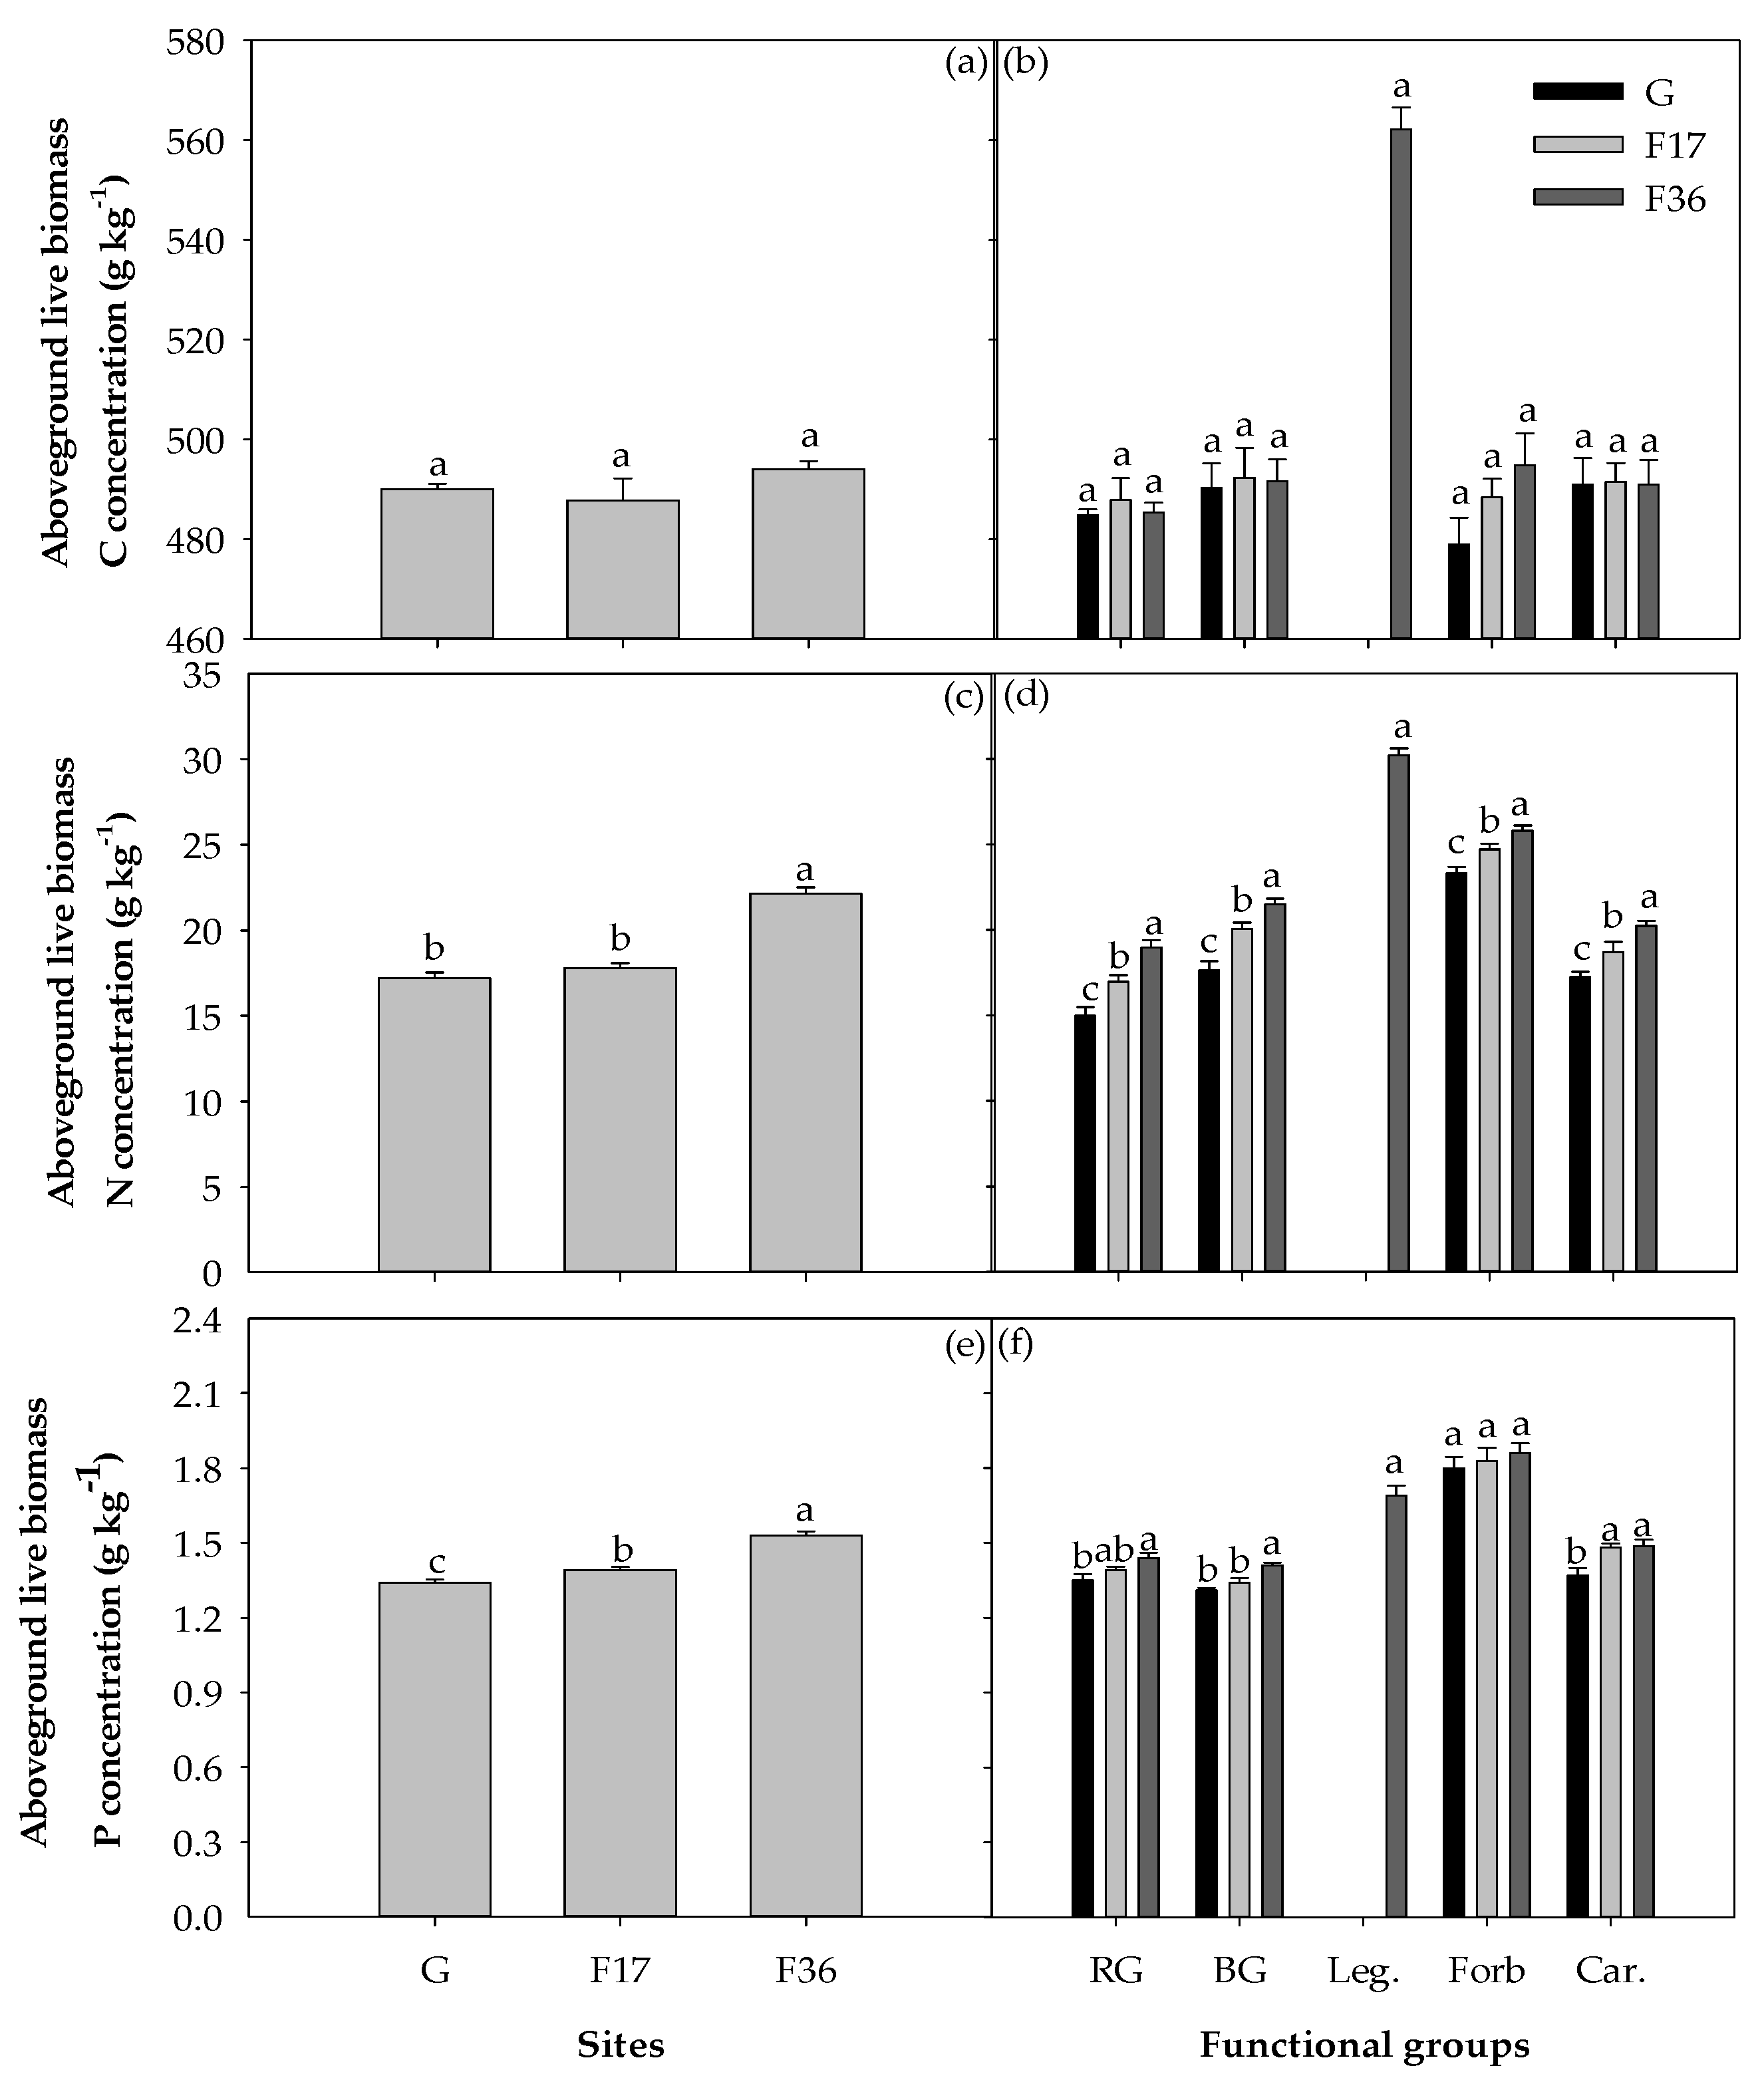
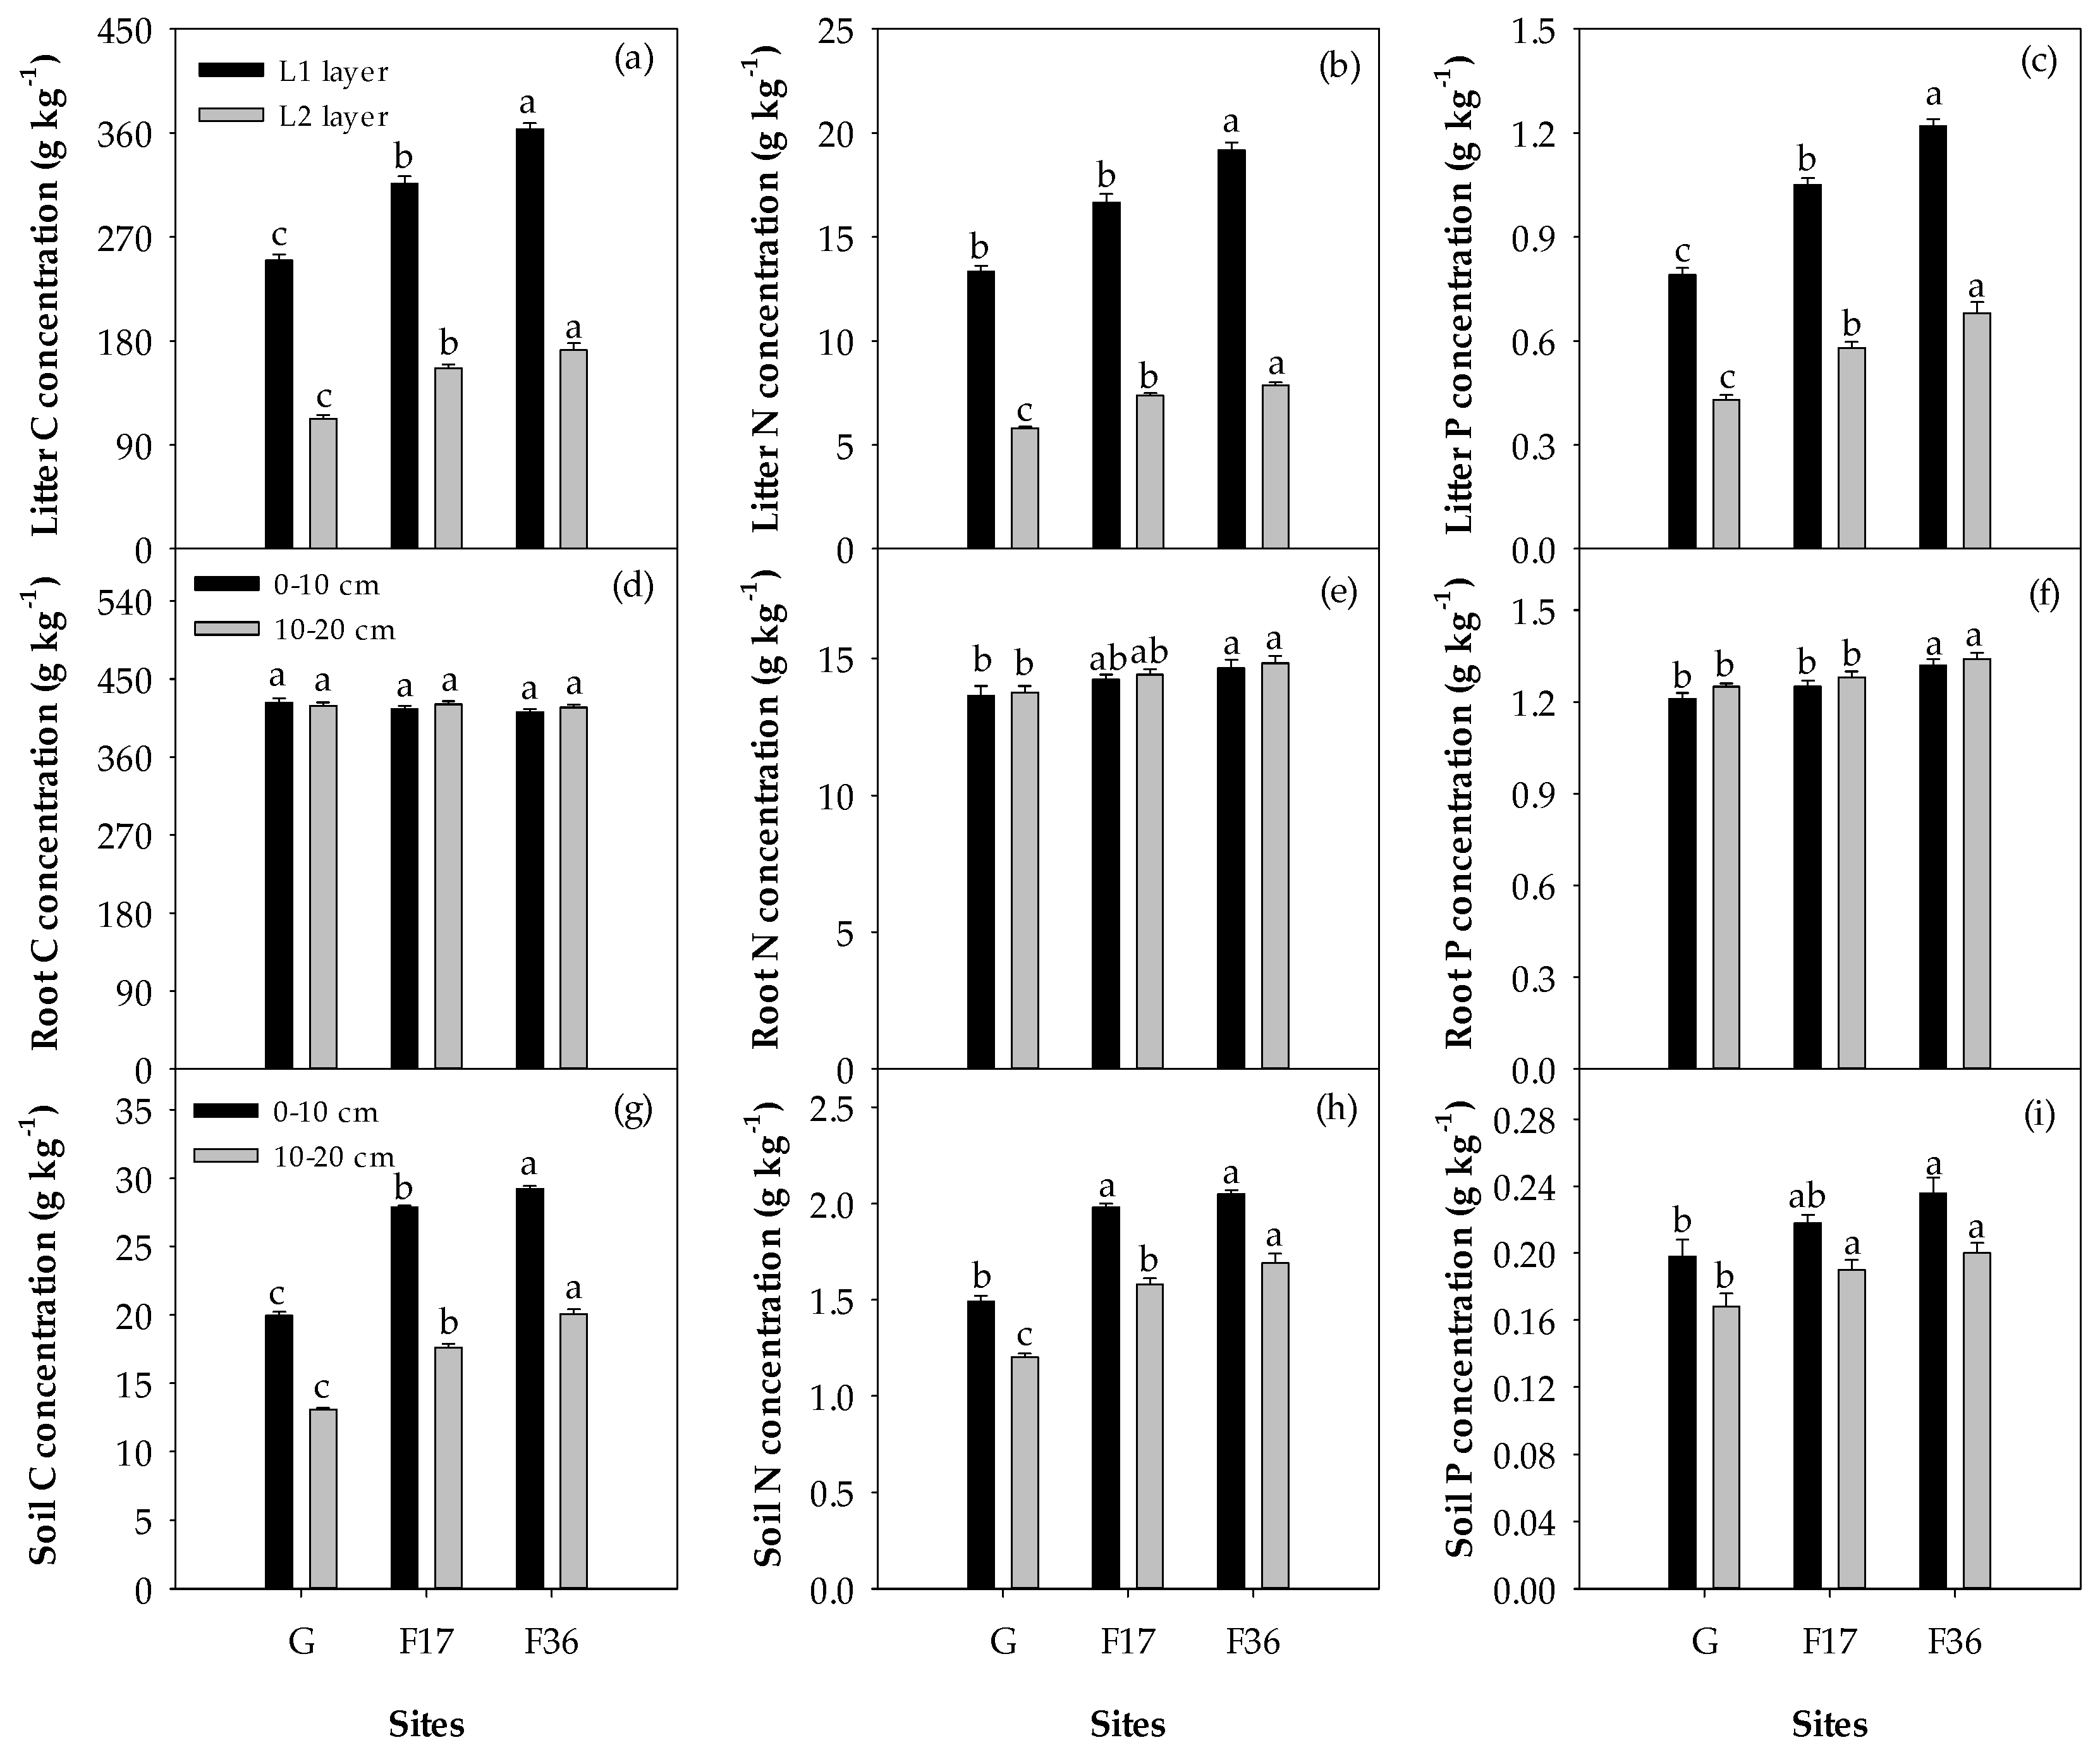
3.2. C, N and P Concentrations of Plant and Soil
3.3. The C, N and P stocks and Ecological Stoichiometry of Plant and Soil
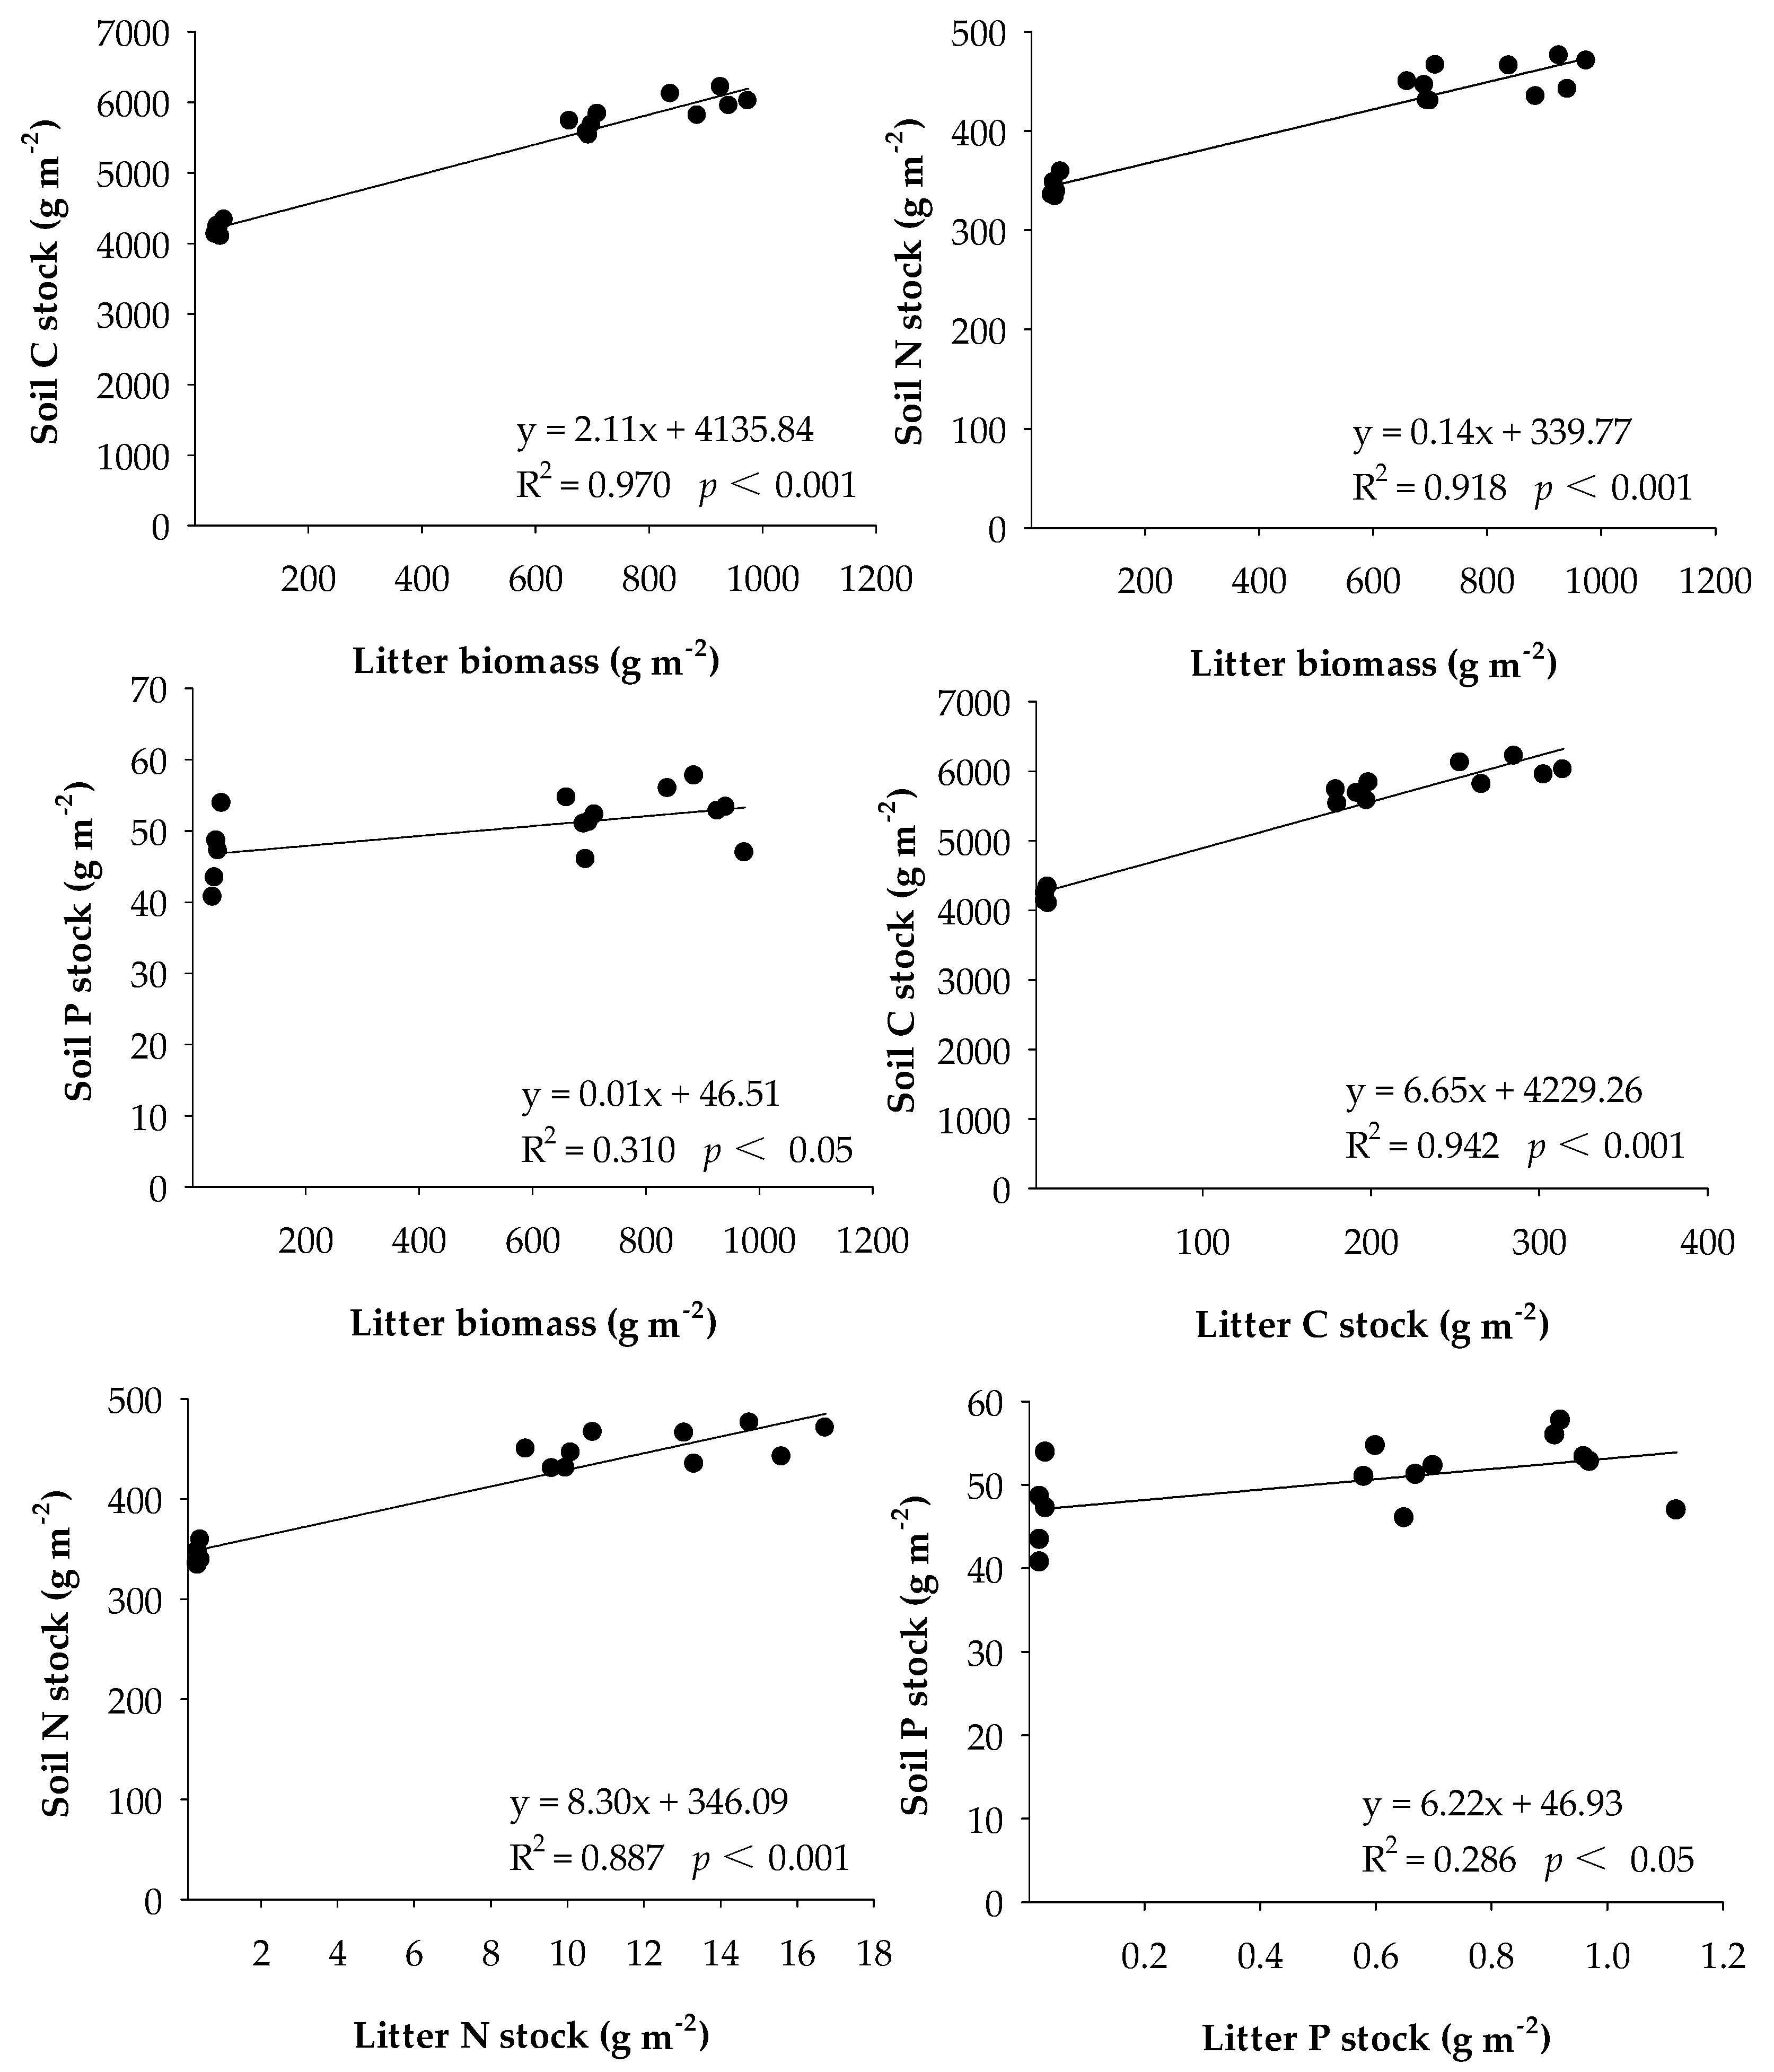
3.4. Relationship between Litter Properties and Soil Nutrient Stocks
4. Discussion
5. Conclusions
Author Contributions
Funding
Institutional Review Board Statement
Informed Consent Statement
Data Availability Statement
Conflicts of Interest
References
- Wang, W.; Fang, J.Y. Soil respiration and human effects on global grasslands. Glob. Planet. Chang. 2009, 67, 20–28. [Google Scholar] [CrossRef]
- Ebrahimi, M.; Khosravi, H.; Rigi, M. Short-term grazing exclusion from heavy livestock rangelands affects vegetation cover and soil properties in natural ecosystems of southeastern Iran. Ecol. Eng. 2016, 95, 10–18. [Google Scholar] [CrossRef]
- Scurlock, J.M.O.; Johnson, K.; Olson, R.J. Estimating net primary productivity from grassland biomass dynamics measurements. Glob. Chang. Biol. 2002, 8, 736–753. [Google Scholar] [CrossRef] [Green Version]
- Yang, Y.H.; Fang, J.Y.; Ma, W.H.; Guo, D.L.; Mohammat, A. Large-scale pattern of biomass partitioning across China’s grasslands. Glob. Ecol. Biogeogr. 2010, 19, 268–277. [Google Scholar]
- Deng, L.; Sweeney, S.; Shangguan, Z.P. Grassland responses to grazing disturbance: Plant diversity changes with grazing intensity in a desert steppe. Grass Forage Sci. 2014, 69, 524–533. [Google Scholar]
- Su, Y.Z.; Li, Y.L.; Cui, J.Y.; Zhao, W.Z. Influences of continuous grazing and livestock exclusion on soil properties in a degraded sandy grassland, Inner Mongolia, northern China. Catena 2005, 59, 267–278. [Google Scholar]
- Liang, Y.; Han, G.D.; Zhou, H.; Zhao, M.L.; Snyman, H.A.; Shan, D.; Havstad, K.A. Grazing intensity on vegetation dynamics of a typical steppe in northeast Inner Mongolia. Rangel. Ecol. Manag. 2009, 62, 328–336. [Google Scholar] [CrossRef]
- Wu, G.L.; Shang, Z.H.; Zhu, Y.J.; Ding, L.M.; Wang, D. Species-abundance-seed-size patterns within a plant community affected by grazing disturbance. Ecol. Appl. 2015, 25, 848–855. [Google Scholar]
- Zhang, J.; Zuo, X.A.; Zhou, X.; Lv, P.; Lian, J.; Yue, X.Y. Long-term grazing effects on vegetation characteristics and soil properties in a semiarid grassland, northern China. Environ. Monit. Assess. 2017, 189, 216. [Google Scholar] [PubMed]
- López-Mársico, L.; Altesor, A.; Oyarzabal, M.; Baldassini, P.; Paruelo, J.M. Grazing increases below-ground biomass and net primary production in a temperate grassland. Plant Soil 2015, 392, 155–162. [Google Scholar] [CrossRef]
- Derner, J.D.; Boutton, T.W.; Briske, D.D. Grazing and ecosystem carbon storage in the North American great plains. Plant Soil 2006, 280, 77–90. [Google Scholar] [CrossRef]
- Altesor, A.; Oesterheld, M.; Leoni, E.; Lezama, F.; Rodríguez, C. Effect of grazing on community structure and productivity of a Uruguayan grassland. Plant Ecol. 2005, 179, 83–91. [Google Scholar] [CrossRef]
- Akiyama, T.; Kawamura, K. Grassland degradation in China: Methods of monitoring, management and restoration. Grassl. Sci. 2007, 53, 1–17. [Google Scholar] [CrossRef]
- Li, Q.; Zhou, D.W.; Jin, Y.H.; Wang, M.L.; Song, Y.T.; Li, G.D. Effects of fencing on vegetation and soil restoration in a degraded alkaline grassland in northeast China. J. Arid Land 2014, 6, 478–487. [Google Scholar] [CrossRef] [Green Version]
- Barros, A.; Pickering, C.M.; Renison, D. Short-term effects of pack animal grazing exclusion from Andean alpine meadows. Arct. Antarct. Alp. Res. 2014, 46, 333–343. [Google Scholar] [CrossRef] [Green Version]
- Haugland, E.; Froud-Williams, R.J. Improving grasslands: The influence of soil moisture and nitrogen fertilization on the establishment of seedlings. J. Appl. Ecol. 1999, 36, 263–270. [Google Scholar] [CrossRef]
- Bailey, D.W.; Brown, J.R. Rotational grazing systems and livestock grazing behavior in shrub-dominated semi-arid and arid rangelands. Rangel. Ecol. Manag. 2011, 64, 1–9. [Google Scholar] [CrossRef]
- Zhu, G.Y.; Deng, L.; Zhang, X.B.; Shangguan, Z.P. Effects of grazing exclusion on plant community and soil physicochemical properties in a desert steppe on the loess plateau, China. Ecol. Eng. 2016, 90, 372–381. [Google Scholar] [CrossRef]
- Wu, G.L.; Liu, Z.H.; Zhang, L.; Chen, J.M.; Hu, T.M. Long-term fencing improved soil properties and soil organic carbon storage in an alpine swamp meadow of western China. Plant Soil 2010, 332, 331–337. [Google Scholar] [CrossRef]
- He, N.P.; Wu, L.; Wang, Y.S.; Han, X.G. Changes in carbon and nitrogen in soil particle-size fractions along a grassland restoration chronosequence in northern China. Geoderma 2009, 150, 302–308. [Google Scholar] [CrossRef]
- Souter, N.J.; Milne, T. Grazing exclusion as a conservation measure in a South Australian temperate native grassland. Grassl. Sci. 2009, 55, 79–88. [Google Scholar] [CrossRef]
- Cheng, J.M.; Jing, G.H.; Wei, L.; Jing, Z.B. Long-term grazing exclusion effects on vegetation characteristics, soil properties and bacterial communities in the semi-arid grasslands of China. Ecol. Eng. 2016, 97, 170–178. [Google Scholar] [CrossRef]
- Wang, T.W.; Zhang, Z.; Li, Z.B.; Li, P. Grazing management affects plant diversity and soil properties in a temperate steppe in northern China. Catena 2017, 158, 141–147. [Google Scholar] [CrossRef]
- Yan, Y.C.; Tang, H.P.; Chang, R.Y.; Liu, L. Study on the difference of vegetation and soil in typical steppe communities under different fenced time. J. Arid Land Resour. Environ. 2008, 22, 145–151. (In Chinese) [Google Scholar]
- Sun, Z.J.; An, S.Z.; Duan, J.J. Effect of enclosure on vegetation and soil nutrient of sagebrush desert grassland in Xinjiang. Arid Zone Res. 2009, 26, 877–882. (In Chinese) [Google Scholar] [CrossRef]
- Wu, X.W.; Wang, Y.C.; Sun, S.C. Long-term fencing decreases plant diversity and soil organic carbon concentration of the Zoige alpine meadows on the eastern Tibetan plateau. Plant Soil 2019, 458, 191–200. [Google Scholar] [CrossRef]
- Schonbach, P.; Wan, H.W.; Gierus, M.; Bai, Y.F.; Muller, K.; Lin, L.J.; Susenbeth, A.; Taube, F. Grassland responses to grazing: Effects of grazing intensity and management system in an Inner Mongolian steppe ecosystem. Plant Soil 2011, 340, 103–115. [Google Scholar] [CrossRef]
- Frank, D.A.; Kuns, M.M.; Guido, D.R. Consumer control of grassland plant production. Ecology 2002, 83, 602–606. [Google Scholar] [CrossRef]
- Deng, L.; Sweeney, S.; Shangguan, Z.P. Long-term effects of natural enclosure: Carbon stocks, sequestration rates and potential for grassland ecosystems in the Loess Plateau. Clean Soil Air Water 2014, 42, 617–625. [Google Scholar] [CrossRef]
- Zhou, Z.Y.; Li, F.R.; Chen, S.K.; Zhang, H.R.; Li, G.D. Dynamics of vegetation and soil carbon and nitrogen accumulation over 26 years under controlled grazing in a desert shrubland. Plant Soil 2011, 341, 257–268. [Google Scholar] [CrossRef]
- Pei, S.F.; Fu, H.; Wan, C.G. Changes in soil properties and vegetation following exclosure and grazing in degraded Alxa desert steppe of Inner Mongolia, China. Agric. Ecosyst. Environ. 2008, 124, 33–39. [Google Scholar] [CrossRef]
- Steffens, M.; Kolbl, A.; Totsche, K.U.; Kogel-Knabner, I. Grazing effects on soil chemical and physical properties in a semiarid steppe of Inner Mongolia (P.R. China). Geoderma 2008, 143, 63–72. [Google Scholar] [CrossRef]
- Shi, X.M.; Li, X.G.; Li, C.T.; Zhao, Y.; Shang, Z.H.; Ma, Q.F. Grazing exclusion decreases soil organic C storage at an alpine grassland of the Qinghai–Tibetan Plateau. Ecol. Eng. 2013, 57, 183–187. [Google Scholar] [CrossRef]
- Medina-Roldán, E.; Paz-Ferreiro, J.; Bardgett, R.D. Grazing exclusion affects soil and plant communities, but has no impact on soil carbon storage in an upland grassland. Agric. Ecosyst. Environ. 2012, 149, 118–123. [Google Scholar] [CrossRef]
- Reeder, J.D.; Schuman, G.E. Influence of livestock grazing on C sequestration in semi-arid mixed-grass and short-grass rangelands. Environ. Pollut. 2002, 116, 457–463. [Google Scholar] [CrossRef]
- Nosetto, M.D.; Jobbagy, E.G.; Paruelo, J.M. Carbon sequestration in semi-arid rangelands: Comparison of Pinus ponderosa plantations and grazing exclusion in NW Patagonia. J. Arid Environ. 2006, 67, 142–156. [Google Scholar] [CrossRef]
- Shrestha, G.; Stahl, P.D. Carbon accumulation and storage in semi-arid sagebrush steppe: Effects of long-term grazing exclusion. Agric. Ecosyst. Environ. 2008, 125, 173–181. [Google Scholar] [CrossRef]
- Hafner, S.; Unteregelsbacher, S.; Seeber, E.; Lena, B.; Xu, X.L.; Li, X.G.; Guggenberger, G.; Miehe, G.; Kuzyakov, Y. Effect of grazing on carbon stocks and assimilate partitioning in a Tibetan montane pasture revealed by 13CO2 pulse labeling. Glob. Chang. Biol. 2012, 18, 528–538. [Google Scholar] [CrossRef]
- Mekuria, W.; Aynekulu, E. Exclosure land management for restoration of the soils in degraded communal grazing lands in northern Ethiopia. Land Degrad. Dev. 2013, 24, 528–538. [Google Scholar] [CrossRef]
- Lu, X.Y.; Yan, Y.; Sun, J.; Zhang, X.K.; Chen, Y.C.; Wang, X.D.; Cheng, G.W. Carbon, nitrogen, and phosphorus storage in alpine grassland ecosystems of Tibet: Effects of grazing exclusion. Ecol. Evol. 2015, 5, 4492–4504. [Google Scholar] [CrossRef]
- McSherry, M.E.; Ritchie, M.E. Effects of grazing on grassland soil carbon: A global review. Glob. Chang. Biol. 2013, 19, 1347–1357. [Google Scholar] [CrossRef]
- Wang, D.; Wu, G.L.; Zhu, Y.J.; Shi, Z.H. Grazing exclusion effects on above- and below-ground C and N pools of typical grassland on the Loess Plateau (China). Catena 2014, 123, 113–120. [Google Scholar] [CrossRef]
- Bi, X.; Fu, Q.; Fan, Y.; Ma, L.X.; Yang, Z.H.; Nan, B.; Dai, X.H.; Zhang, X.S. Effects of grazing exclusion on the grassland ecosystems of mountain meadows and temperate typical steppe in a mountain-basin system in Central Asia’s arid regions, China. Sci. Total Environ. 2018, 630, 254–263. [Google Scholar] [CrossRef]
- Yang, Z.P.; Ouyang, H.; Zhang, X.Z.; Xu, X.L.; Zhou, C.P.; Yang, W.B. Spatial variability of soil moisture at typical alpine meadow and steppe sites in the Qinghai-Tibetan Plateau permafrost region. Environ. Earth Sci. 2011, 63, 477–488. [Google Scholar] [CrossRef] [Green Version]
- Wen, H.Y.; Niu, D.C.; Fu, H.; Kang, J. Experimental investigation on soil carbon, nitrogen, and their components under grazing and livestock exclusion in steppe and desert steppe grasslands, Northwestern China. Environ. Earth Sci. 2013, 70, 3131–3141. [Google Scholar] [CrossRef]
- De Deyn, G.B.; Cornelissen, J.H.C.; Bardgett, R.D. Plant functional traits and soil carbon sequestration in contrasting biomes. Ecol. Lett. 2008, 11, 516–531. [Google Scholar] [CrossRef]
- Chen, Y.P.; Li, Y.Q.; Zhao, X.Y.; Awada, T.; Shang, W.; Han, J.J. Effects of grazing exclusion on soil properties and on ecosystem carbon and nitrogen storage in a sandy rangeland of Inner Mongolia, Northern China. Environ. Manag. 2012, 50, 622–632. [Google Scholar] [CrossRef] [PubMed]
- Wu, X.; Li, Z.S.; Fu, B.J.; Zhou, W.M.; Liu, H.F.; Liu, G.H. Restoration of ecosystem carbon and nitrogen storage and microbial biomass after grazing exclusion in semi-arid grasslands of Inner Mongolia. Ecol. Eng. 2014, 73, 395–403. [Google Scholar] [CrossRef]
- Wiesmeier, M.; Kreyling, O.; Steffens, M.; Schoenbach, P.; Wan, H.W.; Gierus, M.; Taube, F.; Kölbl, A.; Kögel-Knabner, I. Short-term degradation of semiarid grasslands—results from a controlled-grazing experiment in Northern China. J. Plant Nutr. Soil Sci. 2012, 175, 434–442. [Google Scholar] [CrossRef]
- Bai, Y.F.; Wu, J.G.; Clark, C.M.; Naeem, S.; Pan, Q.M.; Huang, J.H.; Zhang, L.X.; Han, X.G. Tradeoffs and thresholds in the effects of nitrogen addition on biodiversity and ecosystem functioning: Evidence from Inner Mongolia grasslands. Glob. Chang. Biol. 2010, 16, 358–372. [Google Scholar] [CrossRef]
- Nelson, D.W.; Sommers, L.E. Total carbon, organic carbon and organic matter. In Methods of Soil Analysis, Part 2, 2nd ed.; Page, A.L., Ed.; American Society of Agronomy: Madison, WI, USA, 1982; pp. 539–577. [Google Scholar]
- Bremner, J.M. Nitrogen Total Methods of Soil Analysis. Part 3: Chemical Methods; America Society of Agronomy: Madison, WI, USA, 1996; pp. 1085–1121. [Google Scholar]
- Cao, Y.Z.; Wang, X.D.; Lu, X.Y.; Yan, Y.; Fan, J.H. Soil organic carbon and nutrients along an alpine grassland transect across Northern Tibet. J. Mt. Sci. 2013, 10, 564–573. [Google Scholar] [CrossRef] [Green Version]
- He, N.P.; Yu, Q.; Wu, L.; Wang, Y.S.; Han, X.G. Carbon and nitrogen store and storage potential as affected by land-use in a Leymus chinensis grassland of northern China. Soil Biol. Biochem. 2008, 40, 2952–2959. [Google Scholar] [CrossRef]
- Fang, J.Y.; Guo, Z.D.; Piao, S.L.; Chen, A.P. Terrestrial vegetation carbon sinks in China, 1981–2000. Sci. China Ser. D Earth Sci. 2007, 50, 1341–1350. [Google Scholar] [CrossRef]
- Shang, Z.H.; Deng, B.; Ding, L.M.; Ren, G.H.; Xin, G.S.; Liu, Z.Y.; Wang, Y.L.; Long, R.J. The effects of three years of fencing enclosure on soil seed banks and the relationship with aboveground vegetation of degraded alpine grasslands of the Tibetan plateau. Plant Soil 2013, 364, 229–244. [Google Scholar] [CrossRef]
- Wang, Y.J.; Shen, X.J.; Jiang, M.; Tong, S.Z.; Lu, X.G. Spatiotemporal change of aboveground biomass and its response to climate change in marshes of the Tibetan Plateau. Int. J. Appl. Earth Obs. Geoinf. 2021, 102, 102385. [Google Scholar] [CrossRef]
- Yu, Q.; Wu, H.H.; Wang, Z.W.; Flynn, D.F.B.; Yang, H.; Lv, F.M.; Smith, M.; Han, X.G. Long term prevention of disturbance induces the collapse of a dominant species without altering ecosystem function. Sci. Rep. 2015, 5, 14320. [Google Scholar] [CrossRef] [Green Version]
- Chai, Q.L.; Ma, Z.Y.; Chang, X.F.; Wu, G.L.; Zheng, J.Y.; Li, Z.W.; Wang, G.J. Optimizing management to conserve plant diversity and soil carbon stock of semi-arid grasslands on the Loess Plateau. Catena 2019, 172, 781–788. [Google Scholar] [CrossRef]
- Kull, O.; Aan, A. The relative share of graminoid and forb life-forms in a natural gradient of herb layer productivity. Ecography 1997, 20, 146–154. [Google Scholar] [CrossRef]
- Shen, X.J.; Jiang, M.; Lu, X.G.; Liu, X.T.; Liu, B.H.; Zhang, J.Q.; Wang, X.W.; Tong, S.Z.; Lei, G.C.; Wang, S.Z.; et al. Aboveground biomass and its spatial distribution pattern of herbaceous marsh vegetation in China. Sci. China Earth Sci. 2021, 64, 1115–1125. [Google Scholar] [CrossRef]
- Shen, X.J.; Liu, B.H.; Henderson, M.H.; Wang, L.; Wu, Z.F.; Wu, H.T.; Jiang, M.; Lu, X.G. Asymmetric effects of daytime and nighttime warming on spring phenology in the temperate grasslands of China. Agric. For. Meteorol. 2018, 259, 240–249. [Google Scholar] [CrossRef]
- Schade, J.D.; Kyle, M.; Hobbie, S.E.; Fagan, W.F.; Elser, J.J. Stoichiometric tracking of soil nutrients by a desert insect herbivore. Ecol. Lett. 2003, 6, 96–101. [Google Scholar] [CrossRef] [Green Version]
- Niu, K.C.; He, J.S.; Zhang, S.T.; Lechowicz, M.J. Tradeoffs between forage quality and soil fertility: Lessons from Himalayan rangelands. Agric. Ecosyst. Environ. 2016, 234, 31–39. [Google Scholar] [CrossRef] [Green Version]
- Lambers, H.; Mougel, C.; Jaillard, B.; Hinsinger, P. Plant-microbe-soil interactions in the rhizosphere: An evolutionary perspective. Plant Soil 2009, 321, 83–115. [Google Scholar] [CrossRef]
- Zeng, Q.C.; Li, X.; Dong, Y.H.; An, S.S.; Darboux, F. Soil and plant components ecological stoichiometry in four steppe communities in the Loess Plateau of China. Catena 2016, 147, 481–488. [Google Scholar] [CrossRef]
- Yang, Y.; Liu, B.R.; An, S.S. Ecological stoichiometry in leaves, roots, litters and soil among different plant communities in a desertified region of Northern China. Catena 2018, 166, 328–338. [Google Scholar] [CrossRef]
- Wang, K.B.; Deng, L.; Ren, Z.P.; Li, J.P.; Shangguan, Z.P. Grazing exclusion significantly improves grassland ecosystem C and N pools in a desert steppe of northwest China. Catena 2016, 137, 441–448. [Google Scholar] [CrossRef]
- Jing, Z.B.; Cheng, J.M.; Su, J.S.; Bai, Y.; Jin, J.W. Changes in plant community composition and soil properties under 3-decade grazing exclusion in semiarid grassland. Ecol. Eng. 2014, 64, 171–178. [Google Scholar] [CrossRef]
- Wei, Z.J.; Bai, Y.J.; Wu, R.T.; Yang, J.; Yang, S.M. Studies on grazing behavior under different grazing systems on desert steppe. Acta Agrestia Sin. 2005, 13, 57–61. (In Chinese) [Google Scholar]
- Wu, R.N. Study on Grazing Behavior, Herbage Intake and Digestibility of Grazing Sheep in the Inner Mongolian Typical Steppe. Master’s Thesis, Inner Mongolia Agriculture University, Hohhot, China, May 2010. [Google Scholar]
- Qiu, L.P.; Wei, X.R.; Zhang, X.C.; Cheng, J.M. Ecosystem carbon and nitrogen accumulation after grazing exclusion in semiarid grassland. PLoS ONE 2013, 8, e55433. [Google Scholar]
- Liu, J.; Zhang, Q.C.; Li, Y.; Di, H.J.; Xu, J.M.; Li, J.Y.; Guan, X.M.; Xu, X.Y.; Pan, H. Effects of pasture management on soil fertility and microbial communities in the semi-arid grasslands of Inner Mongolia. J. Soils Sediments 2016, 16, 235–242. [Google Scholar] [CrossRef]
- Hu, Z.M.; Li, S.G.; Guo, Q.; Niu, S.L.; He, N.P.; Li, L.H.; Yu, G.R. A synthesis of the effect of grazing exclusion on carbon dynamics in grasslands in China. Glob. Chang. Biol. 2016, 22, 1385–1393. [Google Scholar] [CrossRef]
- Shao, C.; Chen, J.; Li, L.; Zhang, L. Ecosystem responses to mowing manipulations in an arid Inner Mongolia steppe: An energy perspective. J. Arid Environ. 2012, 82, 1–10. [Google Scholar] [CrossRef]
- Yin, X.R.; Liang, C.Z.; Wang, L.X.; Wang, W.; Liu, Z.L.; Liu, X.P. Ecological stoichiometry of plant nutrients at different restoration succession stages in typical steppe of Inner Mongolia, China. Chin. J. Plant Ecol. 2010, 34, 39–47. (In Chinese) [Google Scholar]


| Soil properties (0–20 cm) | Organic carbon (%) | 2.32 | |
| Total nitrogen (%) | 0.16 | ||
| Total phosphorus (%) | 0.02 | ||
| pH | 7.52 | ||
| Bulk density(g cm−3) | 1.23 | ||
| Vegetation properties | Community | Species numbers | 19 |
| Biomass (g m−2) | 34.05 | ||
| Functional groups | Rhizome grass (g m−2) | 2.75 | |
| Bunchgrass (g m−2) | 25.19 | ||
| Legume (g m−2) | 0.65 | ||
| Forb (g m−2) | 5.68 | ||
| Carex (g m−2) | 11.56 | ||
| Species | Leymus chinensis (g m−2) | 2.30 | |
| Stipa grandis (g m−2) | 3.92 | ||
| Caragana microphylla (g m−2) | 0.03 | ||
| Carex korshinskii (g m−2) | 0.23 | ||
| Cleistogenes squarrosa (g m−2) | 11.83 | ||
| Agropyron cristatum (g m−2) | 9.29 | ||
| Melilotoides ruthenica (g m−2) | 0.33 | ||
| Kochia prostrata (g m−2) | 0.26 | ||
| Potentilla acaulis (g m−2) | 0.08 | ||
| Artemisia frigida (g m−2) | 4.23 | ||
| Koeleria cristata (g m−2) | 0.15 | ||
| Potentilla tanacetifolia (g m−2) | 0.25 | ||
| Potentilla verticillaris (g m−2) | 0.02 | ||
| Iris tenuifolia (g m−2) | 0.09 | ||
| Heteropappus hispidus (g m−2) | 0.32 | ||
| Sibbaldia adpressa (g m−2) | 0.13 | ||
| Chenopodium album (g m−2) | 0.10 | ||
| Allium bidentatum (g m−2) | 0.20 | ||
| Astragalus galactites (g m−2) | 0.29 |
| Variables | Sites | Aboveground Live Biomass | Litter | Root | Soil | |||
|---|---|---|---|---|---|---|---|---|
| L1 Layer | L2 Layer | 0–10 cm | 10–20 cm | 0–10 cm | 10–20 cm | |||
| C stock (g m−2) | G | 6.25 ± 0.99 c | 4.23 ± 0.31 c | 3.05 ± 0.40 c | 139.22 ± 4.36 ab | 71.67 ± 3.52 c | 2505.18 ± 23.78 b | 1698.96 ± 20.93 c |
| F17 | 56.77 ± 1.22 b | 161.51 ± 3.37 b | 28.12 ± 1.08 b | 153.30 ± 5.69 a | 103.09 ± 2.37 a | 3427.16 ± 29.93 a | 2240.05 ± 31.81 b | |
| F36 | 64.00 ± 3.44 a | 240.95 ± 10.81 a | 43.34 ± 2.53 a | 137.08 ± 3.64 b | 81.10 ± 2.91 b | 3470.34 ± 57.17 a | 2446.94 ± 47.22 a | |
| N stock (g m−2) | G | 0.22 ± 0.04 c | 0.23 ± 0.02 c | 0.16 ± 0.02 c | 4.49 ± 0.14 b | 2.35 ± 0.10 c | 187.40 ± 3.24 b | 155.71 ± 2.59 b |
| F17 | 2.07 ± 0.05 b | 8.52 ± 0.27 b | 1.33 ± 0.05 b | 5.25 ± 0.18 a | 3.53 ± 0.09 a | 243.60 ± 3.67 a | 200.63 ± 3.67 a | |
| F36 | 2.88 ± 0.20 a | 12.72 ± 0.64 a | 1.97 ± 0.06 a | 4.87 ± 0.11 ab | 2.88 ± 0.08 b | 243.40 ± 5.22 a | 206.56 ± 7.71 a | |
| P stock (g m−2) | G | 0.02 ± 0.003 c | 0.01 ± 0.001 c | 0.01 ± 0.001 c | 0.40 ± 0.015 b | 0.21 ± 0.013 c | 24.86 ± 1.22 b | 22.03 ± 1.34 a |
| F17 | 0.16 ± 0.004 b | 0.54 ± 0.02 b | 0.10 ± 0.004 b | 0.46 ± 0.014 a | 0.31 ± 0.012 a | 27.03 ± 0.80 ab | 24.02 ± 0.66 a | |
| F36 | 0.20 ± 0.013 a | 0.81 ± 0.03 a | 0.17 ± 0.010 a | 0.44 ± 0.012 ab | 0.26 ± 0.006 b | 27.99 ± 1.20 a | 24.52 ± 0.89 a | |
| C:N Ratio | G | 28.53 ± 0.57 a | 18.72 ± 0.22 a | 19.49 ± 0.22 b | 31.08 ± 0.89 a | 30.47 ± 0.32 a | 13.38 ± 0.23 b | 10.92 ± 0.15 b |
| F17 | 27.43 ± 0.37 a | 18.98 ± 0.38 a | 21.25 ± 0.56 ab | 29.22 ± 0.43 ab | 29.20 ± 0.44 ab | 14.08 ± 0.16 a | 11.17 ± 0.09 b | |
| F36 | 22.34 ± 0.42 b | 18.96 ± 0.17 a | 21.92 ± 0.89 a | 28.19 ± 0.73 b | 28.15 ± 0.61 b | 14.26 ± 0.11 a | 11.87 ± 0.15 a | |
| N:P Ratio | G | 12.85 ± 0.21 b | 16.88 ± 0.76 a | 13.63 ± 0.43 a | 11.28 ± 0.32 a | 11.05 ± 0.21 a | 7.60 ± 0.32 b | 7.16 ± 0.43 a |
| F17 | 12.79 ± 0.22 b | 15.97 ± 0.57 a | 12.73 ± 0.33 ab | 11.43 ± 0.27 a | 11.26 ± 0.33 a | 9.03 ± 0.16 a | 8.37 ± 0.22 a | |
| F36 | 14.46 ± 0.18 a | 15.72 ± 0.37 a | 11.63 ± 0.45 b | 11.11 ± 0.23 a | 11.05 ± 0.11 a | 8.76 ± 0.37 a | 8.50 ± 0.60 a | |
| C:P Ratio | G | 366.07 ± 2.62 a | 315.95 ± 13.95 a | 265.54 ± 7.77 a | 349.60 ± 6.96 a | 336.37 ± 4.13 a | 101.44 ± 3.97 b | 78.64 ± 4.09 b |
| F17 | 350.39 ± 2.16 b | 303.12 ± 12.07 a | 270.15 ± 6.77 a | 333.64 ± 5.09 a | 328.35 ± 5.51 a | 128.08 ± 2.84 a | 93.00 ± 2.42 b | |
| F36 | 322.80 ± 4.14 c | 298.13 ± 7.24 a | 254.28 ± 11.04 a | 312.59 ± 4.61 b | 310.96 ± 5.14 b | 124.57 ± 4.62 a | 100.90 ± 4.86 a | |
Publisher’s Note: MDPI stays neutral with regard to jurisdictional claims in published maps and institutional affiliations. |
© 2021 by the authors. Licensee MDPI, Basel, Switzerland. This article is an open access article distributed under the terms and conditions of the Creative Commons Attribution (CC BY) license (https://creativecommons.org/licenses/by/4.0/).
Share and Cite
Cong, S.; Zhou, D.; Li, Q.; Huang, Y. Effects of Fencing on Vegetation and Soil Nutrients of the Temperate Steppe Grasslands in Inner Mongolia. Agronomy 2021, 11, 1546. https://doi.org/10.3390/agronomy11081546
Cong S, Zhou D, Li Q, Huang Y. Effects of Fencing on Vegetation and Soil Nutrients of the Temperate Steppe Grasslands in Inner Mongolia. Agronomy. 2021; 11(8):1546. https://doi.org/10.3390/agronomy11081546
Chicago/Turabian StyleCong, Shan, Daowei Zhou, Qiang Li, and Yingxin Huang. 2021. "Effects of Fencing on Vegetation and Soil Nutrients of the Temperate Steppe Grasslands in Inner Mongolia" Agronomy 11, no. 8: 1546. https://doi.org/10.3390/agronomy11081546