Article

Effect of Barley Sowing Density on the Integrated Weed Management of Lolium rigidum (Annual Ryegrass) in Mediterranean Dryland: A Modeling Approach

by
María Belén D’Amico
1,*,
Guillermo R. Chantre
2,
Guillermo L. Calandrini
1,3 and
José L. González-Andújar
4
1
Departamento de Ingeniería Eléctrica y de Computadoras, Instituto de Investigaciones en Ingeniería Eléctrica “Alfredo Desages” (UNS-CONICET), Universidad Nacional del Sur, San Andrés 800, Bahía Blanca 8000, Argentina
2
Centro de Recursos Naturales Renovables de la Zona Semiárida (UNS-CONICET), Departamento de Agronomía, Universidad Nacional del Sur, San Andrés 800, Bahía Blanca 8000, Argentina
3
Departamento de Matemática, Universidad Nacional del Sur, Avda. Alem 1253, Bahía Blanca 8000, Argentina
4
Instituto de Agricultura Sostenible (CSIC), Avda. Menéndez Pidal s/n, 14040 Córdoba, Spain
*
Author to whom correspondence should be addressed.
Agronomy 2021, 11(8), 1565; https://doi.org/10.3390/agronomy11081565
Submission received: 8 June 2021 / Revised: 23 July 2021 / Accepted: 3 August 2021 / Published: 5 August 2021
(This article belongs to the Special Issue Weed Population Dynamics)

Abstract

:
Population models are particularly helpful for understanding long-term changes in the weed dynamics associated with integrated weed management (IWM) strategies. IWM practices for controlling L. rigidum are of high importance, mainly due to its widespread resistance that precludes chemical control as a single management method. The objective of this contribution is to simulate different IWM scenarios with special emphasis on the impact of different levels of barley sowing densities on L. rigidum control. To this effect, a weed–crop population model for both L. rigidum and barley life cycles was developed. Our results point out: (i) the necessity of achieving high control efficiencies (>99%), (ii) that the increase of twice the standard sowing density of barley resulted in a reduction of 23.7% of the weed density, (iii) non-herbicide-based individual methods, such as delayed sowing and weed seed removal at harvest, proved to be inefficient for reducing drastically weed population, (iv) the implementation of at least three control tactics (seed removal, delay sowing and herbicides) is required for weed infestation eradication independently of the sowing rate, and (v) the effect of an increase in the sowing density is diluted as a more demanding weed control is reached. Future research should aim to disentangle the effect of different weed resistance levels on L. rigidum population dynamics and the required efficiencies for more sustainable IWM programs.

1. Introduction

Barley (Hordeum vulgare L.) is a major cereal grain grown globally in temperate climates, and it is mostly used as feed for animals, malt, and food for human consumption. The annual world harvest of barley in the late century was approximately 140 million tons from about 55 million ha [1]. Barley yield is seriously affected by weeds, especially by annual ryegrass (Lolium rigidum Gaudin) in Mediterranean climates. Yield losses in cereal crops due to L. rigidum competition can reach up to 80% depending on the season and infestation level [2]. Its high seed production [3], high genetic variability [4], and high seed banks [5] facilitate the long-term survival of this weed species. Its control relies heavily on herbicides and, as a consequence, L. rigidum has evolved resistance to various herbicide groups [6].
Integrated weed management (IWM) practices for controlling L. rigidum are of high importance mainly due to its widespread resistance that precludes chemical control as a single management method [7]. Among the different control practices, crop competition remains one of the most economically desirable and environmentally sustainable methods for weed suppression [8]. Crop competitive ability could be improved by an increment of sowing density, limiting soil water and nutrient availability as well as PAR interception for weed species. A weed biomass suppression of 45% was obtained by doubling sowing density in winter cereal crops [9]. High sowing rates in both wheat and barley reduced L. rigidum biomass as well as individuals’ fecundity [8,10,11]. Lemerle et al. [12] observed that wheat yield loss due to weed competition declined from 23 to 17% when crop sowing rate increased from 50 to 100 kg/ha in Western Australia. Similar results were obtained by Izquierdo et al. [2] which registered L. rigidum biomass reductions of 15 and 29% when the sowing rate of different barley cultivars increased by 50 and 100%, respectively.
However, as stated by Izquierdo et al. [2], more studies are required to address if such relationships are consistent among different sites and years under Mediterranean conditions. The confirmation of such relationships would be very useful from an IWM perspective as it would allow estimating weed biomass suppression level as a function of crop density increase. Interestingly, the same authors observed that an increment in crop sowing density did not reduce yield losses in barley.
Mathematical models providing information about L. rigidum dynamics demonstrated to be useful for predicting field emergence and spatial distribution as well as for testing different management strategies [13,14,15,16,17,18]. In particular, the population model proposed by González-Andújar and Fernández-Quintanilla [13] permits us to predict the actual population density based on its value in the previous year and the progress of the species during its different life-cycle stages. Based on this model, the performance of different control strategies for L. rigidum was formalized by D’Amico et al. [15]. Analytical results related to the long-term behavior of the species showed that the population could not reach extinction by applying an individual control action in the field. In fact, the use of IWM strategies is of critical importance towards a sustainable long-term management of L. rigidum [19].
The objective of the present contribution is to simulate and analyze different IWM scenarios with special emphasis on the impact of different levels of barley sowing densities on L. rigidum control. To this effect, a weed–crop population model based on the integration of both L. rigidum and barley life cycles was developed.

2. Materials and Methods

The proposed model consists of two population submodels connected by means of interspecific competition (Figure 1). The mathematical formulation for L. rigidum is based on the annual life-cycle model developed by González-Andújar and Fernández-Quintanilla [13]. The model for barley corresponds to a typical semelparous species behavior [20]. Regarding IWM scenarios, different management practices are introduced along the different L. rigidum phenological stages and their impacts are quantified by using sensitivity indices and information related to the long-term population dynamics of both weed and barley.

2.1. Lolium Rigidum Submodel

The L. rigidum life-cycle model was divided into stages (Figure 1) following the approach of González-Andújar and Fernández-Quintanilla [13].
For a year t, the seed bank is composed of the seed stored in the soil from previous years (still viable) plus the new seed R l , t 1 entering in the soil at year t − 1. This amount per unit area (seed m−2) is
S B l , t = ( 1 e l ) ( 1 m l ) S B l , t 1 + R l , t 1 ,
where e l is the proportional emergence and m l is the proportional seed bank mortality.
The number of seedlings (plants m−2) emerged in year t is proportional to the seed bank as well as to the control actions considered at that stage. Thus,
Z l , t = e l ( 1 c h ) ( 1 c b d ) S B l , t ,
where c h and c b d represent the proportions of seedlings suppressed by the application of selective herbicides and the use of barley delayed sowing action, respectively. This last tactic implies that the sowing date is delayed as to facilitate the weed suppression [21].
The population density of adult plants (plants m−2) depends on the rate of seedling survival s l so that
M l , t = s l Z l , t .
Each of these adult plants produces a number of seed given by
F l , t = ( 1 c b c ) f l 1 + a l M l , t ,
where f l is the fecundity of an isolated plant (seed plant−1) and a l is the area required to produce the f l seed. The density-dependent function on M l , t represents the intraspecific competition while parameter c b c stands for the fractional reduction provoked by the interspecific competition of the barley crop. This last effect varies according to the barley sowing density chosen annually.
The total seed production (seed m−2) at year t is
S l , t = F l , t M l , t
and the effective fraction entering to the seed bank is defined as
R l , t = ( 1 l l ) ( 1 c c ) S l , t ,
Where l l indicates the proportion of newly produced seed that is lost due to biotic factors and c c is the fractional reduction caused by the action of weed seed removal at harvest.

2.2. Barley Submodel

The barley life-cycle model starts with the sowing and ends with the grain harvest (Figure 1). Since seed are fully harvested year after year, the seed bank at year t is directly modeled as S b , t = S B where S B is the number of seed sown per m2. The next two stages behave proportionally with respect to the sowing. So, seedlings emergence per unit area (seedlings m−2) are
Z b , t = e b S b , t ,
with e b is the proportional emergence, and the adult plants per unit area (plants m−2) are
M b , t = s b Z b , t ,
with s b as the rate of seedling survival.
The effect of the interspecific competition caused by L. rigidum is represented in the barley fecundity stage. Each plant produces a given seed amount which depends on M l , t in the form
F b , t = f b ( 1 r z M l , t 1 + r z r i M l , t ) ,
where f b are the seed produced by an individual barley plant without the weed. In this density-dependent function, r z stands for the proportional decrease originated by M l , t when it goes to zero and r i is the fecundity reduction when M l , t . Thus, the total seed production (seeds m−2) of the barley crop at year t is
S b , t = F b , t M b , t .

2.3. Weed–Crop System Analysis

Different factors and sensitivity indices are used to evaluate the long-term effects of the control decisions and, specifically, the barley sowing rate on the weed population behavior and the crop yield. For that purpose, control actions are first summarized as an equivalent efficiency given by ( 1 c ) = ( 1 c h ) ( 1 c ) b d ( 1 c c ) facilitating the analysis for all the possible combinations.
Depending on the weed parameters, there exists a critical c value defined as
c 0 = 1 e l + m l ( 1 e l ) e l f l s l ( 1 l l ) ( 1 c b c ) ,
which permits us to determine if the IWM programs can achieve (or not) weed extinction in the long-term horizon [15]. In particular, if a specific program results in an equivalent efficiency value such that c c 0 , then the adult L. rigidum population goes to the extinction. Howeover, if the equivalent efficiency verifies that c < c 0 , then the population reaches an equilibrium level (plants m−2) that is calculated as
M l , = m l + e l [ 1 m l f l s l ( 1 l l ) ( 1 c ) ( 1 c b c ) ] a l [ e l ( m l 1 ) m l ] ,
with a growth rate λ < 1 that is adequately estimated by means of
λ = M l , t M l , t 1 | M l , t 1 = M l , .
The sensitivity index of the infestation level (Equation (12)) to variations in the crop competition c b c is specifically calculated. By considering the derivative-based method,
S I M l = M l , c b c c b c M l , .
This index determines if the variation of c b c originated by a change in the sowing density can cause a large modification in the L. rigidum population level achieved by a determined IWM program.
In the absence of weeds, the barley production would present its maximum level of S b , max = e b s b f b S B . Under a L. rigidum infestation, the barley submodel (Equations (7)–(10)) shows that S b , t is lower than S b , max . To quantify the decrease on the barley crop, the sensitivity index to L. rigidum is also considered. This is obtained by using again the derivative-based method, i.e.
S I S b = S b , t M l , t M l , t S b , t .
Another useful factor is the long-term relative production of the crop respect to the maximum S b , max . Based on the barley equations (Equations (7)–(10)) and considering that the L. rigidum population has reached its equilibrium level, the respective formula in percentage is given by
R P b = ( 1 r z M l 1 + r z r i M l ) 100 .
This expression combined with the infestation level M l , (Equation (12)) permit us to directly relate the barley production with the interspecific competition c b c and the different control actions represented by c.

2.4. Simulation Condition and Parameter Values

An initial L. rigidum seed bank of 10 seed m−2 is considered. For barley, two sowing densities, 500 seed m−2 (160 kg ha−1; standard) and 1000 seed m−2 (350 kg ha−1; high) are chosen. The complete weed–crop system is run over a 10-year simulation horizon which is long enough to evaluate long-term dynamic trends. Parameters values on average were obtained from the literature and unpublished data on barley production in central Spain (Table 1).

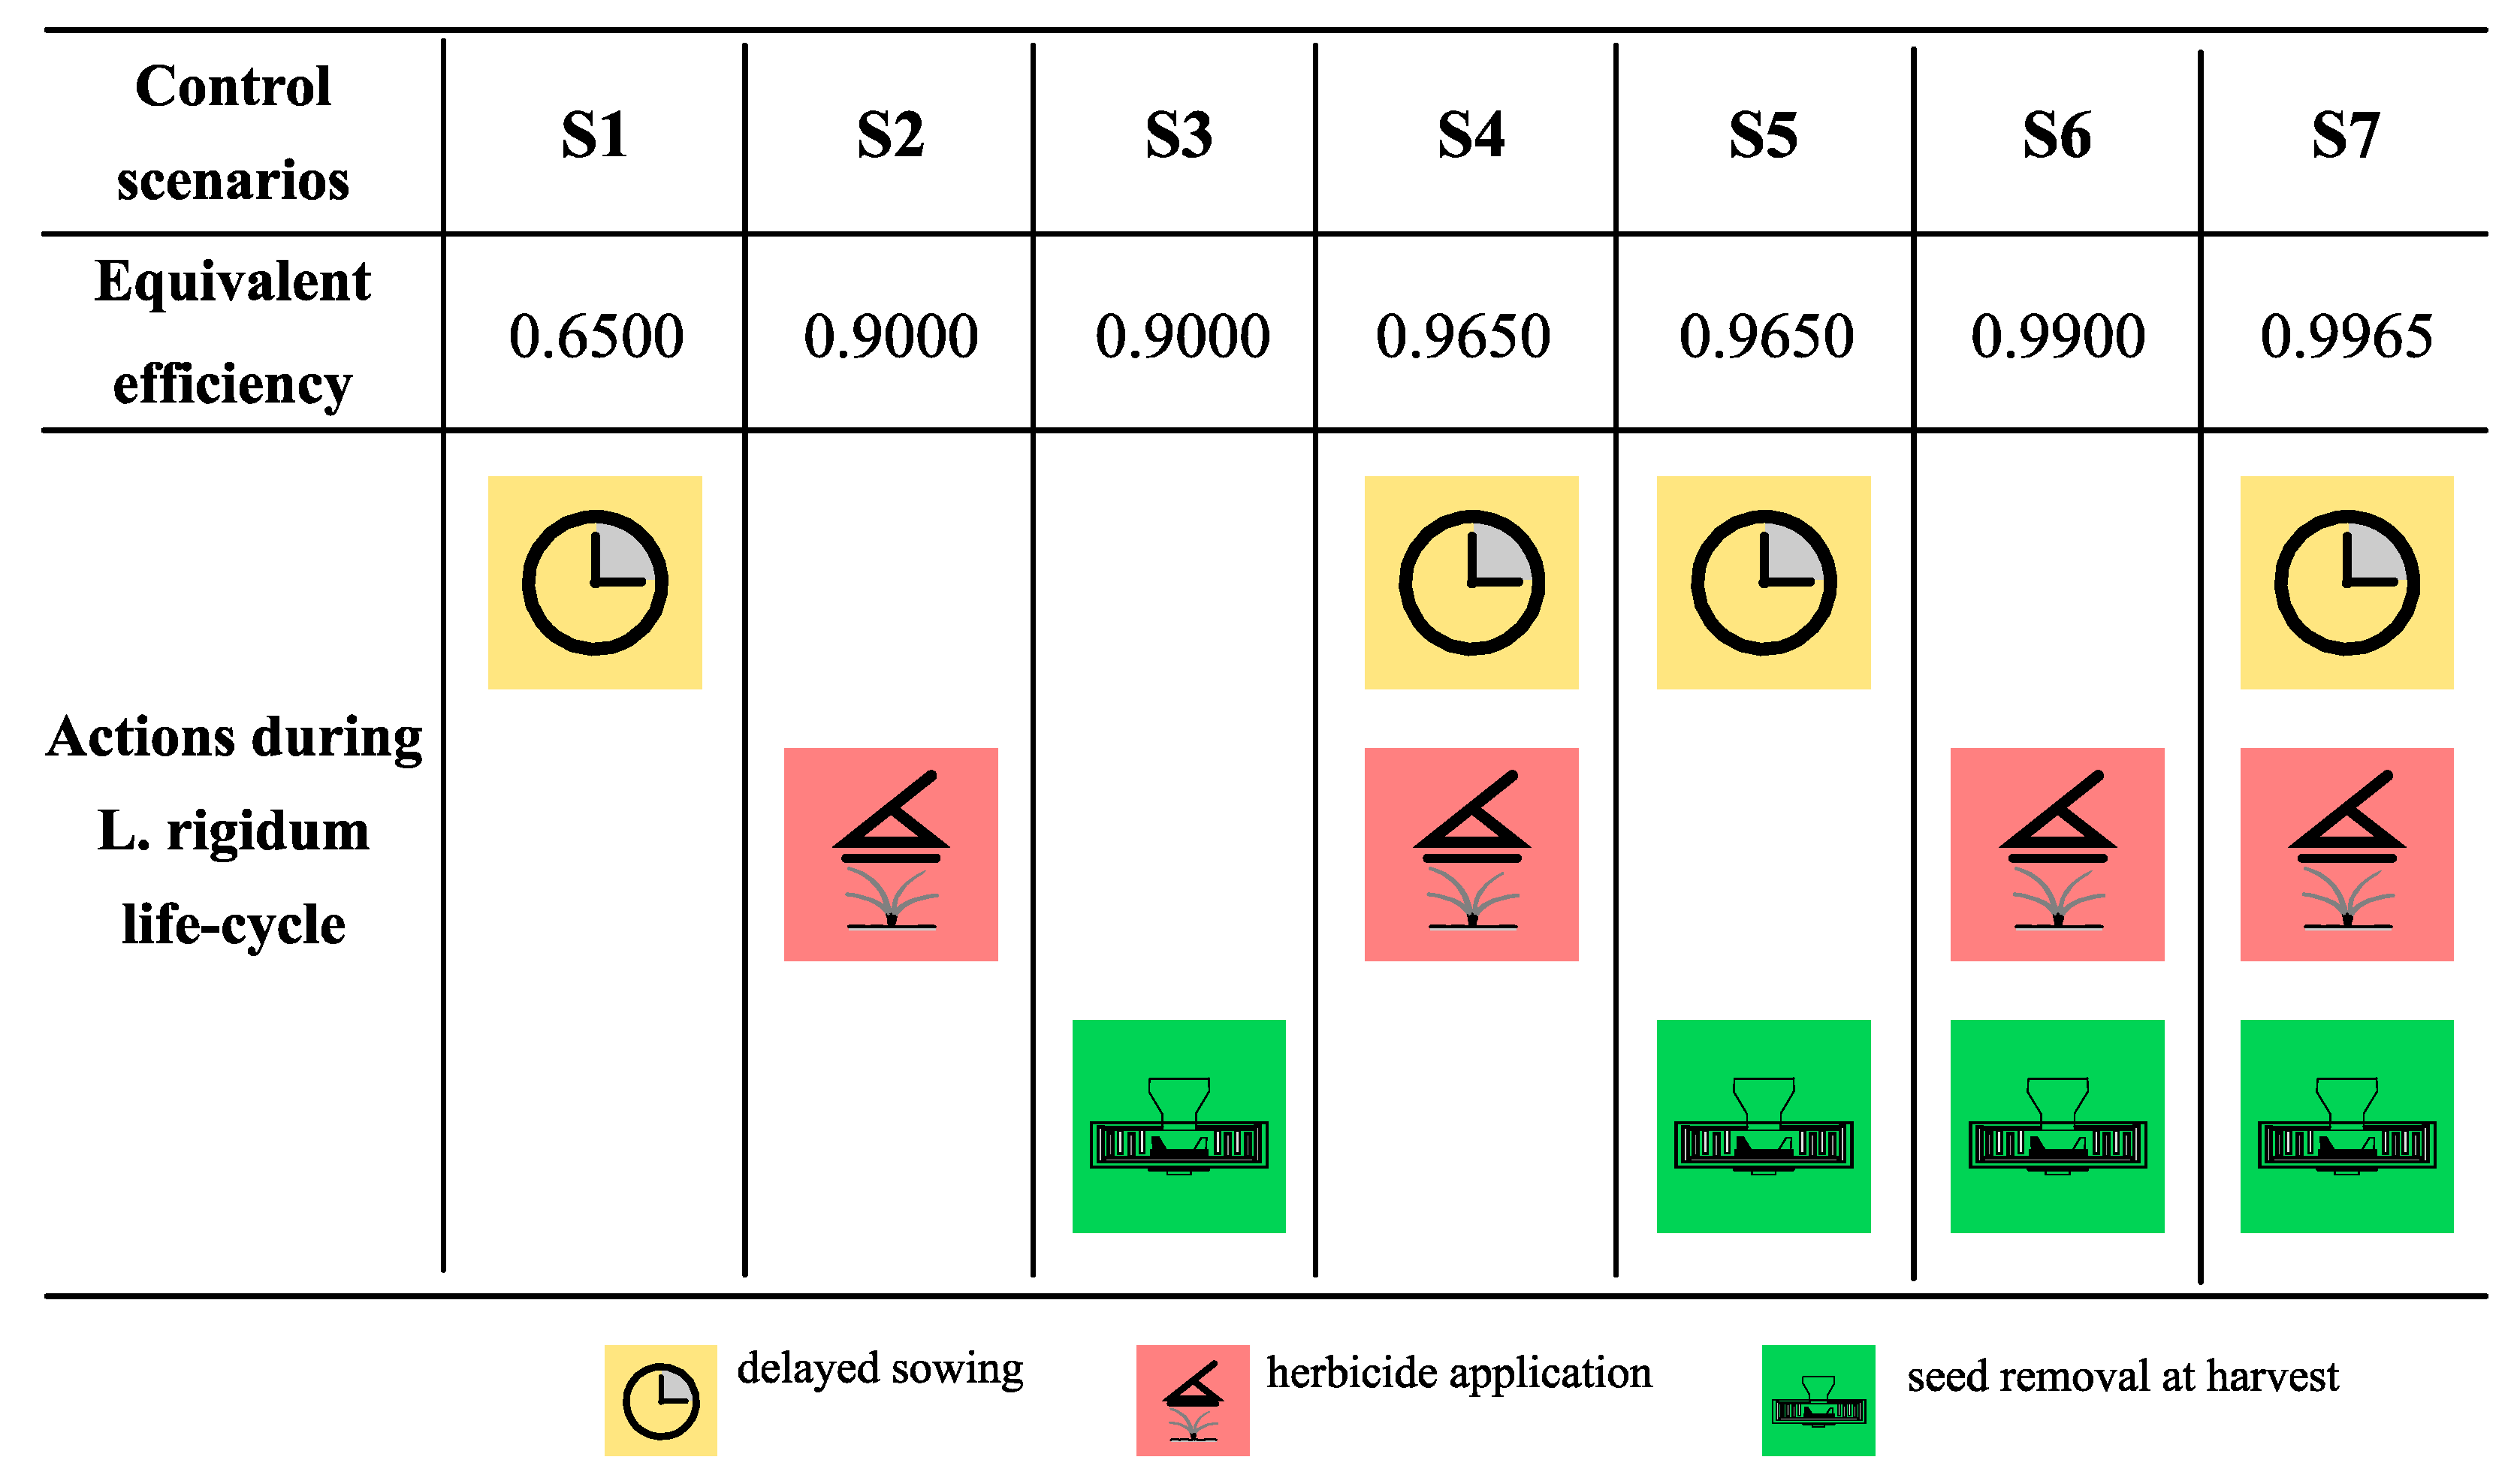
2.5. Control Programs

Both individual and integrated control strategies are considered (S1–S7; Figure 2). Besides the classical herbicide-based method, other alternatives implying the use of nonchemical practices are analyzed. All these scenarios incorporate the possibility of choosing standard or high crop sowing densities as an additional control alternative. Programs are organized so that the equivalent efficiency c increases gradually from S1 to S7. Although S2 and S3 present the same efficiency value (Table 1), they are intentionally individualized since herbicides and harvest seed removal affect the weed seed bank differently. The same phenomenon applies to the S4 and S5 control scenarios.

3. Results

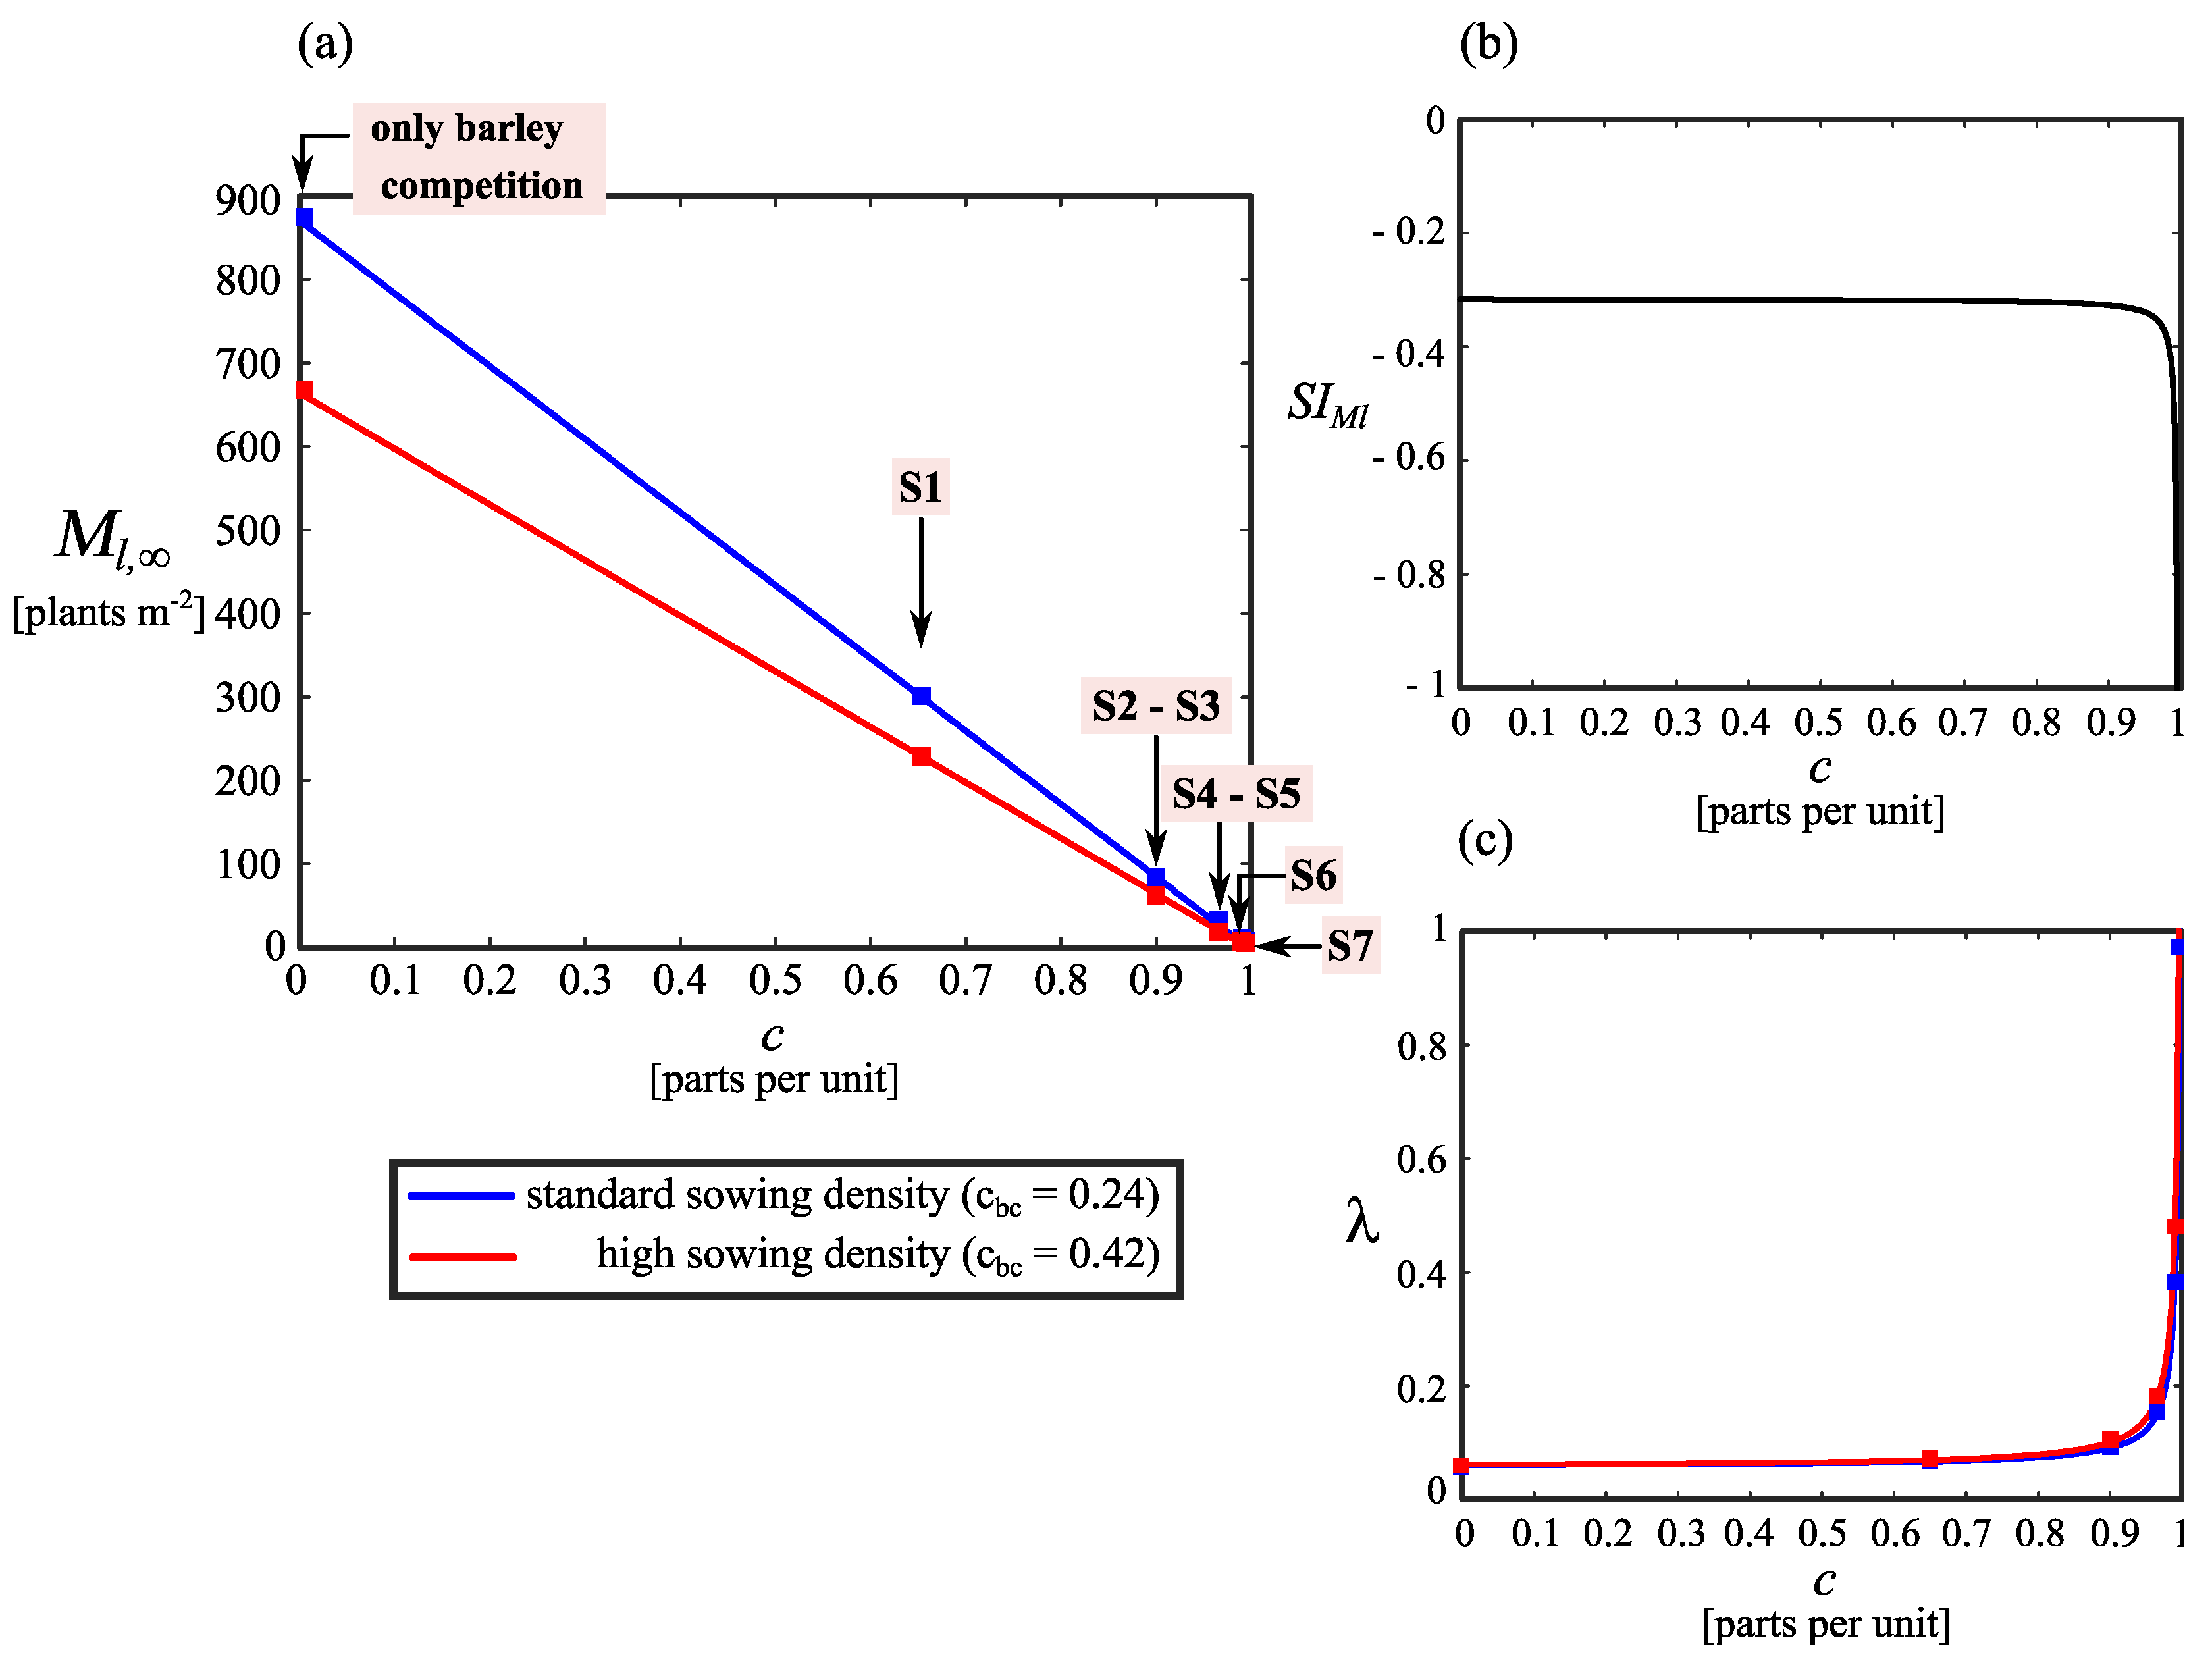
3.1. Lolium Rigidum Control

According to the proposed model, a control program needs to achieve a minimum efficiency (Equation (11)) of c 0 = 0.9966 in the case of a standard barley sowing density ( c b c = 0.24 ) and c 0 = 0.9955 in the case of a high barley sowing density ( c b c = 0.42 ) to reach the ‘theoretical eradication’ of L. rigidum in the ten year horizon. Such efficiencies indicate that only the management scenario composed of control program S7 ( c = 0.9965 ) combined with a high sowing density could lead to the extinction of L. rigidum, at least, in theory. The rest of the proposed scenarios (Figure 2) are unable to avoid the weed population build up reaching a determined long-term equilibrium.
In the absence of control actions, the weed population achieves a maximum of 871 and 664 plants m−2 when barley is sown at standard and high density, respectively (Table 2). In both cases, infestation levels are further reduced when programs S1−S7 are adopted. Long-term levels (Equation (12)) go proportionately from 303 to 0.12 plants m−2 in the standard sowing scenario (blue squares; Figure 3a) and from 230 plants m−2 to the theoretical eradication in the high sowing scenario (red squares; Figure 3a). Comparing the weed populations for both scenarios, the percentage of reduction caused by doubling the barley sowing density notably increases when programs S4–S7 are used (Table 2).
The sensitivity index S I M l (Equation (14)) is practically equal to −0.32 for control efficiencies equal or lower than 0.9 while it goes abruptly to −1 for control efficiencies greater than 0.90 (Figure 3b). This result corroborates the fact that the control effect of the sowing density depends on the efficiency of the rest of the control actions (Figure 3a). Specifically, changes in the barley sowing density produce the same moderate weed control impact over programs S1−S3. However, that decision provoked marked differences over control programs S4−S7. The point is that barley competition greatly influences L. rigidum when highly efficient control actions are used. Therefore, the increase of barley sowing density as a cultural action does not allow us to reduce the efficiency or the number of IWM practices.
The weed population growth rate (Equation (13)) presents a similar dependence on the control actions. This rate is practically constant for control efficiencies lower than 0.90 while it increases sharply for control efficiencies greater than 0.90 (Figure 3c). For control programs S1−S3, the λ values are almost the same, keeping below 0.1, and they do not manifest differences concerning the sowing density options. This implies that M l , t goes to the equilibrium with a predominantly fast rise dynamic. However, for control programs S4−S7, the λ presents pronounced variations according to the control or the sowing density increase. The tendency is a population response becoming progressively slower as c closes to 1 and the barley crop is sowed at a high density.

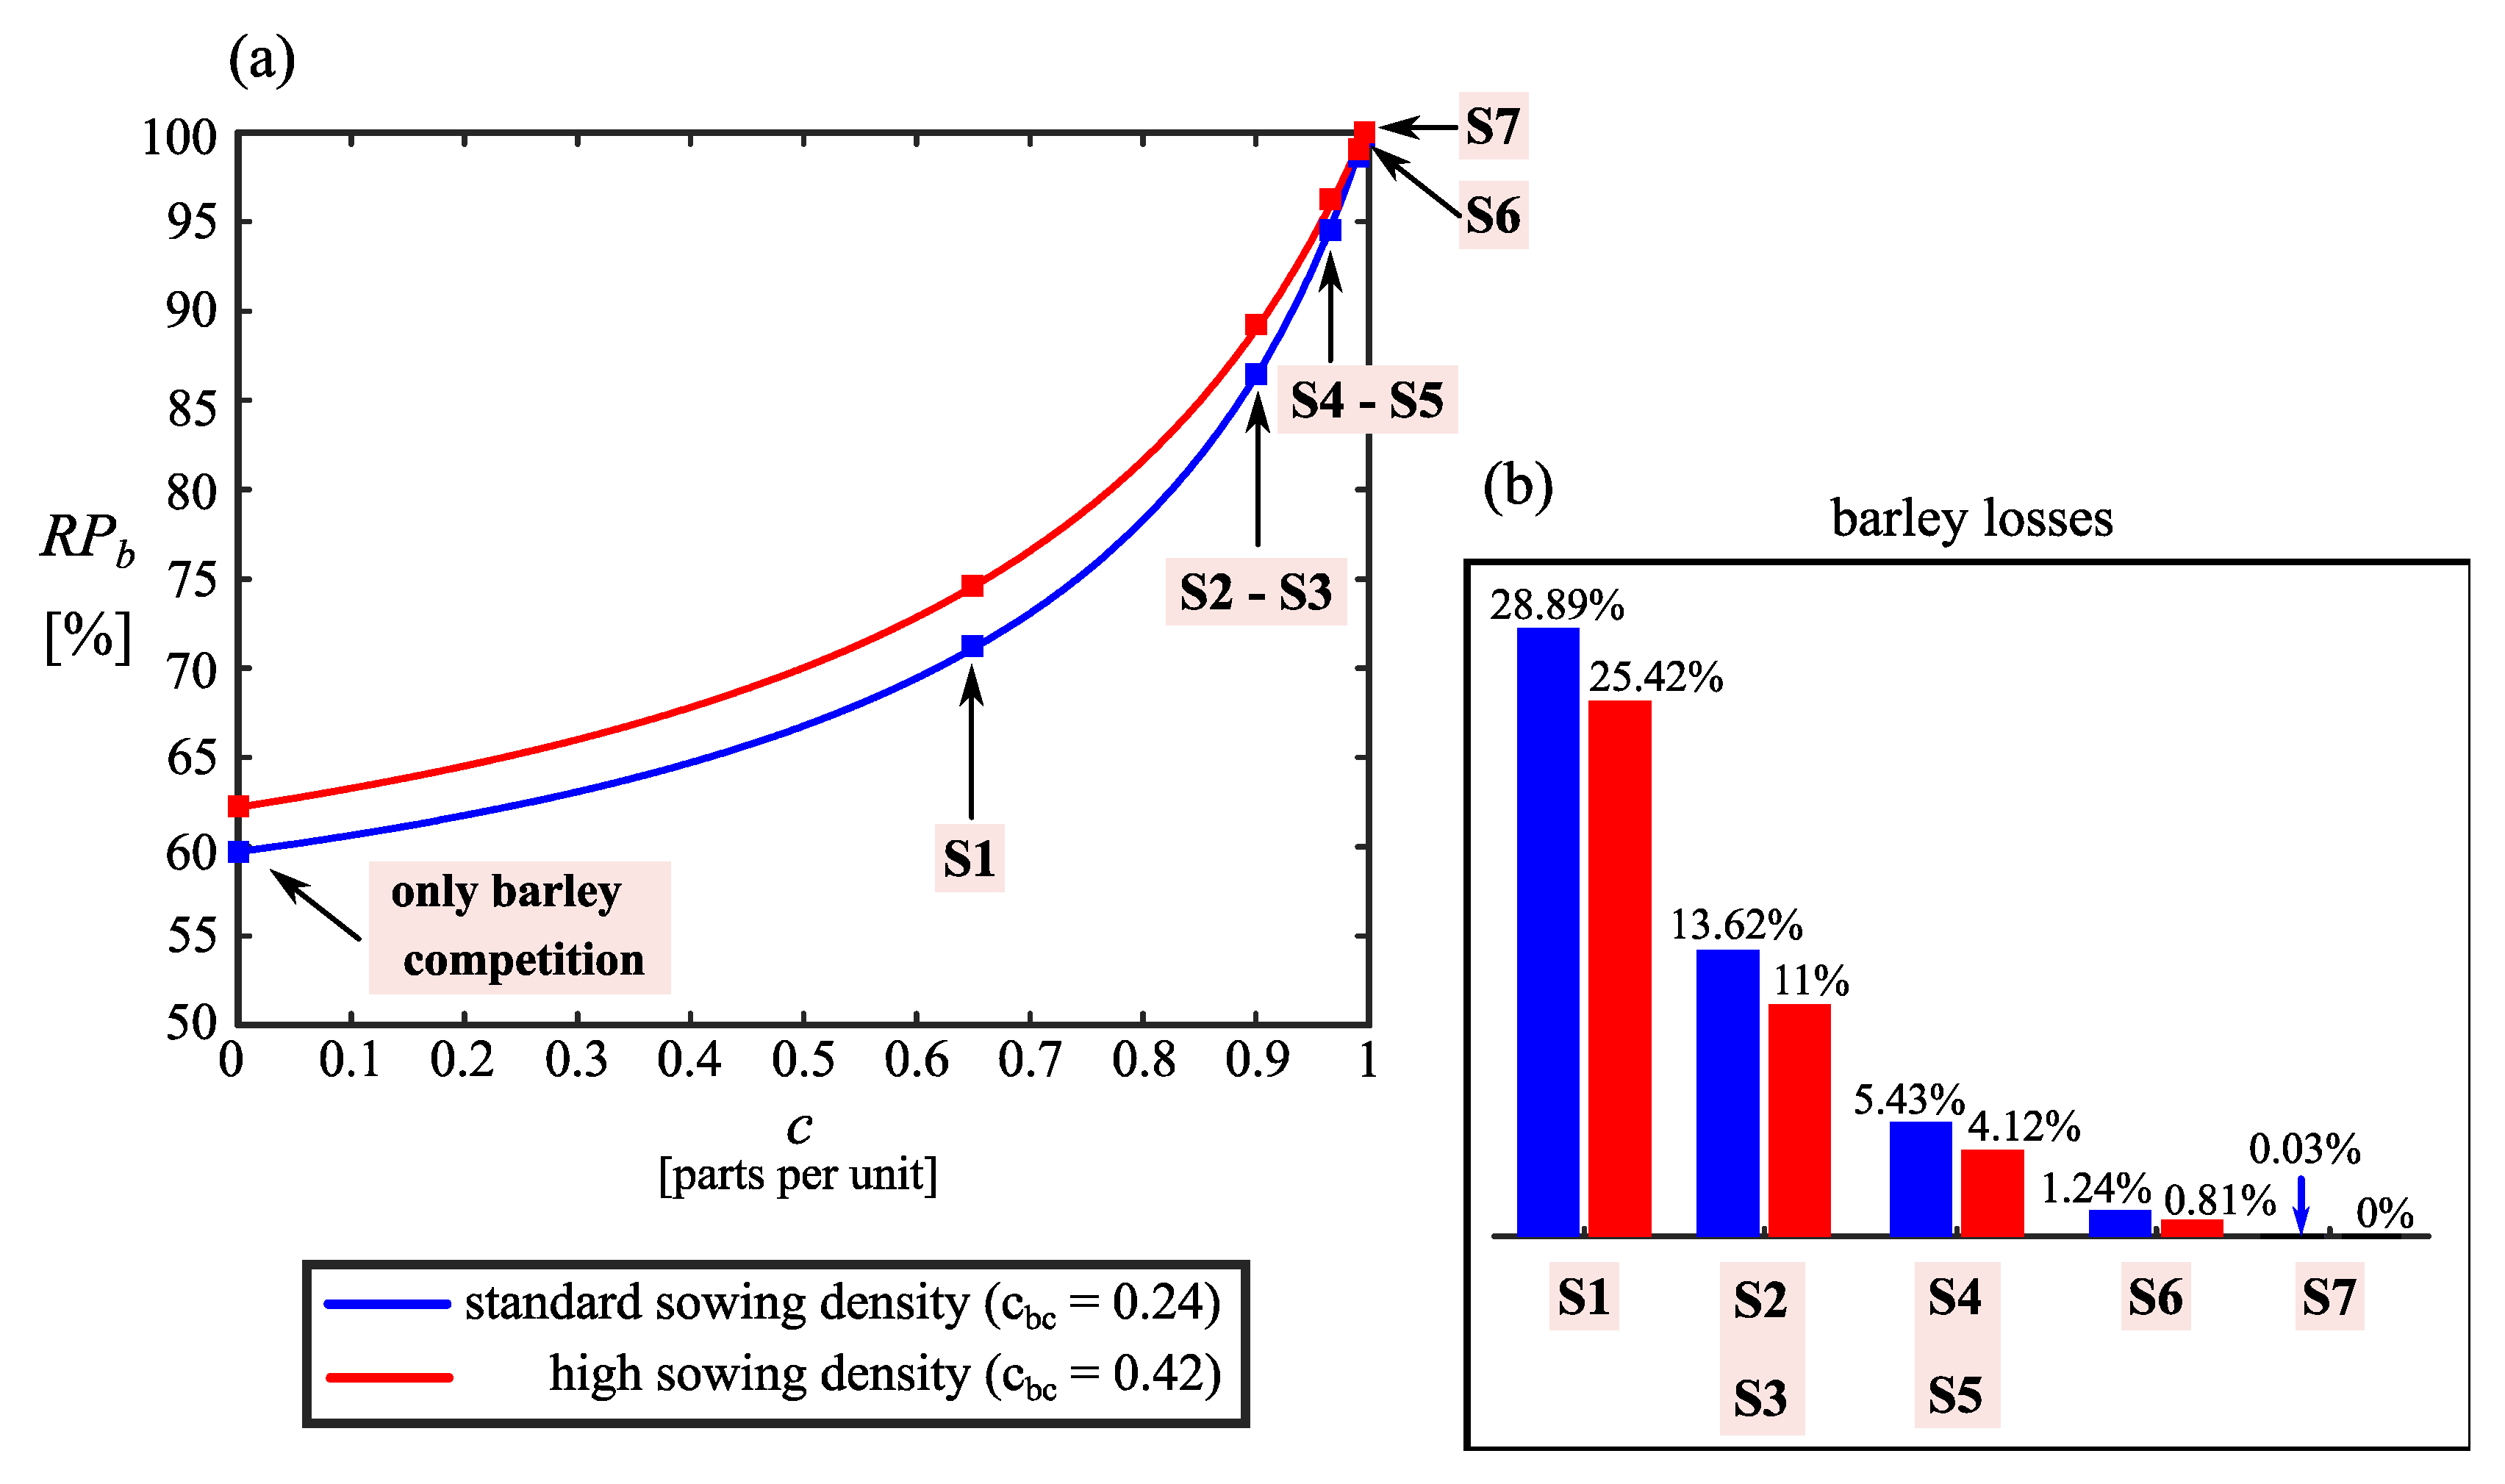
3.2. Impact on the Barley Seed Production

The proposed model also permits us to estimate the crop yield while taking the behavior of the weed population into account. Barley seed production can reach a maximum of 6900 seed m−2 (2760 kg ha−1) or 13,800 seed m−2 (5520 kg ha−1) depending on whether a standard or high sowing density is adopted. However, as expected, L. rigidum infestations can substantially reduce barley yield. The barley sensitivity index ( S I S b ) indicates that the highest reductions occur when the weed population is between 300 and 900 plants m−2 since it keeps close to a mean value of −0.17 without showing significant differences (Figure 4). Conversely, when the weed population is <300 plants m−2, the S I S b curve decreases to zero (as the weed density is reduced) evidencing a potential increment on barley yield. In particular, for the long-term infestation levels achieved by control programs S1−S3 (which reduce L. rigidum density from 303 to 64 plants m−2; Figure 3a), S I S b varies from −0.17 to −0.1, projecting a moderate increase on barley yield. For control programs S4−S7, the worst case of long-term infestation is given by 28 plants m−2 and S I S b values are appreciably smaller (from −0.051 to 0). As a consequence, the barley yield is marginally influenced by the weed population level, maintaining close to the maximum value. This result reinforces the previous concept that high L. rigidum sensitivity to barley sowing density (Figure 3b) occurs when long-term weed infestation levels are appreciably low due to the high efficiency control methods. Therefore, any potential benefit associated with an increment on barley sowing density is finally diluted on the yield component.
The relative production (Equation (16)) reached by the barley crop in the long-term horizon permits us quantifying these effects more precisely (Figure 5). As it is expected, R P b approaches 100% as the efficiencies of the control actions are increased. However, in consonance with the information given by the sensitivity indices, results corresponding to high sowing density (red curve; Figure 5a) tend to be closer to those corresponding to standard sowing density (blue curve; Figure 5a) as the IWM programs are more exigent. This fact is also observed in the production losses (Figure 5b), where differences between standard and high sowing densities are evident for programs S1−S3 consisting of individual actions. The improvement introduced by the high sowing density in the barley crop using, for example, control program S1 is around 3.47%. However, the improvement caused by the incorporation of another action (defining programs S4 or S5) but maintaining the standard density is 20% higher.

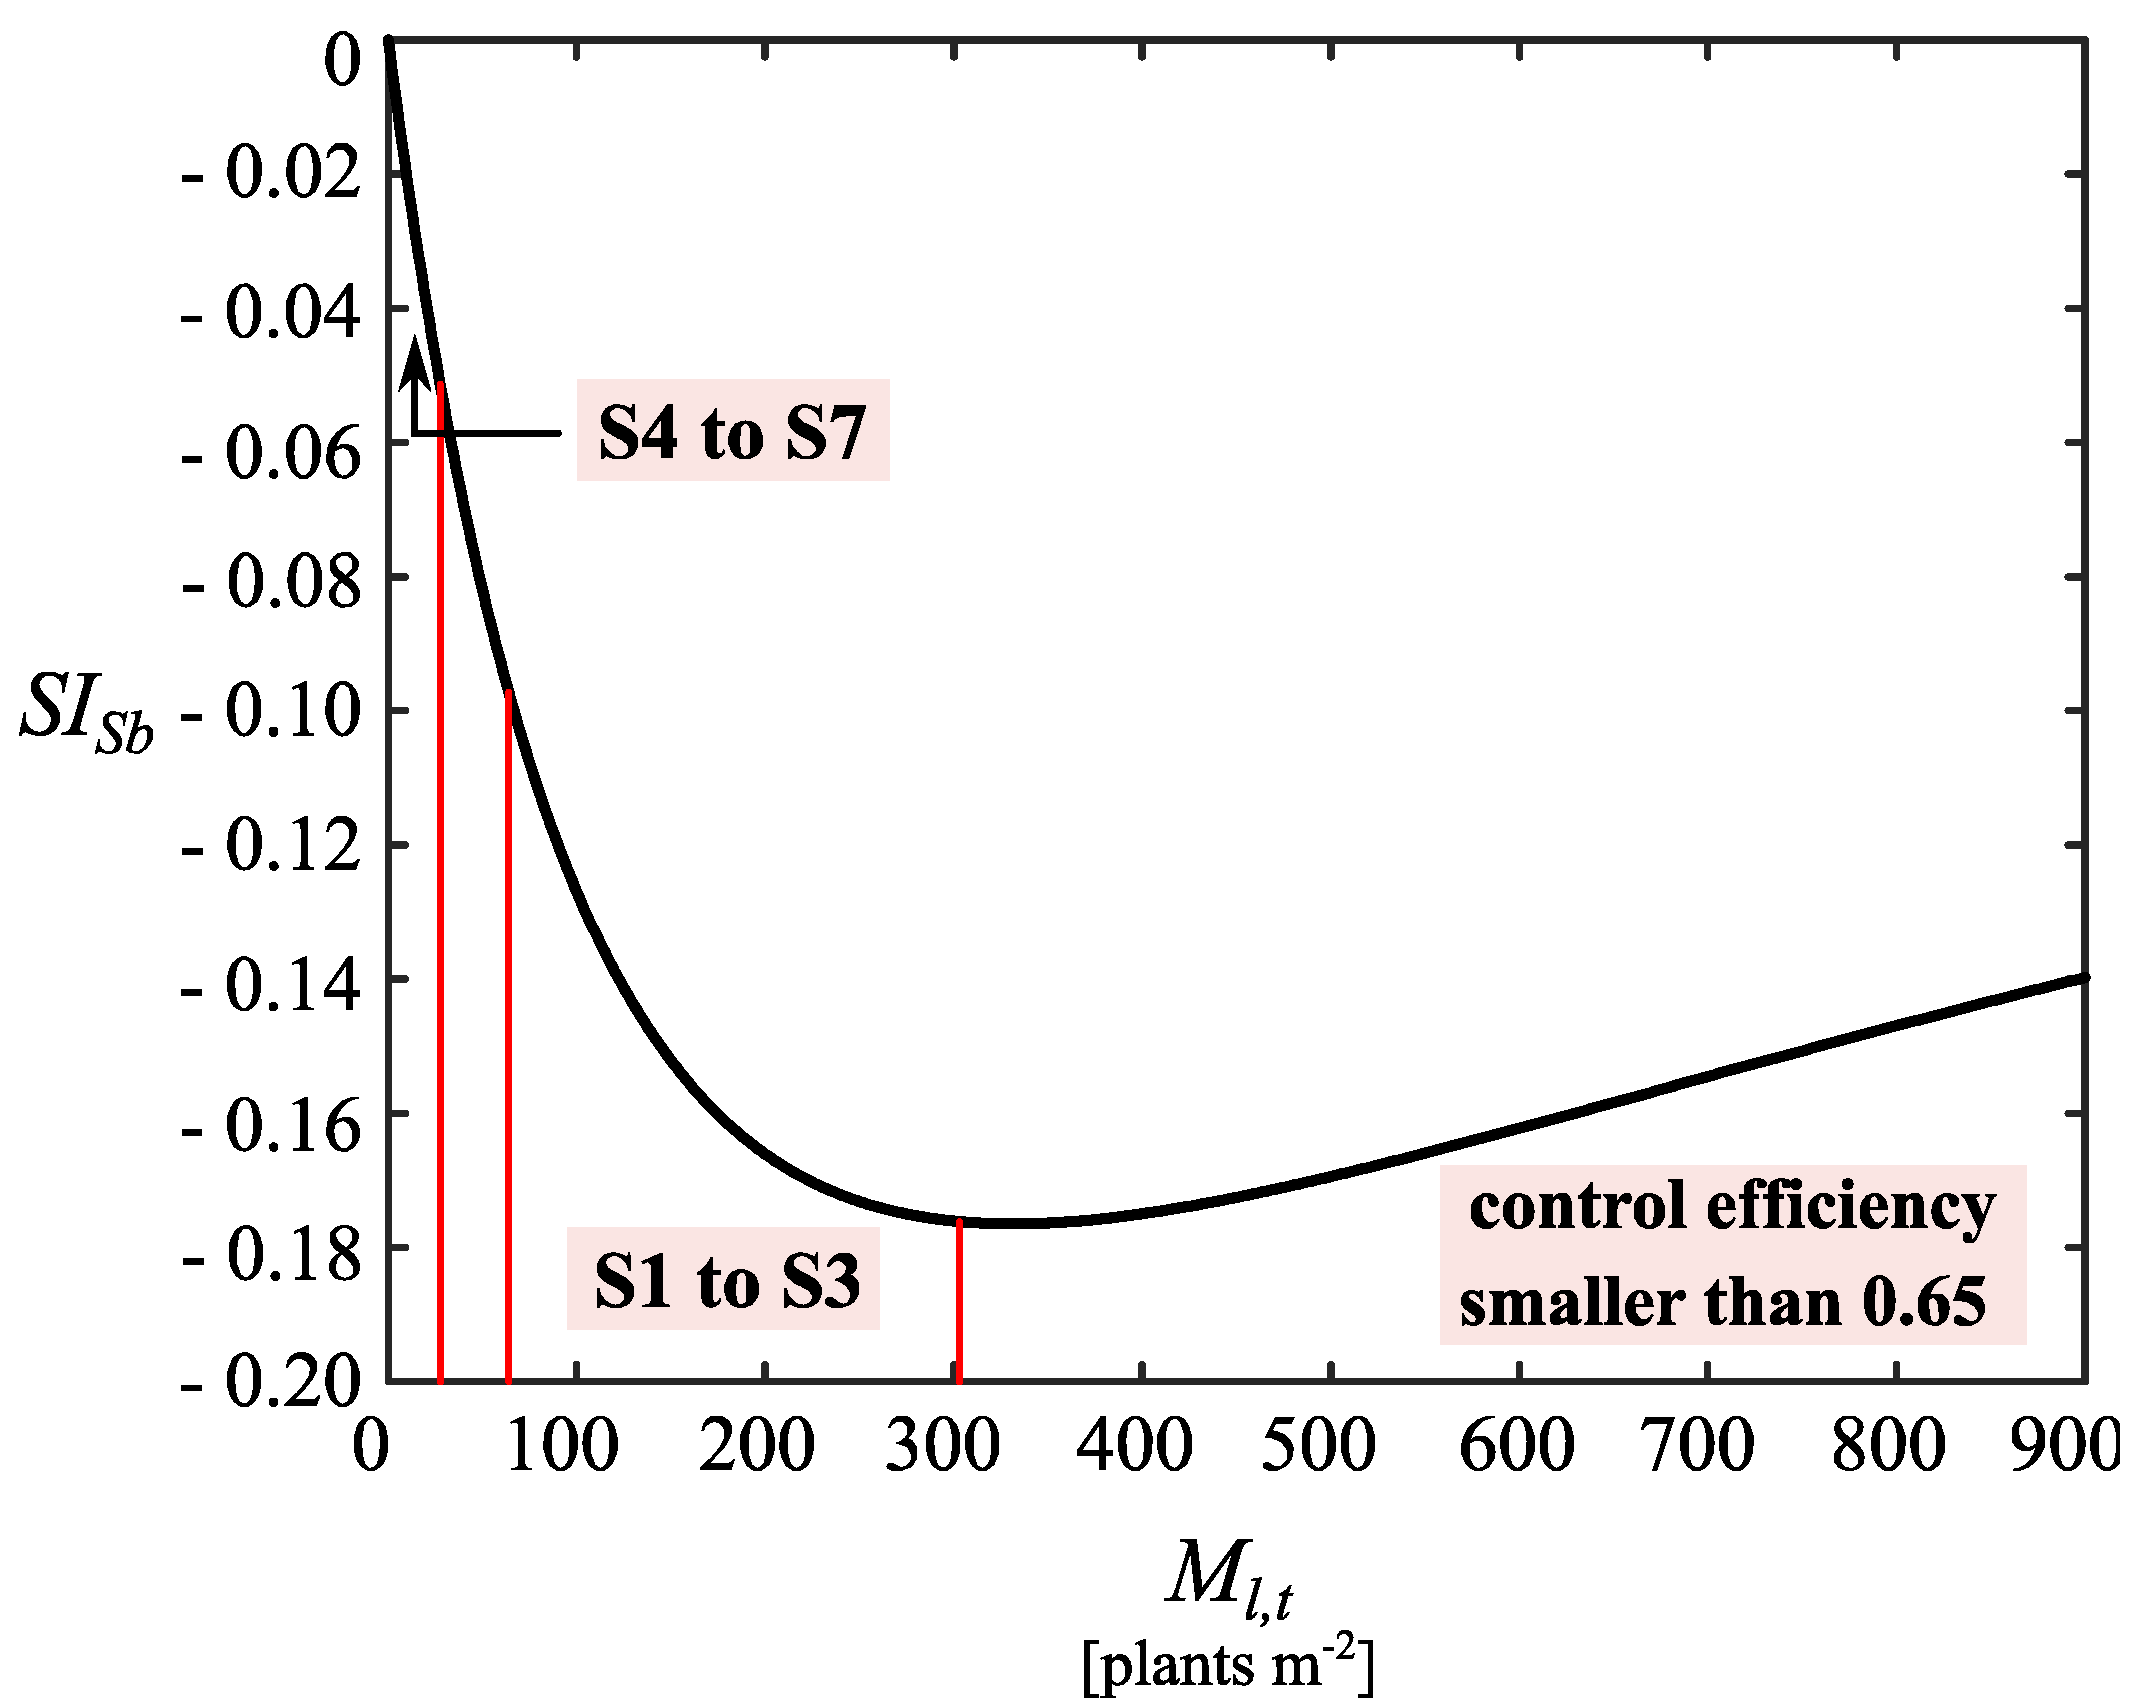
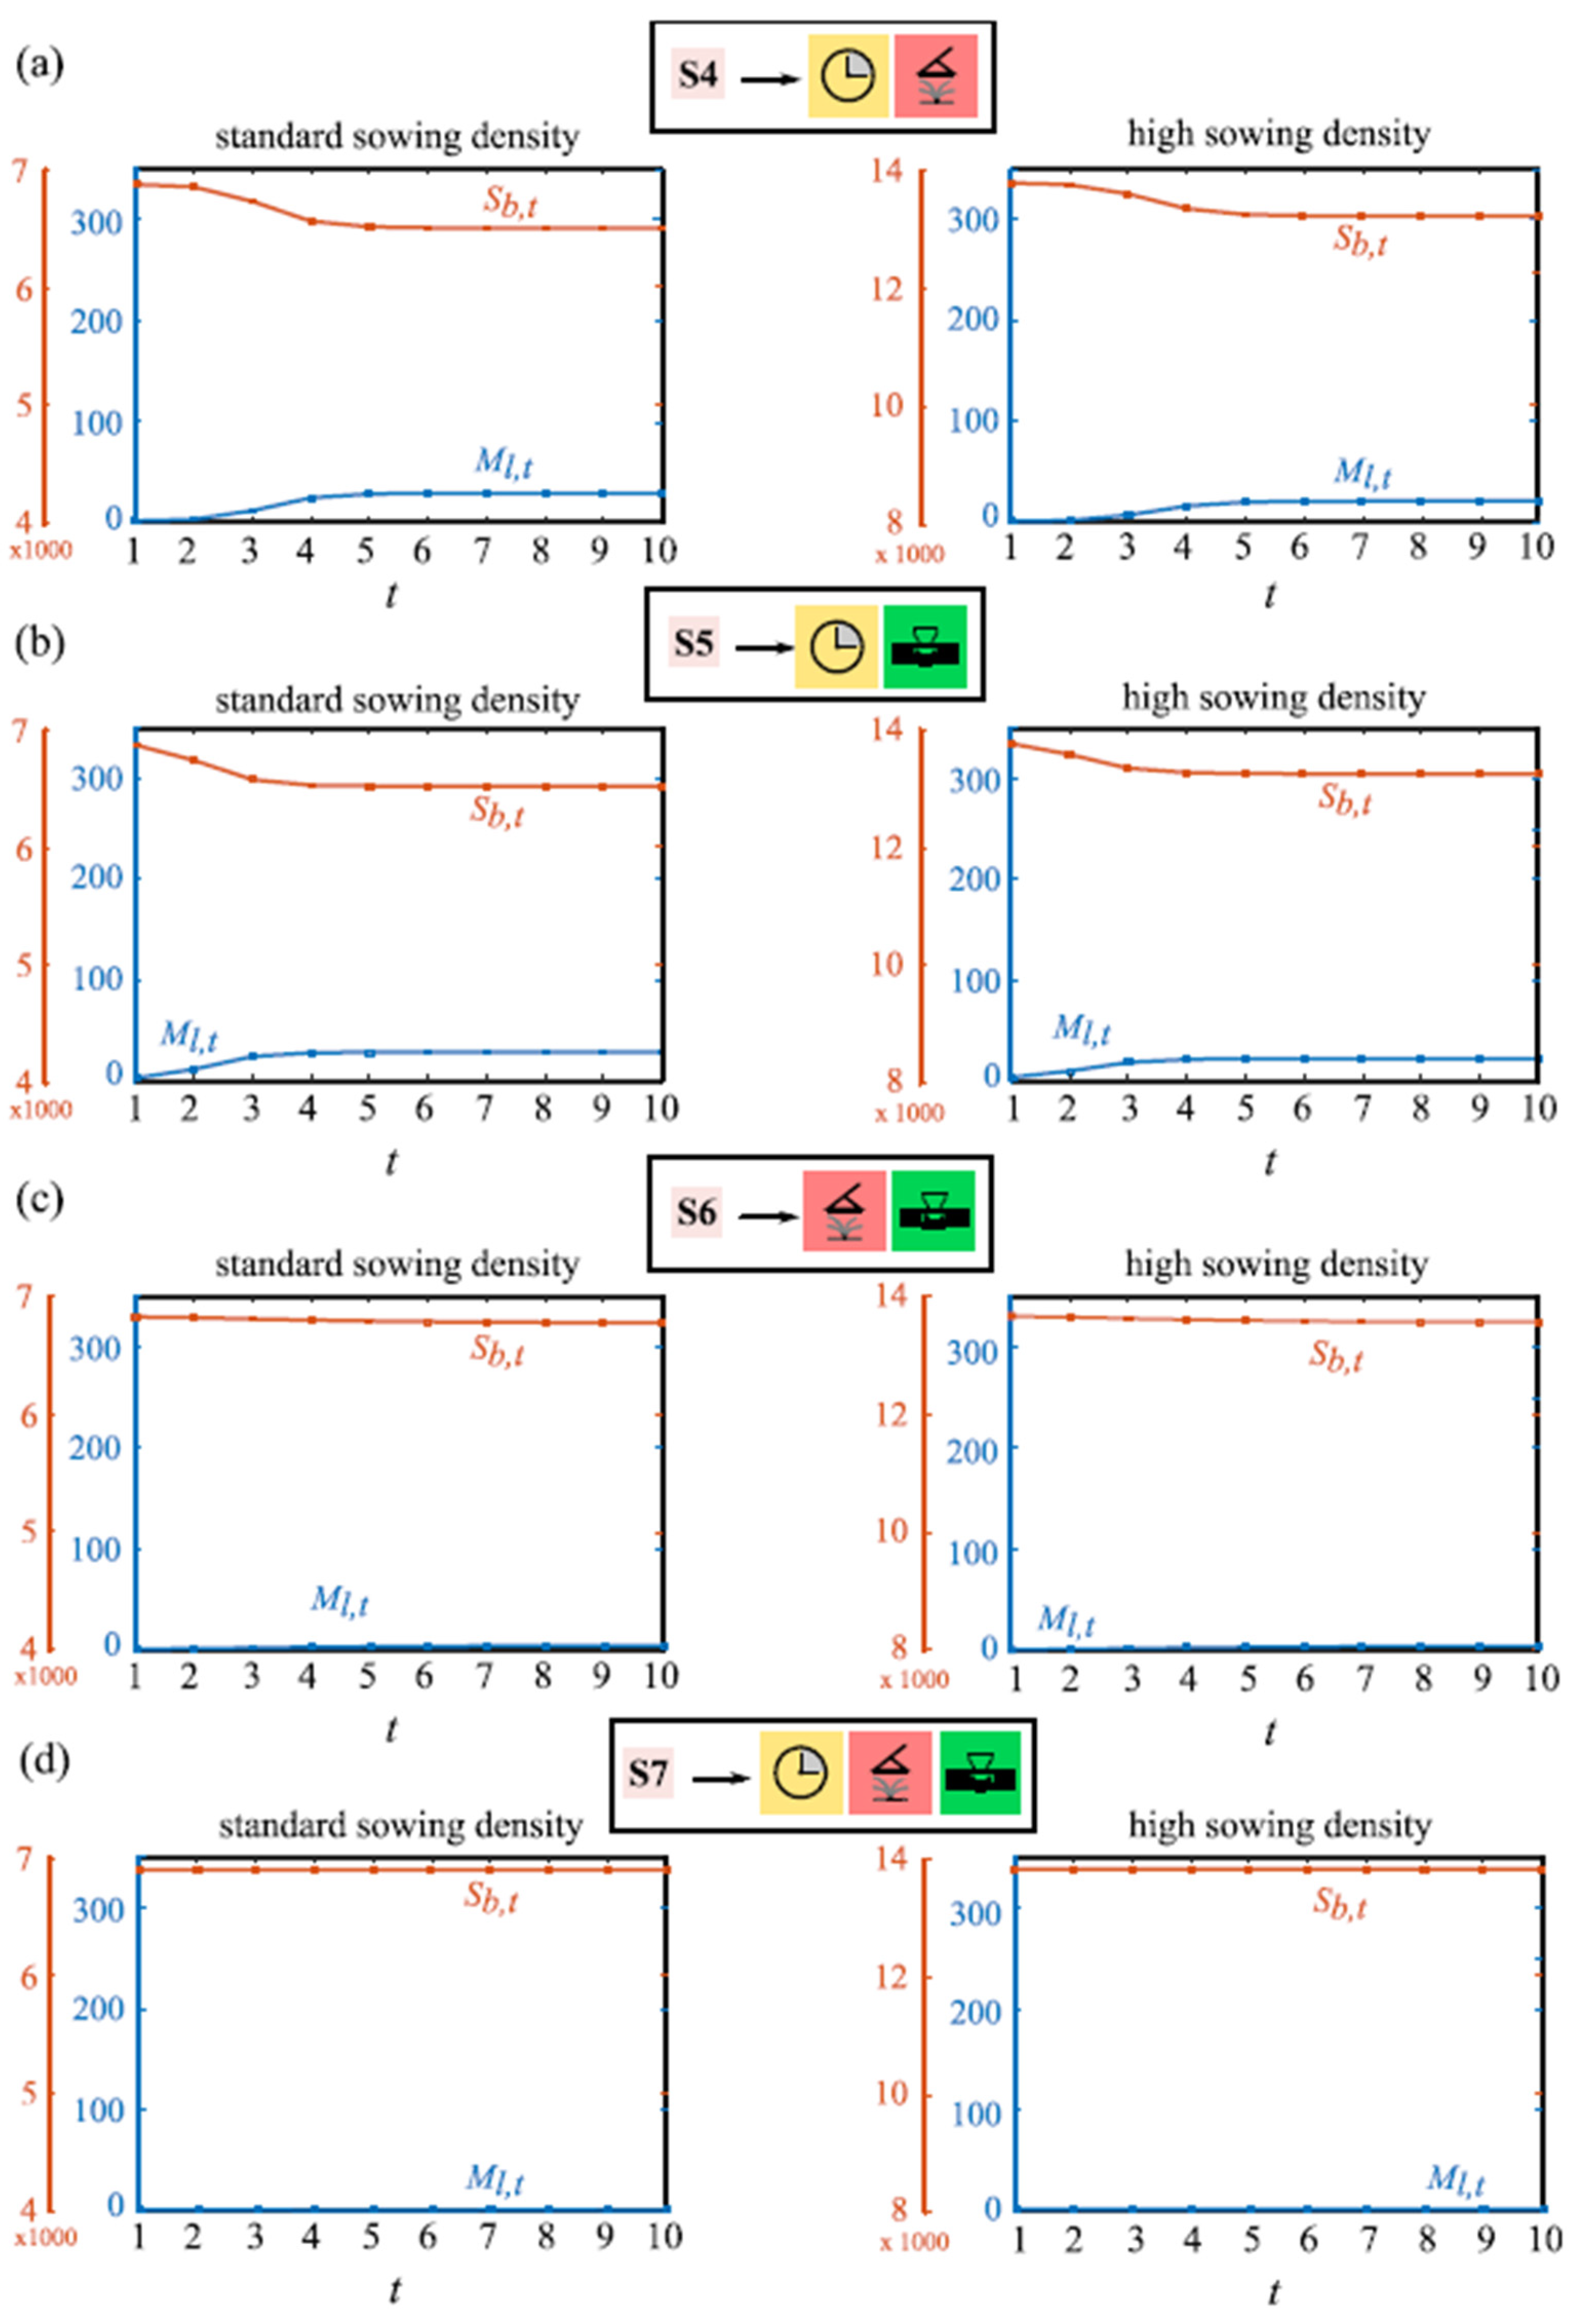
3.3. Dynamical Behavior of the Weed–Crop System

The proposed model is simulated to show L. rigidum and barley dynamics over a ten-year planning horizon, considering standard and high barley sowing density and control programs S1−S3 (Figure 6) and S4–S7 (Figure 7). Weed seed bank reached by programs S1–S3 (gray curve; Figure 6) permits us to appreciate that the use of herbicide in the seedling emergence stage and the harvest seed removal have the same effects on the adult plant population but they lead to different seed bank densities.
For programs S1−S3 (Figure 6), behaviors reach long-term equilibria after approximately five years. In the case of program S1, L. rigidum adult plants achieve the level of 303 plants m−2 with standard sowing density and 230 plants m−2 with high sowing density (Figure 6a). Thus, the barley seed production falls from 6900 to 4907 seed m−2 and from 13,800 to 10,291 seed m−2, respectively. Better scenarios are obtained with programs S2 and S3 where long-term infestation levels are 84 and 64 plants m−2 for standard and high sowing density, respectively, and the barley seed production maintain in 5960 and 12,282 seed m−2 in the last five years (Figure 6b,c). The L. rigidum seed bank does not present high differences comparing programs S1 and S2 but it is appreciably reduced when the program S3 is used.
For the IWM scenarios S4−S7 (Figure 7), equilibrium levels are reached in the long run more gradually as more control actions are incorporated. Conversely, the extra cost of sowing the crop with a high density does not translate into a higher barley yield. Considering, for example, the scenario of standard sowing density, L. rigidum adult plants can achieve densities in the order of 28 plants m−2 for control programs S4−S5 (Figure 7a,b) and 6 plants m−2 for control program S6 (Figure 7c). This resulted in barley seed production of 6525 (13,231) and 6814 (13,689) seed m−2, respectively. These amounts are just 5.43% below the maximum production in the worst case (Figure 5). In the high sowing density scenario, results are practically equal as maximum barley losses do not exceed 4.12%. Finally, program S7 (Figure 7d) keeps the L. rigidum population at the limit of theoretical extinction (0.12 plants m−2 with standard sowing) and the barley seed production practically in its maximum value. This scenario requires the integration of all the possible control actions and the application of herbicides along the complete planning horizon.

4. Discussion

The necessary field experiments to explore long-term effect of IWM programs would require a temporal scale that would make them difficult to conduct. Therefore, population models are particularly helpful for understanding long-term changes in the weed population dynamics associated with IWM strategies [23]. Our results point out the necessity of achieving high L. rigidum control efficiencies (>99%), indicating the extreme difficulty for controlling this weed in barley crops, in accordance with other authors [13] and farmer perceptions. Under this type of cropping, traditional herbicide-based tactics (selective graminicides at standard rate with 90% control) will leave a significant number of individuals (seed bank) which will rapidly increase the population size year after year. The increase of herbicide resistance has also led people to consider the implementation of IWM strategies in cereal crops.
Cultural practices such as the increment of sowing rate favors crop competition [11,12]. Our results suggest that, in the absence of other control actions, an increase of twice the standard sowing density of barley resulted in a reduction of 23.7% of L. rigidum density as a consequence of the interspecific competition. Such results coincide with field experiments of other authors [11,12] as a high-density crop is expected to compete more efficiently than a low-density crop. Conversely, Cirujeda and Taberner [24] did not find that an increase in the sowing density of crop density affects the L. rigidum density or biomass. Probably, as the authors indicated, their experiments were irrigated and, therefore, water was not a limiting factor as in our study. Increasing sowing density could have a more important effect on weeds in rainfed environments [2].
Other non-herbicide-based individual control methods, such delayed sowing [25] and weed seed catching at harvest [26,27] have been proposed as alternative ways to suppress weed competitiveness or deplete the soil seed bank. Our in silico results indicate that these individual control methods (S1–S3) are ineffective for reducing the L. rigidum population (Figure 6). As expected, the combination of two control tactics (S4 to S6), regardless of the sowing density level, notably reduced the populations of L. rigidum but not enough to be effective (Figure 7). Therefore, more than two control tactics are necessary to reach an effective control. These results are in line with Anderson [28], which suggests that more than two cultural control tactics may be necessary to be effective in the semiarid steppe of the United States. Other authors [5,13,24] also pointed out that effective control of L. rigidum requires the combination of more than two control strategies. Our findings confirm that the integration of three control actions (strategy S7) drove the population to 0.12 plants m−2, an infestation level sufficient to maintain L. rigidum populations in a “safe” level and maximize barley yield independently of the sowing rate. Under this control tactic, it is not worth increasing the sowing rate.
Therefore, our results support the theory of using ‘many little hammers’ to suppress weeds [29]. As observed, a decrease in weed infestation implies an increment in barley yield (Figure 5) as the efficiencies of the control actions are increased. Nevertheless, the effect exerted on barley yield by an increase in the sowing density is diluted as a more demanding control is reached (e.g., S7; Figure 5). Some authors suggest that an increase in the sowing barley rate does not produce any significant yield increase [2,22,30]. Our in silico results suggest that doubling the number of barley seeds (yield proxy) essentially doubles the yield (Figure 7d), but this is likely not occur under field conditions. Doubling the sowing rate could have negative consequences such as a decreased in the grain rate and quality, increased lodging and potential problems with pests and diseases [31]. Lacasta et al. [30] suggest the optimal sowing barley rate is in the order of 160 kg ha−1, similar to the standard sowing used in this work.

5. Conclusions

Our results show the need of applying a strong IWM program with at least three control strategies to carry out an effective management of L. rigidum populations. Moreover, they evidence that the use of the high sowing density as a weed control option might be not necessary in Mediterranean dryland, if the indicated strong IWM program is applied. The proposed model offers a practical guidance regarding the possibilities and limitations of strategic approaches for the long-term weed control, but to be able to use it as a decision tool by farmers, it is necessary to perform its validation in a large range of situations [23,32]. Improvements of this model should include specific field validations, considering different environments, barley cultivars, tillage types, and frequency. The economic feasibility of the proposed strategies should also be stablished to assist farmers in the decision-making process [17,32]. Future research should aim to disentangle the effect of different weed resistance levels on L. rigidum populations and the required non-chemical control efficiencies for more effective and sustainable IWM programs.

Author Contributions

Conceptualization, J.L.G.-A.; methodology, M.B.D.; software, M.B.D.; formal analysis, M.B.D. and G.L.C.; writing—original draft preparation, M.B.D., G.R.C. and J.L.G.-A.; writing—review and editing, M.B.D., G.R.C., G.L.C. and J.L.G.-A. All authors have read and agreed to the published version of the manuscript.

Funding

This research was funded by Secretaría General de Ciencia y Tecnología de la Universidad Nacional del Sur, grant numbers PGI 24/K087 and 24/A225. J.L.G.-A. was supported by FEDER (European Regional Development Funds) and the Spanish Ministry of Science, Innovation and Universities funds (grant PID2019-103929RB-I00).

Institutional Review Board Statement

Not applicable.

Informed Consent Statement

Not applicable.

Data Availability Statement

Not applicable.

Conflicts of Interest

The authors declare no conflict of interest.

References

  1. Zhou, M. Barley production and consumption. In Genetics and Improvement of Barley Malt Quality; Zhang, G., Li, C., Eds.; Springer: Berlin/Heidelberg, Germany, 2010; pp. 1–17. [Google Scholar]
  2. Izquierdo, J.; Recasens, J.; Fernández-Quintanilla, C.; Gille, G. Effects of crop and weed densities on the interactions between barley and Lolium rigidum in several mediterranean locations. Agronomie 2003, 23, 529–536. [Google Scholar] [CrossRef]
  3. Fernández-Quintanilla, C.; Barroso, J.; Recasens, J.; Sans, X.; Torner, C.; del Arco, M.J.S. Demography of Lolium rigidum in winter barley crops: Analysis of recruitment, survival and reproduction. Weed Res. 2000, 40, 281–291. [Google Scholar] [CrossRef]
  4. Gill, G.S.; Cousens, R.D.; Allan, M.R. Germination, growth, and development of herbicide resistant and susceptible populations of rigid ryegrass (Lolium rigidum). Weed Sci. 1996, 44, 252–256. [Google Scholar] [CrossRef]
  5. Gramshaw, D.; Stern, W.R. Survival of annual ryegrass (lolium rigidum gaud.) in a Mediterranean type environment. II Effects of short term burial on persistence of viable seed. Aust. J. Agric. Res. 1977, 28, 93–101. [Google Scholar] [CrossRef]
  6. Heap, I.M. The International Survey of Herbicide Resistant Weeds. Available online: http://www.weedscience.org (accessed on 5 June 2021).
  7. Boutsalis, P.; Gill, G.; Preston, C. Incidence of herbicide resistance in rigid ryegrass (Lolium rigidum) across Southeastern Australia. Weed Technol. 2012, 26, 391–398. [Google Scholar] [CrossRef]
  8. Borger, C.P.D.; Hashem, A.; Powles, S.B. Manipulating crop row orientation and crop density to suppress Lolium rigidum. Weed Res. 2016, 56, 22–30. [Google Scholar] [CrossRef]
  9. Olsen, J.; Kristensen, L.; Weiner, J. Effects of density and spatial pattern of winter wheat on suppression of different weed species. Weed Sci. 2005, 53, 690–694. [Google Scholar] [CrossRef]
  10. Champion, G.T.; Froud-Williams, R.J.; Holland, J.M. Interactions between wheat (Triticum aestivum L.) cultivar, row spacing and density and the effect on weed suppression and crop yield. Ann. Appl. Biol. 1998, 133, 443–453. [Google Scholar] [CrossRef]
  11. Paynter, H.H.; Hills, A.L. Barley and rigid ryegrass (Lolium rigidum) competition is influenced by crop cultivar and density. Weed Technol. 2009, 23, 40–48. [Google Scholar] [CrossRef]
  12. Lemerle, D.; Cousens, R.D.; Gill, G.S.; Peltzer, S.J.; Moerkerk, M.; Murphy, C.E.; Collins, D.J.; Cullis, B. Reliability of higher seeding rates of wheat for increased competitiveness with weeds in low rainfall environments. J. Agric. Sci. 2004, 142, 395–409. [Google Scholar] [CrossRef] [Green Version]
  13. González-Andújar, J.L.; Fernández-Quintanilla, C. Modelling the population dynamics of annual ryegrass (Lolium rigidum) under various weed management systems. Crop Prot. 2004, 23, 723–729. [Google Scholar] [CrossRef] [Green Version]
  14. Somerville, G.J.; Powles, S.B.; Walsh, M.J.; Renton, M. How do spatial heterogeneity and dispersal in weed population models affect predictions of herbicide resistance evolution? Ecol. Model. 2017, 362, 37–53. [Google Scholar] [CrossRef]
  15. D’Amico, M.B.; Calandrini, G.L.; González-Andújar, J.L.; Chantre, G.R. Analysis of different management strategies for annual ryegrass (Lolium rigidum) based on a population dynamic model under various weed management systems. Int. J. Bifurc. Chaos 2018, 28, 1830041. [Google Scholar] [CrossRef]
  16. Bagavathiannan, M.V.; Beckie, H.J.; Chantre, G.R.; González-Andújar, J.L.; Leon, R.G.; Neve, P.; Poggio, S.L.; Schutte, B.J.; Somerville, G.J.; Werle, R.; et al. Simulation models on the ecology and management of arable weeds: Structure, quantitative insights, and applications. Agronomy 2020, 10, 1611. [Google Scholar] [CrossRef]
  17. González-Díaz, L.; Bastidas, F.; González-Andújar, J.L. A bioeconomic model for the analysis of control strategies for Lolium rigidum and Avena sterilis ssp ludoviciana in winter wheat. Int. J. Plant Prod. 2020, 14, 37–42. [Google Scholar] [CrossRef]
  18. Sonderskov, M.; Somerville, G.J.; Lacoste, M.; Jensen, J.E.; Holst, N. DK-RIM: Assisting integrated management of Lolium multiflorum, italian ryegrass. Agronomy 2020, 10, 856. [Google Scholar] [CrossRef]
  19. Torra, J.; Monjardino, M. Ryegrass Integrated Management (RIM)–Based Decision Support System. In Decision Support Systems for Weed Management; Chantre, G., González-Andújar, J.L., Eds.; Springer: Cham, Switzerland, 2020; pp. 249–278. [Google Scholar]
  20. Briggs, D.E. Barley; Chapman and Hall: London, UK, 1978. [Google Scholar]
  21. Singh, M.; Kaur, S.; Chauhan, B.S. Weed Interference Models. In Decision Support Systems for Weed Management; Chantre, G., González-Andújar, J.L., Eds.; Springer: Cham, Switzerland, 2020; pp. 117–142. [Google Scholar]
  22. Moreno, A.; Moreno, M.; Ribas, F.; Cabello, M.J. Influencia de distintas dosis de siembra sobre el rendimiento de la cebada (Hordeum vulgare L.) para su aplicación en cultivo ecológico. In La Agricultura y Ganadería Ecológicas en un Marco de Diversificación y Desarrollo Solidario; Sociedad Española de Agricultura Ecológica: Gijón, Spain, 2002; Volume 1, pp. 685–689. [Google Scholar]
  23. Holst, N. Mathematical Models. In Decision Support Systems for Weed Management; Chantre, G., González-Andújar, J.L., Eds.; Springer: Cham, Switzerland, 2020; pp. 3–23. [Google Scholar]
  24. Cirujeda, A.; Taberner, A. Cultural control of herbicide-resistant Lolium rigidum Gaud. populations in winter cereal in Northeastern Spain. Span. J. Agric. Res. 2009, 7, 146–154. [Google Scholar] [CrossRef] [Green Version]
  25. Kolbe, W. Effect of weed control on grain yield of different winter barley cultivars with reference to sowing time, seed rate and seed size, in long-term trials at Hofchen and Laacherhof Experimental Stations (1968–1980). Pflanzenschutz-Nachr. Bayer 1980, 33, 203–219. [Google Scholar]
  26. Walsh, M.J.; Broster, J.C.; Schwartz-Lazaro, L.M.; Norsworthy, J.K.; Davis, A.S.; Tidemann, B.D.; Beckie, H.J.; Lyon, D.J.; Soni, N.; Neve, P.; et al. Opportunities and challenges for harvest weed seed control in global cropping systems. Pest Manag. Sci. 2018, 74, 2235–2245. [Google Scholar] [CrossRef]
  27. San Martin, C.; Lyon, D.J.; Gourlie, J.A.; Thorne, M.; Barroso, J. Seed retention of grass weeds at wheat harvest in the Pacific Northwest. Weed Sci. 2021, 69, 238–246. [Google Scholar] [CrossRef]
  28. Anderson, R. Managing weeds with a dualistic approach of prevention and control. A review. Agron. Sustain. Dev. 2007, 27, 13–18. [Google Scholar] [CrossRef] [Green Version]
  29. Liebman, M.; Gallandt, E.R. Many little hammers: Ecological management of crop-weed interactions. In Ecology in Agriculture; Jackson, L.E., Ed.; Academic Press: Cambridge, MA, USA, 1997; pp. 291–343. [Google Scholar]
  30. Lacasta, C.; Meco, R.; Estalrich, E.; Martín de Eugenio, L. Interacción de densidades de siembra de cebada y rotaciones de cultivo sobre la flora arvense y rendimientos de cultivos. In Proceedings of the VI SEAE Congress, Almería, Spain, 27 September–2 October 2004; pp. 1481–1496. [Google Scholar]
  31. Weiner, J.; Griepentrog, H.-W.; Kristensen, L. Suppression of weeds by spring wheat Triticum aestivum increases with crop density and spatial uniformity. J. Appl. Ecol. 2001, 38, 784–790. [Google Scholar] [CrossRef]
  32. González-Díaz, L.; Blanco-Moreno, J.M.; González-Andújar, J.L. Spatially-explicit bioeconomic model for weed management in cereals: Validation and evaluation of management strategies. J. Appl. Ecol. 2015, 52, 240–249. [Google Scholar] [CrossRef] [Green Version]
Figure 1. Scheme of L. rigidum–barley model, considering the life cycles of both populations and the weed control actions. Both interspecific and intraspecific competitions are included. Black arrows indicate the course of changes through the different stages in the life cycles of the weed and the crop. Red arrows represent the control and competitive interventions.
Agronomy 11 01565 g001
Figure 2. Different control scenarios combined with both standard and high barley sowing densities to control L. rigidum are evaluated. Actions such as delayed sowing, herbicide application and seed removal at harvest are considered in this scheme. The obtained programs are organized so that the equivalent efficiency increases gradually.
Agronomy 11 01565 g002
Figure 3. Dynamical behavior of the L. rigidum population under different control efficiencies. (a) Long-term adult plant equilibrium (Ml,); (b) Sensitivity index (SIMl) to variations in the barley sowing density calculated at cbc = 0.24; (c) Growth rate (λ).
Agronomy 11 01565 g003
Figure 4. Index SISb indicating the sensitivity of the barley seed production to L. rigidum adult plants Ml,t. Variation ranges corresponding to the long-term infestation levels reached by using control programs S1–S7 are also indicated.
Agronomy 11 01565 g004
Figure 5. Barley yield when the ryegrass achieved its long-term equilibrium level under different control programs and sowing densities. (a) Relative production respect to Sb,max; (b) Loss percentages corresponding to control programs S1–S7.
Agronomy 11 01565 g005
Figure 6. Simulations of the weed–crop model over a ten-year planning horizon applying different individual control programs and considering standard and high sowing density. L. rigidum mature plant population Ml,t in blue; barley seed production Sb,t in orange; L. rigidum seed bank SBl,t in gray. (a) S1; (b) S2; (c) S3.
Agronomy 11 01565 g006
Figure 7. Simulations of the weed–crop model over a ten-year planning horizon applying different integrated control programs and considering standard and high sowing density. L. rigidum mature plant population Ml,t in blue; barley seed production Sb,t in orange; (a) S4; (b) S5; (c) S6; (d) S7.
Agronomy 11 01565 g007
Table 1. Parameter values and control efficiencies used in the simulation of the weed–crop model.
ParameterModelValueReference
BarleyEmergence (seedlings/seed) e b 0.75[22]
Seedling survivorship s b 1[22]
(plants/seedlings)
Fecundity (seed/plants) f b 18.40(González-Andújar, personal communication)
Interspecific competition
(m2/plant) r z 0.0022[2]
(part per unit) r i 0.5100[2]
L. rigidumEmergence (seedlings/seed) e l 0.64[3,13]
Seedling survivorship s l 0.76[3,13]
(plants/seedlings)
Fecundity (seed/plants) f l 935[3,13]
Area (m2/plant) a l 0.34[3,13]
Seed bank mortality (parts per unit) m l 0.84[3,13]
Biotic reduction (parts per unit) l l 0.19[13]
ControlCrop competition (parts per unit) c b c [3,13]
Standard barley density 0.24
High barley density 0.42
Sowing delay (parts per unit) c b d 0.65[13]
Herbicide control (parts per unit) c h 0.90[13]
Seed removal at harvest (parts per unit) c c 0.90[13]
Table 2. Long-term L. rigidum population Ml, considering control programs S1–S7 and standard and high barley sowing densities.
Long-Term   Density   M l , [ Plants   m 2 ]
Control
Scenarios
Equivalent EfficiencyStandard Sowing DensityHigh Sowing DensityReduction
[%]
without control087166423.7
S10.650030323024.1
S2–S30.9000846423.8
S4–S50.9650282028.6
S60.99006433.3
S70.99650.12Extinction100
Publisher’s Note: MDPI stays neutral with regard to jurisdictional claims in published maps and institutional affiliations.

