
Tef (Eragrostis tef) Responses to Phosphorus and Potassium Fertigation under Semi-Arid Mediterranean Climate


Abstract
:1. Introduction
2. Materials and Methods
2.1. Plant Materials and Experimental Design
2.2. Data Collection
2.3. Statistical Analyses
3. Results
3.1. Effects of P and K on Different Genotypes
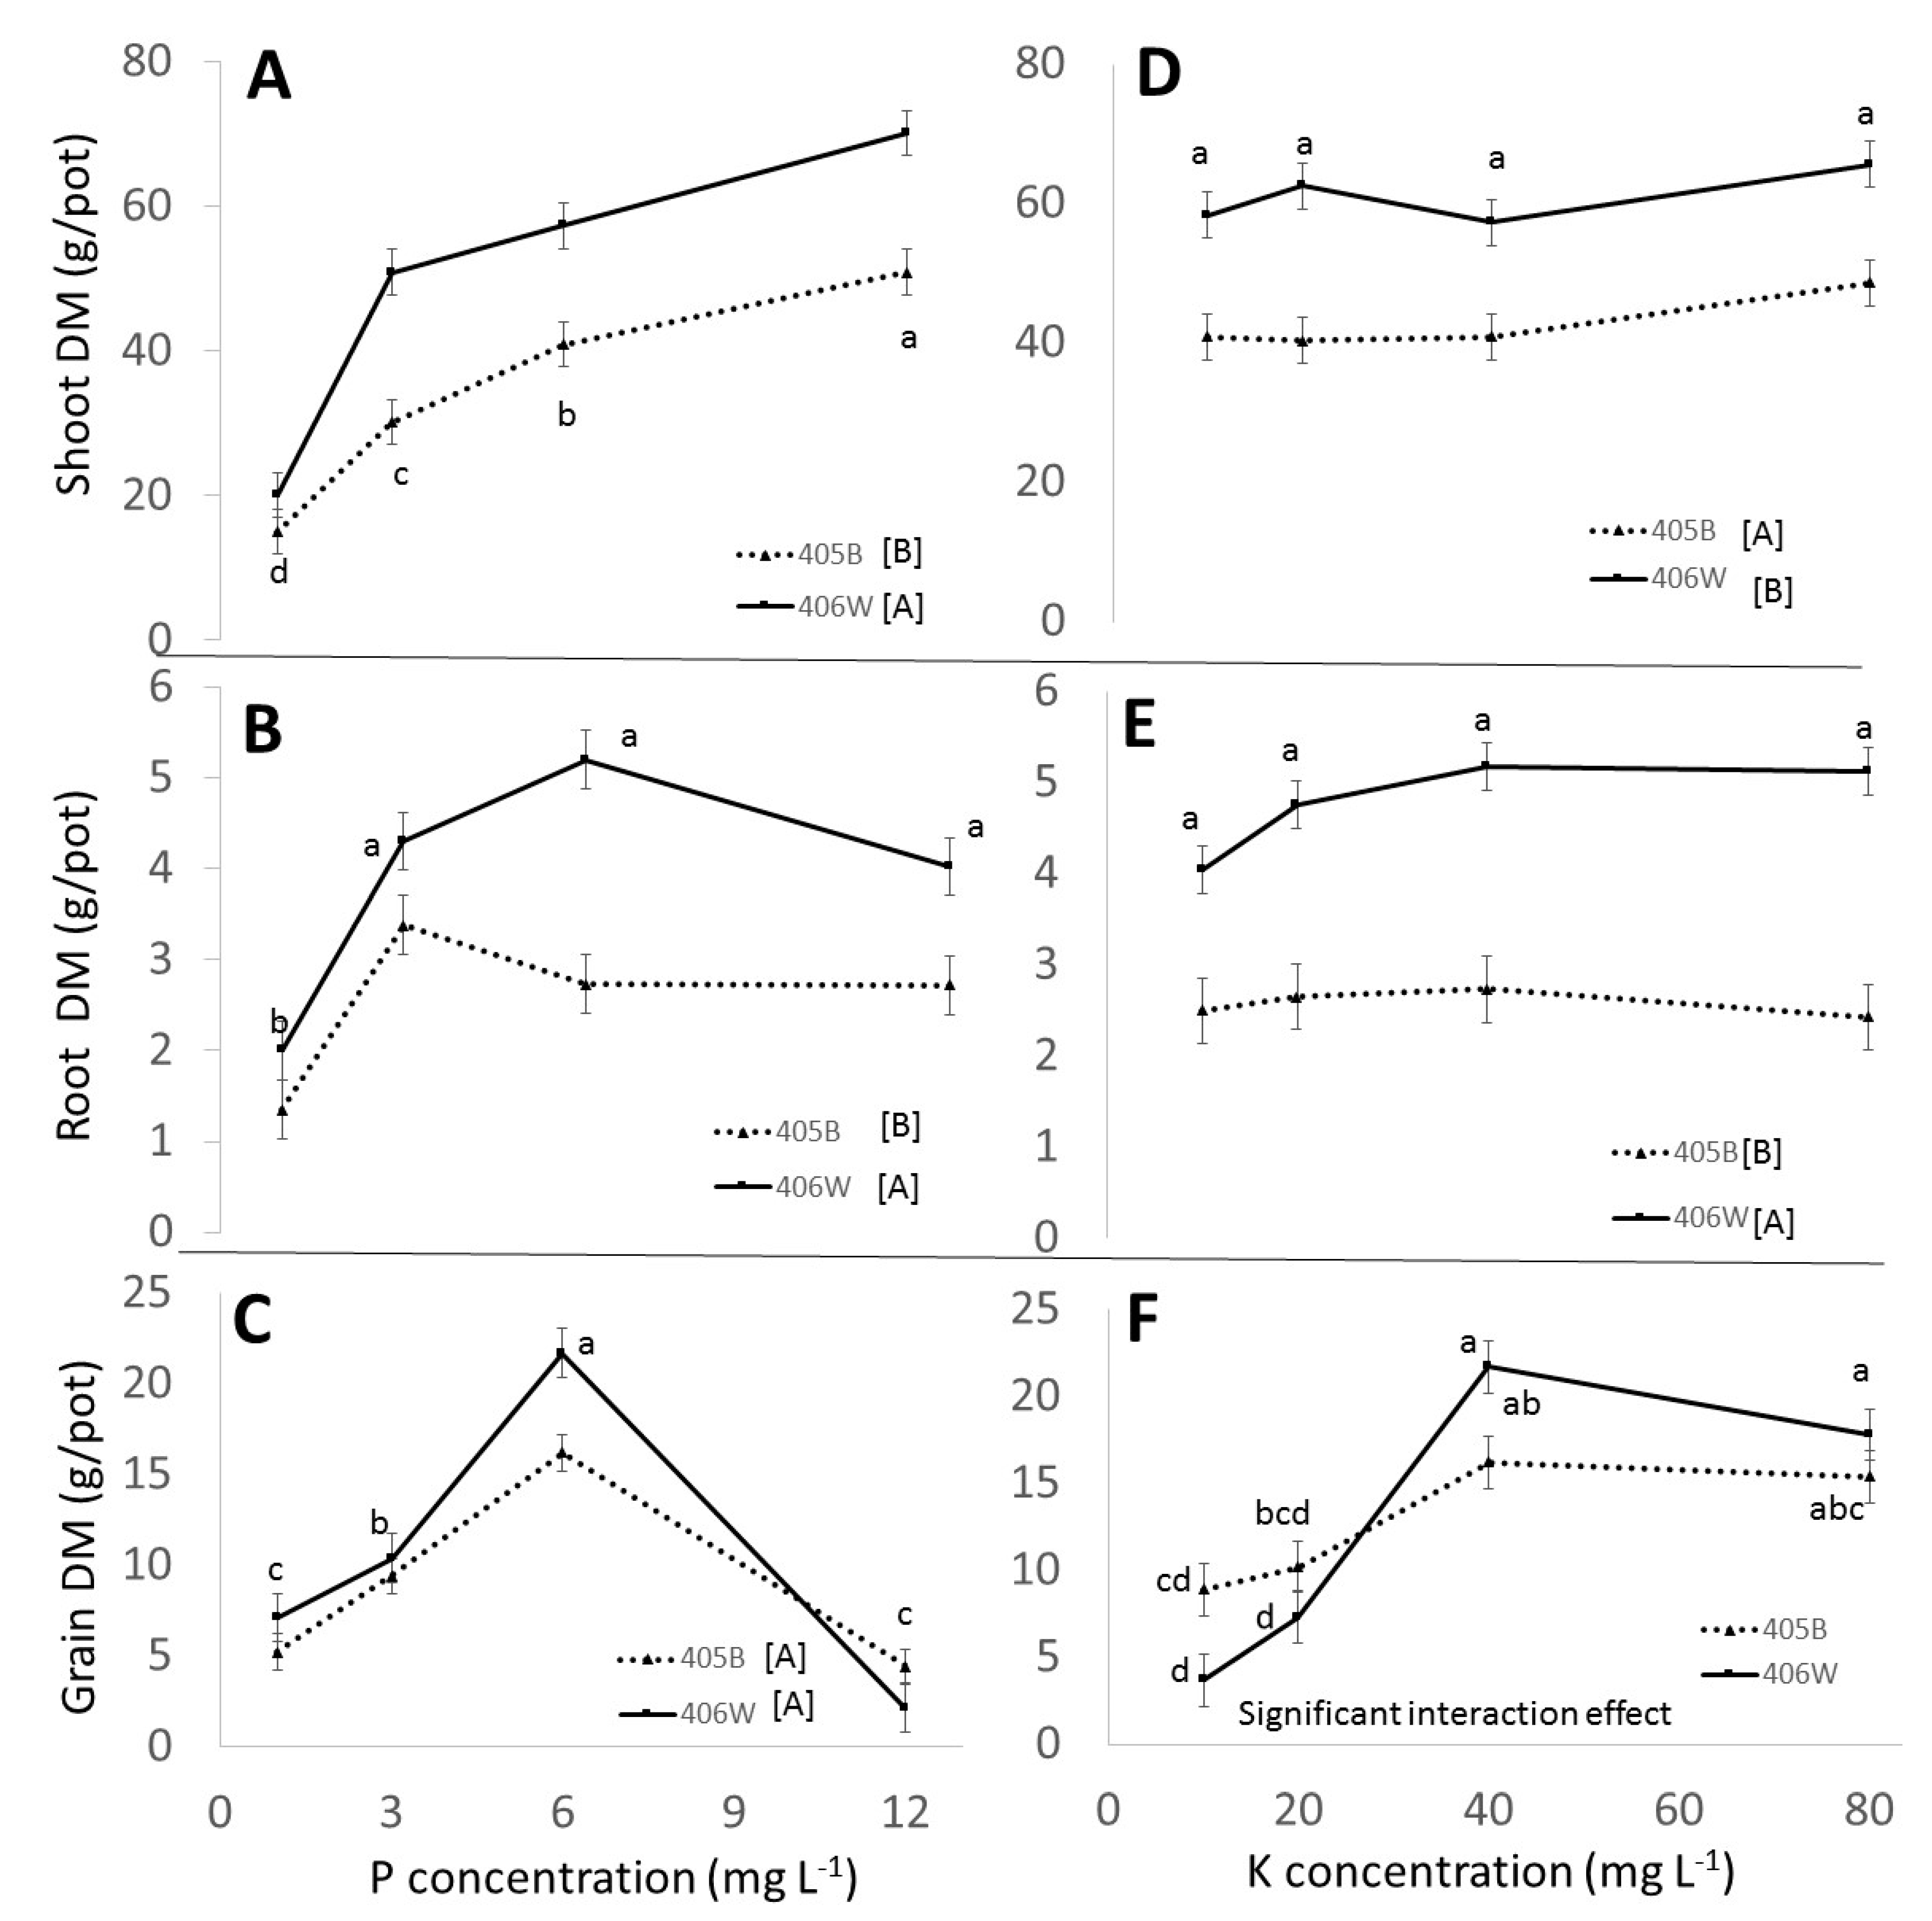
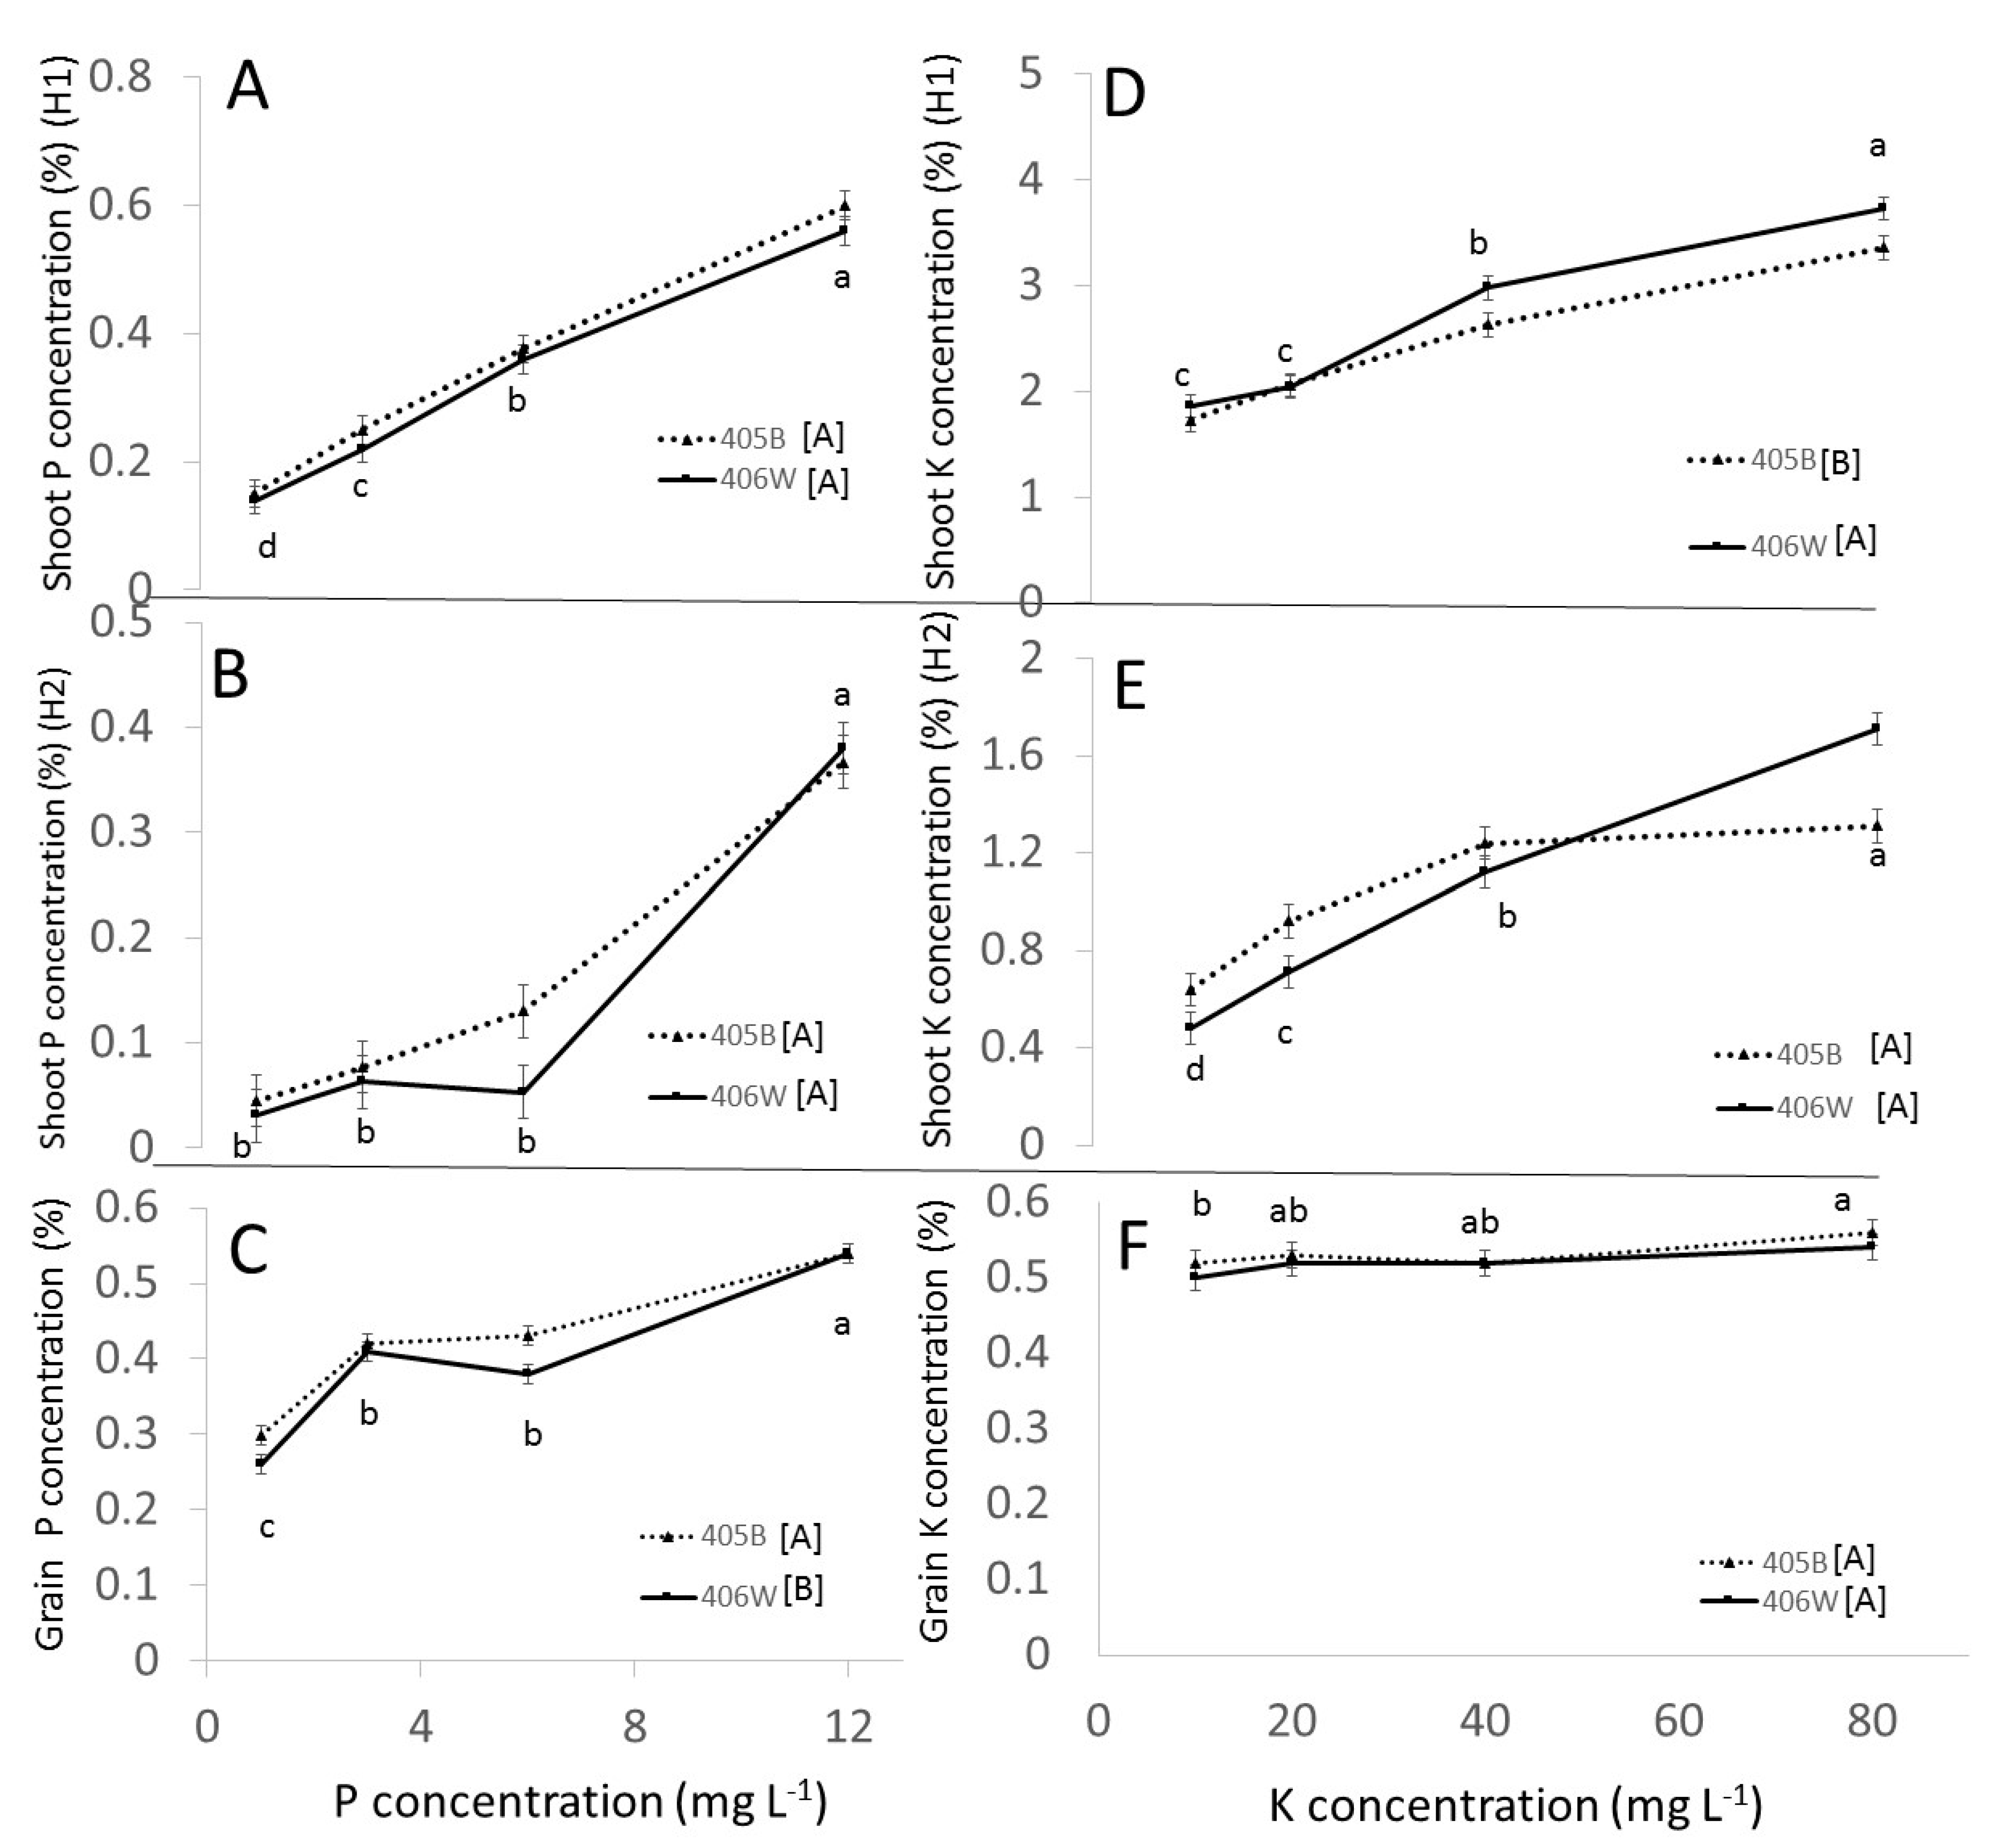
3.2. Pot Experiment
3.2.1. Effect of Genotypes
3.2.2. Effect of P
3.2.3. Effect of K
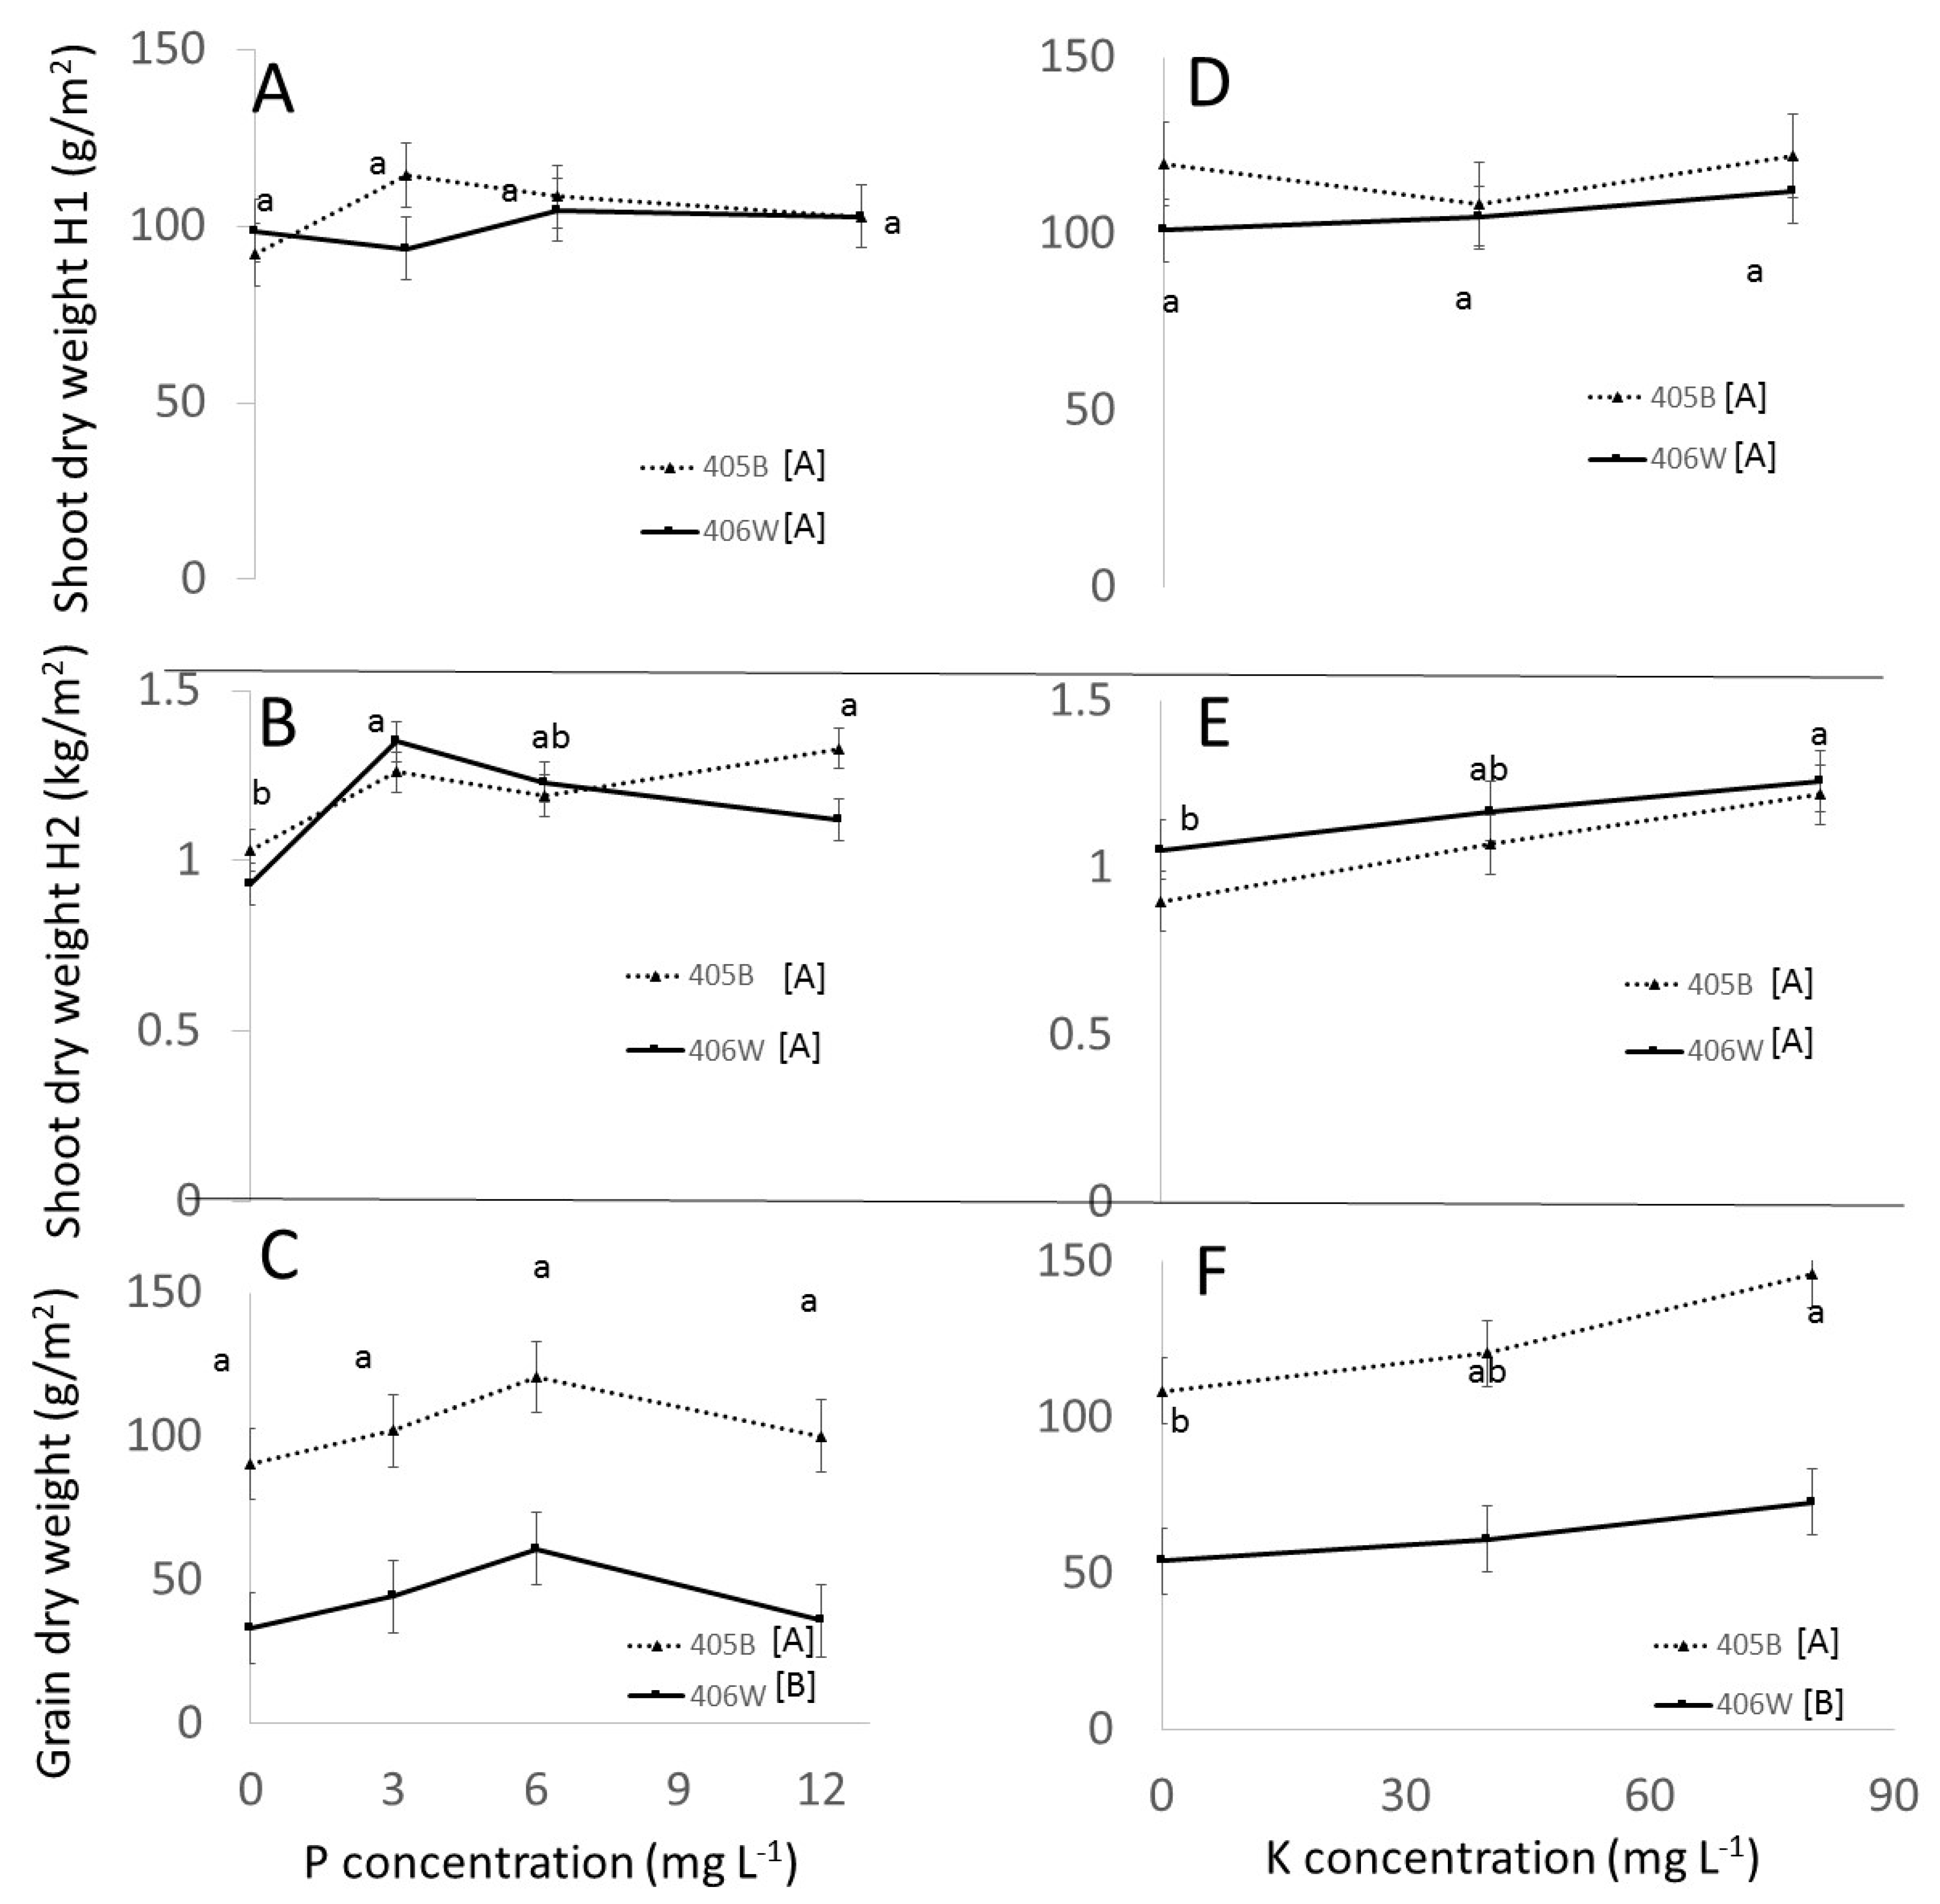
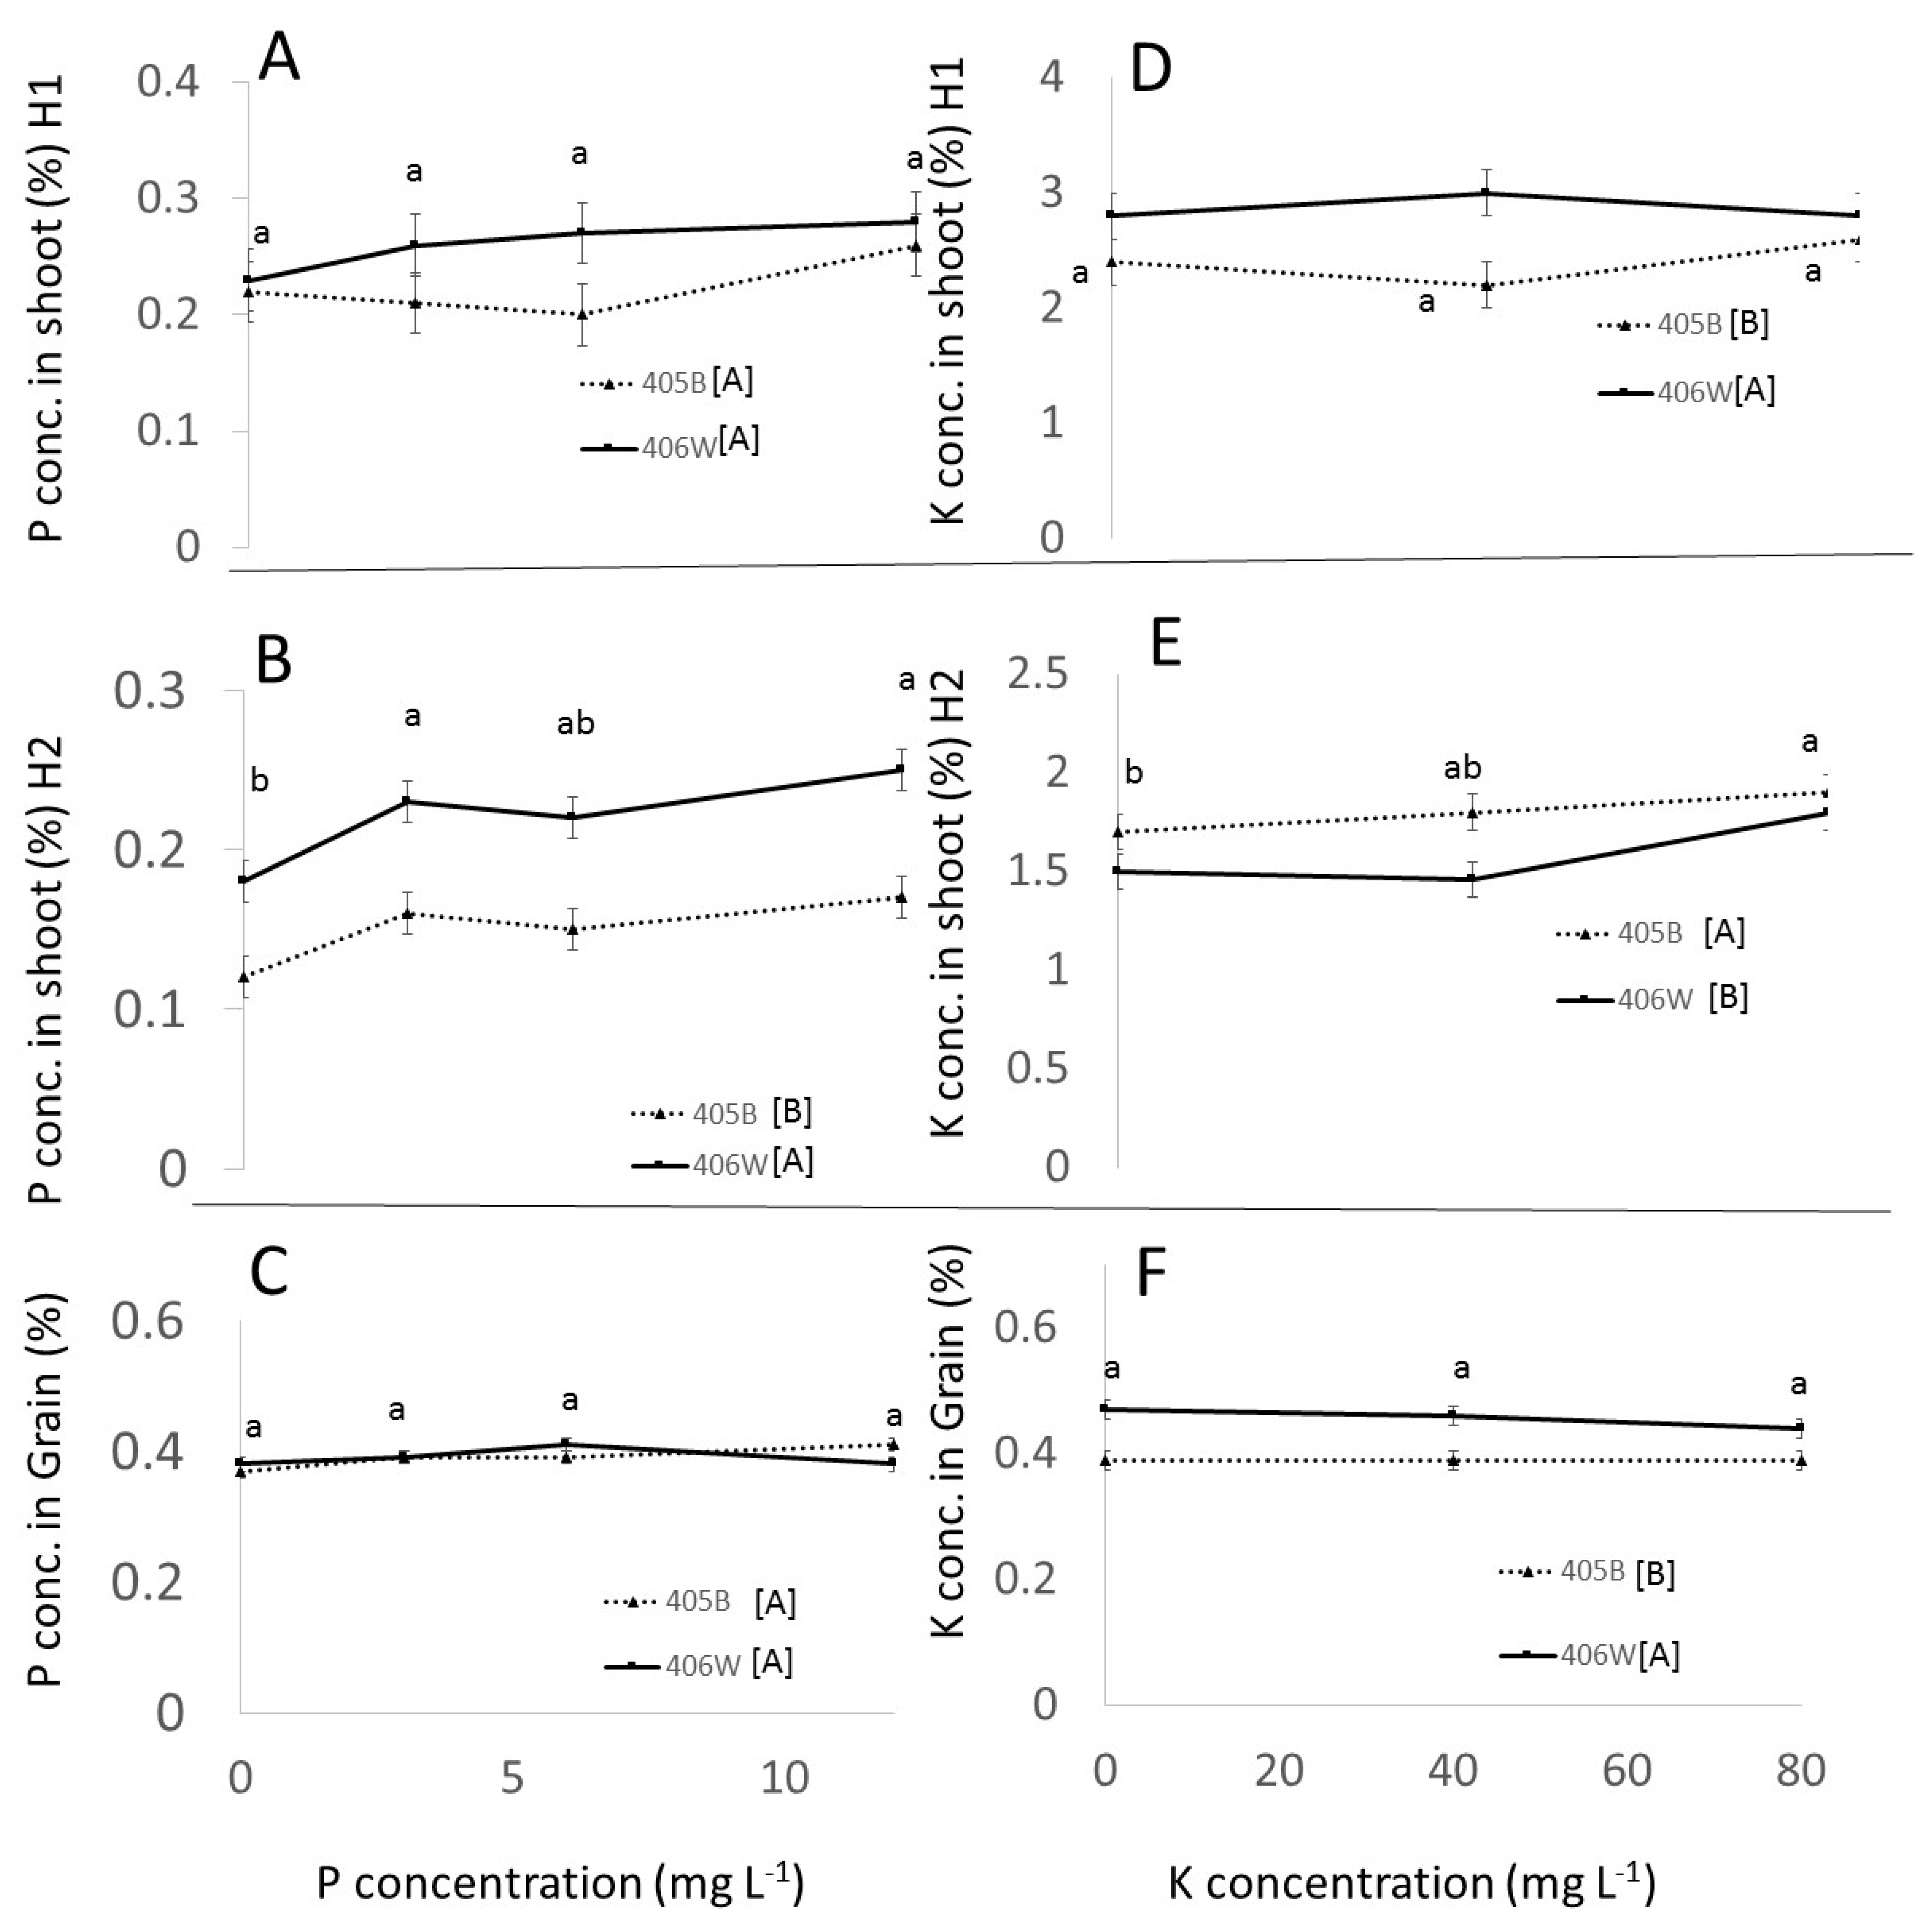
3.3. Field Experiment
3.3.1. Effect of Genotypes
3.3.2. Effect of P and K
4. Discussion
5. Conclusions
- Up to 6 mg L−1 P and 40 mg L−1 K, respectively, there was a clear positive effect of P and K fertilization in the pot experiment. P and K concentration in the shoot was positively affected by P and K fertilization. The concentration of P in the grain was positively affected by P fertilization, whereas the K concentration in the grain was barely affected by K fertilization. These observations were true for both genotypes.
- A clear negative effect of P overfertilization on grain yield was evident when perlite pots were fertigated with 12 mg L−1 P. This effect could not be seen in the field and to the best of our knowledge has not been reported before. It seems to have been caused by overinvestment in tillers and underinvestment in grain. P fertilization tended to have a positive effect on the number of tillers.
- We observed that the benefit of K fertilization was only evident at the end of the plants’ lifecycle, which has practical ramifications for experimental design when testing the effect of K on tef.
- No statistically significant negative effect from K overfertilization was observed in the pot or field experiment, even though the K concentration of the shoots at maturity was well above what was considered optimum in the literature.
- While K concentration in the shoot was clearly affected by K availability, the K concentration in the grain remained more or less constant, around 0.5% regardless of K availability.
- The response of tef to different P and K doses in the field was attenuated compared to the response in perlite, evidently because of the native ability of the soil to release and fix P and K. Fertigation recommendations in the field will need to take into account the nutrient availability in the soils.
Author Contributions
Funding
Acknowledgments
Conflicts of Interest
Appendix A

| Segment | Mineral Concentrations in Irrigation Solution (ppm) | # of Genotypes | Repetitions | ||
|---|---|---|---|---|---|
| Nitrogen (N) | Phosphorus (P) | Potassium (K) | |||
| Nitrogen Segment | 10 | 6 | 40 | 2 | 5 |
| 20 | 6 | 40 | 2 | 5 | |
| 80 | 6 | 40 | 2 | 5 | |
| 120 | 6 | 40 | 2 | 5 | |
| Phosphorus Segment | 40 | 1 | 40 | 2 | 5 |
| 40 | 3 | 40 | 2 | 5 | |
| 40 | 12 | 40 | 2 | 5 | |
| Potassium Segment | 40 | 6 | 10 | 2 | 5 |
| 40 | 6 | 20 | 2 | 5 | |
| 40 | 6 | 80 | 2 | 5 | |
| Shared control group | 40 | 6 | 40 | 2 | 5 |
| Segment | Mineral Concentrations in Irrigation Solution (ppm) | # of Genotypes | Repetitions | ||
|---|---|---|---|---|---|
| Nitrogen (N) | Phosphorus (P) | Potassium (K) | |||
| Nitrogen Segment | 0 | 6 | 40 | 2 | 5 |
| 30 | 6 | 40 | 2 | 5 | |
| 120 | 6 | 40 | 2 | 5 | |
| Phosphorus Segment | 60 | 0 | 40 | 2 | 5 |
| 60 | 3 | 40 | 2 | 5 | |
| 60 | 12 | 40 | 2 | 5 | |
| Potassium Segment | 60 | 6 | 0 | 2 | 5 |
| 60 | 6 | 80 | 2 | 5 | |
| Shared Control group | 60 | 6 | 40 | 2 | 5 |
References
- Lee, H.; Teff, A. Rising Global Crop: Current Status of Teff Production and Value Chain. Open Agric. J. 2018, 12, 185–193. [Google Scholar] [CrossRef]
- Gebru, Y.A.; Sbhatu, D.B.; Kim, K.P. Nutritional Composition and Health Benefits of Teff (Eragrostis tef (Zucc.) Trotter). J. Food Qual. 2020, 2020. [Google Scholar] [CrossRef]
- Yihun, Y.M. Agricultural Water Productivity Optimization for Irrigated Teff (Eragrostic tef) in Water Scarce Semi-Arid Region of Ethiopia; Springer: New York, NY, USA, 2015; ISBN 9781138027664. [Google Scholar]
- Gashu, K.; Halpern, M.; Zipori, I.; Bustan, A.; Saranga, Y.; Yermiyahu, U. Tef (Eragrostis tef Trotter) Responses to Nitrogen Fertigation under Semi-Arid Mediterranean Climate. Agronomy 2020, 10, 1870. [Google Scholar] [CrossRef]
- Reda, G.T. Verification and Demonstration of Soil Test Based Phosphorus Fertilizer Recommendation Rate on Yield of Teff (Eragrostis Tef (Zucc) Trotter) in Vertisols of Northern Ethiopia. J. Nat. Sci. Res. 2016, 6, 51–55. [Google Scholar]
- Dubale, T.K. Soil Test and Tissue Analysis Based Nitrogen and Phosphorus Fertilizer Applications on Teff [Eragrostis tef (Zucc.) Trotter] Cultivars in North Shewa Central Highlands, Ethiopia. Adv. Crop Sci. Technol. 2019, 7, 1–6. [Google Scholar] [CrossRef]
- Dereje, G.; Alemu, D.; Adisu, T.; Anbessa, B. Response of Yield and Yield Components of Tef [Eragrostis Tef (Zucc.) Trotter] to Optimum Rates of Nitrogen and Phosphorus Fertilizer Rate Application in Assosa Zone, Benishangul Gumuz Region. Ethiop. J. Agric. Sci. 2018, 28, 81–94. [Google Scholar]
- Mulugeta, D.; Mamo, T.; Sokolowski, E.; Nachmansohn, E. Potash Fertilization of Teff and Wheat in the Highlands of Ethiopia. Electron. Int. Fertil. Corresp. 2017, 48, 12–19. [Google Scholar]
- Mulugeta, D.; Mamo, T.; Beyene, S.; Kidanu, S. Effect of potassium levels on teff (Eragrostis tef (zucc.) trotter) growth and yield in central highland vertisols of Ethiopia. Eurasian J. Soil Sci. 2020, 9, 105–118. [Google Scholar] [CrossRef] [Green Version]
- Ethiopian Agricultural Transformation Agency. Ministry of Agriculture Soil Fertility Status and Fertilizer Recommendation Atlas for Tigray Regional State; Ethiopian Agricultural Transformation Agency: Addis Ababa, Ethiopia, 2014.
- Gebrehawariyat, F.M.; Haile, W.; Mamo, T.; Zipori, I.; Sokolowski, E. Response of teff [Eragrostis tef (Zucc.) Trotter] to potassium fertilizer application in four districts of North Shewa, Ethiopia. Electron. Int. Fertil. Corresp. 2018, 53, 3–15. [Google Scholar]
- Mulugeta, D.; Tekalign, M.; Sheleme, B.; Selamyihun, K. Potassium critical level in soil for Teff (Eragrostis tef (Zucc.) Trotter) grown in the central highland soils of Ethiopia. SN Appl. Sci. 2019, 1, 1–9. [Google Scholar] [CrossRef] [Green Version]
- Ben-Zeev, S.; Bimro, J.; Barak, V.; Saranga, Y. Phenotypic diversity and heritability in Eragrostis tef under irrigated Mediterranean conditions. Isr. J. Plant Sci. 2019, 65, 222–231. [Google Scholar] [CrossRef]
- Yihun, Y.M.; Haile, A.M.; Schultz, B.; Erkossa, T. Crop Water Productivity of Irrigated Teff in a Water Stressed Region. Water Resour. Manag. 2013, 27, 3115–3125. [Google Scholar] [CrossRef]
- Snell, F.D.; Snell, C.T. Colorimetric Methods of Analysis, 3rd ed.; D. Van Nostran Co Inc.: New York, NY, USA, 1949. [Google Scholar]
- Pierzynski, G.; Sharpley, A.N. Methods of Phosphorus Analysis for Soils, Sediments, Residuals, and Waters: Introduction. In Methods of Phosphorus Analysis for Soils, Sediments, and Waters; North Carolina State University: Raleigh, NC, USA, 2000; p. 110. [Google Scholar]
- Hawkesford, M.J.; Horst, W.; Kichey, T.; Lambers, H.; Schjoerring, J.K.; Moller, I.S.; White, P. Functions of macronutrients. In Mineral Nutrition of Higher Plants; Marchner, P., Ed.; Elsevier: Amsterdam, The Netherlands, 2012. [Google Scholar]
- Girma, K.; Reinert, M.; Ali, M.S.; Sutradhar, A.; Mosali, J. Nitrogen and Phosphorus Requirements of Teff Grown Under Dryland Production System. Crop Manag. 2012, 11, 1–14. [Google Scholar] [CrossRef]
- Misskire, Y.; Mamo, T.; Taddesse, A.M.; Yermiyahu, U. The effect of potassium on yield, nutrient uptake and efficiency of teff (Eragrostis tef Zucc. Trotter) on vertisols of North Western Ethiopian Highlands. J. Plant Nutr. 2019, 42, 307–322. [Google Scholar] [CrossRef]


| Phosphorus Treatment (mg L−1) | Height (cm) | Panicle Length (cm) | Days to Flowering | Harvest Index | SPAD | Number of Tillers per Plant | Lodging Index | |
|---|---|---|---|---|---|---|---|---|
| Genotype 405B | 1 | 35.5 | 32.8 | 50.6 | 0.30 | 41.6 | 5.3 | 1.2 |
| 3 | 41.6 | 39.4 | 47.6 | 0.24 | 40.0 | 10.7 | 1.1 | |
| 6 | 45.9 | 40.6 | 47.0 | 0.29 | 40.6 | 10.2 | 1.9 | |
| 12 | 45.4 | 43.2 | 45.0 | 0.08 | 40.0 | 16.6 | 1.7 | |
| Genotype 406W | 1 | 50.5 | 32.8 | 57.0 | 0.29 | 39.1 | 2.2 | 1.1 |
| 3 | 59.1 | 36.2 | 56.4 | 0.17 | 38.8 | 6.3 | 1.4 | |
| 6 | 60.0 | 37.8 | 53.8 | 0.28 | 38.0 | 5.5 | 1.9 | |
| 12 | 58.9 | 37.2 | 51.6 | 0.03 | 37.8 | 9.4 | 1.8 | |
| Tukey for P Treatments | 1 | 43.0 B | 32.8 A | 53.8 A | 0.29 A | 40.3 A | 3.8 C | 1.1 B |
| 3 | 50.3 A | 37.8 A | 52.0 AB | 0.21 A | 39.9 A | 8.5 B | 1.2 B | |
| 6 | 52.9 A | 39.2 A | 50.1 BC | 0.28 A | 39.3 A | 7.8 B | 1.9 A | |
| 12 | 52.1 A | 40.4 A | 48.3 C | 0.05 B | 38.8 A | 13.0 A | 1.7 A | |
| Tukey for Genotype | 405B | 42.1 b | 39.0 a | 47.5 b | 0.23 a | 40.8 a | 10.7 a | 1.5 a |
| 406W | 57.1 a | 36.0 b | 55.7 a | 0.19 a | 38.4 b | 5.8 b | 1.5 a | |
| P x Genotype | N.S. | N.S. | N.S. | N.S. | N.S. | N.S. | N.S. | N.S. |
| Potassium Treatment (mg L−1) | Height (cm) | Panicle Length (cm) | Days to Flowering | Harvest Index | SPAD | Number of Tillers per Plant | Lodging Index | |
|---|---|---|---|---|---|---|---|---|
| Genotype 405B | 10 | 42.1 | 37.0 | 49.2 | 0.18 | 41.0 | 14.2 | 1.8 |
| 20 | 45.6 | 40.8 | 47.6 | 0.20 | 41.5 | 13.5 | 1.9 | |
| 40 | 45.8 | 40.6 | 47.0 | 0.29 | 40.6 | 10.2 | 1.9 | |
| 80 | 46.7 | 37.2 | 45.6 | 0.24 | 40.8 | 10.0 | 2.5 | |
| Genotype 406W | 10 | 54.0 | 38.0 | 57.8 | 0.06 | 39.2 | 7.3 | 1.6 |
| 20 | 56.4 | 37.2 | 56.4 | 0.11 | 38.9 | 8.0 | 1.7 | |
| 40 | 56.7 | 37.8 | 53.8 | 0.28 | 38.0 | 5.5 | 1.9 | |
| 80 | 61.8 | 40.2 | 53.8 | 0.21 | 38.0 | 5.8 | 2.7 | |
| Tukey for K Treatments | 10 | 48.0 B | 37.5 A | 53.0 A | 0.12 C | 40.1 A | 10.8 A | 1.7 B |
| 20 | 51.0AB | 39.0 A | 52.0 AB | 0.16 BC | 40.2 A | 10.7 A | 1.8 B | |
| 40 | 52.9 A | 39.2 A | 50.4 B | 0.28 A | 39.3 A | 7.8 B | 1.9 AB | |
| 80 | 54.2 A | 40.9 A | 49.7 B | 0.22 AB | 39.4 A | 7.8 B | 2.6 A | |
| Tukey for Genotype | 405B | 45.1 b | 40.0 a | 47.3 b | 0.23 a | 41.0 a | 12.0 a | 2.0 a |
| 406W | 58.0 a | 38.0 a | 55.4 a | 0.16 b | 38.6 b | 6.6 b | 2.0 a | |
| K x Genotype | N.S. | N.S. | N.S. | N.S. | N.S. | N.S. | N.S. | N.S. |
| Phosphorus Treatment (mg L−1) | Height (cm) | Panicle Length (cm) | Days to Flowering (50%) | Harvest Index | SPAD | Number of Tillers per Plant | |
|---|---|---|---|---|---|---|---|
| Genotype 405B | 1 | 95.6 | 32.2 | 40.4 | 0.09 | 35.4 | 14.6 |
| 3 | 95.9 | 31.5 | 37.8 | 0.08 | 33.5 | 17.2 | |
| 6 | 100.7 | 33.1 | 37.4 | 0.10 | 37.4 | 13.8 | |
| 12 | 102.3 | 32.0 | 37.0 | 0.07 | 34.9 | 19.2 | |
| Genotype 406W | 1 | 94.7 | 24.8 | 54.2 | 0.04 | 36.8 | 8.8 |
| 3 | 97.3 | 30.7 | 54.2 | 0.03 | 34.9 | 12.8 | |
| 6 | 94.6 | 34.7 | 56.4 | 0.05 | 37.4 | 11.2 | |
| 12 | 97.7 | 34.6 | 56.4 | 0.03 | 37.0 | 10.8 | |
| Tukey for P Treatments | 1 | 95.6 A | 28.5 A | 47.3 A | 0.06 A | 36.1 A | 11.7 A |
| 3 | 97.3 A | 31.1 A | 46.0 A | 0.06 A | 34.2 A | 15.0 A | |
| 6 | 94.6 A | 33.9 A | 46.9 A | 0.08 A | 37.3 A | 12.5 A | |
| 12 | 97.7 A | 33.3 A | 46.7 A | 0.05 A | 37.0 | 15.0 A | |
| Tukey for Genotype | 405B | 98.9 a | 32.2 a | 38.2 b | 0.09 a | 35.3 a | 16.2 a |
| 406W | 96.1 a | 31.2 a | 55.3 a | 0.04 b | 36.5 a | 10.9 a | |
| P x Genotype | N.S. | N.S. | N.S. | N.S. | N.S. | N.S. | N.S. |
| Potassium Treatment (mg L−1) | Height (cm) | Panicle Length (cm) | Days to Flowering (50%) | Harvest Index | SPAD | Number of Tillers per Plant | |
|---|---|---|---|---|---|---|---|
| Genotype 405B | 0 | 101.0 | 31.8 | 37.8 | 0.11 | 35.0 | 17.0 |
| 40 | 100.7 | 33.1 | 37.4 | 0.10 | 34.4 | 13.8 | |
| 80 | 92.6 | 26.6 | 38.6 | 0.11 | 37.2 | 20.8 | |
| Genotype 406W | 0 | 108.0 | 32.5 | 60.0 | 0.05 | 37.1 | 11.0 |
| 40 | 94.6 | 34.6 | 56.4 | 0.05 | 37.3 | 11.2 | |
| 80 | 97.2 | 32.7 | 55.0 | 0.06 | 37.3 | 10.2 | |
| Tukey for K Treatments | 0 | 104.5 A | 32.1 A | 48.9 A | 0.08 A | 36.0 A | 14.0 A |
| 40 | 97.6 A | 33.9 A | 46.9 A | 0.08 A | 37.4 A | 12.5A | |
| 80 | 94.9 A | 29.7 A | 46.8 A | 0.08 A | 37.3 A | 15.5 A | |
| Tukey for Genotype | 405B | 98.1 a | 30.5 a | 37.9 b | 0.11 a | 36.5 a | 17.2 a |
| 406W | 99.9 a | 33.3 a | 57.1 a | 0.05 b | 37.2 a | 10.8 b | |
| K x Genotype | N.S. | N.S. | N.S. | N.S. | N.S. | N.S. | N.S. |
Publisher’s Note: MDPI stays neutral with regard to jurisdictional claims in published maps and institutional affiliations. |
© 2021 by the authors. Licensee MDPI, Basel, Switzerland. This article is an open access article distributed under the terms and conditions of the Creative Commons Attribution (CC BY) license (https://creativecommons.org/licenses/by/4.0/).
Share and Cite
Halpern, M.; Gashu, K.; Zipori, I.; Saranga, Y.; Yermiyahu, U. Tef (Eragrostis tef) Responses to Phosphorus and Potassium Fertigation under Semi-Arid Mediterranean Climate. Agronomy 2021, 11, 1588. https://doi.org/10.3390/agronomy11081588
Halpern M, Gashu K, Zipori I, Saranga Y, Yermiyahu U. Tef (Eragrostis tef) Responses to Phosphorus and Potassium Fertigation under Semi-Arid Mediterranean Climate. Agronomy. 2021; 11(8):1588. https://doi.org/10.3390/agronomy11081588
Chicago/Turabian StyleHalpern, Moshe, Kelem Gashu, Isaac Zipori, Yehoshua Saranga, and Uri Yermiyahu. 2021. "Tef (Eragrostis tef) Responses to Phosphorus and Potassium Fertigation under Semi-Arid Mediterranean Climate" Agronomy 11, no. 8: 1588. https://doi.org/10.3390/agronomy11081588
APA StyleHalpern, M., Gashu, K., Zipori, I., Saranga, Y., & Yermiyahu, U. (2021). Tef (Eragrostis tef) Responses to Phosphorus and Potassium Fertigation under Semi-Arid Mediterranean Climate. Agronomy, 11(8), 1588. https://doi.org/10.3390/agronomy11081588