Abstract
Karst is a widespread ecosystem with properties that affect the microbial activity and storage and cycling of soil organic carbon. The mechanisms underlying microbial resource availability in karst, which limit the microbial growth and activity in soil aggregates, remain largely unknown. We assessed the microbial resource limitations using exoenzymatic stoichiometry and key extracellular enzyme activities in bulk soil and aggregates in karst and non-karst forest soils. Soil organic carbon, total nitrogen, and microbial biomass carbon and nitrogen were significantly higher in bulk soil and the aggregate fractions in karst forests. However, the microbial biomass accumulation was higher in finer aggregates than in macroaggregate fractions. This may be attributed to the surface area of finer aggregates that increase the microbial C accumulation. In karst forests, the activity of extracellular enzymes β-d-glucosidase, β-N-acetylglucosaminidase, α-glucosidase, and α-d-1,4-cellobiosidase was two to three times higher in microaggregates (0.053–0.25 mm) and mineral fractions (<0.053 mm) than in macroaggregates. This coincided with the distribution of microbial biomass carbon and phosphorus in finer aggregate fractions. The microorganisms in bulk soil and aggregates in karst forests were largely co-limited by carbon and phosphorus and rarely by nitrogen and only by phosphorus in non-karst soils. The microbial phosphorus limitation in non-karst soils was alleviated in finer soil aggregates, while these fractions reflected slightly higher. microbial C limitations than bulk and other aggregates in karst forests. The patterns of microbial resource limitations in the bulk and aggregate fractions in karst ecosystems reflected the regulation of enzyme activity and soil organic carbon accumulation in finer aggregate fractions but not in other aggregates.
1. Introduction
Karst ecosystems cover a considerable amount of the world’s land area and are significant reservoirs for soil inorganic and organic carbon (SOC) [1,2,3,4,5]. SOC is concentrated in soils under changing global environmental conditions, which become more vulnerable to microbial decomposition, leading to flux emissions of CO2 [2] and further impacting the climate change. Information related to the mechanism for microbial SOC decomposition in karst soils is lacking.
Soil microorganisms regulate the nutrient cycle (C, N, and P); playing crucial roles in nutrient availability; and immobilization [6,7,8,9,10]. Microorganisms in the soil function optimally when the ratio of essential elements, such as N or P, relative to C (e.g., N:C or P:C) are above the threshold required for microbial growth [10,11,12,13]. The microbial biomass and activities in soil are thus constrained (or co-limited) by resource availability, which is considered as a microbial resource limitation [13,14,15,16,17] or substrate limitation [18]. Microbial processes in soil ecosystems are controlled by the percentage (over 50%) of C that microbial residues can add to C stock [19].
Microbial activities and growth should be further investigated [20] to improve our understanding of the biological processes of SOC sequestration in karst and non-karst ecosystems. This will help to predict the ecosystem’s response to environmental change.
Microbial resource availability is affected by land use, particularly in karst environments [21,22,23,24]. Land use changes are increasing because of human activity. Other influencing factors include the soil characteristics [25] and soil types [20]. Cumulatively, these account for differential patterns in microbial resource limitation.
While there is some understanding of the effect of resource limitation on above-ground plant growth, the effect on soil microorganisms is unclear [26,27,28]. Recent studies focused on resource limitation on microbes in soils [29,30,31,32]. However, it is not known which resources limit microbial growth in soil aggregates in karst forests.
Enzyme activity can be used to assess the microbial nutrient demand [33,34] and to develop an ecological response index that reflects the environmental changes [35,36]. β-glucosidase (BG) was used to assess the microbial responses to long-term N changes in tall grass prairie soils [34], and N-acetyl-glucosaminidase (NAG) was used to quantify the effect of N limitation on woody plant encroachment in grasslands [37]. Exoenzymatic stoichiometry indicates C and N limitations in soil processes, which are related to the substrate availability, soil pH, and climatic factors (e.g., precipitation and temperature) [36,38,39]. Studies indicate that the enzyme activity was influenced by the soil chemicals properties [40,41,42], temperature, moisture, and nutrient availability [43,44,45,46]. High Ca and Mg contents, as well as a high pH [47], affect the enzyme activity within karst ecosystems. The positive relationship between pH and enzyme activity, such as β-d-glucosidase (BG), polyphenol oxidase, and l-Leucine aminopeptidase (LAP), in karst forests explains the higher activity in karst than in non-karst forests [48]. In contrast, there is a negative relationship between pH and acid phosphatase (AP) and NAG activity, with a decrease in enzyme activity in karst forests [48]. Despite higher SOC levels in karst forests, microbes are limited by a lack of C. High levels of C limitations could be attributed to high Ca levels in karst forests, which combine strongly with SOC, leading to stabilization in a non-available form [49]. P in karst forests also react with Ca and precipitate as insoluble P, resulting in P limitations in karst forests. However, the degree of P limitation depends on the total P content (ten times higher than that in non-karst forests), which can reduce the P limitation. These factors influence the soil enzyme activity and microbial resource limitations, which are affected by the soil physical structure [50,51].
Soil aggregates provide a microenvironment for microorganisms and are important parameters for stability of the soil structure. They allow for the stabilization of C and N in the soil, which is a determinant of the soil fertility. Previous research has indicated that the storage capacities of SOC and N vary with the soil particle size and soil stability [52]. Local microaggregates contain less C, N, and P than large aggregates, and the C:N, C:P, and N:P ratios are relatively low [53], limiting the biological activities of these aggregates. The resource microbial limitation in the bulk and aggregate fractions has not been studied in karst ecosystems. In this respect, the identification of such limits, particularly across soil aggregates, is crucial for understanding the mechanisms responsible for resource limitations.
We studied the bulk soil and aggregate fractions in a typical karst ecosystem in one of the largest karst areas in the world located in Southwest China. We identified extracellular enzymes as indicators to distinguish the mechanisms responsible for the overall C, N, and P acquisition in bulk soil and aggregate fractions. Non-karst soils were used as the control for comparison. We wanted to compare the differences in aggregation between the two ecosystems. We hypothesized that the microbial and enzyme activity would be higher in macroaggregates, as indicated by the aggregate hierarchical model, and that limited microbial C and P would follow a similar pattern in the bulk and aggregate fractions. Therefore, we aimed to benefit from the microbial and enzymatic activities in such soils in relation to nutrient availability to improve our understanding of the biological processes of SOC sequestration in karst and non-karst ecosystems and, at the same time, to predict the ecosystem response to environmental change.
2. Materials and Methods
2.1. Study Sites
Both karst and non-karst forests (two 35-year-old forest ecosystems), exposed to the same edaphic, climatic, and topographic conditions and derived from calcareous and red soils, respectively, were studied. The site was located in Huanjiang County (24°42′–25°02′ N; 107°7′–108°21′ E) in the Guangxi Zhuang Autonomous Region in Southwest China. The mean annual temperature ranged from 17.8 to 21.1 °C, and the annual rainfall ranged from 1346 to 1498 mm, with distinct seasonal patterns. The area supports subtropical, humid forests. The major lithology of karst areas was limestone and, to a lesser extent, dolomite, whereas clasolite was the major lithology of non-karst areas. The area was characterized by gentle valleys flanked by steep hills. The soils are classified according to the FAO/UNESCO system [3,54] as calcareous (limestone) and Haplic acrisol (red) over the karst and non-karst areas, respectively. The distance between the two sites was about 26 km. Coordinates and soil texture details, as well as dominant tree species of the two ecosystems, are provided in Table S1.
2.2. Soil Sampling
The organic layer was removed from a representative area of 100 m × 100 m in each forest ecosystem. Nine 10 m × 10 m plots were selected for soil sampling. Soil samples were collected from a depth of 0–10 cm at three sampling points in each plot, using soil cores and mixed as one composite sample. Three replicate soil samples were collected for nine plots in each ecosystem. Roots and stones were removed using forceps, and soils were broken by hand, passed through an 8-mm sieve (bulk soil) and divided into two portions. One portion of each soil sample was passed through a 2-mm mesh sieve and air-dried to determine the physiochemical properties. The second portion was kept on ice and stored at 4 °C for soil aggregate fractionation and analyses of the soil enzyme activity.
2.3. Soil Aggregate Fractionation
The microbiological analysis was as per reference [55]. The soil aggregates were separated into four aggregate size fractions (>2 mm, 0.25–2 mm, 0.053–0.25 mm, and <0.053 mm) using a sequence of sieves (2 mm, 0.250 mm, and 0.053 mm). Samples with an equivalent weight of 100 g of oven-dried soil (sieved to less than 8 mm and stored at 4 °C) were submerged in deionized water 1 cm deep. This was placed atop the 2-mm sieve nest in a 0.053-mm sieve for 5 min before the wet-sieving process. Soils were sieved by gently moving the sieve up and down in the water for 50 repetitions, with an amplitude of 3 cm, over a period of 2 min. The floating organic material >2 mm was aspirated, and the remaining aggregates were transferred to an aluminum cane and recovered as >2-mm soil macroaggregates. Macroaggregates (0.25–2 mm) and microaggregates (0.053–0.25 mm) were recovered from the soil slurry from the 2-mm and 0.250-mm sieves, respectively. The final slurry from the 0.053-mm sieve was centrifuged at 2500 rpm for 2 min, decanted, and <0.053-mm silt and clay particles were collected [55]. One complete fractionation procedure took approximately 3 h. The moisture content was determined from an aliquot of each fraction. A subsample was freeze-dried for an analysis of the soil physical and chemical properties. The remainder of the moist soil fractions were stored at 4 °C for 3 d for enzyme analyses.
2.4. Measurements of Soil Properties and Enzyme Activities
Air-dried subsamples of the bulk soil and all aggregate fractions were analyzed for the physicochemical properties, including SOC (soil organic carbon, total N (TN), dissolved organic C (DOC), total dissolved N (TDN), available P (AP), and pH as per reference [56]. Fresh bulk soil and all aggregate samples were analyzed for the microbial biomass of C (MBC, microbial biomass carbon), N (MBN, microbial biomass nitrogen), and P (MBP, microbial biomass phosphorus) using the chloroform fumigation extraction method [57,58] and analyzed for enzyme activity [55,59,60]. The activity of seven extracellular enzymes: BG, LAP, NAG, AP, β-1,4-xylosidase (BX), α-glucosidase (AG), and α-d-1,4-cellobiosidase (CBH), were assayed using the microplate protocol, as described by reference [61]. The enzyme activity was expressed as nmol g−1soil h−1.
The microbial resource limitation was assessed using four approaches [57]. Exoenzymatic stoichiometry scatter plots between (LAP + NAG):AP and BG:(LAP + NAG) were used to show the resource limitations of four groups (N, P, C, and N and C and P limitations), based on the deviation from the expected enzyme activity ratios of C:N (1:1) or N:P (1:1) [62]. Higher data points within one of four different groups indicated one resource limitation group.
The enzyme activity ratios were determined, particularly BG:(LAP + NAG) and BG:AP, where higher values represented lower N and P limitations, respectively [38]. A vector analysis was determined through exoenzymatic stoichiometry [63]. The vector length (unitless) and vector angle (degree) were calculated using Equations (1) and (2), as follows:
A relatively longer vector L indicates a greater C limitation, while angles <45° and >45° indicate the relative degrees of the N and P limitations, respectively [34].
The Threshold Elemental Ratios (TER) for C:N and C:P (TERC:N and TERC:P) were calculated using Equations (3) and (4), as follows [38]:
where TERC:N and TERC:P are the threshold ratios (dimensionless), BC:N and BC:P are the C:N or C:P ratios of the microbial biomass, and n0 and p0 are the dimensionless normalization constants for N and P, respectively. n0 and p0 are the intercepts from the regressions of ln(BG) vs. ln(NAG + LAP) and ln(BG) vs. ln(AP), respectively. TER was used to reflect the microbial resource limitation by comparing it to the available soil C:N and C:P ratios. Resource limitations were indicated if the available soil C:N or C:P ratio was greater than the TER for that element [11].
TERC:N = (BG/(NAG + LAP)) × BC:P/no
TERC:P = (BG/AP) × BC:P/p0
Data were tested for normality and homogeneity before analysis. A nonparametric independent sample test was performed for significance. Correlation and regression analyses were performed to determine the relationship between the studied variables. Statistical analysis was performed using SPSS statistical software (version 21.0, IBM SPSS Inc., New York, NY, USA). A redundancy analysis (RDA) was used to evaluate the effect of the environmental factors on the enzyme activity and the ratios of BG:(NAG + LAP), (NAG + LAP):AP, and BG:AP. The RDA was measured out using CANOCO software (version 5.0, Microcomputer Power, Inc., Ithaca, NY, USA). A manual forward selection procedure was implemented in the RDA to determine the significance of the environmental variables (p < 0.05) using a Monte Carlo test with 999 permutations.
3. Results
3.1. Soil Properties
The soil properties differed in karst and non-karst soils (Table 1). The SOC, MBC, AP, and MBP were significantly higher in the bulk soils and all soil aggregate fractions in karst forests. In karst forests, the SOC in macroaggregates (>2 mm) was significantly lower than in microaggregates (0.053–0.25 mm). However, the SOC did not change significantly between the bulk soil and aggregate fraction in non-karst forests.

Table 1.
Differential soil properties between karst and non-karst forests in Guangxi, Southwest China. Values are the M ± SE.
The TN was significantly higher in the bulk and all aggregate fractions in karst forests than in the corresponding soil aggregate fractions in non-karst forests, while the C:N ratio did not differ significantly between both ecosystems. In karst forests, the highest DOC levels were detected in microaggregates, followed by macroaggregates and mineral particles, while the highest levels of DOC were detected in mineral particles in non-karst forests. Similarly, the TDN was higher in mineral particles and microaggregate fractions than in other fractions in karst forests. The TDN was significantly higher in the bulk soil and >2-mm aggregates in non-karst soils. The <0.053-mm fraction in karst forests had a higher TDN content than the corresponding soil aggregate faction in non-karst forests (Table 1). The available P was higher in the 0.25–2-mm fractions than in the bulk soil and other aggregate fractions in both ecosystems; it was also higher in karst forests.
The MBC of karst forests increased in bulk, large aggregates, macroaggregates, microaggregates, and mineral particles by 1.6, 2.6, 2.9, 3.0, and 5.0 times, compared to the corresponding bulk and aggregate fractions in non-karst forests, respectively. Similarly, the MBN was one to five times higher in soil aggregate fractions in karst forests. The MBP accumulated one-and-a-half to two times more in soil microaggregates than in other soil fractions in karst forests. Similar trends were detected to a lesser extent in the non-karst forest ecosystem.
3.2. Soil Enzyme Activity
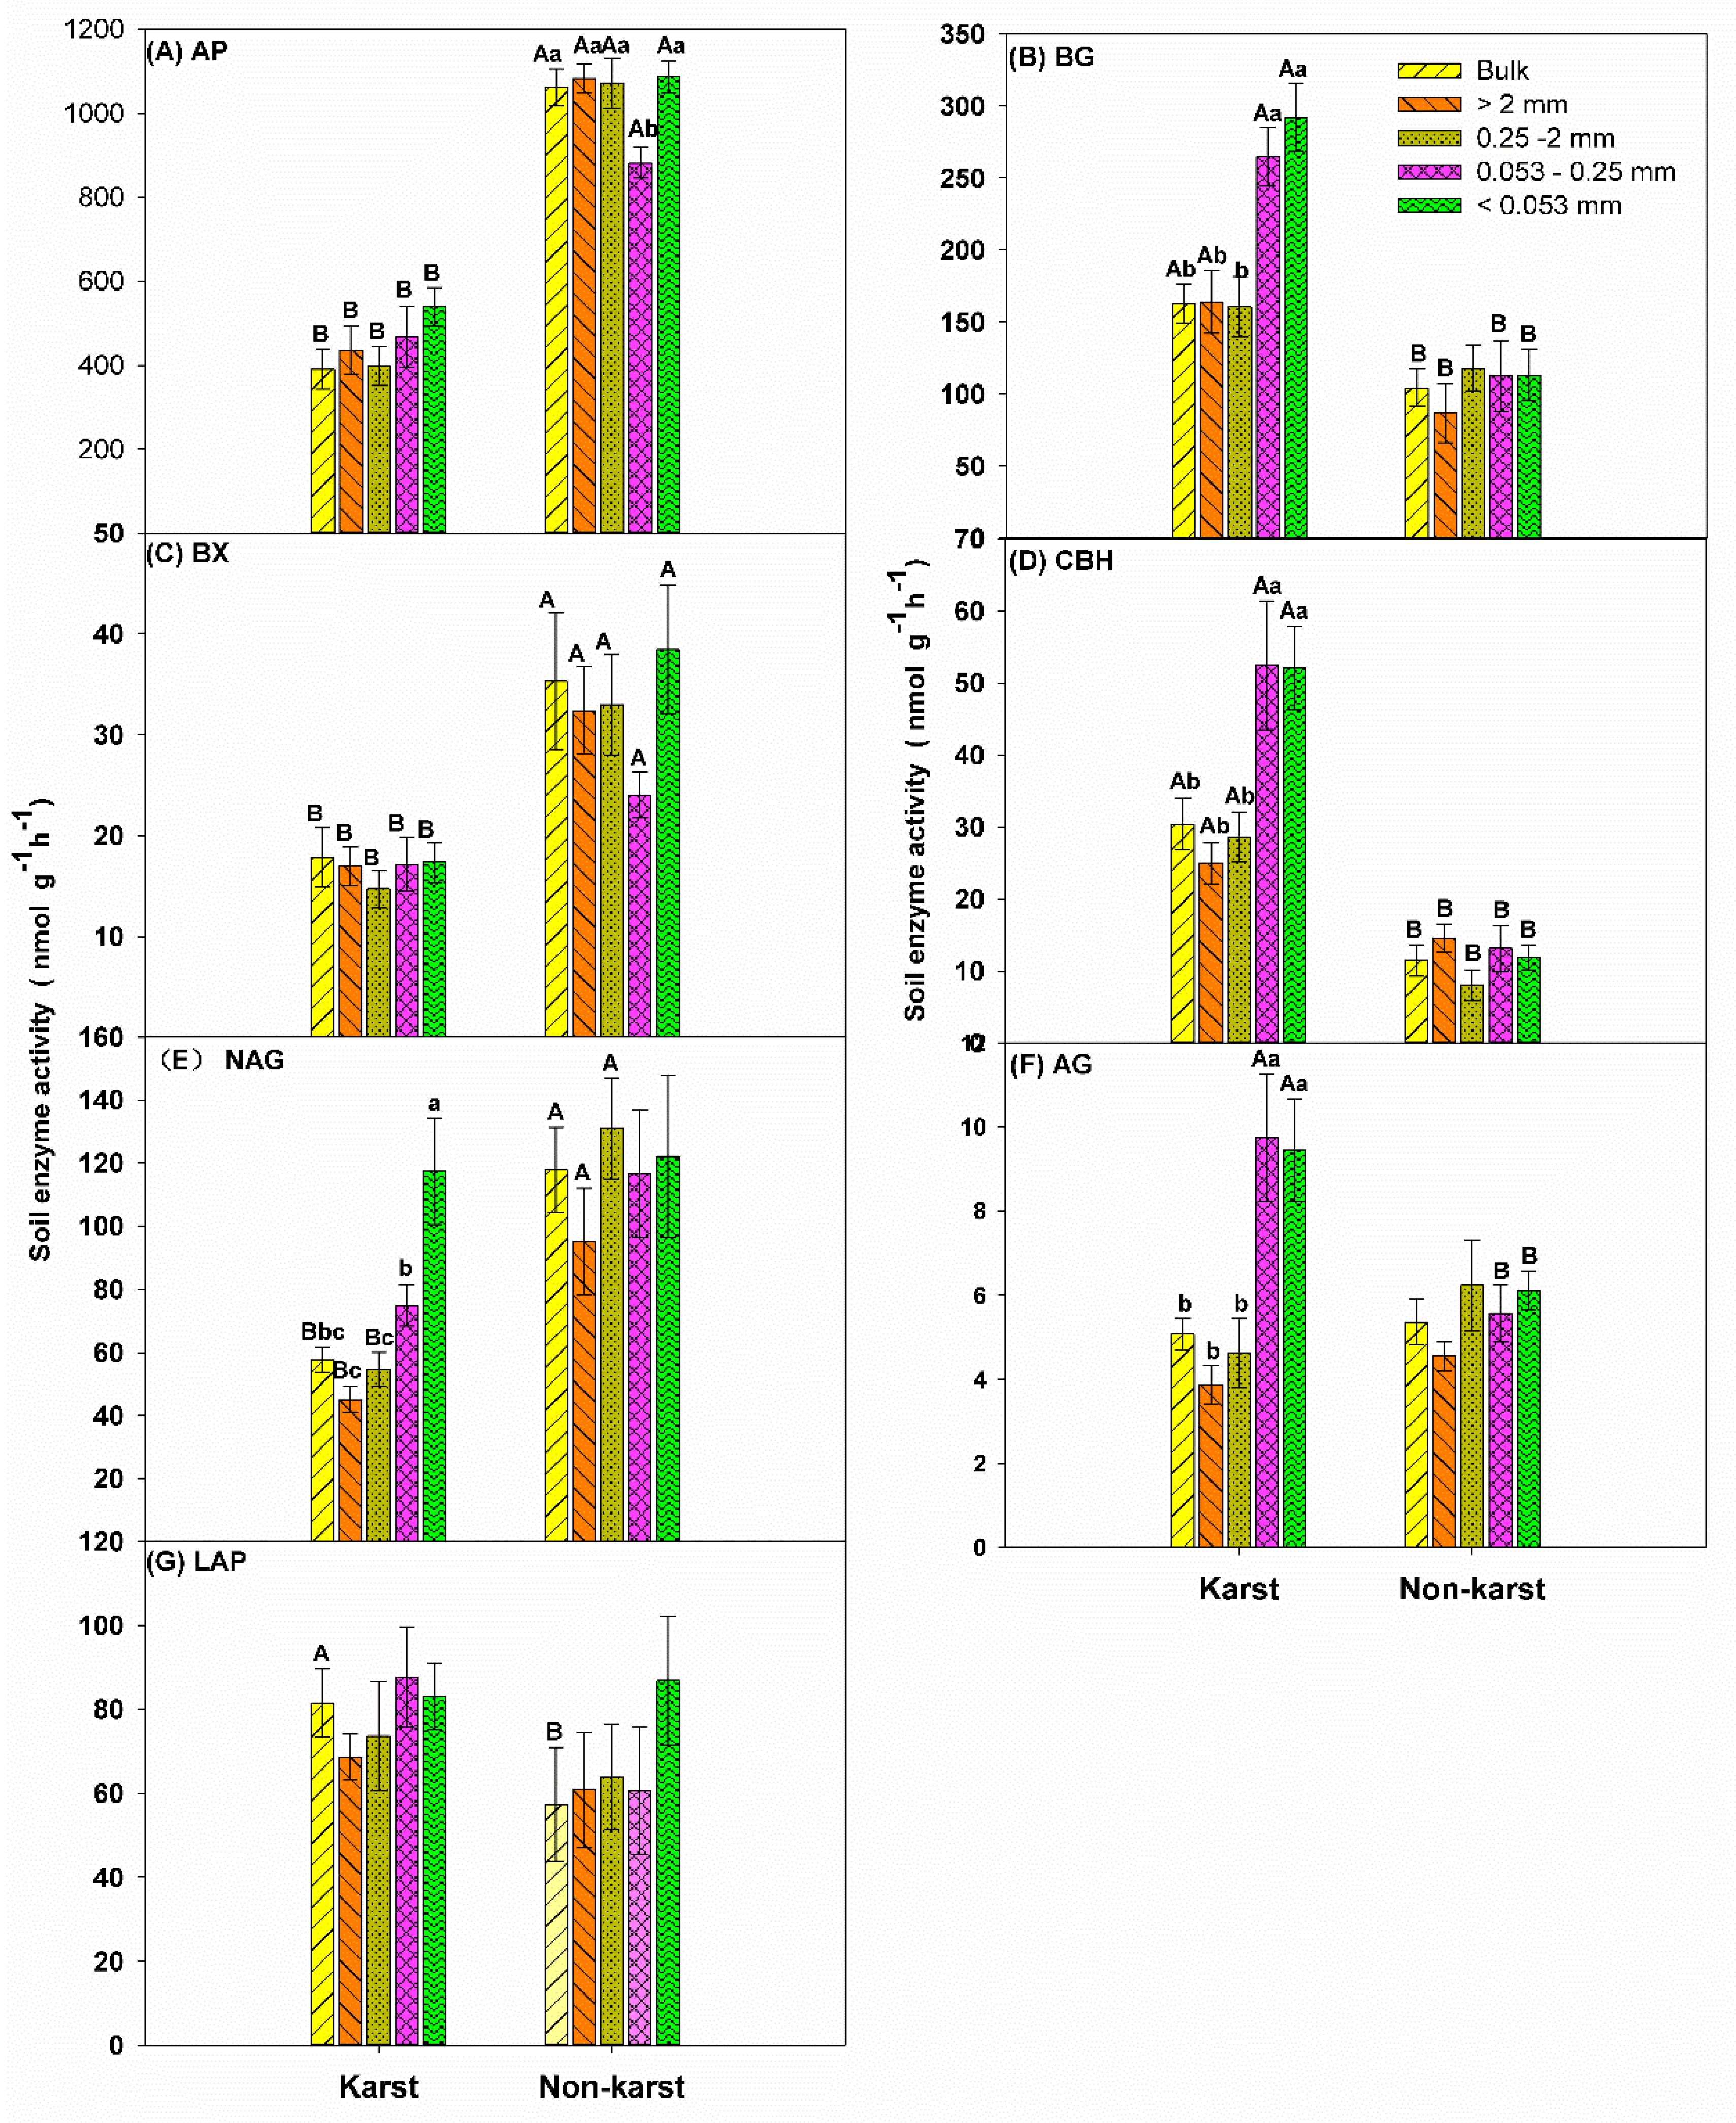
The enzyme activity (nmol h−1 g−1) varied between ecosystems and soil aggregate fractions (Figure 1). AP, BX, and NAG activities were higher in non-karst forests (Figure 1A,C,D). However, BG, AG, and CBH activities were higher in karst forests (Figure 1B,E,F). LAP activity was unaffected by the ecosystem type (Figure 1G).
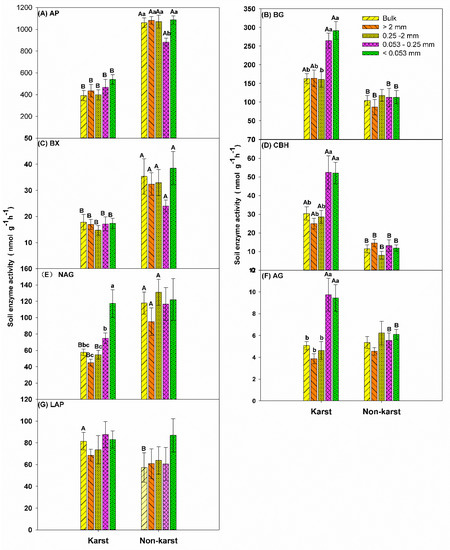
Figure 1.
Soil enzyme activity (nmol h−1 g−1) in the bulk soil and aggregates in the forest ecosystems. Error bars represent the standard deviation. Capital letters indicate differences among the forest ecosystems in the same aggregate size. Lowercase letters indicate differences in the aggregate size fractions in the same forest ecosystem. Phosphatase (AP), β-glucosidase (BG), β-1, 4-Xylosidase (BX), cellobiohyrolase (CBH), β-N-acetylglucosaminidase (NAG), α-Glucosidase (AG), leucine aminopeptidase (LAP).
The activity of AP and BX were lower in the 0.053–0.25-mm microaggregates than in the bulk soil and other soil aggregate fractions in non-karst forests (Figure 1A,C). The soil BG, NAG, AG, and CBH activities were significantly higher (two to three times) in 0.053–0.25-mm microaggregates and soil mineral particles (<0.053 mm) compared to the other aggregate fractions in karst forests (Figure 1B,D–F). The changes in the activity of AP, BX, and LAP in karst forests and CBH, LAP, BG, NAG, and AG in non-karst forests were not significant for the soil aggregate fractions. This confirmed that the ecosystem type is important for shaping enzyme activity (Figure 1).
3.3. Exoenzymatic Stoichiometry Ratio
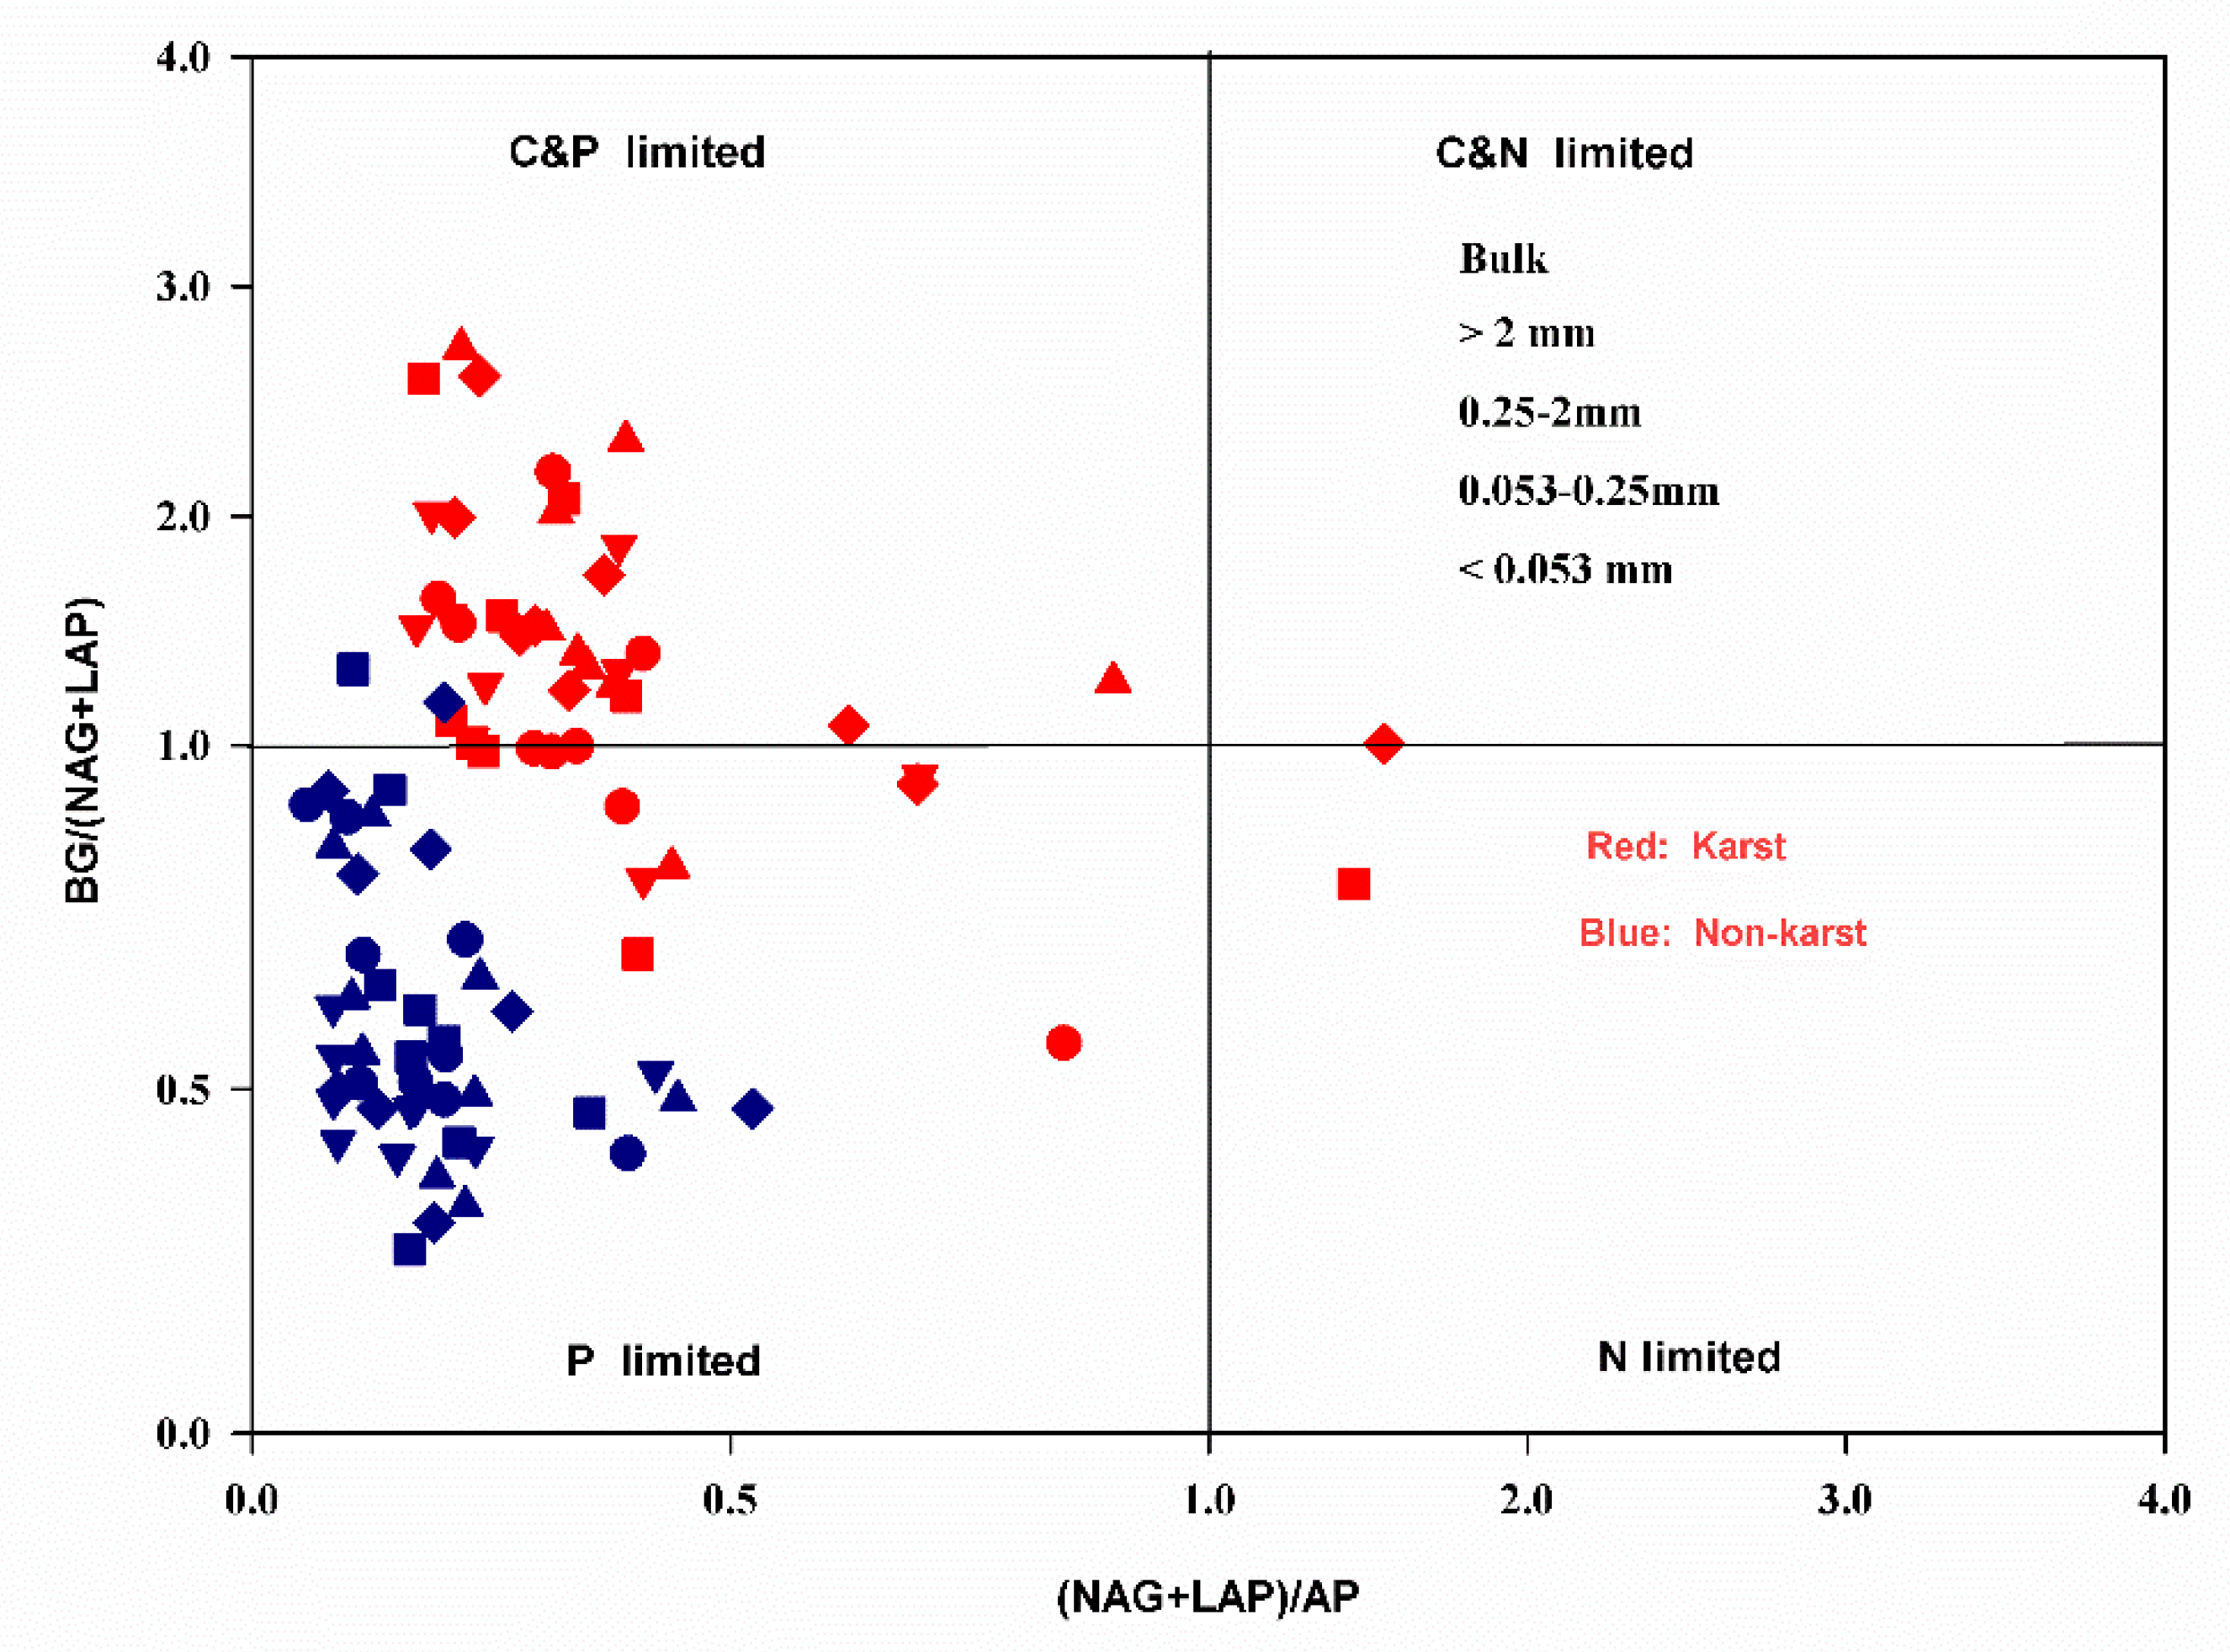
The exoenzymatic stoichiometry scatter plots showed that most of the data points for the aggregate fractions of the non-karst forests fell within the P limitation group (Figure 2). Most aggregates in the karst forests were co-C and P-limited. Some showed P limitations, while only a few points of 0.053–0.25 mm microaggregates fell within the N limitation group (Figure 2).
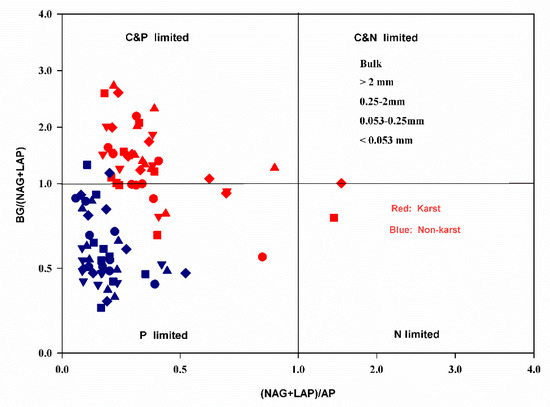
Figure 2.
Scatter plots of the soil exoenzymatic stoichiometry for the studied sites. Red and Blue dots represent karst and non-karst, respectively. Different symbols represent different aggregate sizes.
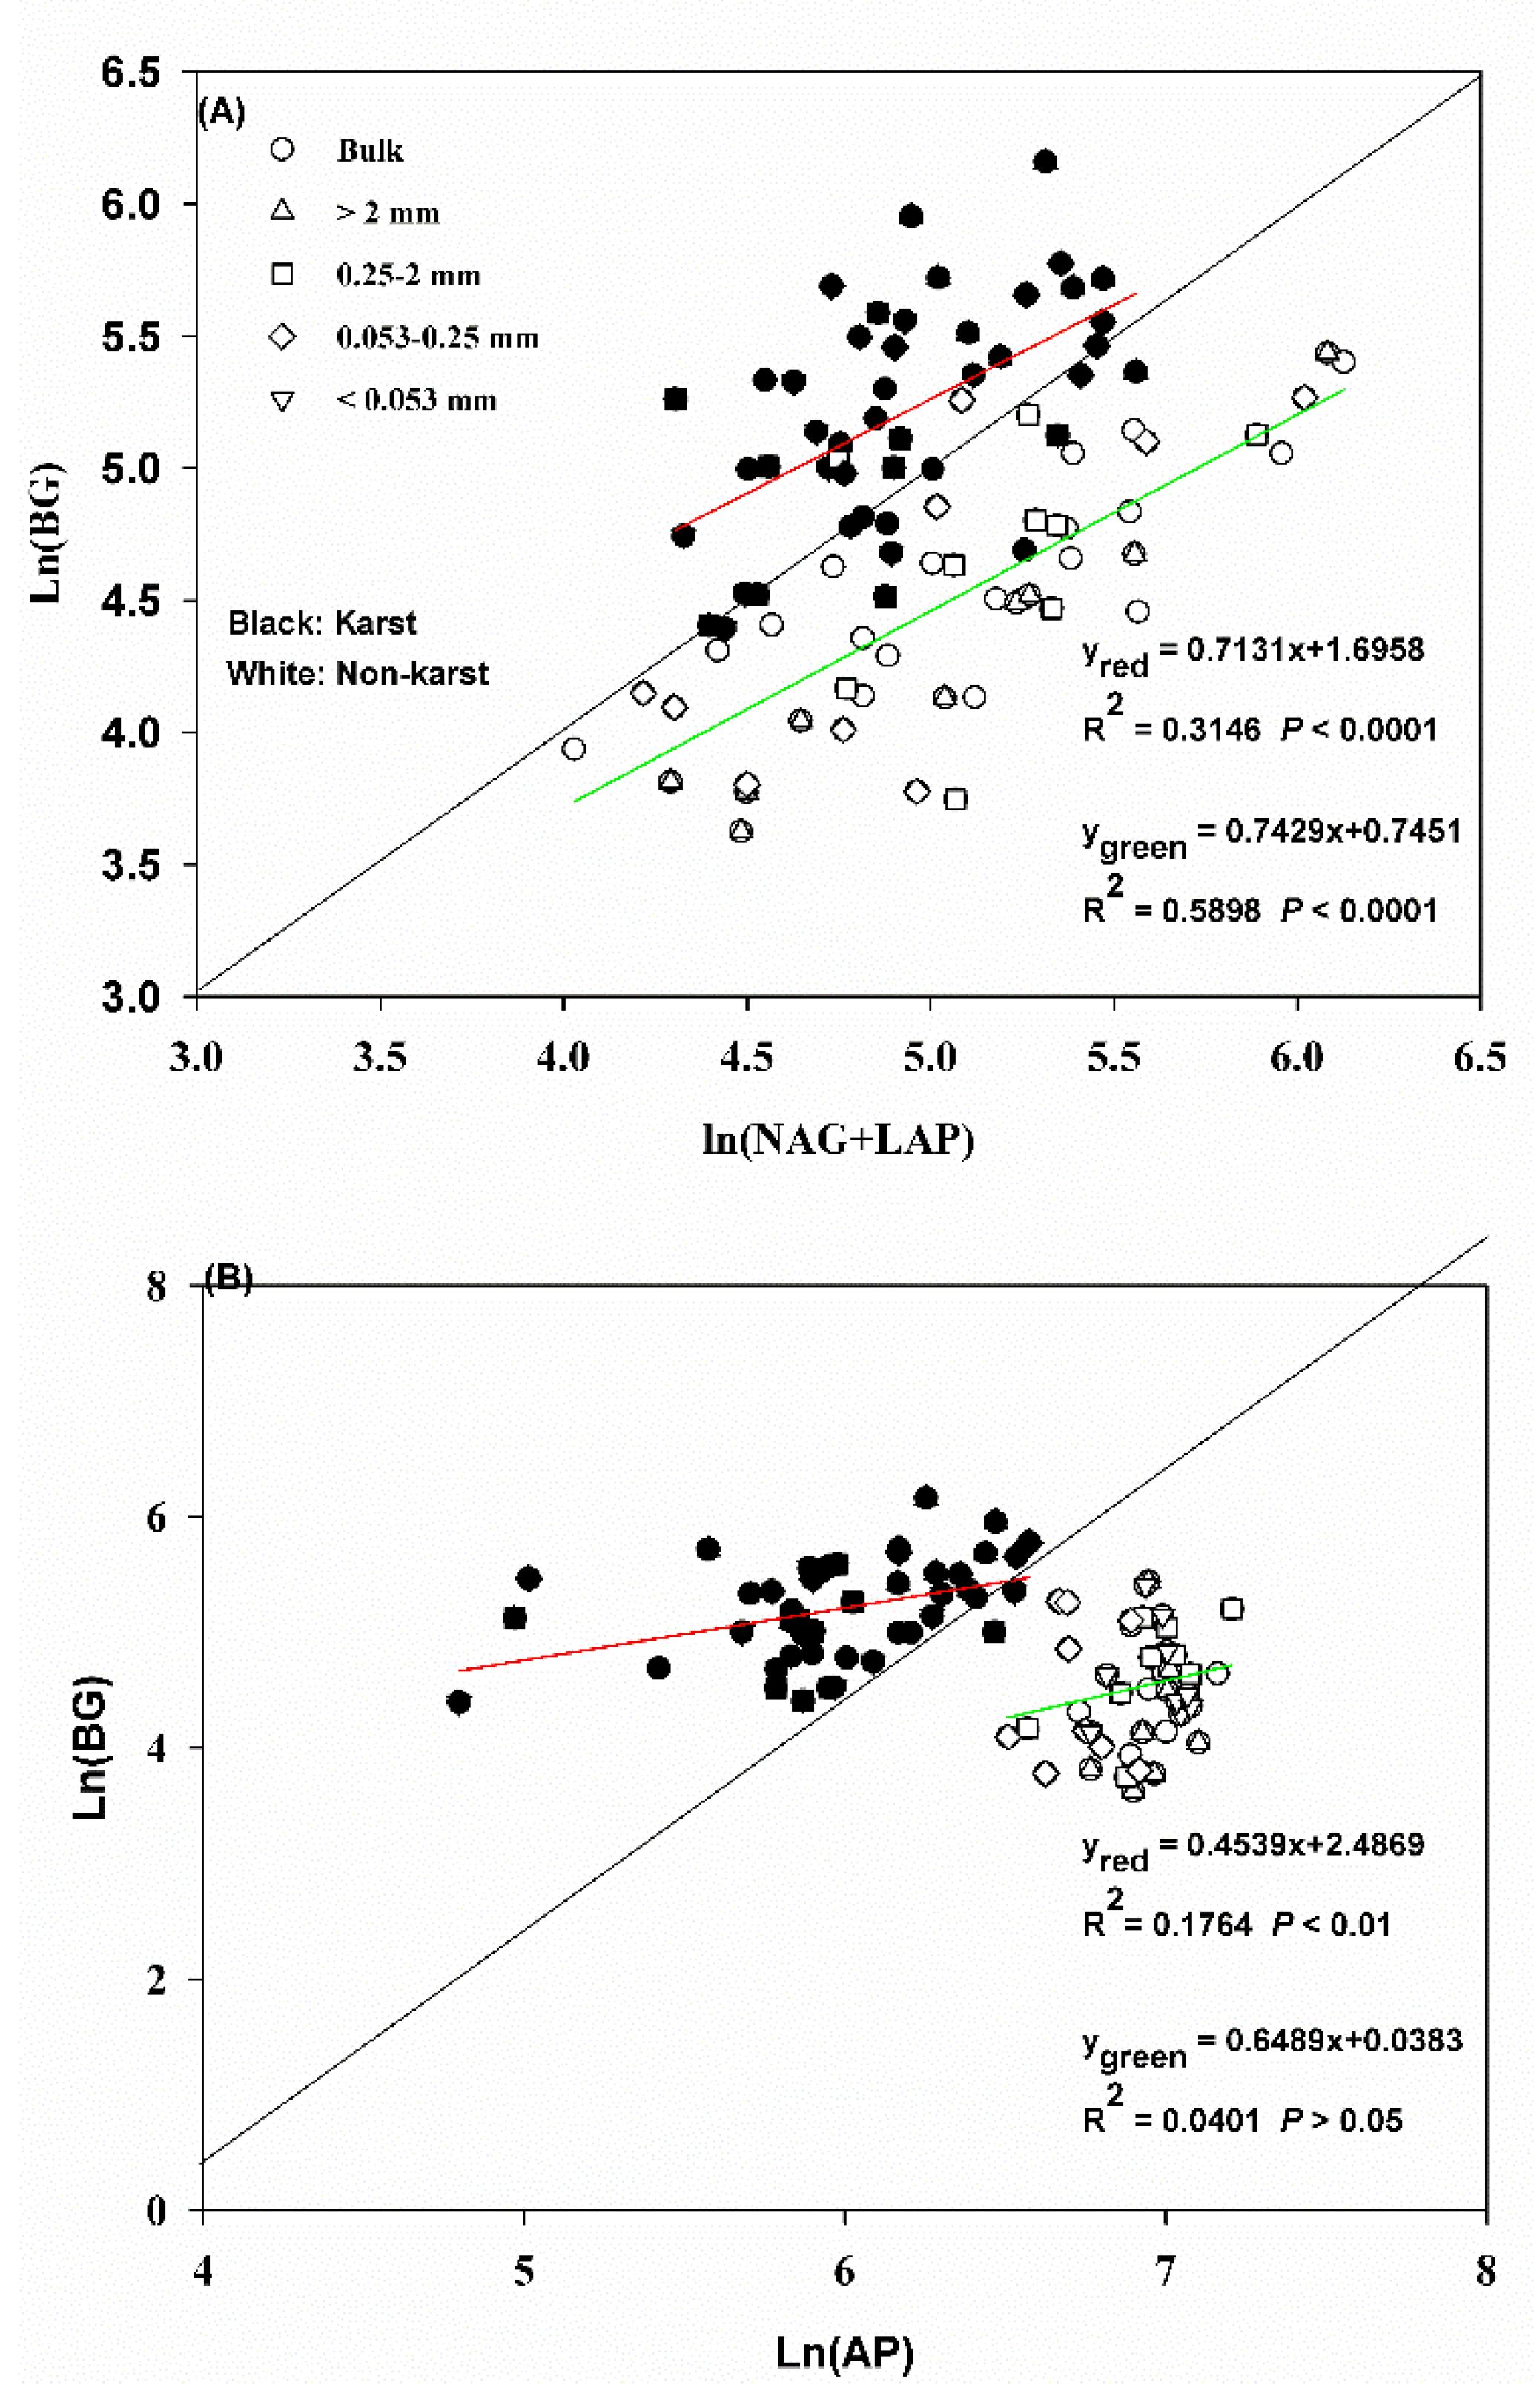
The acquisition activity of N and P was significant (significant relationships p < 0.0001) compared to the C acquisition activity in the bulk soil and aggregates in both ecosystems (Figure 3A,B). The regression slopes for Ln (BG) vs. Ln (NAG + LAP) and Ln (BG) vs. Ln (AP) were 0.71 and 0.45 in karst forests and 0.74 and 0.65 in non-karst forests, respectively. The N and P acquisition activity in relation to the C acquisition activity in both soils fell mostly along the 1:1 line and was higher in karst forests.
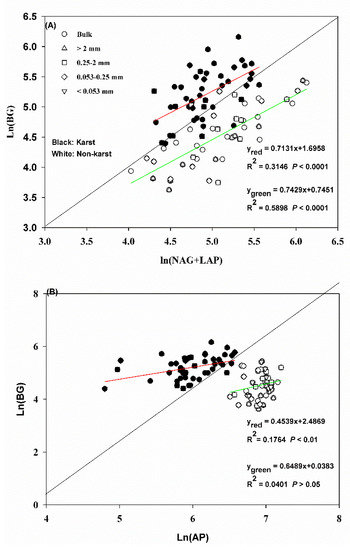
Figure 3.
(A) C–N stoichiometric relationships in the bulk soil and aggregates in the forest ecosystems for enzymes. (B) C–P stoichiometric relationships in the bulk soil and aggregates in the forest ecosystems for enzymes. Black and white dots represent karst and non-karst, respectively. Error bars represent the standard deviation. Capital letters indicate differences among the forest ecosystems in the same aggregate size. Lowercase letters indicate differences in the aggregate size fractions in the same forest ecosystem.
There were no significant changes in the vector length for the bulk soil and all aggregates across the ecosystems. However, the vector length was significantly longer in karst (1.36) than in non-karst forests (1.1) (Figure 4). The vector angle was significantly lower in karst than non-karst soils, but it was higher than 45° (vector angle > 45°) in both ecosystems. The ratios of BG:AP, BG:(NAG + LAP), and (NAG + LAP):AP were significantly higher in the bulk soils and all aggregates across the karst ecosystems (Figure 5). The ratios in the karst soils were 2.5–4 times higher than in the non-karst soils.
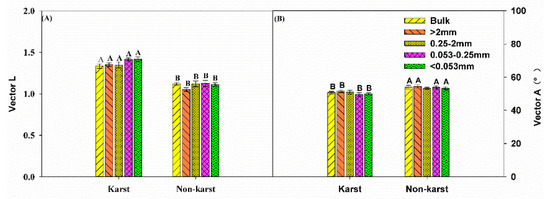
Figure 4.
Vector length (A) and vector angle (degree) (B) between the karst and non-karst forests. Error bars represent the standard deviation. Capital letters indicate differences among the forest ecosystems in the same aggregate size.
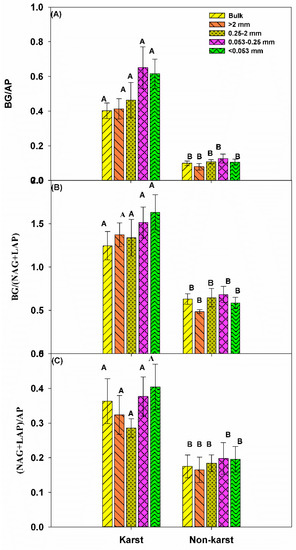
Figure 5.
The proportion of enzyme activity associated with C, N, and P. BG, β-d-glucosidase. Error bars represent the standard deviation. Capital letters indicate differences among the forest ecosystem in the same aggregate size.
The critical ratio or TER of C:N (Figure 6A) and C:P (Figure 6B) required for optimum growth were significantly higher in karst forests. The TER values in karst forests were 0.4–4.2 (TERC:N) and 2.2–15.4 (TERC:P) times higher than in non-karst forests. The TERC:N in mineral particles (<0.053 mm) was significantly higher in other aggregate fractions than in karst forests, whereas it was significantly higher in microaggregates (0.053–0.25 mm) in non-karst forests compared to other aggregates within the same ecosystem (Figure 5A).
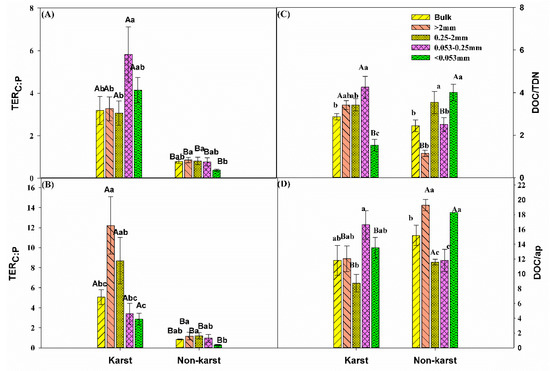
Figure 6.
Comparisons of (A) the TER of C:N, (B) TER of C:P, (C) available C:N ratio (i.e., DOC:TDN), and (D) available C:P ratio (i.e., DOC:AP) between the karst and non-karst forests. Error bars represent the standard deviation. Capital letters indicate differences among the forest ecosystems in the same aggregate size. Lowercase letters indicate differences in aggregate size fractions in the same forest ecosystem. TER, Threshold Elemental Ratios; DOC, dissolved organic C; AP, acid phosphatase.
The TERC:P in non-karst forests was the lowest for the soil mineral particles (<0.053 mm) compared to other aggregates (Figure 5B). DOC:AP in non-karst forests was significantly higher in the bulk and macroaggregates (0.25–2 mm) than in the other aggregate fractions within the same forests but was the highest (0.25–2 mm) in karst forests (Figure 5C).
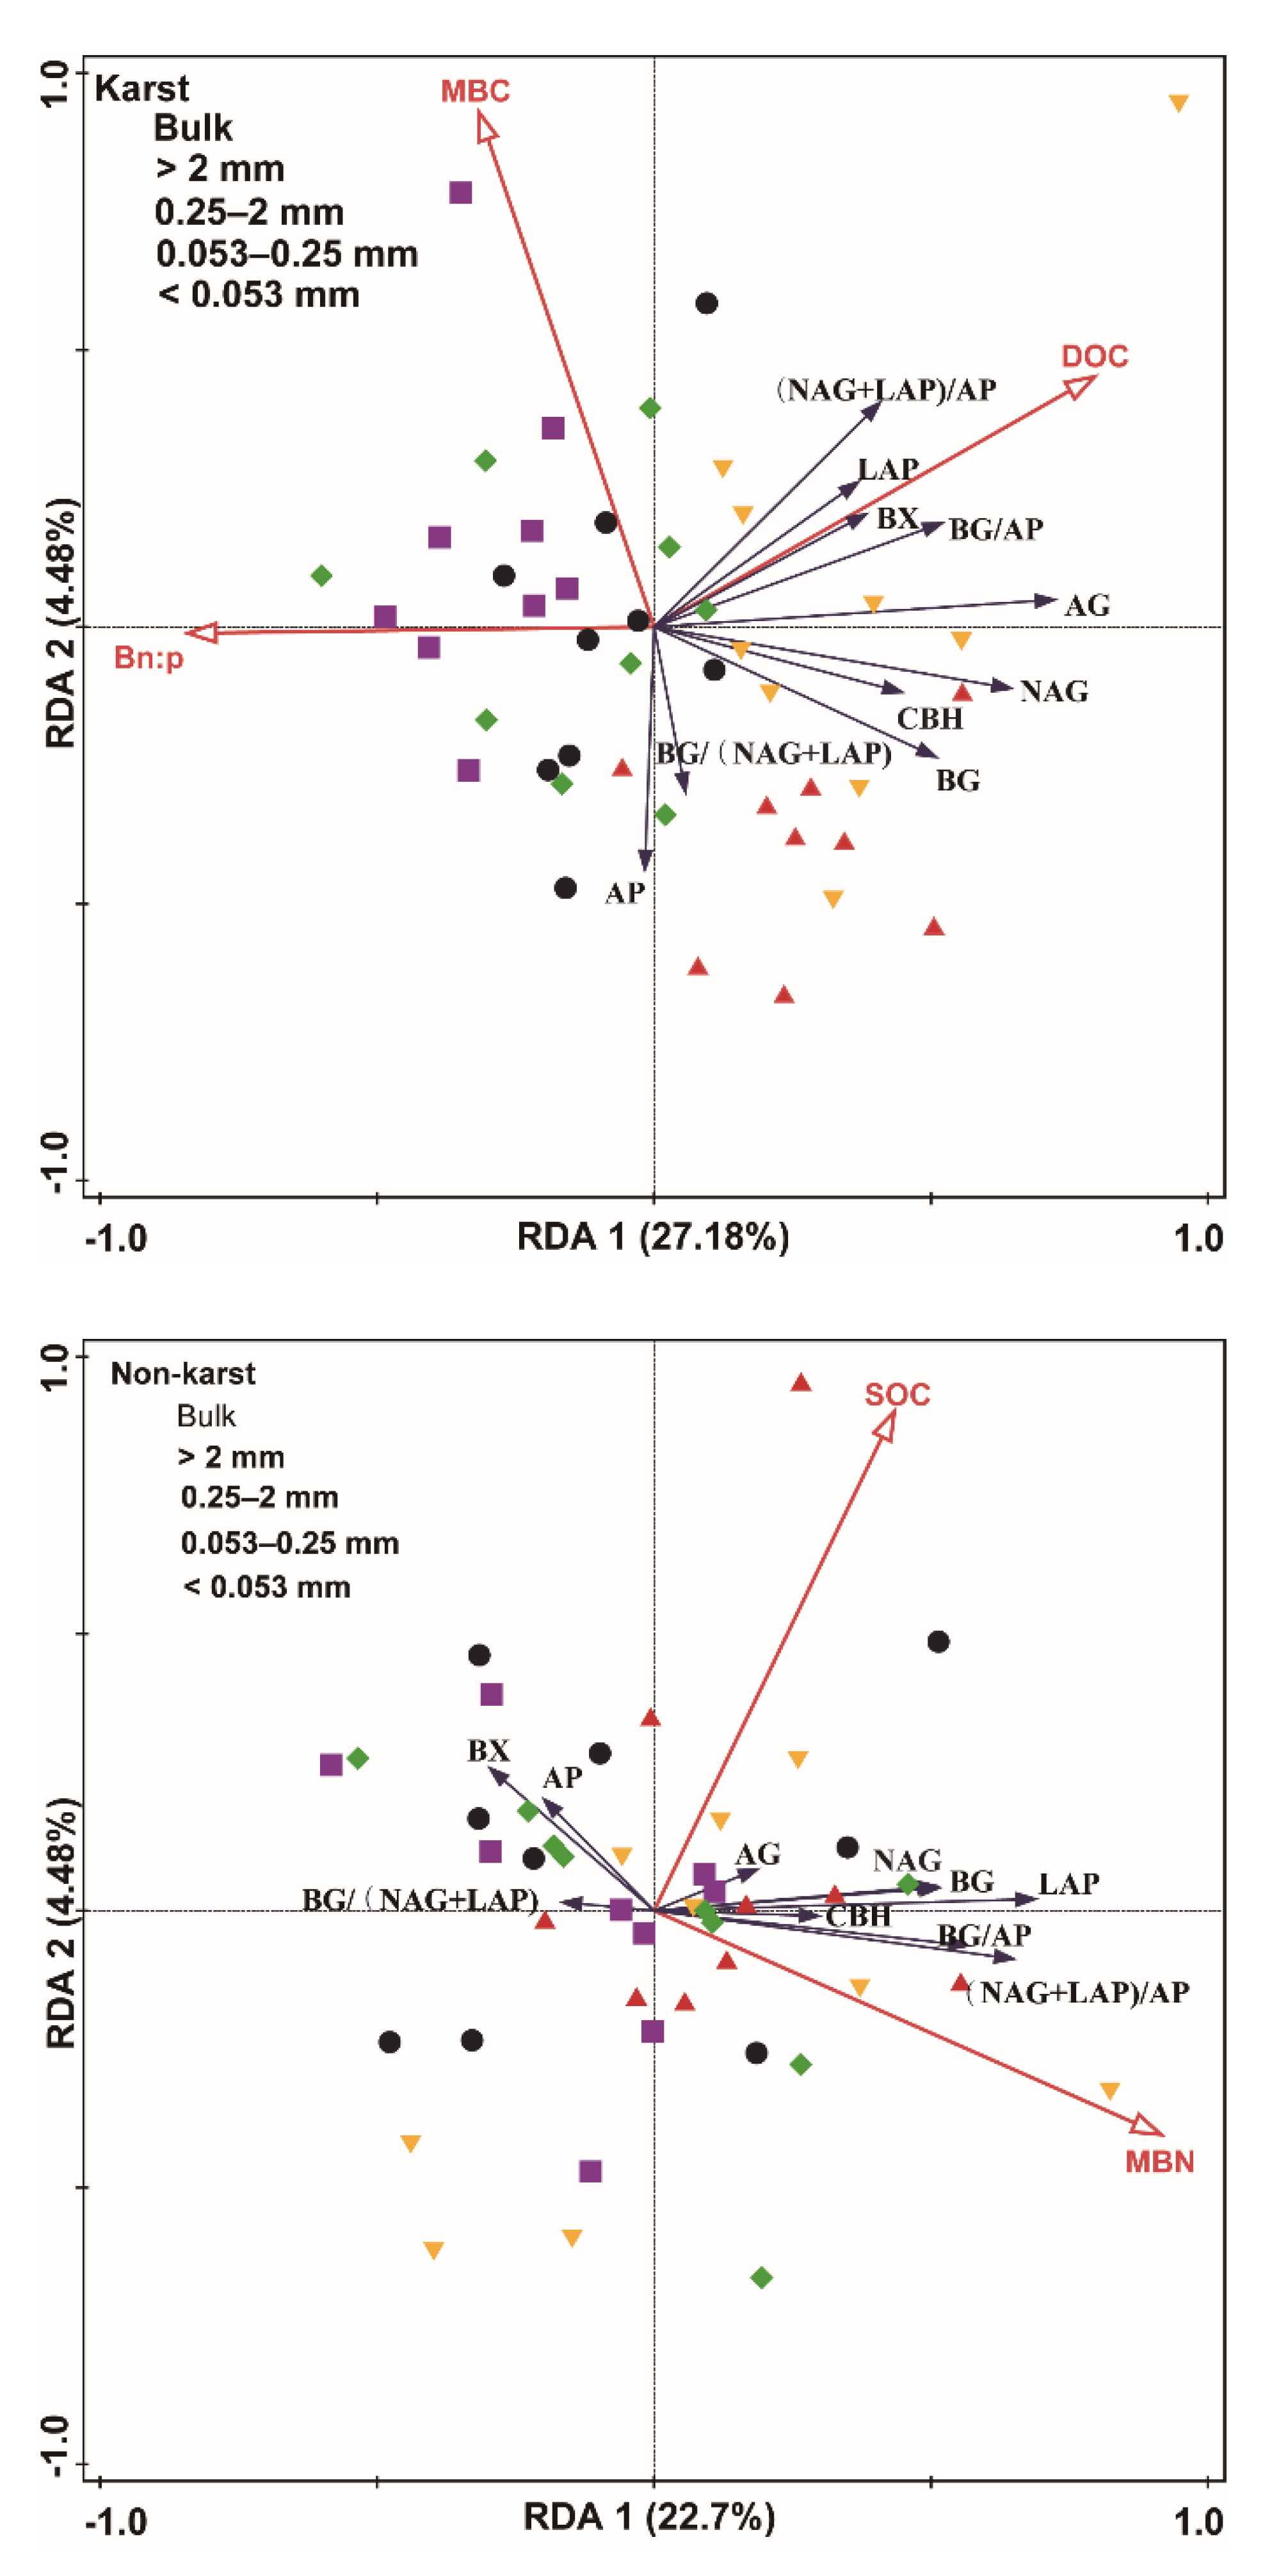
The RDA indicated that the environmental variables induced 327% and 23.7% of the variance in the enzyme activity and enzyme stoichiometric ratio of karst and non-karst soils, respectively. The RDA model selection procedure indicated that the MBC, DOC, and Bn:p were significant predictors of the enzyme activity and the enzymatic stoichiometric ratio in karst soils. The SOC and MBN were significant predictors for enzyme activity and the enzymatic stoichiometric ratio in non-karst soils (Figure 7).
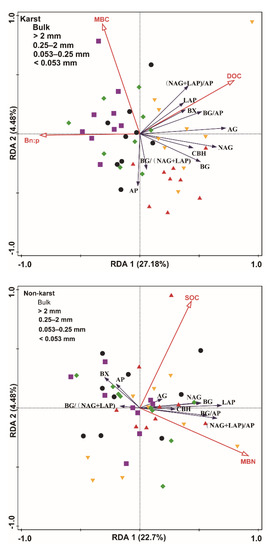
Figure 7.
Redundancy analysis (RDA) plot showing the relationship between the environmental factors and the enzyme activity and enzyme stoichiometric ratio of karst and non-karst forests. Percentages indicate the proportions of variance explained by each axis. Red lines represent the environmental variables, and blank lines represent the enzyme activity and enzyme stoichiometric ratio.
4. Discussion
4.1. Effect of Soil Properties on Individual Enzyme Activity in Karst and Non-Karst Forests
Recent studies indicated that karst ecosystems have unique ecological and chemical properties. Karst ecosystems usually have higher levels of OM, pH, Ca, and Mg than other ecosystems [2,3,4,48]. We observed significantly higher levels of SOC, TN, MBC, MBN, and MBP in karst forests. This could be attributed to litter removal or addition in karst ecosystems, which was not the case in non-karst ecosystems [64,65]. The decomposition of litter is the first step in the formation of soil humus [66] and can be affected by the nutrient availability and decomposers in the soil [67].
We observed a greater accumulation of MBP and MBC in finer aggregates (<0.053 mm) than in macroaggregates in karst forests (Table 1), which is consistent with the observations by Dorodnikov and Li [68,69]. The accumulation of MBC in finer aggregate fractions is usually due to higher specific surfaces for microbial habitats and greater protections of microorganisms from predation by protozoa or from desiccation, which help in stabilizing microbial residues [69,70] and may cause high levels of C sequestration in karst forests. MBP accumulated more in finer aggregates in both karst (<0.053mm and 0.053–0.25mm) and non-karst (<0.053 mm) ecosystems for the same reason. We found similar patterns in the enzymes activity (BG, NAG, LAP, and AP) in both ecosystems to those in Chen [62]. The BG, AG, and CBH activity were generally higher in karst forests (Figure 1B,E,F). In contrast, the AP, BX, and NAG activity were higher in the aggregates in non-karst forests (Figure 1A,C,D). Distinct soil properties in the ecosystems in the current study (Table 2) were the main factor affecting the enzyme activity in the ecosystems. Higher BG, AG, and CBH activity in karst forests may result from higher MBC, SOC, and DOC levels in these ecosystems. As mentioned in other studies, the enzyme activity was positively related to these indexes [36,71]. Alternatively, the increase might be related to higher pH levels in karst forests [48]. The enzyme activity in the bulk and aggregate fractions in both ecosystems was also related to the soil properties. The BG, NAG, AG, and CBH activities were significantly higher (two to three times) in 0.053–0.25 mm microaggregates and in soil with mineral particles <0.053 mm than in other aggregate fractions in karst forests, which coincides with the distribution of MBC in finer aggregate fractions, and maybe this is also the reason why the soil carbon content was higher in Karst soil samples than the control. The higher activity in the 0.053–0.25-mm microaggregates and soil mineral particles of <0.053 mm compared with those in the other aggregates might be also associated with a higher MBC, with a higher contribution of fast-growing microorganisms in microaggregates [68]. The higher AP, BX, and NAG activity in non-karst soils may be due to the higher C:N ratios that were often used as an index of the SOM quality [72,73]. Our results indicate that karst forests were likely saturated with N, but non-karst forests were limited by N [62], which was explained by the study of Li [74] that TN was significantly relevant with the PLFA community.
Table 2.
Results (r values) from the correlation analysis showing the relationship between the soil properties and the indicators of microbial resource limitations.
4.2. Microbial Resource Limitation in Karst and Non-Karst Forests
The exoenzymatic stoichiometry scatter plots indicate that the soil microbes in the bulk soil and aggregates across the karst forests were largely co-limited by C and P but rarely by N (Figure 2). The microbes in non-karst soils were limited more by P than N, supporting the results of the other microbial resource limitation approaches. The vector length, which is an indicator of microbial C limitation [34], was greater in karst forests (Figure 4A), suggesting that microbes in karst forests were more limited by C, which is consistent with the result that soil organic carbon was the primary factor affecting the abundance of soil microbial communities in karst forests [74]. The vector angles were greater than 45° in the bulk soil and all aggregates across both karst and non-karst forests (Figure 4). However, the angles were greater in non-karst forests, indicating that microbes in non-karst forests were more limited by P than in karst forests. The microbial P limitation in non-karst forests was supported by the results of the TER, where the values of RC:P-TERC:P were higher than zero within the bulk and all aggregate fractions (Figure 6). However, the values RC:P-TERC:P in karst forests were greater than zero only in the bulk soils and 0.25–2-mm macroaggregates. This confirmed that the two fractions were more co-limited by P than the other fractions in karst forests. The microbes were also co-limited by C and P in karst forests, which was partially supported by the results of the BG:(LAP + NAG) ratio from the current study (Figure 5B) and is consistent with previous studies [47], and were higher in karst forests, which is in line with the results that TP was significantly relevant to the total PLFA community [74]. This indicated that microbes in karst forests need more available C relative to N, which also suggested that karst forests were more C-limited. Chen [47,62] attributed the microbial C limitation in karst soils to high N but not to low P levels. This aligned partially with our findings, where high N (TN: Table 1) and low P contents were detected. Chen [61] reported that, despite the fact that there are high levels of microbes in some organic soils with an abundance of degradable C, they are commonly C-limited. Compared with karst forests, the available P content in non-karst forests was lower in the bulk and all aggregate fractions, indicating that non-karst forests were more P-limited than karst forests. The data from Casle [25] confirmed that microbial resource limitations are often related to the available nutrients in soils. Zheng [75] indicated that conversion and fertilization strategies in croplands impacted the soil microbial resources. The application of inorganic fertilizers may alleviate microbial C limitations [76]. Due to additional C resources, the application of organic fertilizers or litter can also alleviate microbial C limitations but may lead to microbial nutrient limitations [77]. Since the TN in karst soils is high compared to that in non-karst soils, the C:N ratio in karst soils may not reach a threshold ratio conducive to the growth of microbes, resulting in C limitations [47,62]. Previous studies recognized Ca as the strongest variable for both soil C and N variations [54]. Despite the higher SOC content in karst forests, microbes are highly limited by C. This C limitation could be attributed to high Ca levels (calcareous soil) in karst forests, which combined strongly with SOC, leading to its stabilization in a nonlabile pool [49,78,79] This is also supported by a previous study [80], which suggested that the formation of a Ca complex was mainly responsible for the SOM stability.
Previous studies reported that non-karst forests were dominated by microbial N limitations, while microbes were not limited by N in karst forests [47]. This partially supported our results of RC:N-TERC:N (Figure 6), where the N limitation was >0 This was also supported by the fact that the BG:(LAP + NAG) (Figure 5) was significantly lower in karst forests in the bulk and all aggregate fractions.
The soil microbes in karst forests were largely co-limited by C and P but limited by P in non-karst forests. This was the general pattern of microbial resource limitations in the ecosystems in the study. The microbial resource limitation in the bulk soils and aggregate fractions in karst and non-karst forests followed the same general pattern. The microbial P limitation has been alleviated in finer soil aggregate fractions (0.053–0.25 mm and <0.053 mm) compared with other fractions in non-karst forests. This was supported by the RC:P-TERC:P results, which were lower in the finer soil aggregate fractions relative to the bulk and other fractions. Lower levels of available C in the soils may lead to a decrease in the C:P ratio, thus alleviating the microbial P limitation. This is true for the finer soil aggregate fractions (0.053–0.25 mm and <0.053 mm), where lower available C:P ratios (i.e., DOC:AP) were found in finer aggregates than those in other fractions, resulting in an alleviated P limitation (Figure 6). The increase in P levels within the aggregate fractions (Table 1) could also alleviate the P limitations. The fractions had a slightly higher microbial C limitation than the bulk and other aggregate fractions in karst forests. This was supported by the BG:(LAP + NAG) and BG:AP results, which in the finer soil aggregate fractions, were higher relative to the bulk and other fractions (Figure 6). Our study highlighted the mechanisms for differential patterns of microbial resource limitations in karst forests, which could be strongly regulated by the resource limitations in finer aggregate fractions compared to in other aggregates.
5. Conclusions
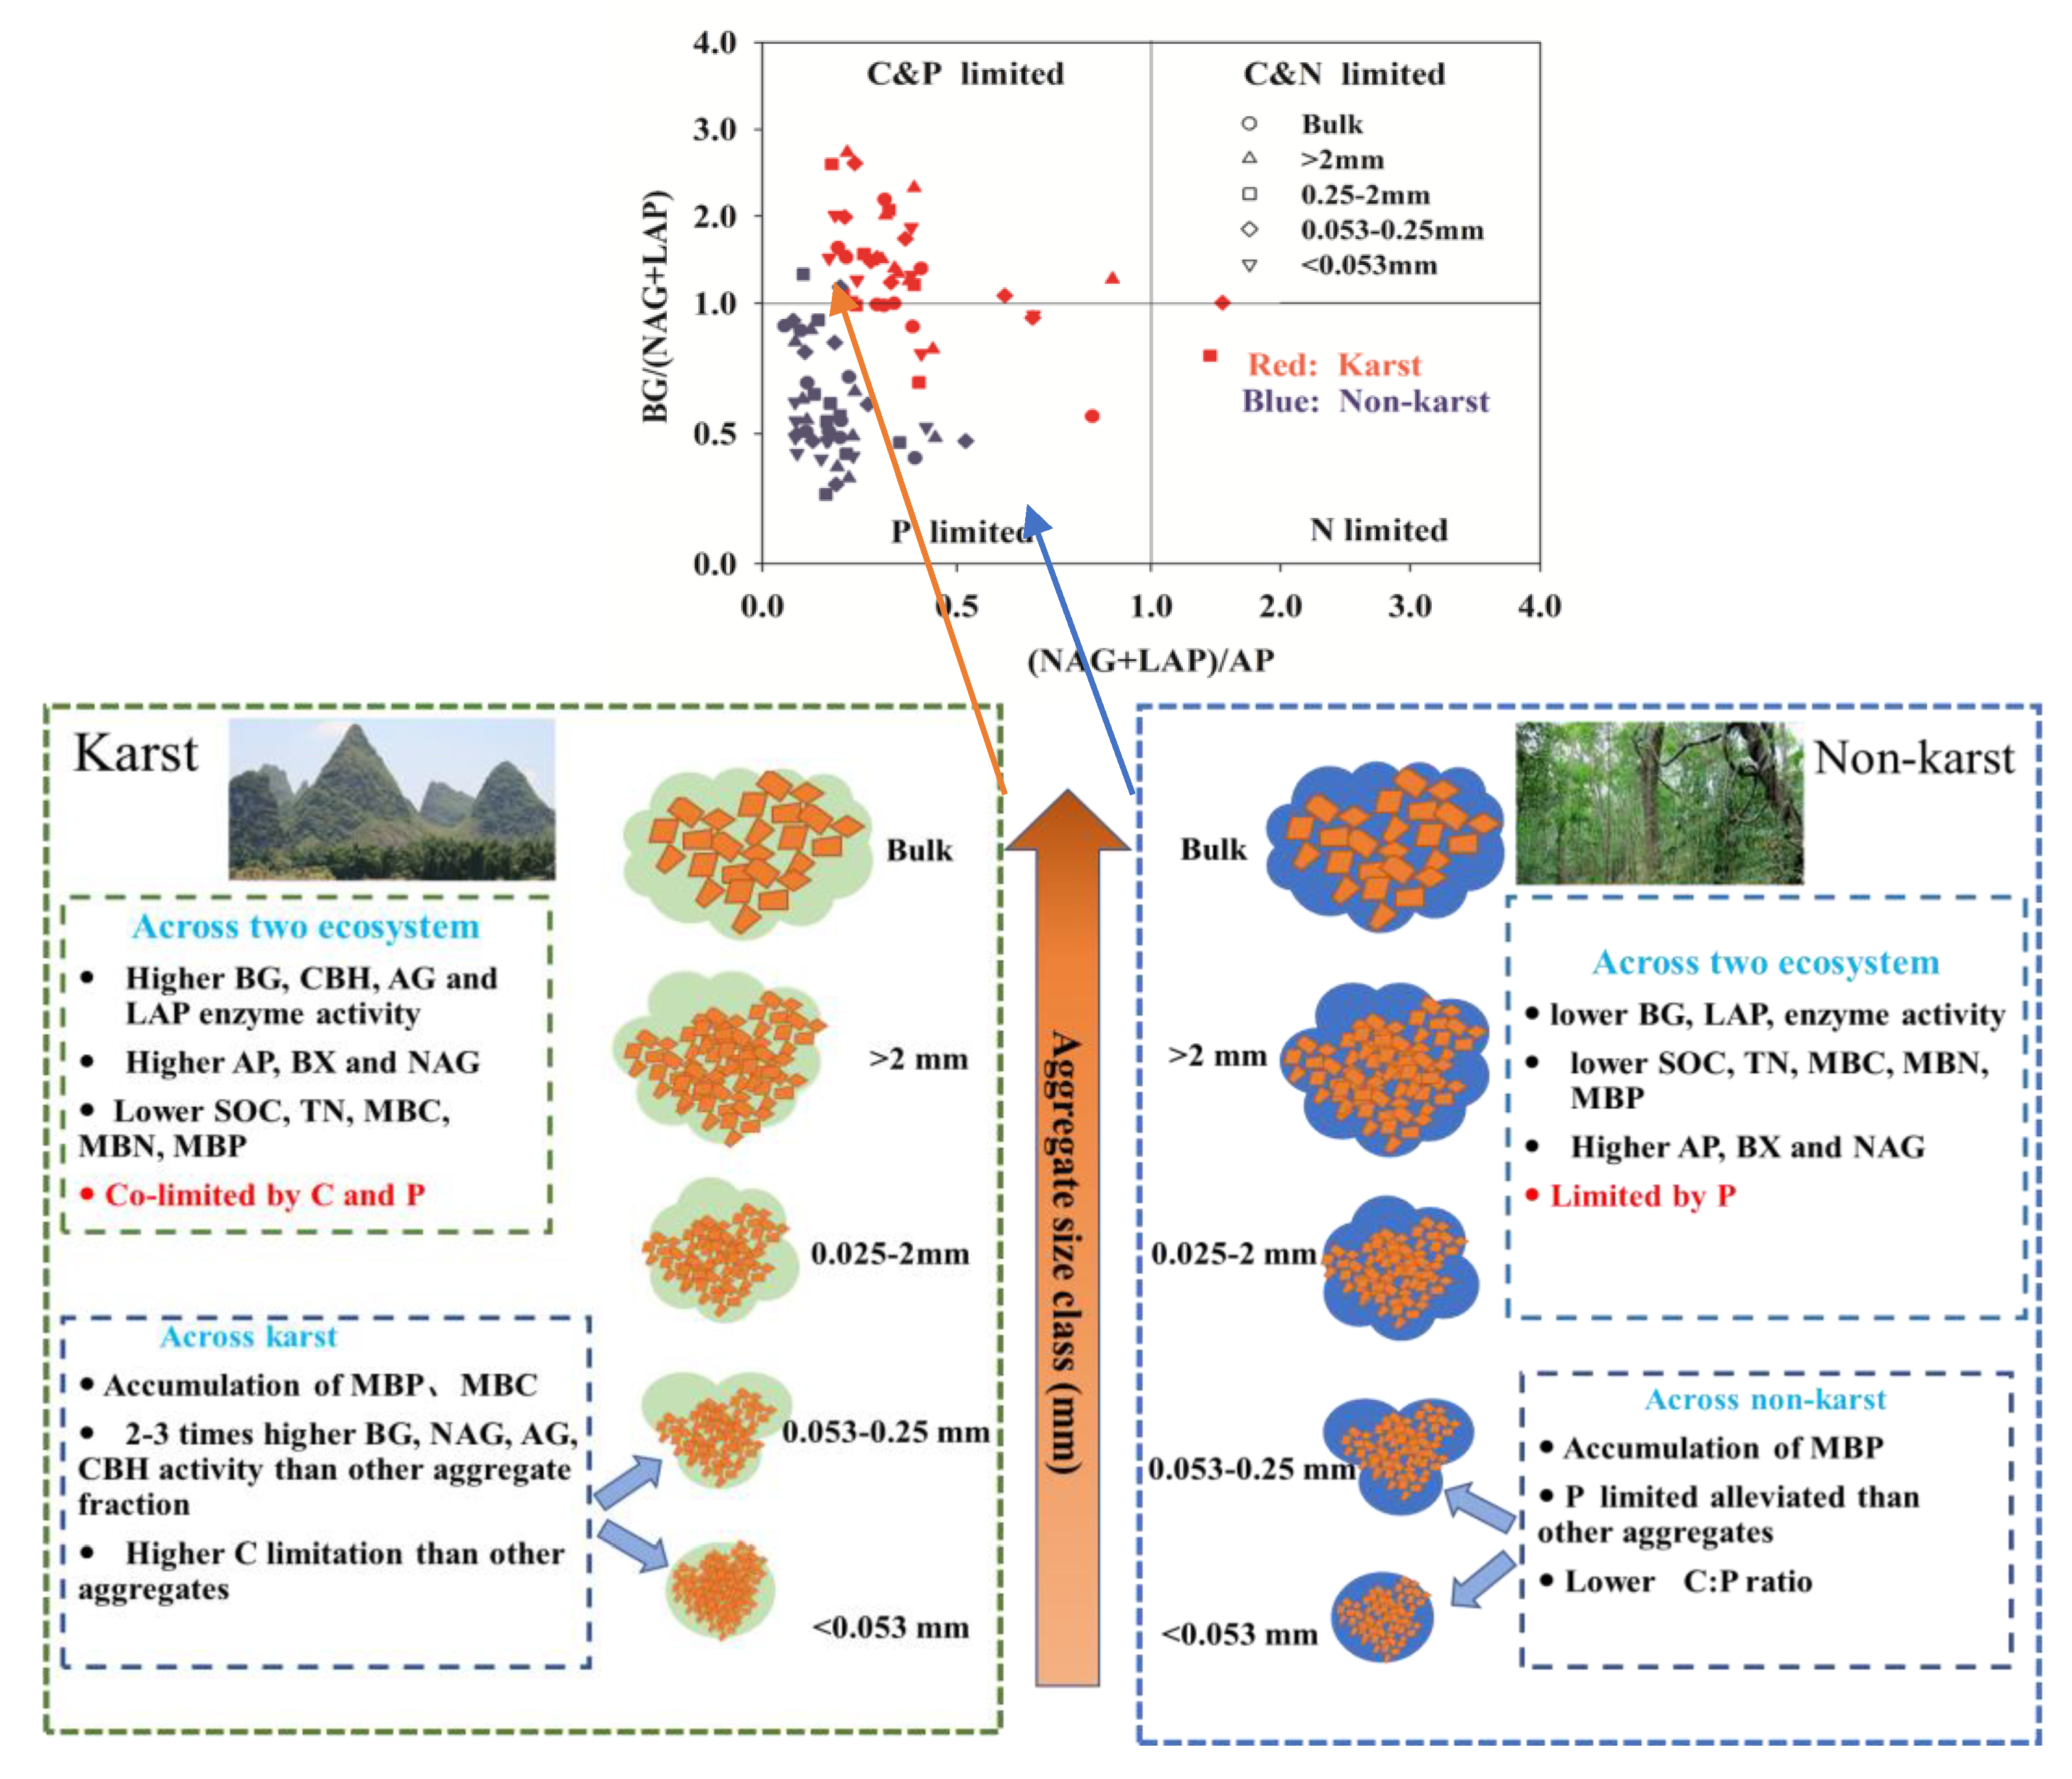
The soil enzyme activity (BG, NAG, LAP, and AP) and SOC, TN, MBC, MBN, and MBP levels were significantly enhanced in the bulk soil and all aggregate fractions in karst forests. The MBP levels were more concentrated in finer aggregates in both karst (<0.053 mm and 0.053–0.25 mm) and non-karst (<0.053 mm) ecosystems. The BG, NAG, AG, and CBH activities were significantly higher (two to three times) in 0.053–0.25-mm microaggregates and soil mineral particles (<0.053 mm) compared with the other aggregate fractions in karst forests, which coincided with the distribution of MBC and MBP in finer aggregates. The soil microbes in karst forests were largely co-limited by C and P and by P in non-karst forests. The microbial P limitation was alleviated in finer soil aggregates (0.053–0.25 mm and <0.053 mm), compared with other fractions in non-karst forests. This could be due to the lower available C:P ratio (i.e., DOC:AP) in finer aggregates. These two fractions had slightly greater microbial C limitations than the bulk and other aggregate fractions in karst forests. Our results indicated patterns of the microbial resource limitations in the bulk and aggregate fractions in karst ecosystems and highlighted that the enzyme activity, SOC accumulation, and microbial resource limitations in karst ecosystems may be correlated with finer aggregates (Figure 8).
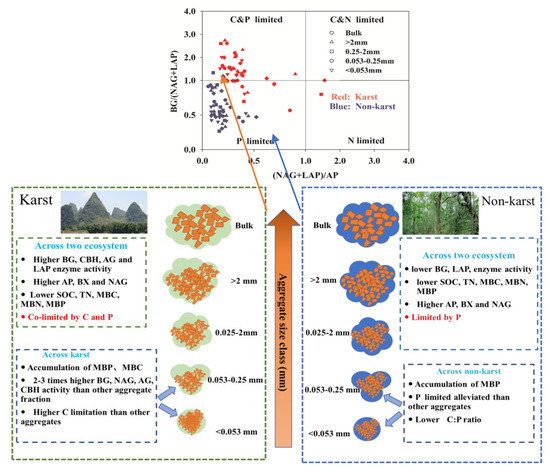
Figure 8.
Conceptual diagram of the microbial resource limitations in aggregates between Karst and non-karst soils.
Supplementary Materials
The following are available online at https://www.mdpi.com/article/10.3390/agronomy11081591/s1: Table S1. Description of karst and non-karst forests.
Author Contributions
Conceptualization, Y.L., T.G., Z.Z.; methodology, M.Z., M.S., A.C., Z.Z.; validation, Y.W., Y.G.M.G. and Y.L.; formal analysis, Y.W. and M.Z.; investigation, Y.W.; resources, Y.W. and A.C.; data curation, Y.W., Y.G.M.G.; writing—original draft preparation, Y.W. and M.Z.; writing—review and editing, Y.W., M.Z., M.S., T.G. and Y.L.; visualization, Y.W. and M.Z.; supervision, M.Z. and Y.L.; project administration,M.Z., T.G. and Y.L.; funding acquisition, M.Z., Z.Z., T.G. and Y.L. All authors have read and agreed to the published version of the manuscript.
Funding
This research was funded by Natural Science Foundation of Hunan Province (2019JJ10003; 2019JJ30028), the National Natural Science Foundation of China (42007097), the Natural Science Foundation of Changsha City (kq2014184), and Talented Young Scientist Program (TYSP) supported by China Science and Technology Exchange Center (CSTEC) to Mostafa Zhran. The authors declare that they have no known competing financial interests or personal relationships that could have appeared to influence the work reported in this paper.
Institutional Review Board Statement
Not applicable.
Informed Consent Statement
Not applicable.
Data Availability Statement
Not applicable.
Conflicts of Interest
The authors declare that they have no known competing financial interests or personal relationships that could have appeared to influence the work reported in this paper.
References
- Sweeting, M.M. Karst in China: Its Geomorphology and Environment; Reference to a Chapter in an Edited Book; Springer: Berlin, Germany, 1995. [Google Scholar]
- Ahmed, Y.A.R.; Pichler, V.; Homolák, M.; Gömöryová, E.; Nagy, D.; Pichlerová, M.; Gregor, J. High Organic Carbon Stock in a Karstic Soil of the Middle-European Forest Province Persists after Centuries-Long Agroforestry Management. Eur. J. For. Res. 2012, 131, 1669–1680. [Google Scholar] [CrossRef] [Green Version]
- Wen, L.; Li, D.J.; Yang, L.Q.; Luo, P.; Chen, H.; Xiao, K.C.; Song, T.Q.; He, X.Y.; Chen, H.S.; Wang, K.L. Rapid Recuperation of Soil Nitrogen Following Agricultural Abandonment in a Karst Area, Southwest China. Biogeochemistry 2016, 129, 341–354. [Google Scholar] [CrossRef]
- Li, D.; Wen, L.; Yang, L.; Luo, P.; Xiao, K.; Chen, H.; Zhang, W.; He, X.; Chen, H.; Wang, K. Dynamics of Soil Organic Carbon and Nitrogen Following Agricultural Abandonment in a Karst Region. J. Geophys. Res. Biogeosci. 2017, 122, 230–242. [Google Scholar] [CrossRef]
- Chen, H.; Zheng, M.H.; Mao, Q.G.; Xiao, K.C.; Wang, K.L.; Li, D.J. Cropland conversion changes the status of microbial resource limitation in degraded karst soil. Geoderma 2019, 352, 197–203. [Google Scholar] [CrossRef]
- Yu, Z.; Chen, L.; Pan, S.; Li, Y.; Kuzyakov, Y.; Xu, J.; Brookes, P.C.; Luo, Y. Feedstock Determines Biochar-Induced Soil Priming Effects by Stimulating the Activity of Specific Microorganisms. Eur. J. Soil Sci. 2018, 69, 521–534. [Google Scholar] [CrossRef]
- Zhao, F.Z.; Ren, C.J.; Han, X.H.; Yang, G.H.; Wang, J.; Doughty, R. Changes of Soil Microbial and Enzyme Activities are Linked to Soil C, N and P Stoichiometry in Afforested Ecosystems. For. Ecol. Manag. 2018, 427, 289–295. [Google Scholar] [CrossRef]
- Wei, X.M.; Razavi, B.S.; Hu, Y.J.; Xu, X.L.; Zhu, Z.K.; Liu, Y.H.; Kuzyakov, Y.; Li, Y.; Wu, J.S.; Ge, T.D. C/P Stoichiometry of Dying Rice Root Defines the Spatial Distribution and Dynamics of Enzyme Activities in Root-Detritusphere. Biol. Fertil. Soils 2019, 55, 251–263. [Google Scholar] [CrossRef]
- Ashraf, M.N.; Hu, C.; Wu, L.; Duan, Y.H.; Zhang, W.J.; Aziz, T.; Cai, A.D.; Abrar, M.M.; Xu, M.G. Soil and Microbial Biomass Stoichiometry Regulate Soil Organic Carbon and Nitrogen Mineralization in Rice-Wheat Rotation Subjected to Long-Term Fertilization. J. Soils Sediments 2020, 20, 3103–3113. [Google Scholar] [CrossRef]
- Cui, J.; Zhu, Z.K.; Xu, X.L.; Liu, S.L.; Jones, D.L.; Kuzyakov, Y.; Shibistova, O.; Wu, J.S.; Ge, T.D. Carbon and Nitrogen Recycling from Microbial Necromass to Cope with C:N Stoichiometric Imbalance by Priming. Soil Biol. Biochem. 2020, 142, 107720. [Google Scholar] [CrossRef]
- Sterner, R.W.; Elser, J.J. Ecological Stoichiometry: The Biology of Elements from Molecules to the Biosphere. In Ecological Stoichiometry: The Biology of Elements from Molecules to the Biosphe; Princeton University Press: Princeton, NJ, USA, 2002; pp. 225–226. [Google Scholar]
- Ge, T.D.; Luo, Y.; Bhupinder, P.S. Resource Stoichiometric and Fertility in Soil. Biol. Fertil. Soils 2020, 56, 1091–1092. [Google Scholar] [CrossRef]
- Wei, X.M.; Zhu, Z.K.; Liu, Y.; Luo, Y.; Deng, Y.W.; Xu, X.L.; Liu, S.L.; Adreas, R.; Olga, S.; Geory, G.; et al. C:N:P Stoichiometry Regulates Soil Organic Carbon Mineralization and Concomitant Shifts in Microbial Community Composition in Paddy Soil. Biol. Fertil. Soils 2020, 56, 1093–1107. [Google Scholar] [CrossRef]
- Ekblad, A.; Nordgren, A. Is Growth of Soil Microorganisms in Boreal Forests Limited by Carbon or Nitro Gen Availability? Plant Soil 2002, 242, 115–122. [Google Scholar] [CrossRef]
- Hill, B.H.; Elonen, C.M.; Jicha, T.M.; Kolka, R.K.; Lehto, L.L.P.; Sebestyen, S.D.; Seifert-Monson, L.R. Ecoenzymatic Stoichiometry and Microbial Processing of Organic Matter in Northern Bogs and Fens Reveals a Common P-limitation between Peatland Types. Biogeochemistry 2014, 120, 203–224. [Google Scholar] [CrossRef]
- Zhu, Z.K.; Ge, T.D.; Luo, Y.; Liu, S.L.; Xu, X.L.; Tong, C.L.; Olga, S.; Georg, G.; Wu, J.S. Microbial Stoichi Ometric Flexibility Regulates Rice Straw Mineralization and its Priming Effect in Paddy Soil. Soil Biol. Biochem. 2018, 121, 67–76. [Google Scholar] [CrossRef]
- Zhu, Z.K.; Zhou, J.; Muhammad, S.; Tang, H.; Liu, S.L.; Zhang, W.J.; Yuan, H.Z.; Zhou, P.; Hattan, A.; Wu, J.S.; et al. Microorganisms Maintain C:N Stoichiometric Balance by Regulating the Priming Effect in Long-Term Fertilized Soils. Appl. Soil Ecol. 2021, 167, 104033. [Google Scholar] [CrossRef]
- Vance, E.D.; Chapin, F.S. Substrate Limitations to Microbial Activity in Taiga Forest Floors. Soil Biol. Biochem. 2001, 33, 173–188. [Google Scholar] [CrossRef]
- Simpson, A.J.; Simpson, M.J.; Emma, S.; Kelleher, B. Microbially Derived Inputs to Soil Organic Matter: Are Current Estimates Too Low? Environ. Sci. Technol. 2007, 41, 8070–8076. [Google Scholar] [CrossRef] [PubMed]
- Fanin, N.; Moorhead, D.; Bertrand, I. Eco-Enzymatic Stoichiometry and Enzymatic Vectors Reveal Differential C, N, P Dynamics in Decaying Litter Along a Land-Use Gradient. Biogeochemistry 2016, 129, 21–36. [Google Scholar] [CrossRef]
- Gregg, J.; Andres, R.J.; Marland, G. China: Emissions Pattern of the World Leader in CO2 Emissions from Fossil Fuel Consumption and Cement Production. Geophys. Res. Lett. 2008, 35. [Google Scholar] [CrossRef]
- Jiang, Z.; Lian, Y.; Qin, X. Rocky Desertification in Southwest China: Impacts, Causes, and Restoration. Earth Sci. Rev. 2014, 132, 1–12. [Google Scholar] [CrossRef]
- Xiao, S.S.; Zhang, W.; Ye, Y.Y.; Zhao, J.; Wang, K.L. Soil Aggregate Mediates the Impacts of Land Uses on Organic Carbon, Total Nitrogen, and Microbial Activity in a Karst Ecosystem. Sci. Rep. 2017, 7, 41402. [Google Scholar] [CrossRef] [PubMed] [Green Version]
- Wang, M.M.; Chen, H.S.; Zhang, W.; Wang, K.L. Influencing Factors on Soil Nutrients at Different Scales in a Karst Area. Catena 2019, 175, 411–420. [Google Scholar] [CrossRef]
- Castle, S.C.; Sullivan, B.W.; Knelman, J.; Hood, E.; Nemergut, D.R.; Schmidt, S.K.; Cleveland, C.C. Nutrient Limitation of Soil Microbial Activity during the Earliest Stages of Ecosystem Development. Oecologia 2017, 185, 513–524. [Google Scholar] [CrossRef] [PubMed]
- Davidson, E.A.; Carvalho, C.J.R.D.; Figueira, A.M.; Ishida, F.Y.; Ometto, J.P.H.B.; Nardoto, G.B.; Sabá, R.T.; Hayashi, S.N.; Leal, E.C.; Vieira, I.C.G.; et al. Recuperation of Nitrogen Cycling in Amazonian Forests Following Agricultural Abandonment. Nature 2007, 447, 995–998. [Google Scholar] [CrossRef] [PubMed]
- Du, Y.X.; Pan, G.X.; Li, L.Q.; Hu, Z.L.; Wang, X.Z. Leaf N/P Ratio and Nutrient Reuse between Dominant Species and Stands: Predicting Phosphorus Deficiencies in Karst Ecosystems, Southwestern China. Environ. Earth Sci. 2010, 64, 299–309. [Google Scholar] [CrossRef]
- Zhang, W.; Zhao, J.; Pan, F.J.; Li, D.; Chen, H.S.; Wang, K.L. Changes in Nitrogen and Phosphorus Limitation during Secondary Succession in a Karst Region in Southwest China. Plant Soil 2015, 391, 77–91. [Google Scholar] [CrossRef]
- Feng, J.; Wei, K.; Chen, Z.H.; Lü, X.T.; Tian, J.H.; Wang, C.; Chen, L.J. Coupling and Decoupling of Soil Carbon and Nutrient Cycles Across an Aridity Gradient in the Drylands of Northern China: Evidence From Ecoenzymatic Stoichiometry. Glob. Biogeochem. Cycles 2019, 33, 559–569. [Google Scholar] [CrossRef]
- Jiang, Y.L.; Lei, Y.B.; Qin, W.; Korpelainen, H.; Li, C.Y. Revealing Microbial Processes and Nutrient Limitation in Soil through Ecoenzymatic Stoichiometry and Glomalin-Related Soil Proteins in a Retreating Glacier Forefield. Geoderma 2019, 338, 313–324. [Google Scholar] [CrossRef]
- Rosinger, C.; Rousk, J.; Sandén, H. Can Enzymatic Stoichiometry be used to Determine Growth-Limiting Nutrients for Microorganisms?—A Critical Assessment in Two Subtropical Soils. Soil Biol. Biochem. 2019, 128, 115–126. [Google Scholar] [CrossRef]
- He, Q.; Wu, Y.; Bing, H.; Zhou, J.; Wang, J. Vegetation Type rather than Climate Modulates the Variation in Soil Enzyme Activities and Stoichiometry in Subalpine Forests in the Eastern Tibetan Plateau. Geoderma 2020, 374, 114424. [Google Scholar] [CrossRef]
- Schimel, J.P.; Weintraub, M.N. The Implications of Exoenzyme Activity on Microbial Carbon and Nitrogen Limitation in Soil: A Theoretical Model. Soil Biol. Biochem. 2003, 35, 549–563. [Google Scholar] [CrossRef]
- Moorhead, D.L.; Rinkes, Z.L.; Sinsabaugh, R.L.; Weintraub, M.N. Dynamic Relationships between Microbial Biomass, Respiration, Inorganic Nutrients and Enzyme Activities: Informing Enzyme-Based Decomposition Models. Front. Microbiol. 2013, 4, 223. [Google Scholar] [CrossRef] [PubMed] [Green Version]
- Ajwa, H.A.; Dell, C.J.; Rice, C.W. Changes in Enzyme Activities and Microbial Biomass of Tallgrass Prairie Soil as Related to Burning and Nitrogen Fertilization. Soil Biol. Biochem. 1999, 31, 769–777. [Google Scholar] [CrossRef]
- Sinsabaugh, R.L.; Lauber, C.L.; Weintraub, M.N.; Ahmed, B.; Allison, S.D.; Crenshaw, C.; Contosta, A.R.; Cusack, D.; Frey, S.; Gallo, M.E.; et al. Stoichiometry of Soil Enzyme Activity at Global Scale. Ecol. Lett. 2008, 11, 1252–1264. [Google Scholar] [CrossRef] [PubMed]
- Creamer, C.; Filley, T.; Dan, C.D.; Diane, E.S. Changes to Soil Organic N Dynamics with Leguminous Woody Plant Encroachment into Grasslands. Biogeochemistry 2013, 113, 307–321. [Google Scholar] [CrossRef]
- Sinsabaugh, R.L.; Hill, B.H.; Shah, J.J.F. Ecoenzymatic Stoichiometry of Microbial Organic Nutrient Acquisition in Soil and Sediment. Nature 2009, 462, 795–798. [Google Scholar] [CrossRef] [PubMed]
- Waring, B.G. Exploring Relationships between Enzyme Activities and Leaf Litter Decomposition in a Wet Tropical Forest. Soil Biol. Biochem. 2013, 64, 89–95. [Google Scholar] [CrossRef]
- Štursová, M.; Baldrian, P. Effects of Soil Properties and Management on the Activity of Soil Organic Matter Transforming Enzymes and the Quantification of Soil-Bound and Free Activity. Plant Soil 2011, 338, 99–100. [Google Scholar] [CrossRef]
- Brockett, B.F.T.; Prescott, C.E.; Grayston, S.J. Soil Moisture is the Major Factor Influencing Microbial Community Structure and Enzyme Activities Across Seven Biogeoclimatic Zones in Western Canada. Soil Biol. Biochem. 2012, 44, 9–20. [Google Scholar] [CrossRef]
- Kivlin, S.N.; Treseder, K.K. Soil Extracellular Enzyme Activities Correspond with Abiotic Factors more than Fungal Community Composition. Biogeochemistry 2014, 117, 23–37. [Google Scholar] [CrossRef] [Green Version]
- Meentemeyer, V. Macroclimate and Lignin Control of Litter Decomposition Rates. Ecology 1978, 59, 465–472. [Google Scholar] [CrossRef] [Green Version]
- Mccaugherty, C.A.; Linkins, A.E. Temperature Responses of Enzymes in two Forest Soils. Soil Biol. Biochem. 1990, 22, 29–33. [Google Scholar] [CrossRef]
- Allison, S.D.; Vitousek, P.M. Responses of Extracellular Enzymes to Simple and Complex Nutrient Inputs. Soil Biol. Biochem. 2005, 37, 937–944. [Google Scholar] [CrossRef]
- Allison, S.D.; Jastrow, J.D. Activities of Extracellular Enzymes in Physically Isolated Fractions of Restored Grassland Soils. Soil Biol. Biochem. 2006, 38, 3245–3256. [Google Scholar] [CrossRef]
- Castle, S.C.; Neff, J.C. Plant Response to Nutrient Availability across Variable Bedrock Geologies. Ecosystems 2008, 12, 101–113. [Google Scholar] [CrossRef]
- Chen, H.; Li, D.J.; Xiao, K.C.; Wang, K.L. Soil Microbial Processes and Resource Limitation in Karst and Non-Karst Forests. Funct. Ecol. 2018, 329, 61–64. [Google Scholar] [CrossRef]
- Wen, L.; Li, D.J.; Chen, H.; Wang, K.L. Dynamics of Soil Organic Carbon in Density Fractions during Postagricultural Succession over Two Lithology Types, Southwest China. J. Environ. Manag. 2017, 201, 199–206. [Google Scholar] [CrossRef] [PubMed]
- Feng, J.; Wu, J.; Zhang, Q.; Li, Q.X.; Long, C.Y.; Yang, F.; Chen, Q.; Cheng, X.L. Stimulation of Nitrogen-Hydrolyzing Enzymes in Soil Aggregates Mitigates Nitrogen Constraint for Carbon Sequestration Following Afforestation in Subtropical China. Soil Biol. Biochem. 2018, 123, 136–144. [Google Scholar] [CrossRef]
- Mustafa, A.; Mingang, X.; AliShah, S.A.; Abrar, M.M.; Sun, N.; Wang, B.R.; Cai, Z.J.; Saeed, Q.; Naveed, M.; Mehmood, K.; et al. Soil Aggregation and Soil Aggregate Stability Regulate Organic Carbon and Nitrogen Storage in a Red Soil of Southern China. J. Environ. Manag. 2020, 270, 110894. [Google Scholar] [CrossRef] [PubMed]
- Six, J.; Carpentier, A.; Van Kessel, C.; Merckx, R.; Harris, D.; Horwath, W.R.; Lüscher, A. Impact of Elevated CO2 on Soil Organic Matter Dynamics as Related to Changes in Aggregate Turnover and Residue Quality. Plant Soil 2001, 234, 27–36. [Google Scholar] [CrossRef]
- Eliot, E.T. Aggregate Structure and Carbon, Nitrogen, and Phosphorus in Native and Cultivated Soils. Soil Sci. Soc. Am. J. 1986, 50, 627–633. [Google Scholar] [CrossRef]
- Li, D.; Yang, Y.; Chen, H.; Xiao, K.; Song, T.; Wang, K. Soil Gross Nitrogen Transformations in Typical Karst and Nonkarst Forests Southwest China. J. Geophys. Res. Biogeosci. 2017, 122, 2831–2840. [Google Scholar] [CrossRef]
- Smith, A.P.; Marín-Spiotta, M.E.; Graaff, M.A.D.; Balser, T.C. Microbial Community Structure Varies across Soil Organic Matter Aggregate Pools during Tropical Land cover Change. Soil Biol. Biochem. 2014, 77, 292–303. [Google Scholar] [CrossRef]
- Carter, M.R.; Gregorich, E.G. Soil Sampling and Methods of Analysis, 2nd ed.; Reference to a Chapter in an Edited, Book; Taylor & Francis Group: Oxfordshire, UK; CRC Press: Boca Raton, FL, USA, 2007. [Google Scholar]
- Brookes, P.C.; Landman, A.; Pruden, G.; Jenkinson, D.S. Chlororm Fumigation and the Release of Soil Nitrogen: A Rapid Direct Extraction Method to Measure Microbial Biomass Nitrogen in Soil. Soil Biol. Biochem. 1985, 17, 837–842. [Google Scholar] [CrossRef]
- Wu, J.; Joergensen, R.G.; Pommeren1ng, B.; Chaussod, R.; Brookes, P.C. Measurement of Soil Microbial Biomass C by Fumigation-Extraction—An Automated Procedure. Soil Biol. Biochem. 1990, 22, 1167–1169. [Google Scholar] [CrossRef]
- Fansler, S.J.; Smith, J.L.; Bolton, H.; Bailey, V.L., Jr. Distribution of Two C Cycle Enzymes in Soil Aggregates of a Prairie Chronosequence. Biol. Fertil. Soils 2005, 42, 17–23. [Google Scholar] [CrossRef]
- Marx, M.C.; Kandeler, E.; Wood, M.; Wermbter, N.; Jarvis, S.C. Exploring the Enzymatic Landscape: Distribution and Kinetics of Hydrolytic Enzymes in Soil Particle-Size Fractions. Soil Biol. Biochem. 2005, 37, 35–48. [Google Scholar] [CrossRef]
- Chen, H.; Luo, P.; Wen, L.; Yang, L.; Wang, K.; Li, D. Determinants of Soil Extracellular Enzyme Activity in a Karst Region, Southwest China. Eur. J. Soil Biol. 2017, 80, 69–76. [Google Scholar] [CrossRef]
- Chen, H.; Li, D.J.; Mao, Q.G.; Xiao, K.C.; Wang, K.L. Resource Limitation of Soil Microbes in Karst Ecosystems. Sci. Total Environ. 2018, 650, 241–248. [Google Scholar] [CrossRef] [PubMed]
- Waring, B.G.; Weintraub, S.R.; Sinsabaugh, R.L. Ecoenzymatic Stoichiometry of Microbial Nutrient Acquisition in Tropical Soils. Biogeochemistry 2014, 117, 101–113. [Google Scholar] [CrossRef]
- Nadelhoffer, K.J.; Richard, D.B.; Jacqueline, A.A.P.; Kate, L. The DIRT Experiment: Litter and Root Influences on Forest Soil Organic Matter Stocks and Function. In Forests in Time: The Environmental Consequences of 1000 Years of Change in New England; Yale University Press: Newhaven, UK; London, UK, 2004; Chapter 15. [Google Scholar]
- Emma, J.S. Using Experimental Manipulation to Assess the Roles of Leaf Litter in the Functioning of Forest Ecosystems. Biol. Rev. Camb Philos. Soc. 2006, 81, 1–31. [Google Scholar]
- Hobbies, S.; Vitousek, P. Nutrient Limitation of Decomposition in Hawaiian Forests. Ecology 2000, 81, 1867–1877. [Google Scholar] [CrossRef]
- Chapin, F.S.; Matson, P.A.; Mooney, H.A. Principles of Terrestrial Ecosystem Ecology; Reference to Chapters in an Edited Book; Springer: New York, NY, USA, 2002. [Google Scholar]
- Dorodnikov, M.; Blagodatskaya, E.; Blagodatsky, S.; Marhan, S.; Fangmeier, A.; Kuzyakov, Y. Stimulation of Microbial Extracellular Enzyme Activities by Elevated CO2 Depends on Soil Aggregate Size. Glob. Chang. Biol. 2009, 15, 1603–1614. [Google Scholar] [CrossRef]
- Li, Y.; Yuan, H.; Chen, A.; Xiao, M.; Deng, Y.; Ye, R.; Zhu, Z.; Inubushi, K.; Wu, J.; Ge, T. Legacy effect of elevated CO2 and N fertilization on mineralization and retention of rice (Oryza sativa L.) rhizodeposit-C in paddy soil aggregates. Soil Ecol. Lett. 2020. [Google Scholar] [CrossRef]
- Amato, M.; Ladd, J.N. Decomposition of C-14-Labeled Glucose and Legume Material in Soils—Propeties Influencing the Accumulation of Organic Residue-C and Microbial Biomass-C. Soil Biol. Biochem. 1992, 24, 455–464. [Google Scholar] [CrossRef]
- Dick, R.P.; Myrold, D.D.; Kerle, E.A. Microbial Biomass and Soil Enzyme Activities in Compacted and Rehabilitated Skid Trail Soils. Soil Sci. Soc. 1998, 52, 512–516. [Google Scholar] [CrossRef]
- Johnson, N.C.; Wedin, D.A. Soil Carbon, Nutrients, and Mycorrhizae during Conversion of Dry Tropical Forest to Grassland. Ecol. Appl. 1997, 7, 171. [Google Scholar] [CrossRef]
- Finzi, A.C.; Chales, C.; Nico, V.B. Canopy Tree Soil Interactions within Temperate Forests: Species Effects on Soil Carbon and Nitrogen. Ecol. Appl. 1998, 8, 440–446. [Google Scholar]
- Li, D.; Wen, L.; Jiang, S.; Song, T.; Wang, K. Responses of Soil Nutrients and Microbial Communities to Three Restoration Strategies in a Karst Area, Southwest China. J. Environ. Manag. 2018, 207, 456–464. [Google Scholar] [CrossRef]
- Zheng, L.; Chen, H.; Wang, Y.Q.; Mao, Q.G.; Zheng, M.H.; Su, Y.R.; Xiao, K.C.; Wang, K.L.; Li, D.J. Responses of Soil Microbial Resource Limitation to Multiple Fertilization Strategies. Soil Tillage Res. 2020, 196, 104474. [Google Scholar] [CrossRef]
- McDowell, W.H.; Nadelhoffer, K.J.; Magill, A.; Berntson, G.; Kamakea, M.; Mcnulty, S.G.; Currie, W.; Rustad, L.E.; Fernadez, I.J. Nitrogen Saturation in Temperate Forest Ecosystems. BioScience 1998, 48, 921–934. [Google Scholar]
- Kamble, P.N.; Bååth, E. Induced N-Limitation of Bacterial Growth in Soil: Effect of Carbon Loading and N Status in Soil. Soil Biol. Biochem. 2014, 74, 11–20. [Google Scholar] [CrossRef]
- Lutzow, M.V.; KogelKnabner, I.; Ekschmitt, K.; Matzner, E.; Guggenberger, G.; Marschner, B.; Flessa, H. Stabilization of Organic Matter in Temperate Soils: Mechanisms and Their Relevance under Different Soil Conditions—A Review. Eur. J. Soil Sci. 2006, 57, 426–445. [Google Scholar] [CrossRef]
- Kaiser, M.; Walter, K.; Ellerbrock, R.H.; Sommer, M. Effects of Land Use and Mineral Characteristics on the Organic Carbon Content, and the Amount and Composition of Na-Pyrophosphate-Soluble Organic Matter, in Subsurface Soils. Eur. J. Soil Sci. 2011, 62, 226–236. [Google Scholar] [CrossRef]
- Di, X.Y.; An, X.J.; Dong, H.; Tang, H.M.; Xiao, B.H. The Distribution and Evolution of Soil Organic Matter in the Karst Region, Guizhou Province Southwestern China. Environ. Earth Sci. 2015, 43, 697–708. [Google Scholar]


Publisher’s Note: MDPI stays neutral with regard to jurisdictional claims in published maps and institutional affiliations. |
© 2021 by the authors. Licensee MDPI, Basel, Switzerland. This article is an open access article distributed under the terms and conditions of the Creative Commons Attribution (CC BY) license (https://creativecommons.org/licenses/by/4.0/).