Article

Genetic Analysis and Selection Criteria in Bambara Groundnut Accessions Based Yield Performance

1
Department of Crop Science, Faculty of Agriculture, Universiti Putra Malaysia (UPM), Serdang 43400, Malaysia
2
Institute of Tropical Agriculture and Food Security, Universiti Putra Malaysia (UPM), Serdang 43400, Malaysia
3
Department of Plant Protection, Faculty of Agriculture, Universiti Putra Malaysia (UPM), Serdang 43400, Malaysia
*
Author to whom correspondence should be addressed.
Agronomy 2021, 11(8), 1634; https://doi.org/10.3390/agronomy11081634
Submission received: 10 June 2021 / Revised: 21 July 2021 / Accepted: 21 July 2021 / Published: 17 August 2021
(This article belongs to the Section Crop Breeding and Genetics)

Abstract

:
The knowledge of genetic variability and breeding techniques is crucial in crop improvement programs. This information is especially important in underutilized crops such as Bambara groundnut, which have limited breeding systems and genetic diversity information. Hence, this study evaluated the genetic variability and established the relationship between the yield and its components in Bambara groundnut based on seed weight using multivariate analysis. A field trial was conducted in a randomized complete block design with three replications on 28 lines. Data were collected on 12 agro-morphological traits, and a statistical analysis was conducted using SAS version 9.4 software, while the variance component, genotypic and phenotypic coefficient variation, heritability, and genetic advance values were estimated. A cluster analysis was performed using NT-SYS software to estimate the genetic relations among the accessions. The results showed significant variability among the accessions based on the yield and yield component characteristics. The evaluated lines were grouped into seven primary clusters based on the assessed traits using the UPGMA dendrogram. Based on the overall results, G5LR1P3, G1LR1P3, G4LR1P1, G2SR1P1 and G3SR1P4 performed the best for the yield and yield components. These improved lines are recommended for large-scale evaluation and utilization in future breeding programs to develop high-yield Bambara groundnut varieties.

1. Introduction

Plant breeding is a distinct art of crop improvement; however, the availability of essential resources and tools, in addition to the inventive act of combination to achieve identified breeding objectives, is the most important. Therefore, sufficient variability within the crop of interest is the main resource required to achieve a successful breeding program target for crop improvement [1]. Furthermore, sufficient knowledge of genetic variability among germplasm has important implications for the utilization, management and conservation of germplasm resources [2]. The Bambara groundnut (Vigna subterranea (L.) Verdc.) is an underutilized crop with the potential to help meet global food requirements as an alternative food with a high nutritional content [1]. However, due to unimproved cultivars and poor cultural practices, the crop yield remained very low [2]. This crop is native to Sub-Saharan Africa, and it plays a socioeconomic role in semi-arid regions of the continent [3]. In comparison to cereals (pearl millet, sorghum and maize) and other legumes (peanuts and cowpeas), the research on this crop is limited [4]. An effective hybridization technique for Bambara groundnut has only recently been established; one of the major reasons for this delay is that most cultivated Bambara groundnut uses landraces with low yield [1]. The extent of the genetic variation in the breeding program and the magnitude of the yield trait heritability determine crop yield increases [4]. Therefore, genetic variation can be an option for the selection of appropriate parents. However, quantitative characteristics are highly influenced by environmental factors; hence, there is a need for the partitioning of the total variances as heritable and non-heritable components for an efficient breeding program [5].
The identification of high-yielding varieties with desirable traits can be achieved through genetic improvement [5]. The selection of suitable parental materials has been achieved using morphological, molecular and chemical diversity [6]. For many crops, morphological and agronomic traits are the standard for the evaluation of genetic variation because they are easily scored, fast and inexpensive [5]. The strategies to increase crops’ yields include: selection based on detected natural variations occurring among native landraces or accessions; the selection of plants with desirable traits after hybridization or regulated mating from different parents; the selection of specific recombinants after monitoring the inheritance of within-genome varietals; and the creation and introduction of novel variation into genomes through genetic engineering [6]. Selection is the most applied and efficient way of improving yield in an extreme autogamous crop, and consistently the Bambara groundnut accessions can be inherently high yielding [7]. The availability of significant genetic diversity in the crop cultivars for the target characteristic and the degree to which it is heritable affect the selection success [5]. Selection processes do not require sophisticated equipment. Furthermore, they are inherited without specific molecular or biochemical techniques. Therefore, this evaluation could be used to develop reliable selection criteria for yield and other yield-related attributes in Bambara groundnut.
A crop improvement program is needed to boost the Bambara groundnut’s genetic potential and achieve the sustainable development of a high-yielding variety. Characterizing and assessing Bambara groundnut genotypes for the identification of the best parents are critical for crop improvement [7]. Genetic diversity within accessions and populations is important for breeding and germplasm preservation [8]. A study carried out by Khan et al. [7] revealed significant differences among landraces, and evidence of genetic relatives will be critical for the improvement of Bambara groundnut varietals. Consequently, the collection, characterization, analysis and conservation of Bambara groundnut germplasms are important steps in developing a crop enhancement program that will provide appropriate parent materials. Presently, the available modern approaches are applied for the selection of cultivated Bambara groundnut. Dual approaches, such as linking molecular with conventional breeding, are highly successive over exclusively one method. Hence, trait improvements that can be made through direct selection are estimated by heritability and genetic gain. Moreover, heritability influences the magnitude of the selection process, which is a powerful tool to predict the genetic gain and improve certain traits through selection. Therefore, this study was conducted to assess the genetic variability among 28 Bambara groundnut lines based on yield and yield-related traits.

2. Materials and Methods

2.1. Plant Materials and Experimental Location

Twenty-eight line accessions of Bambara groundnut were used in this experiment (Table 1); the lines were sourced from the International Institute of Tropical Agriculture (IITA), Genetic Resources Centre, Kano state, Nigeria. The seeds were sown in trays with one seed per cell on a mixed soil of sandy soil and peat moss. After 20 days in the seed trays, the seedlings were transferred into the experimental field. The field trial was conducted repeatedly in two different cropping seasons (main and off-season) from August 2019 to June 2020 at Research Field 15, Faculty of Agriculture, University Putra Malaysia (UPM), situated between 3°02′ N latitude and 101°42′ East longitude, 31 m above sea level. During the planting season, the temperature (°C) ranges from 23 to 31, with an average rainfall of 280 mm per month during the cultivation period. The soil PH ranges from 6.5 to 7.5, with sandy loam to clay loam.

2.2. Field Maintenance and Experimental Design

The land was mechanically ploughed and harrowed before the transplanting. The seeds were planted by category, with a planting distance of 30 × 50 cm at Field 15 using a Randomized Complete Block Design (RCBD) with three replications. The experimental unit consisted of 10 plants per replicate for each line. Furthermore, the plants were checked for insects, pests and diseases. Pesticides and fungicides were applied at different growth stages in order to control fungi and insect pests at the recommended rates. The experimental fields were irrigated naturally by rainfall and a supplementary sprinkler irrigation system, while the weeding was controlled by silver shine mulching, and other weeds were controlled manually at the tendered stage. The fertilizers green (NPK 15:15:15+2S) and blue (NPK 12:12:17-2+8S+TE) were applied in split doses at the recommended rates two and six weeks after transplanting.

2.3. Data Collection

Data were collected on the yield and yield-related traits, as described in Table 2. The quantitative data collected followed the Bambara groundnut descriptors [9].

2.4. Statistical Analysis

An analysis of variance was conducted using Statistical Analysis System (SAS) version 9.4 for all of the morphological traits described in Table 3. The means comparison was performed using Duncan’s New Multiple Range Test (DNMRT) at 5% to separate the significant differences. The variance component was estimated for each characteristic from the expected mean squares using proc varcomp with the Restricted Maximum Likelihood (REML) method in SAS. A Pearson correlation was used to determine the relationships among the yield and yield component traits using proc corr in the SAS program.

2.5. Genetic Variance, Heritability and Genetic Advance

The estimation of the variance components was determined in order to quantify the genetic variation among the varieties based on seed weight, and to assess the genetic and environmental influences on the different traits.
The genotypic, phenotypic and error variance were calculated using the following equation:
σ   g 2 = ( MSG MSE ) r σ p 2 = σ g 2 + σ e 2 σ e 2 = MSE
where σ g 2 is the genotypic variance, σ p 2 is the phenotypic variance, σ e 2 is the error variance, MSG is the mean square of the genotypes, MSE is the mean square of error, and r is the number of replications.
The phenotypic and genotypic coefficients of variation (PCV and GCV) were calculated as described by Myint et al. [10], as follows:
PCV = σ p 2 X ¯ × 100
GCV = σ g 2 X ¯ × 100
where σ p 2 is the phenotypic variance, σ g 2 is the genotypic variance, and X ¯ is the mean of the trait. The GCV and PCV values were characterized as low (0–10%), moderate (10–20%) and high (20% and above), as described by Sarif et al. [11].
The broad-sense heritability was calculated as the ratio of genetic variance ( σ g 2 ) to phenotypic variance ( σ p 2 ). The formula for broad-sense heritability is as follows:
h B 2 ( % ) = σ g 2 σ p 2 × 100
where σ g 2 is the genotypic variance, σ p 2 is the phenotypic variance, and h B 2 is Broad-sense heritability, which is characterized as low (0–30%), moderate (30–60%) and high (≥60%), as given by Mat Sulaiman et al. [12].
Regarding the estimated and expected Genetic Advance (GA), the amount of expected GA (as a percentage of mean) was and the selection intensity (K) was expected to be 5%. The genetic advance was characterized as low (0–10%), moderate (10–20%) or high (>20%) by following Mat Sulaiman et al. [12].
GA % = K × σ p 2 X ¯ × h B 2 × 100
K is the selection intensity (constant 5%, the value is 2.06), σ P 2 is the phenotypic standard deviation, h B 2 is the heritability, and X ¯ is the mean of the traits.

2.6. Cluster Analysis

A cluster analysis was performed using morphological traits; the data were analyzed based on the Euclidian distance method and Dice and Jaccard’s similarity coefficients using the NTSYS-pc software (version 2.1) to determine the genetic relations among the Bambara groundnut genotypes; the UPGMA algorithm and SAHN clustering were applied. The individual genotypes were grouped based on the features in the cluster analysis using relatedness, resemblance and distance.

3. Results and Discussion

3.1. Morphological and Yield Component Traits

The analysis of variance for genotype revealed highly significant (p ≤ 0.01) differences for most of the parameters studied, except for the dried pod weight, number of large seeds per plant, number of medium seeds per plant, total large-seed weight per plant, total seed weight per plant, and yield ton per hectare (Table 4). Significant differences were observed among the lines for the hundred seed weight and total small seeds per plant, while no significant differences were recorded for the rest of the traits. For the seed size, no significant difference was observed except for the hundred seed weight (Table 4). Among the lines, the mean values for the total small-seed weight trait (TSSW) ranged from 17.54 g to 2.72 g. Genotype G5MR1P1 showed the highest total small-seed weight (17.54 g), while G3SR1P3 registered the lowest total small-seed weight (2.72 g) (Table 5). Onwubiku et al. [13] observed a highly significant difference between the grain yield and yield-related traits such as the number of seeds per plant, yield per plant and hundred-seed weight, signifying high genetic variation among these characteristics. For the hundred-seed weight, G5LR1P3 had the highest 100-seed weight (121.26 g), while the lowest value was observed in G3SR1P1 (56.13 g), which was statistically similar to the most of other lines (Table 5). The thousand or hundred-seed weight significantly contributes to the final yield per hectare. The trait represents the individual seed weights, which could not be measured because of the size of the individual seeds. The present study showed that the 100 grain weight varied significantly among the evaluated genotypes, which could also be due to their differences in genetic makeup and origin. Similar findings in the agro-morphological differentiation between four agro-ecological Bambara groundnut populations were reported by Massawe et al. [14] and Shegro et al. [15].
For the number of pods per plant, highly significant differences were registered among the genotypes, but no significant difference was observed among the lines and seed size categories. This is in accordance with the findings of Séverin et al. [16], who reported a wide range of variability within each population for vegetative and yield traits; they also mentioned that the parameters selected were discriminant and very informative. This phenotypic variation may be used to establish a successful selection strategy for a Bambara groundnut genetic resource conservation program. The lowest number of pods per plant (17.00) was found in genotype G1SR1P3, while the highest number pods per plant (52.39) was recorded in G2SR1P3 (Table 5). The mean values of the genotypes for the number of small seeds per plant varied from 12.30 g to 23.61 g. G2 had the highest, followed by G4 and G5, while G1 registered the lowest number of small seeds per plant (Table 5). There was a highly significant difference among the genotypes, but no significant difference was observed among the lines and seed size categories for the total medium-seed weight per plant (Table 4). Genotype G5 showed the highest value for the total medium-seed weight (17.11g), while the lowest value was registered by G3 (8.21), which was statistically similar to the G1, G2 and G4 genotypes (Table 5). A significant difference was found among the genotypes for the total number of seeds per plant, but no significant difference was observed among the lines and seed size categories (Table 4). This result was in agreement with Séverin et al. [16], who reported significant differences among the characteristics and stated that the trait that permitted the separation of the population according to their geographical zones would have greater phenotypic plasticity than the yield traits in variable climates. These traits’ expression levels demonstrate the Bambara groundnut’s potential to react to environmental changes and adapt its morphological architecture and phenology. For the total number of seeds per plant, G2 recorded the maximum total number of seeds per plant, which was statistically similar to G4 and G5. In contrast, the lowest total number of seeds per plant was from G1 (Table 5). There were no significant differences among the lines, genotypes and seed size categories for the dried pod weight, number of large seeds per plant, number of medium seeds per plant, total large-seed weight per plant, total seed weight per plant, and yield (tons per hectare) traits (Table 4).

3.2. Genetic Variability, Heritability and Genetic Advance as the Criteria for Morphological Trait Selection in Bambara Groundnut

The estimation of genotypic variance, including phenotypic and genotypic coefficients of variation, broad-sense heritability, and genetic advance for yield and yield component characteristics, was presented in Table 6. The phenotypic coefficient of variation value was higher than the genotypic coefficient of variation for all of the characteristics, indicating the influence of the environment on the expression of these parameters. Khan et al. [7] reported a similar observation in which the phenotypic variances were significantly higher than the corresponding genotypic variances. The genotypic coefficient of variation (GCV) and phenotypic coefficient variation (PCV) estimates for the yield and yield components ranged from 0 to 26.02%, and from 32.12 to 77.59%, respectively (Table 6). A high GCV and PCV were observed for the total small-seed weight per plant (GCV = 26.01%, PCV = 59.21%) and the number of small seeds per plant (21.93%, 51.62.01%), while moderate GCV and high PCV were recorded for the total medium-seed weight per plant (11.95%, 57.41%), the hundred seed weight (17.09%, 32.12%) and the total number of seeds per plant (12.50%, 43.90%). However, low GCV and high PCV were registered for the other traits (Table 6). Similar findings were also reported for most of the characteristics of the estimates of genetic parameters in Bambara groundnut, the variation in the pod yield characteristics, and the heritability estimates in some cultivars of Bambara groundnut by [7,17].
Broad-sense heritability is the proportion of the ratio of genetic variance to the phenotypic variance in a given population. A higher GCV, together with high heritability and high GA, gives better clues than individual characteristics. The broad-sense heritability for the yield and yield -related characteristics ranged from 0 to 28.31. Previous research has shown that characteristics with high estimates of heritability and high genetic advance values can be subjected to direct selection [17].
High genetic advance (GA) was recorded for total small-seed weight per plant (23.56%). While moderate GA values was observed for the number of small seed per plant (19.19%) and100-seed weight (18.73%) (Table 6). In the selection processes, these characteristics were essential, with little influence from the setting. Similar findings on assessments of genetic parameters in Bambara groundnut, variability in pod yield characteristics, and estimates of heritability in some Bambara groundnut cultivars were also reported for most of the characteristics by [7,13,17]. This is consistent with previous heritability research, which found that characteristic improvement selection is influenced not only by accessible genetic variation but also by the degree of heritability [5,17]. The current study shows that improving yield and other related Bambara groundnut parameters can be accomplished by selecting heritability and genetic advance estimates. Furthermore, the severity of the variations observed for almost all of the agronomic characteristics was important, which can be used to plant breeders’ advantage in improving the agronomic characteristics of this crop.

3.3. Relation between Traits

The correlation coefficients among the yield and its components showed that all of the characteristics had a significant or highly significant positive correlation with the yield (ton per hectare) and the total seed weight (Table 7). However, a negative correlation was recorded for the total small-seed weight per plant and the number of small seeds per plant with the hundred-seed weight. Similar results to the positive correlations among and between the various traits recorded by [18] indicated that selecting for any of the traits will positively affect the selection for the associated traits in a Bambara groundnut improvement program. Having positive significant correlation coefficients between the yield and yield-related traits reported in this study was an indication that the morphological traits measured appropriately predicted the yield and selection for a breeding program to obtain better heterosis or vigor. The positive correlation also indicates a better exploration of these traits for the development of desirable genotypes [19].

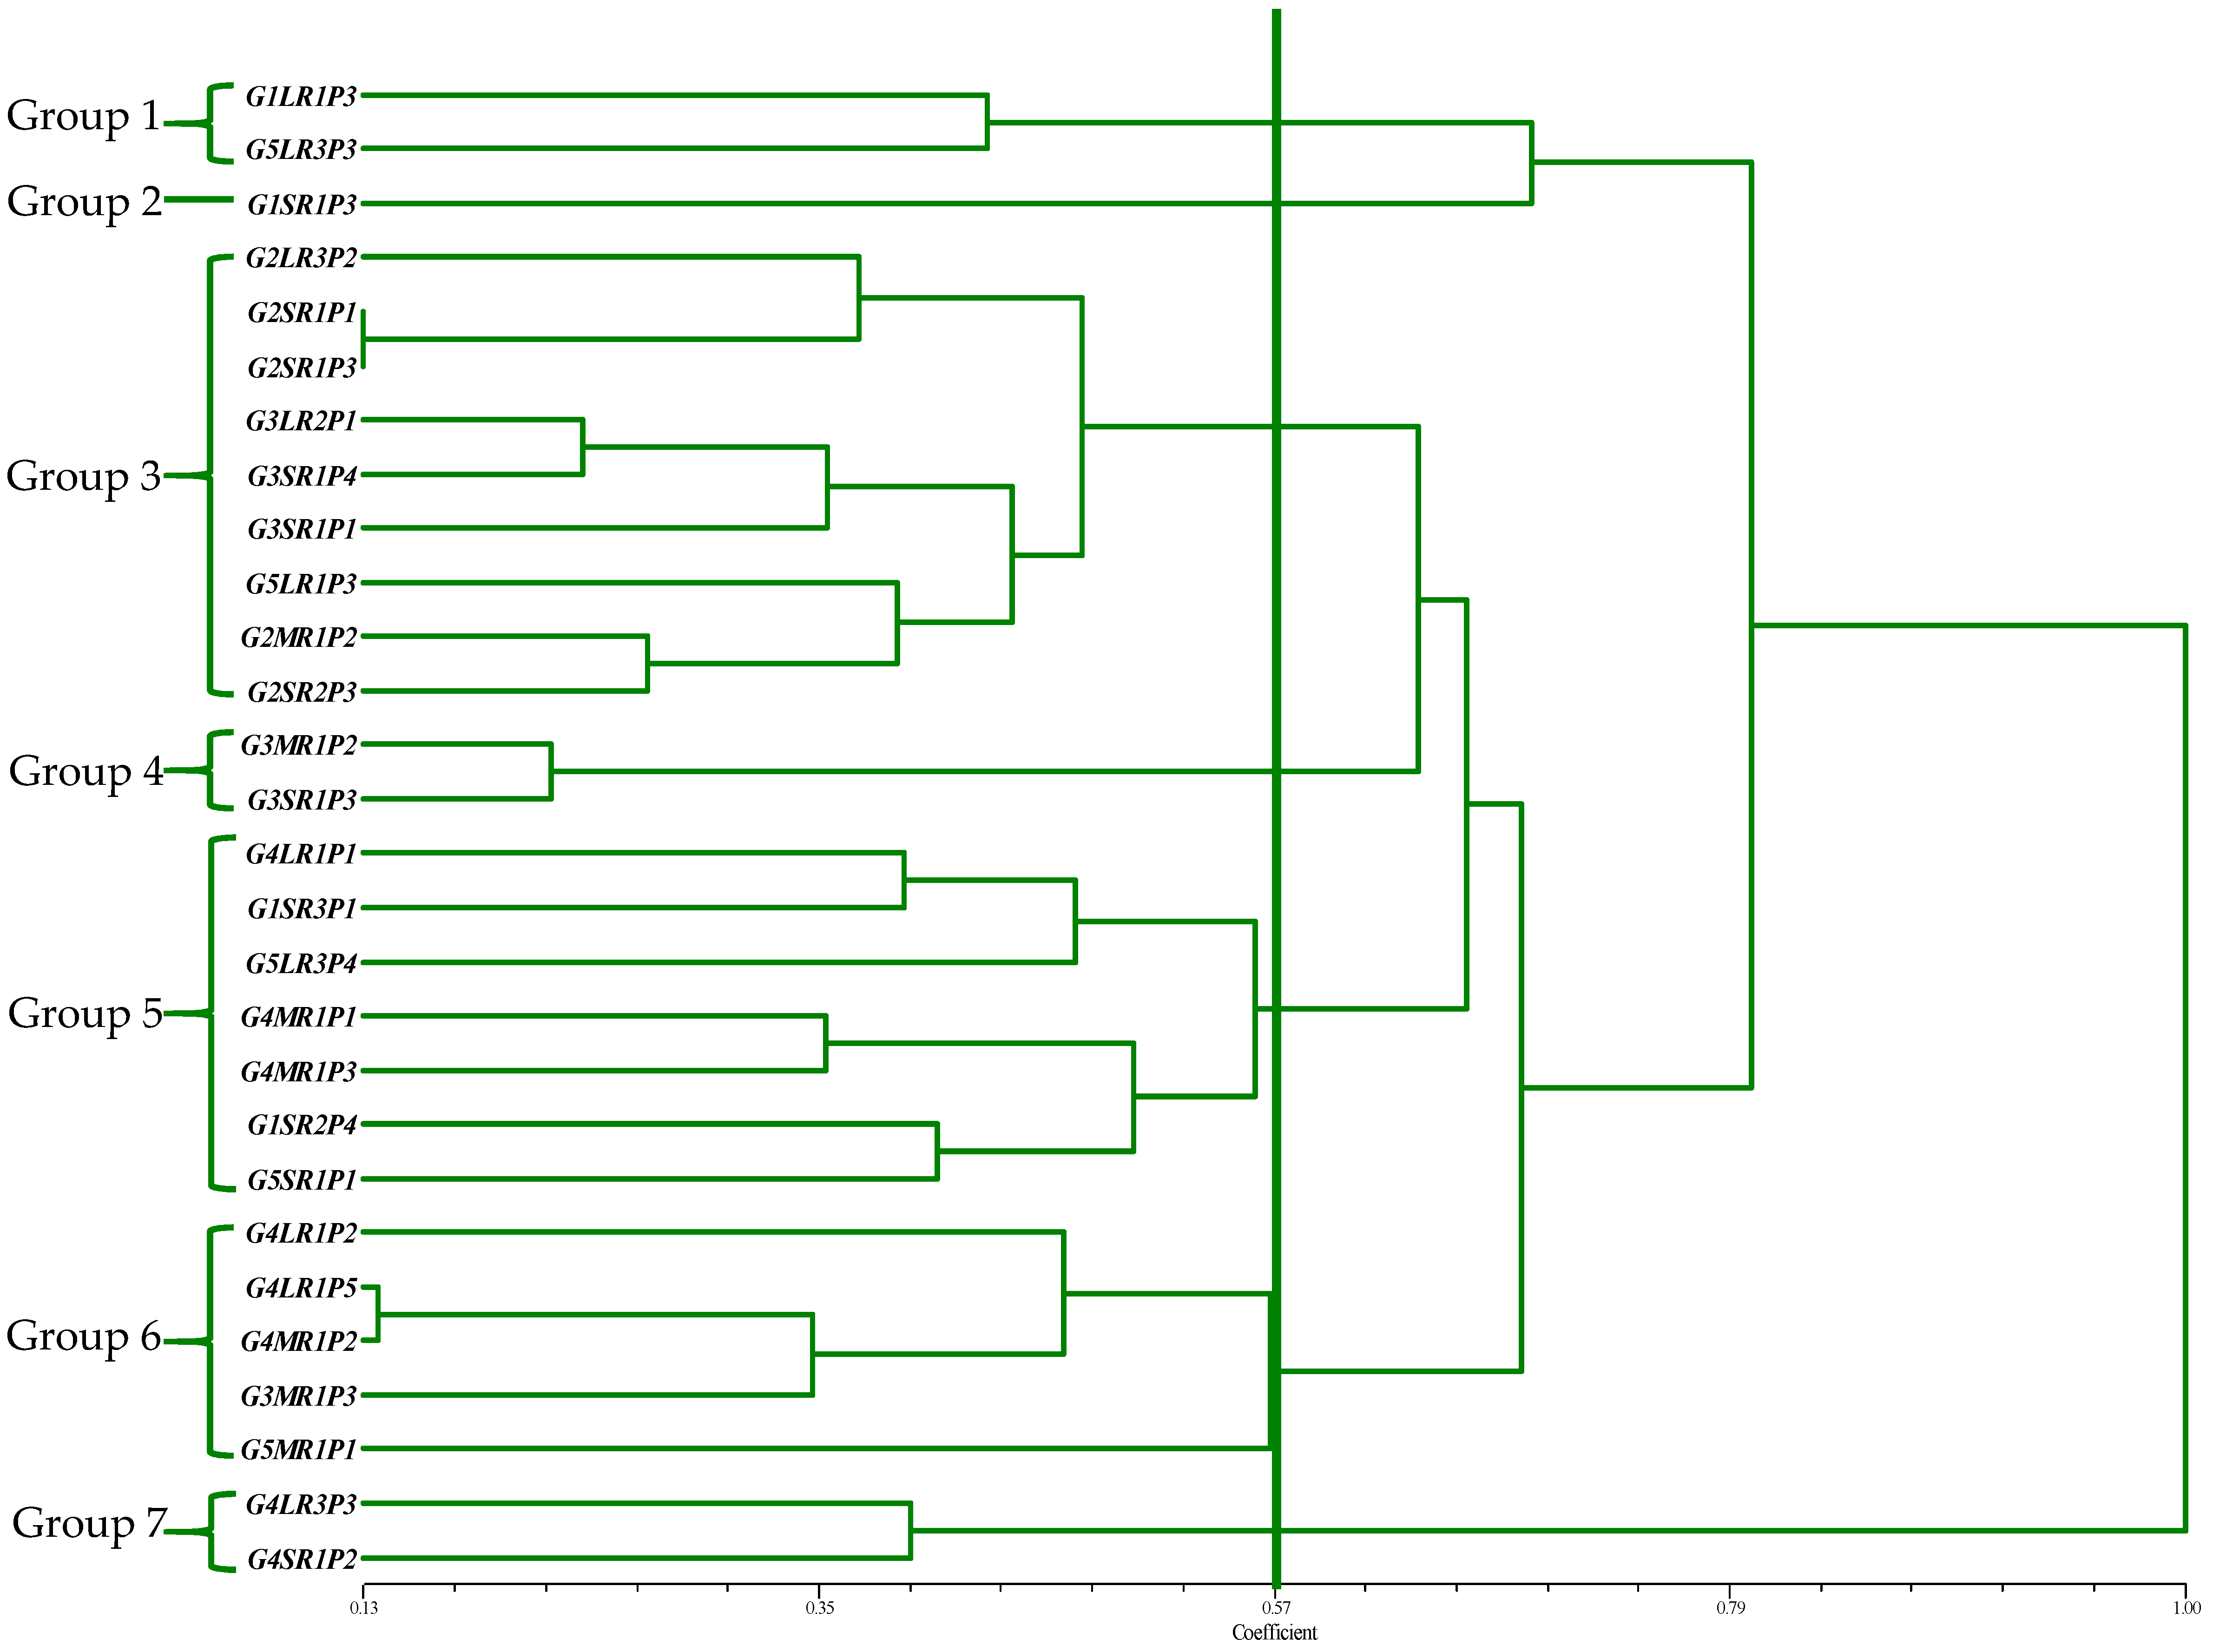
3.4. Cluster Analysis of the Morphological Traits

Cluster analysis, a multivariate technique, was used to assess the genetic diversity of the quantitative traits, whereby individuals with similar descriptions are mathematically grouped into the same cluster. The distance, similarity and relatedness of the varieties are the foundation of this method. There are two groups in the distance-based method, i.e., as hierarchical and non-hierarchical. The hierarchical group is known as “agglomerative hierarchical”, where similar varieties are grouped into one cluster according to their similarities. In contrast, dissimilar varieties are grouped into different clusters. The unweighted pair group method with arithmetic means (UPGMA) is primarily used among the different agglomerative hierarchical methods. The non-hierarchical clustering method is known as K-means clustering, and is based on the sequential threshold, parallel threshold, or optimization. A dendrogram or tree is not constructed in this method. The non-hierarchical clustering method is rarely used to analyze intra-specific genetic diversity in crop plants [20].
The Euclidean distances among the 28 lines were calculated using the standardized morphological data, and a UPGMA dendrogram was constructed using these values, as shown in (Figure 1). The 28 Bambara groundnut lines were grouped into seven primary clusters based on their morphological characteristics. Cluster III had the highest number of accessions (9), followed by cluster V (7); cluster VI had five accessions, while clusters I, IV, and VII had two accessions each. However, cluster II only had one genotype. A high degree of genetic diversity among the Bambara groundnut accessions was documented. Some of the accessions established relationships based on shared morphological characteristics in selected Bambara groundnut accessions. The identification and selection of the best parents for hybridization can be aided by characterizing and clustering the lines based on their morphological characteristics and genetic similarity [7,13,17]. As a result, the classification of the lines in the current study using univariate and multivariate analysis methods based on their similarity provides useful information for Bambara groundnut breeders.

4. Conclusions

It was concluded from this investigation that a significant amount of variation exists among Bambara groundnut cultivars for yield and yield components. Because genetic variations allow for recombinants, which are necessary for the development of new genotypes or lines, the production of Bambara groundnut genotypes that might lead to food security is solely based on the exploration of genetic aspects of the crop’s quantitative characteristics. The current study shows that selection based on heritability and genetic advance estimates improves the yield and other yield-related characteristics in Bambara groundnut. Additionally, the positive correlation coefficient in this experiment showed that almost all of the traits positively correlate with the yield per hectare. Finally, using the UPGMA dendrogram, the evaluated lines were divided into seven primary clusters based on the traits evaluated. Based on the overall recorded data, the G5LR1P3, G1LR1P3, G4LR1P1, G2SR1P1 and G3SR1P4 lines proved to be the best in terms of the yield and yielding component traits. These lines could be used in future breeding programs, and are suggested for zonal yield trials covering various ecological zones in Malaysia.

Author Contributions

M.Y.R. and A.K. conceived and designed the experiments. A.K. performed the experiment. M.Y.R., A.K. and Y.O. analyzed the data. M.Y.R., A.K., N.M., M.J. and Y.O. wrote and revised the article. All authors have read and agreed to the published version of the manuscript.

Funding

This research receives no funding.

Institutional Review Board Statement

Not applicable.

Informed Consent Statement

Not applicable.

Data Availability Statement

All of the data are provided in full in the results section of this paper.

Conflicts of Interest

The authors declare no conflict of interest.

References

  1. Muhammad, I.; Rafii, M.Y.; Ramlee, S.I.; Nazli, M.H.; Harun, A.R.; Oladosu, Y.; Arolu, I.W. Exploration of bambara groundnut (Vigna subterranea (L.) Verdc.), an underutilized crop, to aid global food security: Varietal improvement, genetic diversity and processing. Agronomy 2020, 10, 766. [Google Scholar] [CrossRef]
  2. Khan, M.M.H.; Rafii, M.Y.; Ramlee, S.I.; Jusoh, M.; Al-Mamun, M. Bambara Groundnut (Vigna subterranea L. Verdc): A Crop for the New Millennium, Its Genetic Diversity, and Improvements to Mitigate Future Food and Nutritional Challenges. Sustainability 2021, 13, 5530. [Google Scholar] [CrossRef]
  3. Paliwal, R.; Adegboyega, T.T.; Abberton, M.; Faloye, B.; Oyatomi, O. Potential of genomics for the improvement of underutilized legumes in sub-Saharan Africa. Legum. Res. 2021. [Google Scholar] [CrossRef]
  4. Muhammad, I.; Rafii, M.Y.; Nazli, M.H.; Ramlee, S.I.; Harun, A.R.; Oladosu, Y. Determination of lethal (LD) and growth reduction (GR) doses on acute and chronic gamma-irradiated Bambara groundnut [Vigna subterranea (L.) Verdc.] varieties. J. Radiat. Res. Appl. Sci. 2021, 14, 133–145. [Google Scholar] [CrossRef]
  5. Oladosu, Y.; Rafii, M.Y.; Abdullah, N.; Abdul Malek, M.; Rahim, H.A.; Hussin, G.; Kareem, I. Genetic variability and selection criteria in rice mutant lines as revealed by quantitative traits. Sci. World J. 2014, 2014, 1–12. [Google Scholar] [CrossRef] [PubMed] [Green Version]
  6. Oladosu, Y.; Rafii, M.Y.; Abdullah, N.; Hussin, G.; Ramli, A.; Rahim, H.A.; Usman, M. Principle and application of plant mutagenesis in crop improvement: A review. Biotechnol. Biotechnol. Equip. 2016, 30, 1–16. [Google Scholar] [CrossRef] [Green Version]
  7. Khan, M.M.H.; Rafii, M.Y.; Ramlee, S.I.; Jusoh, M.; Al Mamun, M. Genetic analysis and selection of Bambara groundnut (Vigna subterranea [L.] Verdc.) landraces for high yield revealed by qualitative and quantitative traits. Sci. Rep. 2021, 11, 1–21. [Google Scholar] [CrossRef] [PubMed]
  8. Sabri, R.S.; Rafii, M.Y.; Ismail, M.R.; Yusuff, O.; Chukwu, S.C.; Hasan, N.A. Assessment of agro-morphologic performance, genetic parameters and clustering pattern of newly developed blast resistant rice lines tested in four environments. Agronomy 2020, 10, 1098. [Google Scholar] [CrossRef]
  9. International Plant Genetic Resources Institute; International Institute of Tropical Agriculture; The International Bambara Groundnut Network. Descriptors for Bambara Groundnut (Vigna Subterranea); IPGRI: Rome, Italy, 2000. [Google Scholar]
  10. Myint, K.A.; Amiruddin, M.D.; Rafii, M.Y.; Abd Samad, M.Y.; Ramlee, S.I.; Yaakub, Z.; Oladosu, Y. Genetic diversity and selection criteria of MPOB-Senegal oil palm (Elaeis guineensis Jacq.) germplasm by quantitative traits. Ind. Crop. Prod. 2019, 139, 111558. [Google Scholar] [CrossRef]
  11. Sarif, H.M.; Rafii, M.Y.; Ramli, A.; Oladosu, Y.; Musa, H.M.; Rahim, H.A.; Chukwu, S.C. Genetic diversity and variability among pigmented rice germplasm using molecular marker and morphological traits. Biotechnol. Biotechnol. Equip. 2020, 34, 747–762. [Google Scholar] [CrossRef]
  12. Mat Sulaiman, N.N.; Rafii, M.Y.; Duangjit, J.; Ramlee, S.I.; Phumichai, C.; Oladosu, Y.; Musa, I. Genetic variability of eggplant germplasm evaluated under open field and glasshouse cropping conditions. Agronomy 2020, 10, 436. [Google Scholar] [CrossRef] [Green Version]
  13. Onwubiko, N.C.; Uguru, M.I.; Chimdi, G.O. Estimates of Genetic Parameters in Bambara Groundnut (Vigna subterranea L. Verdc.). Plant Breed Biotechnol. 2019, 7, 295–301. [Google Scholar] [CrossRef]
  14. Massawe, F.J.; Mwale, S.S.; Azam-Ali, S.N.; Roberts, J.A. Breeding in bambara groundnut (Vigna subterranean L. Verdc.) strategic considerations. Afr. J. Biotechnol. 2005, 4, 463–471. [Google Scholar]
  15. Shegro, A.; van Rensburg, W.J.; Adebola, P.O. Assessment of genetic variability in bambara groundnut (Vigna subterrenea L. Verdc.) using morphological quantitative traits. AJAR 2013, 1, 45–51. [Google Scholar]
  16. Séverin, B.; Seka, D.; Guillaume, K.; Clémence, L.; Kévin, K.; Zoro, I.A. Annals of Agricultural Sciences Agromorphological divergence among four agro-ecological populations of bambara groundnut (Vigna subterranea L. Verdc.) in Côted ’Ivoire. Ann. Agric. Sci. 2019, 64, 103–111. [Google Scholar]
  17. Khan, M.M.H.; Rafii, M.Y.; Ramlee, S.I.; Jusoh, M.; Mamun, A. Genetic variability, heritability, and clustering pattern exploration of Bambara groundnut (Vigna subterranea L. Verdc) accessions for the perfection of yield and yield-related traits. BioMed Res. Int. 2020, 2020, 2195797. [Google Scholar] [CrossRef] [PubMed]
  18. Unigwe, A.E.; Gerrano, A.S.; Adebola, P.; Pillay, M. Morphological variation in selected accessions of Bambara groundnut (Vigna subterranea L. Verdc) in South Africa. J. Agric. Sci. 2016, 8, 69–99. [Google Scholar] [CrossRef]
  19. Myint, K.A.; Amiruddin, M.D.; Rafii, M.Y.; Abd Samad, M.Y.; Ramlee, S.I.; Yaakub, Z.; Oladosu, Y. Character Interrelationships and Path Analysis for Yield Components in MPOB-Senegal Oil Palm Germplasm. Sains Malays 2021, 50, 699–709. [Google Scholar]
  20. Al-Mamun, M.; Rafii, M.; Oladosu, Y.; Misran, A.B.; Berahim, Z.; Ahmad, Z.; Khan, M.H. Genetic Diversity among Kenaf Mutants as Revealed by Qualitative and Quantitative Traits. J. Nat. Fibers 2020, 1–18. [Google Scholar] [CrossRef]
Figure 1. The figure describes the pattern of clustering which divided the 28 Bambara groundnut genotypes into seven groups at a 0.57 dissimilarity coefficient based on their morphological traits. Note: The genotype code abbreviation is in Table 1.
Agronomy 11 01634 g001
Table 1. Twenty-eight Bambara groundnut lines.
NOLINES CodeGenotypeSeed Size
1G1LR1P3GIWALarge
2G2LR3P2DUNALarge
3G3LR2P1CANCARAKILarge
4G4LR1P1JATAULarge
5G4LR1P2JATAULarge
6G4LR1P5JATAULarge
7G4LR3P3JATAULarge
8G5LR1P3MAIKILarge
9G5LR3P3MAIKILarge
10G5LR3P4MAIKILarge
11G2MR1P2DUNAMedium
12G3MR1P2CANCARAKIMedium
13G3MR1P3CANCARAKIMedium
14G4MR1P1JATAUMedium
15G4MR1P2JATAUMedium
16G4MR1P3JATAUMedium
17G5MR1P1MAIKIMedium
18G1SR1P3GIWASmall
19G1SR2P4GIWASmall
20G1SR3P1GIWASmall
21G2SR1P1DUNASmall
22G2SR1P3DUNASmall
23G2SR2P3DUNASmall
24G3SR1P1CANCARAKISmall
25G3SR1P3CANCARAKISmall
26G3SR1P4CANCARAKISmall
27G4SR1P2JATAUSmall
28G5SR1P1MAIKISmall
Table 2. Data collection for the yield and yield component traits.
CharacteristicAbbreviationMethod of Evaluation
Number of Pods Per Plant (no)NpodAt maturity, the number of pods in each plant was counted.
Dried Pods Weight(gr)DPWThe weight of total pods per plant was recorded after optimal pod drying.
Number of Large Seeds Per Plant (no)NLSThe number of large seeds in each plant was counted after drying.
Number of Medium Seeds Per Plant (no)NMSAfter drying, the number of medium seeds in each plant was counted.
Number of Small Seeds Per Plant (no)NSSThe number of small seeds in each plant was counted after drying.
Total Large-seed weight Per Plant (gr)TLSWWeight was measured in grams for the total number of large seeds per plant.
Total Medium-seed weight Per Plant (gr)TMSWThe weight was measured in grams of the total number of medium seeds per plant.
Total Small-seed weight Per Plant (gr)TSSWThe weight of the total number of small seeds per plant was recorded in grams.
100-seeds Weight(gr)100SWThe weight of 100 seeds was determined by weighing 100 seeds from each genotype randomly and the weight was recorded as 100-seed weight in grams.
Total Seed Weight/PlantTSWThe weight was measured in grams of the total number of seeds per plant.
Total Number of Seed/PlantTNSThe number of total seeds in each plant was counted after drying.
Yield (ton/ha)Ton/haThe overall pod yield per hectare of the cultivars and seed yield were calculated. Seeds have been dried and weighted.
Table 3. Keys-out of the ANOVA table base on the genotypes and seed sizes.
Source of VariationdfMSEMS
Blocks (R)(r−1)MSBσ2e + Lσ2r
Lines (L)(l−1)MSLσ2e + rσ2L×G + rGσ2L
Genotypes (G)(g−1)MSGσ2e + rσ2 L×G + rLσ2G
L(G)(l−1)(g−1)MSL × Gσ2e + rσ2 L×G
Seed Size (S)(s−1)MSSσ2e + rσ2L×S + rLσ2S
L(S)(l−1)(s−1)MSL × Sσ2e + rσ2L×S
Error(r−1)(l−1)MSEσ2e
Note: R = blocks, G = genotypes, S = seed sizes, L = lines, MS = mean squares, EMS = expected mean squares, DF = degree of freedom, SS = sum of squares, SOV = source of variation.
Table 4. Mean squares for the yield traits.
SOVdfNpodDPWNLSNMSNSSTLSWTMSWTSSW100SWTSWTNSTon/ha
Blocks2271.53 ns936.96 ns324.22 *175.61*143.89 ns507.33 ns110.90 ns60.02 *382.09 ns253.99 ns277.39 ns1.13 ns
Lines (L)27280.49 ns432.00 ns49.14 ns49.24 ns112.26 ns123.36 ns46.05 ns27.92 *994.83 **242.67 ns390.11 ns1.08 ns
Genotypes (G)(4)989.32 **1058.89 ns35.10 ns133.80 ns261.6 **161.26 ns177.23 **59.76 **4410.14 **773.06 ns1613.08 **3.43 ns
L (G)(23)157.21 ns322.97 ns49.78 ns29.47 ns86.78 ns109.35 ns21.32 ns22.45 ns400.87 ns150.43 ns177.42 ns0.67 ns
Seed Sizes (S)(2)133.01 ns150.54 ns67.20 ns6.60 ns138.13 ns315.17 ns9.55 ns16.25 ns2022.35 *455.41 ns77.66 ns2.03 ns
L (S)(25)292.29 ns454.51 ns48.08 ns52.34 ns111.02 ns109.74 ns48.45 ns28.94 *912.63 *225.66 ns415.11 ns1.00 ns
Error54261.92722.1888.9553.9967.94188.6942.3116.39458.13365.36309.661.62
Note: * significant at 5%, ** highly significant at 1%, ns = not significant, SOV = source of variation, df = degree of freedom.
Table 5. Means comparison for the yield traits.
LineNpodDPWNLSNMSNSSTLSWTMSWTSSW100SWTSWTNSTon/ha
G1LR1P326.00 ± 11.5363.03 ± 39.3419.50 ± 17.509.00 ± 0.0010.00 ± 1.0041.89 ± 38.7911.16 ± 0.005.23 ± 0.13107.63 ± 46.6144.09 ± 25.3722.67 ± 11.672.94 ± 1.69
G2LR3P248.00 ± 9.7551.45 ± 9.969.11 ± 2.6213.78 ± 2.8928.89 ± 8.269.90 ± 3.189.81 ± 2.0010.91 ± 3.4458.85 ± 4.5130.62 ± 6.3751.78 ± 10.112.04 ± 0.43
G3LR2P138.00 ± 11.5351.49 ± 19.0814.67 ± 5.1714.72 ± 7.4913.11 ± 1.9615.28 ± 5.6810.17 ± 5.344.92 ± 0.8169.16 ± 4.5630.36 ±11.6842.50 ± 14.352.03 ± 0.78
G4LR1P141.39 ± 8.5050.96 ± 9.8014.83 ± 4.9415.78 ± 1.5419.50 ± 2.2616.65 ± 5.3313.16 ± 1.5111.11 ± 3.5082.62 ± 6.3840.91 ± 3.9950.11 ± 6.342.73 ± 0.26
G4LR1P233.28 ± 5.3440.89 ± 9.5013.5 ± 3.0014.33 ± 5.8915.83 ± 1.9215.77 ± 4.0811.11 ± 4.567.22 ± 1.6269.83 ± 10.5128.84 ± 9.3239.17 ± 9.821.92 ± 0.62
G4LR1P544.67 ± 1.3554.23 ± 4.8114.33 ± 2.8715.11 ± 2.1114.28 ± 1.9315.87 ± 3.9011.04 ± 1.825.52 ± 1.6073.32 ± 3.9032.42 ± 5.3143.72 ± 5.292.16 ± 0.36
G4LR3P346.56 ± 15.9867.02 ± 19.0320.22 ± 10.8914.22 ± 3.3014.67 ± 2.4621.44 ± 11.3711.36 ± 2.495.81 ± 1.4075.89 ± 5.5338.61 ± 12.5949.11 ± 12.132.60 ± 0.84
G5LR1P333.78 ± 2.7863.78 ± 8.3414.56 ± 3.9012.28 ± 2.3911.44 ± 3.3626.29 ± 7.8813.81 ± 3.076.27 ± 1.98121.26 ± 16.5446.37 ± 10.2638.28 ± 7.533.09 ± 0.68
G5LR3P337.50 ± 9.0075.48 ± 20.2015.00 ± 4.5016.50 ± 3.4013.50 ± 6.8724.99 ± 6.6918.72 ± 4.227.46 ± 4.92112.30 ± 4.9251.17 ± 13.5145.00 ± 11.273.41 ± 0.90
G5LR3P429.39 ± 6.9847.46 ± 9.279.67 ± 2.8311.61 ± 2.8512.11 ± 2.5116.54 ± 5.1712.96 ± 3.495.82 ± 1.32102.57 ± 8.0935.32 ± 9.5333.39 ± 7.472.35 ± 0.64
G2MR1P238.78 ± 2.8950.30 ± 9.739.06 ± 4.4812.95 ± 2.7820.00 ± 3.6012.75 ± 2.469.53 ± 1.928.48 ± 1.8373.80 ± 4.2830.76 ± 1.3042.00 ± 3.202.05 ± 0.09
G3MR1P229.67 ± 2.9130.64 ± 4.966.72 ± 1.989.22 ± 2.4013.11 ± 3.306.94 ± 2.236.56 ± 1.464.28 ± 0.9460.79 ± 6.0517.77 ± 2.7029.06 ± 2.551.18 ± 0.18
G3MR1P339.89 ± 10.1645.27 ± 9.1813.83 ±3.4911.56 ± 3.7515.06 ± 5.3015.01 ± 4.168.76 ± 3.065.62 ± 2.3573.30 ± 4.2829.39 ± 7.1940.45 ± 10.851.96 ± 0.48
G4MR1P151.89 ± 14.4671.08 ± 19.9315.95 ± 4.4617.61 ± 7.0622.67 ± 7.3318.22 ± 5.2313.78 ± 5.609.37 ± 2.9172.41 ± 3.3941.37 ± 12.7956.22 ± 16.752.76 ± 0.85
G4MR1P241.67 ± 4.01751.70 ± 2.6011.44 ± 2.0215.00 ± 1.3515.44 ± 4.4012.39 ± 2.1111.19 ± 0.755.57 ± 1.6270.71 ± 6.2229.15 ± 0.8841.89 ± 4.011.94 ± 0.06
G4MR1P345.11 ± 7.6753.21 ± 6.2213.67 ± 3.0013.89 ± 1.9822.67 ± 8.2114.20 ± 3.6010.15 ± 1.959.47 ± 2.9863.84 ± 8.8229.08 ± 5.4845.67 ± 5.521.94 ± 0.37
G5MR1P149.33 ± 12.8965.52 ± 16.6310.5 ± 0.0017.33 ± 8.0931.50 ± 9.8215.39 ± 0.0018.19 ± 8.9917.54 ± 5.7077.02 ± 12.4740.86 ± 11.3252.33 ± 11.882.72 ± 0.75
G1SR1P317.00 ± 2.0839.60 ± 6.124.50 ± 1.044.83 ± 0.176.50 ± 1.328.83 ± 2.055.93 ± 0.763.14 ± 0.37112.51 ± 2.0217.89 ± 3.0915.83 ± 2.491.19 ± 0.20
G1SR2P430.50 ± 11.7643.22 ± 20.089.50 ± 0.0012.25 ± 8.2517.17 ± 9.9118.37 ± 0.0013.27 ± 8.868.29 ± 4.8874.63 ± 20.8423.25 ± 11.5325.17 ± 9.271.55 ± 0.77
G1SR3P124.67 ± 4.6443.58 ± 10.538.83 ± 6.595.67 ± 1.4514.78 ± 4.3319.54 ± 14.546.71 ± 1.536.90 ± 1.61107.10 ± 10.4433.14 ± 15.5829.28 ± 11.212.21 ± 1.04
G2SR1P146.44 ± 7.7959.78 ± 9.9815.5 ± 3.0416.78 ± 3.9623.95 ± 4.5216.80 ± 3.8712.68 ± 3.479.58 ± 2.4467.95 ± 6.5539.06 ± 9.0756.22 ± 9.632.60 ± 0.60
G2SR1P352.39 ± 10.8163.15 ± 13.7712.78 ± 3.8919.67 ± 5.0422.00 ± 4.2213.09 ± 3.9914.83 ± 3.668.32 ± 1.2365.70 ± 5.8236.24 ± 8.5154.44 ± 11.552.41 ± 0.57
G2SR2P350.33 ± 2.0262.23 ± 20.0113.56 ± 3.1714.44 ± 2.3323.22 ± 3.2815.09 ± 3.4911.46 ± 1.718.92 ± 1.5069.53 ± 3.2535.47 ± 35.4751.22 ± 2.832.37 ± 0.08
G3SR1P142.44 ± 9.9450.97 ± 9.9811.75 ± 7.2511.17 ± 4.0421.67 ± 2.3312.48 ± 8.318.08 ± 2.777.72 ± 0.9456.13 ± 8.9424.12 ± 8.0440.67 ±7.441.61 ± 0.54
G3SR1P323.17 ± 2.6727.81 ± 5.168.17 ± 2.425.06 ± 1.738.61 ± 1.638.43 ± 2.293.34 ± 1.172.72 ± 0.8664.97 ± 5.9714.49 ± 3.0921.83 ± 2.620.97 ± 0.20
G3SR1P450.56 ± 23.0861.58 ± 35.9924.67± 20.6615.89 ± 9.9616.95 ± 1.8225.16 ± 21.1712.37 ± 7.587.38 ± 0.0963.99 ± 11.0336.52 ± 22.4049.28 ± 22.632.44 ± 1.49
G4SR1P239.67 ± 5.0653.52 ± 18.3013.89 ± 9.5913.44 ± 3.0914.89 ± 4.8415.75 ± 11.3210.43 ± 2.195.98 ± 1.4072.50 ± 12.6232.16 ± 12.8642.22 ± 11.572.14 ± 0.86
G5SR1P149.00 ± 3.2174.17 ± 11.8313.00 ± 9.0022.55 ± 5.2027.89 ± 0.5919.26 ± 14.2721.86 ± 5.5912.64 ± 0.9076.67 ± 9.3647.33 ± 14.7459.11 ± 10.993.15 ± 0.98
Genotype
G124.54 ± 3.9547.36 ± 10.159.83 ± 4.007.22 ± 1.7812.30 ± 2.8920.81 ± 8.848.40 ± 1.895.95 ± 1.36100.47 ± 12.0129.59 ± 7.4723.24 ± 4.271.97 ± 0.50
G247.19 ± 3.1157.38 ± 10.4712.00 ± 1.4915.52 ± 1.4923.61 ± 2.0813.53 ± 1.4411.66 ± 1.149.24 ± 0.8867.17 ± 2.3134.43 ± 2.5451.13 ± 3.412.29 ± 0.17
G337.29 ± 4.6844.62 ± 6.7512.69 ± 2.6811.27 ± 2.1314.75 ± 1.4113.27 ± 2.808.21 ± 1.605.44 ± 0.5964.72 ± 2.8125.44 ± 4.3037.30 ± 4.761.70 ± 0.29
G443.03 ± 2.9055.33 ± 4.2614.83 ± 1.9614.92 ± 1.1617.49 ± 1.5716.41 ± 2.1811.53 ± 0.927.5 ± 0.7972.64 ± 2.5234.07 ± 2.8646.01 ± 3.092.27 ± 0.19
G539.80 ± 3.6965.28 ± 5.9312.85 ± 1.9116.06 ± 2.1219.29 ±3.1421.45 ± 3.3017.11 ± 2.269.95 ± 1.8097.97 ± 6.4144.21 ± 4.7845.62 ± 45.622.95 ± 0.32
Seed Categories
Large37.86 ± 2.7556.58 ± 5.0014.40 ± 1.7414.07 ± 1.1115.52 ± 1.4419.87 ± 3.0012.41 ± 1.327.09 ± 0.7987.34 ± 5.8037.87 ± 3.4741.57 ± 3.042.53 ± 0.23
Medium42.33 ± 3.2452.53 ± 4.5511.6 ± 1.3413.94 ± 1.5920.06 ± 2.4213.32 ± 1.4011.16 ± 1.588.62 ± 1.3270.27 ± 2.5631.20 ± 2.8743.95 ± 3.452.08 ± 0.19
Small38.74 ± 3.2352.69 ± 4.5412.14 ± 1.9212.91 ± 1.5617.97 ± 1.5415.17 ± 2.4110.93 ± 1.317.42 ± 0.6775.61 ± 3.9230.88 ± 3.5640.48 ± 3.722.06 ± 0.22
Mean39.3254.0412.8713.5817.6416.511.57.6178.4633.4641.742.23
SE1.792.751.030.831.011.510.750.512.741.9620.13
CV41.6546.5669.1754.7752.178.8858.4360.6132.0153.743.8653.69
Note: SE = standard error, CV = coefficient of variation, G1 = Giwa, G2, Duna, G3 = Cancaraki, G4 = Jatau, G5 = Maiki.
Table 6. Estimates of variability, heritability and genetic advances of the yield traits for 28 lines of Bambara groundnut.
Traitsσ2𝑔σ2eσ2pGCV (%)PCV (%)h2B%GA%
Npod6.19261.92268.116.3341.642.311.98
DPW0625.45625.45046.2800
NLS073.873.8066.7800
NMS052.3552.35053.2900
NSS14.9767.9482.9121.9351.6218.0519.19
TLSW0163.82163.82077.5900
TMSW1.8941.743.5911.9557.414.345.13
TSSW3.9216.3620.2726.0259.2119.3223.56
100SW179.81455.41635.2217.0932.1228.3118.73
TSW0322.77322.77053.700
TNS27.2308.51335.7112.543.98.17.33
Ton/ha01.431.43053.6900
Note: σ2𝑔 = genotypic variance, σ2s = seed weight variance, σ2e = error of variance, σ2p = phenotypic variance, PCV = phenotypic coefficient of variation, GCV = genotypic coefficient of variation, h2B = broad-sense heritability, GA = genetic advance.
Table 7. Correlation coefficient among the 12 quantitative traits for the 28 Bambara groundnut lines.
TraitsTLSWTMSWTSSWNLSNMSNSSNPODDPW100SWTSWTNSTon/ha
TLSW1
TMSW0.44 **1
TSSW0.10 ns0.29 **1
NLS0.88 **0.50 **0.08 ns1
NMS0.36 **0.93 **0.28 **0.54 **1
NSS0.06 ns0.21 ns0.91 **0.08 ns0.27 *1
NPOD0.50 **0.68 **0.48 **0.71 **0.80 **0.56 **1
DPW0.83 **0.75 **0.31 **0.84 **0.71 **0.30 **0.80 **1
100SW0.69 **0.30 **−0.19 ns0.36 **0.07 ns−0.38 **0.002 ns0.50 **1
TSW0.88 **0.78 **0.32 **0.82 **0.71 **0.26 *0.71 **0.92 **0.60 **1
TNS0.55 **0.77 **0.51 **0.73 **0.86 **0.57 **0.94 **0.81 **0.07 ns0.80 **1
Ton/ha0.88 **0.78 **0.32 **0.82 **0.71 **0.26 *0.71 **0.92 **0.60 **1.00 **0.80 **1
* Significant at the 0.05 probability level, ** highly significant at the 0.01 probability level, ns = not significant.
Publisher’s Note: MDPI stays neutral with regard to jurisdictional claims in published maps and institutional affiliations.

