
Effect of Different Edaphic Crop Conditions on the Free Amino Acid Profile of PH-16 Dry Cacao Beans

 , , , , ,
Abstract
:1. Introduction
2. Materials and Methods
2.1. Subsection
2.2. Soil Quality Index and Functions
2.3. Post-Harvest Processing
2.4. High-Performance Liquid Chromatography for the Determination of Free Amino Acids
2.4.1. Material Analyzed
2.4.2. Pre-Analytical Physical Treatments
2.4.3. Pre-Analytical Chemical Treatments
2.4.4. Separation, Identification and Quantitative Determination of Free Amino Acids
2.4.5. Statistical Analysis
3. Results
4. Discussion
5. Conclusions
Author Contributions
Funding
Institutional Review Board Statement
Informed Consent Statement
Data Availability Statement
Acknowledgments
Conflicts of Interest
References
- Araujo, Q.R.d.; Loureiro, G.A.H.d.A.; Baligar, V.C.; Ahnert, D.; Faria, J.C.; Valle, R.R.; Lieberei, R. Cacao quality index for cacao agroecosystems in Bahia, Brazil. Int. J. Food Prop. 2019, 22, 1799–1814. [Google Scholar] [CrossRef] [Green Version]
- Araujo, Q.R.; Fernandes, C.A.F.C.A.F.; Ribeiro, D.O.; Efraim, P.; Steinmacher, D.; Lieberei, R.; Bastide, P.; Araujo, T.G. Cocoa Quality Index—A proposal. Food Control 2014, 46, 49–54. [Google Scholar] [CrossRef]
- Deus, V.L.; Bispo, E.S.; Franca, A.S.; Gloria, M.B.A. Influence of cocoa clones on the quality and functional properties of chocolate—Nitrogenous compounds. LWT 2020, 134, 110202. [Google Scholar] [CrossRef]
- Loureiro, G.A.H.A.; Araujo, Q.R.; Sodré, G.A.; Valle, R.R.; Souza, J.O.; Ramos, E.M.L.S.; Comerford, N.B.; Grierson, P.F. Cacao quality: Highlighting selected attributes. Food Rev. Int. 2017, 33, 382–405. [Google Scholar] [CrossRef]
- Adeyeye, E.I.; Akinyeye, R.O.; Ogunlade, I.; Olaofe, O.; Boluwade, J.O. Effect of farm and industrial processing on the amino acid profile of cocoa beans. Food Chem. 2010, 118, 357–363. [Google Scholar] [CrossRef]
- De Brito, E.S.; Pezoa García, N.H.; Gallão, M.I.; Cortelazzo, A.L.; Fevereiro, P.S.; Braga, M.R. Structural and chemical changes in cocoa (Theobroma cacao L.) during fermentation, drying and roasting. J. Sci. Food Agric. 2001, 81, 281–288. [Google Scholar] [CrossRef]
- Rohsius, C.; Matissek, R.; Lieberei, R. Free amino acid amounts in raw cocoas from different origins. Eur. Food Res. Technol. 2006, 222, 432–438. [Google Scholar] [CrossRef]
- Gu, F.; Tan, L.; Wu, H.; Fang, Y.; Xu, F.; Chu, Z.; Wang, Q. Comparison of cocoa beans from China, Indonesia and Papua New Guinea. Foods 2013, 2, 183–197. [Google Scholar] [CrossRef] [PubMed] [Green Version]
- Marseglia, A.; Palla, G.; Caligiani, A. Presence and variation of γ-aminobutyric acid and other free amino acids in cocoa beans from different geographical origins. Food Res. Int. 2014, 63, 360–366. [Google Scholar] [CrossRef]
- Kirchhoff, P.M.; Biehl, B.; Crone, G. Peculiarity of the accumulation of free amino acids during cocoa fermentation. Food Chem. 1989, 31, 295–311. [Google Scholar] [CrossRef]
- Kirchhoff, P.-M.; Biehl, B.; Ziegeler-Berghausen, H.; Hammoor, M.; Lieberei, R. Kinetics of the formation of free amino acids in cocoa seeds during fermentation. Food Chem. 1989, 34, 161–179. [Google Scholar] [CrossRef]
- Brunetto, M.d.R.; Gallignani de Bernardi, M.A.; Orozco Contreras, W.J.; Clavijo Roa, S.d.S.; Delgado Cayama, Y.J.; Ayala Montilla, C.D.; Zambrano García, A. RP-HPLC-DAD determination of free amino acids in cocoa samples during fermentation and roasting. Rev. Colomb. Química 2020, 49, 11–19. [Google Scholar] [CrossRef]
- Nelson, D.L.; Cox, M.M. Lehninger Principles of Biochemistry, 7th ed.; W. H. Freeman: New York, NY, USA, 2017. [Google Scholar]
- Deus, V.L.; Bispo, E.S.; Franca, A.S.; Gloria, M.B.A. Understanding amino acids and bioactive amines changes during on-farm cocoa fermentation. J. Food Compos. Anal. 2021, 97, 103776. [Google Scholar] [CrossRef]
- Piasentin, F.B.; Saito, C.H. The different methods of cocoa farming in southeastern Bahia, Brazil: Historical aspects and perceptions. Bol. Do Mus. Para. Emílio Goeldi. Ciências Hum. 2014, 9, 61–78. [Google Scholar] [CrossRef] [Green Version]
- Chepote, R.E.; Santana, S.O.; Araujo, Q.R.; Sodré, G.A.; Reis, E.L.; Pacheco, R.G.; Marrocos, P.C.L.; Serôdio, M.H.d.C.F.; Valle, R.R. Aptidão agrícola e fertilidade de solos para a cultura do cacaueiro. In Ciência, Tecnologia e Manejo do Cacaueiro; Valle, R.R., Ed.; MAPA/CEPLAC/CEPEC: Brasília, DF, Brazil, 2012; pp. 67–114. [Google Scholar]
- Loureiro, G.A.H.d.A.; Dantas, P.A.d.S.; de Araujo, Q.R. Manejo e conservação do solo para cacaueiro. In Cacau: Cultivo, Pesquisa e Inovação; De Souza Júnior, J.O., Ed.; Editus: Ilhéus, BA, Brazil, 2018; pp. 399–436. [Google Scholar]
- Araujo, Q.; Ahnert, D.; Loureiro, G.; Faria, J.; Fernandes, C.; Baligar, V. Soil quality index for cacao cropping systems. Arch. Agron. Soil Sci. 2018, 64, 1892–1909. [Google Scholar] [CrossRef]
- De Araujo, Q.R.; Baligar, V.C.; Loureiro, G.A.H.d.A.; de Souza Júnior, J.O.; Comerford, N.B. Impact of soils and cropping systems on mineral composition of dry cacao beans. J. Soil Sci. Plant Nutr. 2017, 17, 410–428. [Google Scholar] [CrossRef] [Green Version]
- Araujo, Q.R.; Loureiro, G.A.H.A.; Rohsius, C.; Baligar, V.C. Impact of soils and cropping systems on biochemical attributes of dry cacao beans. Agrotrópica 2018, 30, 175–194. [Google Scholar] [CrossRef]
- Mandarino, E.P.; Sena Gomes, A.R. Produtividade do Cacaueiro (Theobroma cacao L.) Cultivado em Blocos Monoclonais, no sul da Bahia, Brazil; Boletim Técnico, No. 197; CEPLAC/CEPEC: Ilhéus, BA, Brazil, 2009. [Google Scholar]
- Cruz, J.F.M.; Leite, P.B.; Soares, S.E.; Bispo, E.d.S.; Leite, P.B.; Soares, S.E.; Bispo, E.d.S. Assessment of the fermentative process from different cocoa cultivars produced in Southern Bahia, Brazil. Afr. J. Biotechnol. 2013, 12, 5218–5225. [Google Scholar] [CrossRef] [Green Version]
- Sodré, G.A.; Marrocos, P.C.L.; Sarmento, D.A. Cultivo do Cacaueiro no Estado do Ceará; Boletim Técnico, No. 209; CEPLAC/CEPEC: Ilheus, BA, Brazil, 2017. [Google Scholar]
- Loureiro, G.A.H.d.A.; de Araujo, Q.R.; Valle, R.R.; Sodré, G.A.; Santos Filho, L.P.; Oliveira, S.J.R.; Dantas, P.A.S.; Couto, L.R.; Lopes, M.R. Influence of environmental factors on cacao biometric attributes. Agrotrópica 2016, 28, 123–140. [Google Scholar] [CrossRef]
- Loureiro, G.A.H.d.A.; de Araujo, Q.R.; Valle, R.R.; Sodré, G.A.; de Souza, S.M.M. Influencia de factores agroambientales sobre la calidad del clon de cacao (Theobroma cacao L.) PH-16 en la región cacaotera de Bahia, Brazil. Ecosistemas y Recur. Agropecu. 2017, 4, 579. [Google Scholar] [CrossRef] [Green Version]
- Sodré, G.A.; Gomes, A.R.S. Cocoa propagation, technologies for production of seedlings. Rev. Bras. Frutic. 2019, 41. [Google Scholar] [CrossRef]
- Resende, M.; Curi, N.; de Rezende, S.B.; Corrêa, G.F. Pedologia: Base Para Distinção de Ambientes, 6th ed.; Editora UFLA: Lavras, MG, Brazil, 2014. [Google Scholar]
- Superintendência de Estudos Econômicos e Sociais da Bahia (SEI). Tipologia Climática—Segundo Thornthwaite—Pluviometria 1943–1983/Temperatura 1961–1990. Estado da Bahia. Available online: http://www.sei.ba.gov.br/site/geoambientais/cartogramas/pdf/carto_tip_clim.pdf (accessed on 2 February 2014).
- Dos Santos, H.G.; Jacomine, P.K.T.; dos Anjos, L.H.C.; de Oliveira, V.Á.; Lumbreras, J.F.; Coelho, M.R.; de Almeida, J.A.; Cunha, T.J.F.; de Oliveira, J.B. Sistema Brasileiro de Classificação de Solos, 3rd ed.; Embrapa: Brasilia, DF, Brazil, 2013. [Google Scholar]
- Methodenbuch Band III Methode, Nr. 3.6. In Ergänzungslieferung; Naumann, C.; Bassler, R.; Seibold, R.; Barth, C. (Eds.) VDLUFA-Verlag: Darmstadt, Germany, 1976. [Google Scholar]
- R Core Team. R: A Language and Environment for Statistical Computing; R Foundation for Statistical Computing: Vienna, Austria, 2021. [Google Scholar]
- Husson, F.; Josse, J. Package ‘missMDA’. 2020, p. 41. Available online: https://cran.rediris.es/web/packages/FactoMineR/FactoMineR.pdf (accessed on 1 June 2021).
- Husson, F.; Josse, J.; Le, S.; Mazet, J. Package ‘FactoMineR’. 2020, p. 100. Available online: http://203.178.137.175/pub/lang/R/CRAN/web/packages/FactoMineR/FactoMineR.pdf (accessed on 1 June 2021).
- Wickham, H.; Chang, W.; Henry, L.; Pedersen, T.L.; Takahashi, K.; Wilke, C.; Woo, K.; Yutani, H.; Dunnington, D. RStudio Package ‘ggplot2′. 2020, p. 284. Available online: https://cran.r-project.org/web/packages/ggplot2/index.html (accessed on 1 June 2021).
- Stark, T.; Hofmann, T. Isolation, Structure Determination, Synthesis, and Sensory Activity of N -Phenylpropenoyl- l -amino Acids from Cocoa (Theobroma cacao). J. Agric. Food Chem. 2005, 53, 5419–5428. [Google Scholar] [CrossRef] [PubMed]
- Voigt, J.; Heinrichs, H.; Voigt, G.; Biehl, B. Cocoa-specific aroma precursors are generated by proteolytic digestion of the vicilin-like globulin of cocoa seeds. Food Chem. 1994, 50, 177–184. [Google Scholar] [CrossRef]
- Jinap, S.; Hajeb, P. Glutamate. Its applications in food and contribution to health. Appetite 2010, 55, 1–10. [Google Scholar] [CrossRef]
- Yoshida, Y. Umami taste and traditional seasonings. Food Rev. Int. 1998, 14, 213–246. [Google Scholar] [CrossRef]

| Sources of Variation | DF | SQI Functions | |||||||||
|---|---|---|---|---|---|---|---|---|---|---|---|
| Available Water | Root Growth | Mineral Nutrition of Plants | Environmental Safety | SQI | |||||||
| Mean Squared | |||||||||||
| Crop site 1 | 11 | 0.02 ** | 0.01 ** | 0.01 ** | 0.01 ** | 0.05 ** | |||||
| Error | 24 | <0.01 | <0.01 | <0.01 | <0.01 | <0.01 | |||||
| Total | 35 | ||||||||||
| Coefficient of variation (%) | |||||||||||
| 21.94 | 24.71 | 15.05 | 29.35 | 12.08 | |||||||
| Crop site 1 | Average ± standard deviation (n = 3) | ||||||||||
| 1 LAd_cam | 0.13 ± < 0.01 b | 0.07 ± < 0.01 c | 0.17 ± < 0.01 b | 0.05 ± < 0.01 c | 0.42 ± 0.01 c | ||||||
| 2 PVAd | 0.02 ± 0.01 d | 0.09 ± 0.01 c | 0.26 ± 0.03 a | 0.14 ± 0.02 a | 0.52 ± 0.03 b | ||||||
| 3 PVAd | 0.09 ± 0.05 c | 0.10 ± 0.03 c | 0.26 ± 0.04 a | 0.12 ± 0.06 b | 0.58 ± 0.04 b | ||||||
| 4 LAd | 0.13 ± < 0.01 b | 0.08 ± 0.01 c | 0.22 ± 0.02 a | 0.10 ± 0.02 b | 0.52 ± 0.04 b | ||||||
| 5 LVAd | 0.13 ± < 0.01 b | 0.09 ± 0.03 c | 0.19 ± 0.05 b | 0.05 ± < 0.01 c | 0.46 ± 0.09 c | ||||||
| 6 PVAe cam | 0.04 ± 0.02 d | 0.09 ± 0.01 c | 0.24 ± 0.02 a | 0.05 ± 0.01 c | 0.42 ± 0.05 c | ||||||
| 7 CXd | 0.04 ± 0.01 d | 0.09 ± 0.01 c | 0.23 ± 0.01 a | 0.04 ± 0.01 c | 0.39 ± 0.01 c | ||||||
| 8 LVAd arg | 0.08 ± 0.06 c | 0.12 ± 0.03 b | 0.26 ± 0.04 a | 0.15 ± 0.05 a | 0.62 ± 0.08 a | ||||||
| 9 PAd lat | 0.11 ± 0.02 b | 0.06 ± 0.02 c | 0.17 ± 0.05 b | 0.06 ± 0.03 c | 0.40 ± 0.09 c | ||||||
| 10 PVAd | 0.23 ± < 0.01 a | 0.17 ± 0.04 a | 0.25 ± 0.04 a | 0.02 ± 0.01 c | 0.67 ± 0.09 a | ||||||
| 11 PVA ali | 0.23 ± 0.01 a | 0.14 ± 0.03 b | 0.25 ± 0.03 a | 0.10 ± 0.02 b | 0.72 ± 0.08 a | ||||||
| 12 PVAd coe | 0.02 ± < 0.01 d | 0.01 ± 0.01 d | 0.10 ± 0.02 c | 0.16 ± 0.02 a | 0.29 ± 0.02 d | ||||||
| Minimum | 0.02 | 0 | 0.08 | 0.01 | 0.27 | ||||||
| General average ± standard deviation | 0.10 ± 0.07 | 0.09 ± 0.04 | 0.22 ± 0.06 | 0.09 ± 0.05 | 0.50 ± 0.13 | ||||||
| Maximum | 0.23 | 0.2 | 0.29 | 0.19 | 0.81 | ||||||
| Crop Site | Productivity (@/ha/year) | Correction of Soil Acidity | Mineral Fertilization in the Planting Pit | Mineral Fertilization Per Plant | Fertigation— WaterConsumption (m3/ha/day) | ||||||||
|---|---|---|---|---|---|---|---|---|---|---|---|---|---|
| Liming in the Total Area (kg) | Frequency of Total Liming | Agricultural Plaster Application (kg) | Frequency of Agricultural Plaster Application | Lime in the Planting Pit (kg) | Single Superphosphate (kg) | Potassium Chloride (kg) | Urea (kg) | Frequency of Urea Application | NPK (kg) | Frequency of NPK Application | |||
| 1 LAd cam | UP | 1000 | 1/year | 0 | NA | 0.15 | 0.15 | 0 | 0 | NA | 0.3 | 2/year | NA |
| 2 PVAd | UP | 0 | 0 | 0 | NA | 0 | NI | NI | NI | NA | 0.3 | 2/year | NA |
| 3 PVAd | UP | 1000 | 1/year | 0 | NA | 0.15 | 0.15 | 0 | 0 | NA | 0.3 | 2/year | NA |
| 4 LAd | UP | 1500 | 1/year | 0 | NA | 0.15 | 0.15 | 0 | 0 | NA | 0.3 | 2/year | NA |
| 5 LVAd | 73 | 1000 | 1/year | 0 | NA | 0.15 | 0.15 | 0 | 0 | NA | 0.25 | 2/year | NA |
| 6 PVAe cam | 74 | 600 | 1/4 ° year | 270 | 1/4 ° year | 0 | 0 | 0 | 0.12 | 2/year | 0.4 | 2/year | NA |
| 7 CXd | 20 | 0 | 0 | 0 | NA | 0 | NI | NI | NI | NA | 0 | NA | NA |
| 8 LVAd arg | UP | 2000 | 1/year | 0 | NA | 0 | NI | NI | NI | NA | 0.3 | 1/year | NA |
| 9 PAd lat | UP | 0 | 0 | 0 | NA | 0 | 0.15 | 0 | 0 | NA | 0.2 | 2/year | NA |
| 10 PVAd | 40 | 0 | 0 | 0 | NA | 0 | NI | NI | NI | NA | 0.2 | 2/year | NA |
| 11 PVA ali | 54 | 2000 | 1/year | 0 | NA | 0 | NI | NI | NI | NA | 0.2 | NA | 20 |
| 12 PVAd coe | UP | 0 | 0 | 0 | NA | 0.5 | 0.5 | 0.05 | 0 0 | NA | 0 | NA | NA |
| Sources of Variation | Free Amino Acids (mg g−1) | |||||||||||||||||||
|---|---|---|---|---|---|---|---|---|---|---|---|---|---|---|---|---|---|---|---|---|
| Acidic | Hydrophobic | |||||||||||||||||||
| Asparagine | Aspartic Acid | Glutamine | Glutamic Acid | Alanine | Isoleucine | Leucine | Phenylalanine | Tyrosine | Valine | |||||||||||
| DF 1 | MS 2 | DF 1 | MS 2 | DF 1 | MS 2 | DF 1 | MS 2 | DF 1 | MS 2 | DF 1 | MS 2 | DF 1 | MS 2 | DF 1 | MS 2 | DF 1 | MS 2 | DF 1 | MS 2 | |
| Crop site 3 | 11 | 21187.6 ns | 11 | 6542.85 ns | 11 | 27,214.72 ns | 11 | 37,540.43 ns | 11 | 19,081.12 ns | 11 | 12,642.57 ns | 11 | 240,343.76 ns | 11 | 181,869.21 ns | 11 | 58,295.6 ns | 11 | 20,027.99 ns |
| Error | 24 | 51,387.77 | 24 | 6116.95 | 20 | 23,708.01 | 24 | 93,384.41 | 24 | 35,746.24 | 24 | 13,848.75 | 24 | 197,315.44 | 24 | 155,044.91 | 21 | 33,735.67 | 24 | 25,873.69 |
| Total | 35 | 35 | 31 | 35 | 35 | 35 | 35 | 35 | 32 | 35 | ||||||||||
| Coefficient of variation (%) | ||||||||||||||||||||
| 21.66 | 17.83 | 23.75 | 23.98 | 15.59 | 16.99 | 19.54 | 21.33 | 18.7 | 16.42 | |||||||||||
| Crop site 3 | Average ± standard deviation (SD) | |||||||||||||||||||
| 1 LAd_cam | 1158.89 ± 106.62 | 499.62 ± 30.69 | 852.89 ± 282.52 | 1415.30 ± 155.45 | 1305.86 ± 50.71 | 708.84 ± 136.14 | 2191.72 ± 286.81 | 1795.38 ± 303.43 | 838.15 ± 102.29 | 985.04 ± 180.84 | ||||||||||
| 2 PVAd | 1027.44 ± 288.29 | 344.87 ± 89.65 | 529.42 ± 371.94 | 1373.98 ± 198.23 | 1129.72 ± 287.68 | 616.33 ± 142.53 | 1912.67 ± 799.94 | 1650.30 ± 626.11 | 856.67 ± 308.31 | 873.54 ± 154.35 | ||||||||||
| 3 PVAd | 1023.28 ± 283.84 | 418.55 ± 93.45 | 733.35 ± 217.64 | 1334.26 ± 299.30 | 1209.42 ± 258.64 | 732.59 ± 184.85 | 2451.39 ± 511.50 | 1994.73 ± 498.48 | 1156.67 ± 16.89 | 1007.53 ± 245.09 | ||||||||||
| 4 LAd | 1049.71 ± 216.54 | 484.88 ± 43.42 | 685.65 ± 52.52 | 1210.70 ± 237.23 | 1271.22 ± 103.66 | 711.04 ± 77.08 | 2351.23 ± 133.18 | 1810.16 ± 127.46 | 933.11 ± 111.18 | 1013.51 ± 120.91 | ||||||||||
| 5 LVAd | 923.07 ± 165.65 | 459.99 ± 94.76 | 747.09 ± 7.12 | 1213.81 ± 314.98 | 1053.82 ± 30.29 | 648.10 ± 86.97 | 2189.06 ± 273.91 | 1750.84 ± 329.83 | 888.82 ± 153.39 | 898.33 ± 80.44 | ||||||||||
| 6 PVAe cam | 1007.23 ± 316.04 | 396.66 ± 82.32 | 727.29 ± 125.70 | 1180.56 ± 93.78 | 1281.35 ± 348.45 | 659.11 ± 157.90 | 2555.31 ± 581.86 | 2082.47 ± 576.73 | 1168.93 ± 322.42 | 924.38 ± 223.35 | ||||||||||
| 7 CXd | 1054.11 ± 97.85 | 449.52 ± 58.98 | 616.79 ± 104.36 | 1413.68 ± 621.47 | 1269.73 ± 65.59 | 851.30 ± 54.61 | 2729.64 ± 226.71 | 2299.72 ± 90.40 | 1201.74 ± 54.40 | 1188.41 ± 136.62 | ||||||||||
| 8 LVAd arg | 1095.29 ± 234.14 | 487.24 ± 116.57 | 662.96 ± 90.37 | 1235.72 ± 261.25 | 1276.20 ± 271.07 | 745.22 ± 78.83 | 2618.76 ± 123.64 | 2122.50 ± 138.85 | 1104.23 ± 79.61 | 1040.37 ± 150.75 | ||||||||||
| 9 PAd lat | 1038.26 ± 144.31 | 437.67 ± 25.24 | 607.94 ± 99.69 | 1184.08 ± 380.81 | 1203.75 ± 37.80 | 665.88 ± 19.56 | 2073.05 ± 103.58 | 1707.57 ± 152.23 | 844.18 ± 73.77 | 955.15 ± 25.21 | ||||||||||
| 10 PVAd | 1210.21 ± 192.48 | 469.26 ± 108.06 | 515.77 ± 180.37 | 1383.18 ± 184.03 | 1152.53 ± 188.80 | 620.93 ± 194.58 | 1778.39 ± 729.06 | 1370.15 ± 657.00 | 786.24 ± 326.94 | 944.88 ± 278.68 | ||||||||||
| 11 PVA ali | 912.77 ± 127.55 | 381.32 ± 16.89 | 597.65 ± 94.94 | 1290.70 ± 65.20 | 1269.30 ± 148.66 | 697.42 ± 84.82 | 2235.70 ± 580.22 | 1754.38 ± 432.09 | 957.17 ± 190.32 | 984.44 ± 53.22 | ||||||||||
| 12 PVAd coe | 1059.71 ± 358.97 | 434.76 ± 91.56 | 523.88 ± 23.17 | 1058.51 ± 407.04 | 1130.12 ± 81.81 | 655.08 ± 9.58 | 2195.19 ± 84.06 | 1809.82 ± 36.64 | 1019.44 ± 33.41 | 941.52 ± 19.86 | ||||||||||
| Minimum | 645.82 | 249.05 | 266.42 | 590.23 | 797.54 | 409.07 | 993.46 | 671.46 | 455.16 | 629.3 | ||||||||||
| General average ± SD 4 | 1046.66 ± 204.69 | 438.70 ± 79.06 | 648.40 ± 157.96 | 1274.54 ± 275.38 | 1212.75 ± 174.67 | 692.65 ± 116.06 | 2273.51 ± 459.17 | 1845.67 ± 404.32 | 982.08 ± 205.37 | 979.76 ± 155.04 | ||||||||||
| Maximum | 1474.17 | 616.23 | 1052.66 | 2123.83 | 1586.96 | 893.3 | 2986.89 | 2486.52 | 1388.67 | 1342.75 | ||||||||||
| Sources of Variation | Free Amino Acids (mg g−1) | |||||||||||
|---|---|---|---|---|---|---|---|---|---|---|---|---|
| Non-Protein | Other | |||||||||||
| GABA1 | Glycine | Lysine | Serine | Threonine | Tryptophan | |||||||
| DF 2 | MS 3 | DF 2 | MS 3 | DF 2 | MS 3 | DF 2 | MS 3 | DF 2 | MS 3 | DF 2 | MS 3 | |
| Crop site 4 | 11 | 106,900.27 ns | 11 | 1882.54 ns | 11 | 168,769.45 * | 11 | 5782.32 ns | 11 | 4720.7 ns | 11 | 10,573.43 ns |
| Error | 24 | 55,849.1 | 23 | 3343.9 | 23 | 56,272.05 | 24 | 9852.58 | 24 | 7337.29 | 24 | 6457.22 |
| Total | 35 | 34 | 34 | 35 | 35 | 35 | ||||||
| Coefficient of variation (%) | ||||||||||||
| 24.09 | 51.7 | 37.28 | 25.47 | 35.56 | 30.6 | |||||||
| Crop site 4 | Average ± standard deviation | |||||||||||
| 1 LAd_cam | 1007.41 ± 146.45 | 162.22 ± 125.20 | 704.28 ± 128.71 b | 460.37 ± 157.90 | 302.33 ± 159.94 | 246.74 ± 43.69 | ||||||
| 2 PVAd | 934.96 ± 65.14 | 139.70 ± 102.04 | 543.68 ± 272.79 b | 404.75 ± 160.56 | 250.52 ± 137.91 | 218.79 ± 104.01 | ||||||
| 3 PVAd | 838.43 ± 234.40 | 105.21 ± 35.22 | 703.04 ± 153.39 b | 388.53 ± 121.71 | 228.71 ± 55.69 | 288.11 ± 67.51 | ||||||
| 4 Lad | 942.81 ± 195.92 | 83.59 ± 3.51 | 380.14 ± 143.15 b | 384.84 ± 52.82 | 199.26 ± 22.17 | 238.44 ± 25.81 | ||||||
| 5 LVAd | 705.41 ± 120.60 | 79.78 ± 22.81 | 424.53 ± 169.61 b | 317.43 ± 42.34 | 202.24 ± 59.90 | 248.02 ± 74.18 | ||||||
| 6 PVAe cam | 1433.32 ± 493.06 | 119.34 ± 47.21 | 1204.92 ± 618.90 a | 410.51 ± 117.10 | 279.30 ± 116.25 | 360.19 ± 139.25 | ||||||
| 7 CXd | 928.94 ± 210.22 | 129.54 ± 15.31 | 922.80 ± 153.29 a | 451.91 ± 24.11 | 291.05 ± 39.69 | 346.76 ± 49.16 | ||||||
| 8 LVAd arg | 1209.53 ± 125.63 | 126.62 ± 14.99 | 708.66 ± 78.75 b | 420.84 ± 45.98 | 277.22 ± 40.96 | 332.77 ± 62.96 | ||||||
| 9 PAd lat | 814.22 ± 114.63 | 114.31 ± 85.43 | 503.76 ± 153.16 b | 381.82 ± 90.55 | 252.58 ± 100.48 | 208.74 ± 40.07 | ||||||
| 10 PVAd | 964.38 ± 303.48 | 92.25 ± 15.69 | 384.84 ± 105.38 b | 348.18 ± 145.23 | 192.73 ± 85.29 | 160.35 ± 109.61 | ||||||
| 11 PVA ali | 956.35 ± 313.34 | 86.88 ± 10.96 | 538.86 ± 172.42 b | 377.76 ± 46.95 | 203.92 ± 11.44 | 253.83 ± 117.72 | ||||||
| 12 PVAd coe | 1037.43 ± 173.55 | 96.14 ± 19.13 | 532.18 ± 109.01 b | 330.28 ± 14.89 | 210.35 ± 44.71 | 248.88 ± 27.98 | ||||||
| Minimum | 573.29 | 63.18 | 229.03 | 190.37 | 97.15 | 249.05 | ||||||
| General average ± standard deviation | 981.10 ± 268.13 | 111.84 ± 53.58 | 636.29 ± 304.41 | 389.77 ± 92.59 | 240.85 ± 80.72 | 438.70 ± 79.06 | ||||||
| Maximum | 1994.09 | 306.43 | 1563.85 | 626.78 | 485.95 | 616.23 | ||||||
| Group | Free Amino Acid (mg g−1) | SQI Functions | SQI | |||
|---|---|---|---|---|---|---|
| Available Water | Root Growth | Mineral Nutrition of Plants | Environmental Safety | |||
| Pearson’s Correlation Coefficient | ||||||
| Acidic | Asparagine | 0.00 ns | 0.04 ns | 0.02 ns | −0.06 ns | 0.01 ns |
| Aspartic acid | 0.11 ns | −0.01 ns | −0.13 ns | −0.12 ns | −0.04 ns | |
| Glutamine | 0.05 ns | −0.02 ns | 0.08 ns | −0.15 ns | 0.00 ns | |
| Glutamic acid | 0.09 ns | 0.27 ns | 0.30 ns | −0.03 ns | 0.26 ns | |
| Hydrophobic | Alanine | −0.03 ns | −0.01 ns | 0.08 ns | 0.02 ns | 0.02 ns |
| Isoleucine | −0.09 ns | −0.01 ns | 0.05 ns | 0.00 ns | −0.04 ns | |
| Leucine | −0.22 ns | −0.10 ns | 0.08 ns | 0.03 ns | −0.11 ns | |
| Phenylalanine | −0.31 ns | −0.14 ns | 0.08 ns | 0.06 ns | −0.16 ns | |
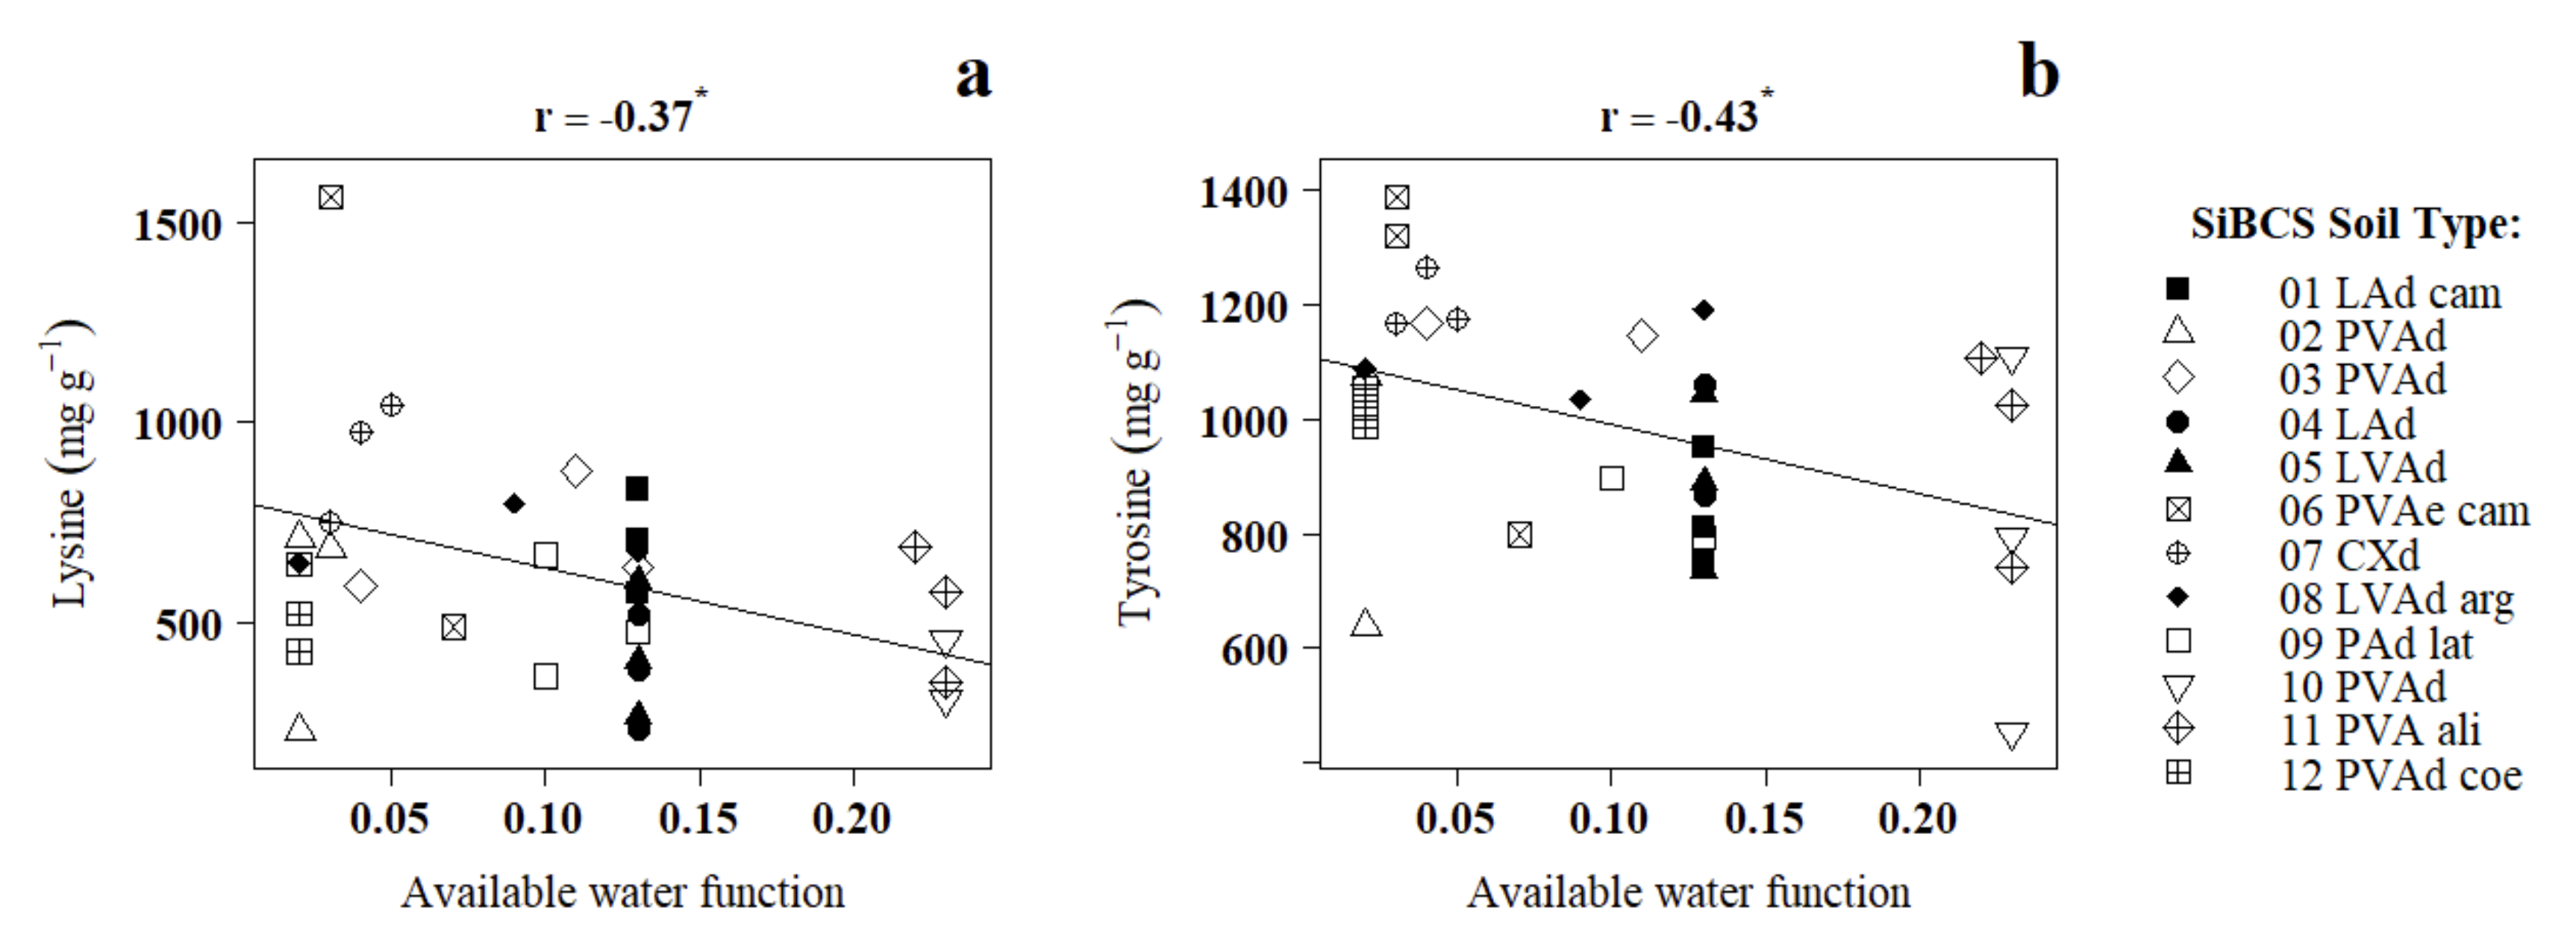
| Tyrosine | −0.43 * | −0.09 ns | 0.19 ns | 0.06 ns | −0.16 ns | |
| Valine | −0.04 ns | 0.06 ns | 0.08 ns | −0.01 ns | 0.02 ns | |
| Non-protein | GABA 2 | −0.21 ns | −0.01 ns | 0.15 ns | 0.07 ns | −0.02 ns |
| Other | Glycine | −0.18 ns | −0.09 ns | 0.09 ns | −0.02 ns | −0.09 ns |
| Lysine | −0.37* | −0.10 ns | 0.16 ns | −0.20 ns | −0.24 ns | |
| Serine | −0.11 ns | 0.02 ns | 0.19 ns | 0.00 ns | 0.02 ns | |
| Threonine | −0.25 ns | −0.07 ns | 0.12 ns | −0.05 ns | −0.13 ns | |
| Tryptophan | −0.31 ns | −0.12 ns | 0.09 ns | 0.00 ns | −0.18 ns | |
| Variables | Asn 1 | Asp 2 | Gln 3 | Glu 4 | Ala 5 | Ile 6 | Leu 7 | Phe 8 | Tyr 9 | Val 10 | GABA 11 | Gly 12 | Lys 13 | Ser 14 | Thr 15 |
|---|---|---|---|---|---|---|---|---|---|---|---|---|---|---|---|
| Asp 2 | 0.76 ** | ||||||||||||||
| Gln 3 | 0.28 ns | 0.50 ** | |||||||||||||
| Glu 4 | 0.44 ** | 0.30 ns | 0.17 ns | ||||||||||||
| Ala 5 | 0.66 ** | 0.59 ** | 0.52 ** | 0.31 ns | |||||||||||
| Ile 6 | 0.50 ** | 0.55 ** | 0.60 ** | 0.29 ns | 0.77 ** | ||||||||||
| Leu 7 | 0.37 * | 0.45 ** | 0.63 ** | 0.03 ns | 0.73 ** | 0.86 ** | |||||||||
| Phe 8 | 0.40 * | 0.38 * | 0.63 ** | 0.09 ns | 0.72 ** | 0.88 ** | 0.96 ** | ||||||||
| Tyr 9 | 0.29 ns | 0.18 ns | 0.38 * | −0.05 ns | 0.56 ** | 0.71 ** | 0.85 ** | 0.90 ** | |||||||
| Val 10 | 0.57 ** | 0.61 ** | 0.51 ** | 0.44 ** | 0.79 ** | 0.96 ** | 0.74 ** | 0.78 ** | 0.62 ** | ||||||
| GABA 11 | 0.40 * | 0.26 ns | 0.32 ns | 0.01 ns | 0.52 ** | 0.31 ns | 0.46 ** | 0.49 ** | 0.52 ** | 0.32 ns | |||||
| Gly 12 | 0.32 ns | 0.12 ns | 0.54 ** | 0.27 ns | 0.41 * | 0.42 * | 0.27 ns | 0.48 ** | 0.43 * | 0.41 * | 0.31 ns | ||||
| Lys 13 | 0.29 ns | 0.07 ns | 0.32 ns | 0.01 ns | 0.53 ** | 0.49 ** | 0.68 ** | 0.75 ** | 0.79 ** | 0.39 * | 0.59 ** | 0.47 ** | |||
| Ser 14 | 0.50 ** | 0.41 * | 0.69 ** | 0.40 * | 0.76 ** | 0.79 ** | 0.66 ** | 0.76 ** | 0.62 ** | 0.79 ** | 0.48 ** | 0.84 ** | 0.55 ** | ||
| Thr 15 | 0.41 * | 0.29 ns | 0.56 ** | 0.30 ns | 0.59 ** | 0.62 ** | 0.48 ** | 0.65 ** | 0.62 ** | 0.63 ** | 0.43 ** | 0.95 ** | 0.61 ** | 0.89 ** | |
| Trp 16 | 0.28 ns | 0.22 ns | 0.49 ** | −0.06 ns | 0.60 ** | 0.72 ** | 0.89 ** | 0.92 ** | 0.90 ** | 0.58 ** | 0.51 ** | 0.35 * | 0.79 ** | 0.57 ** | 0.54 ** |
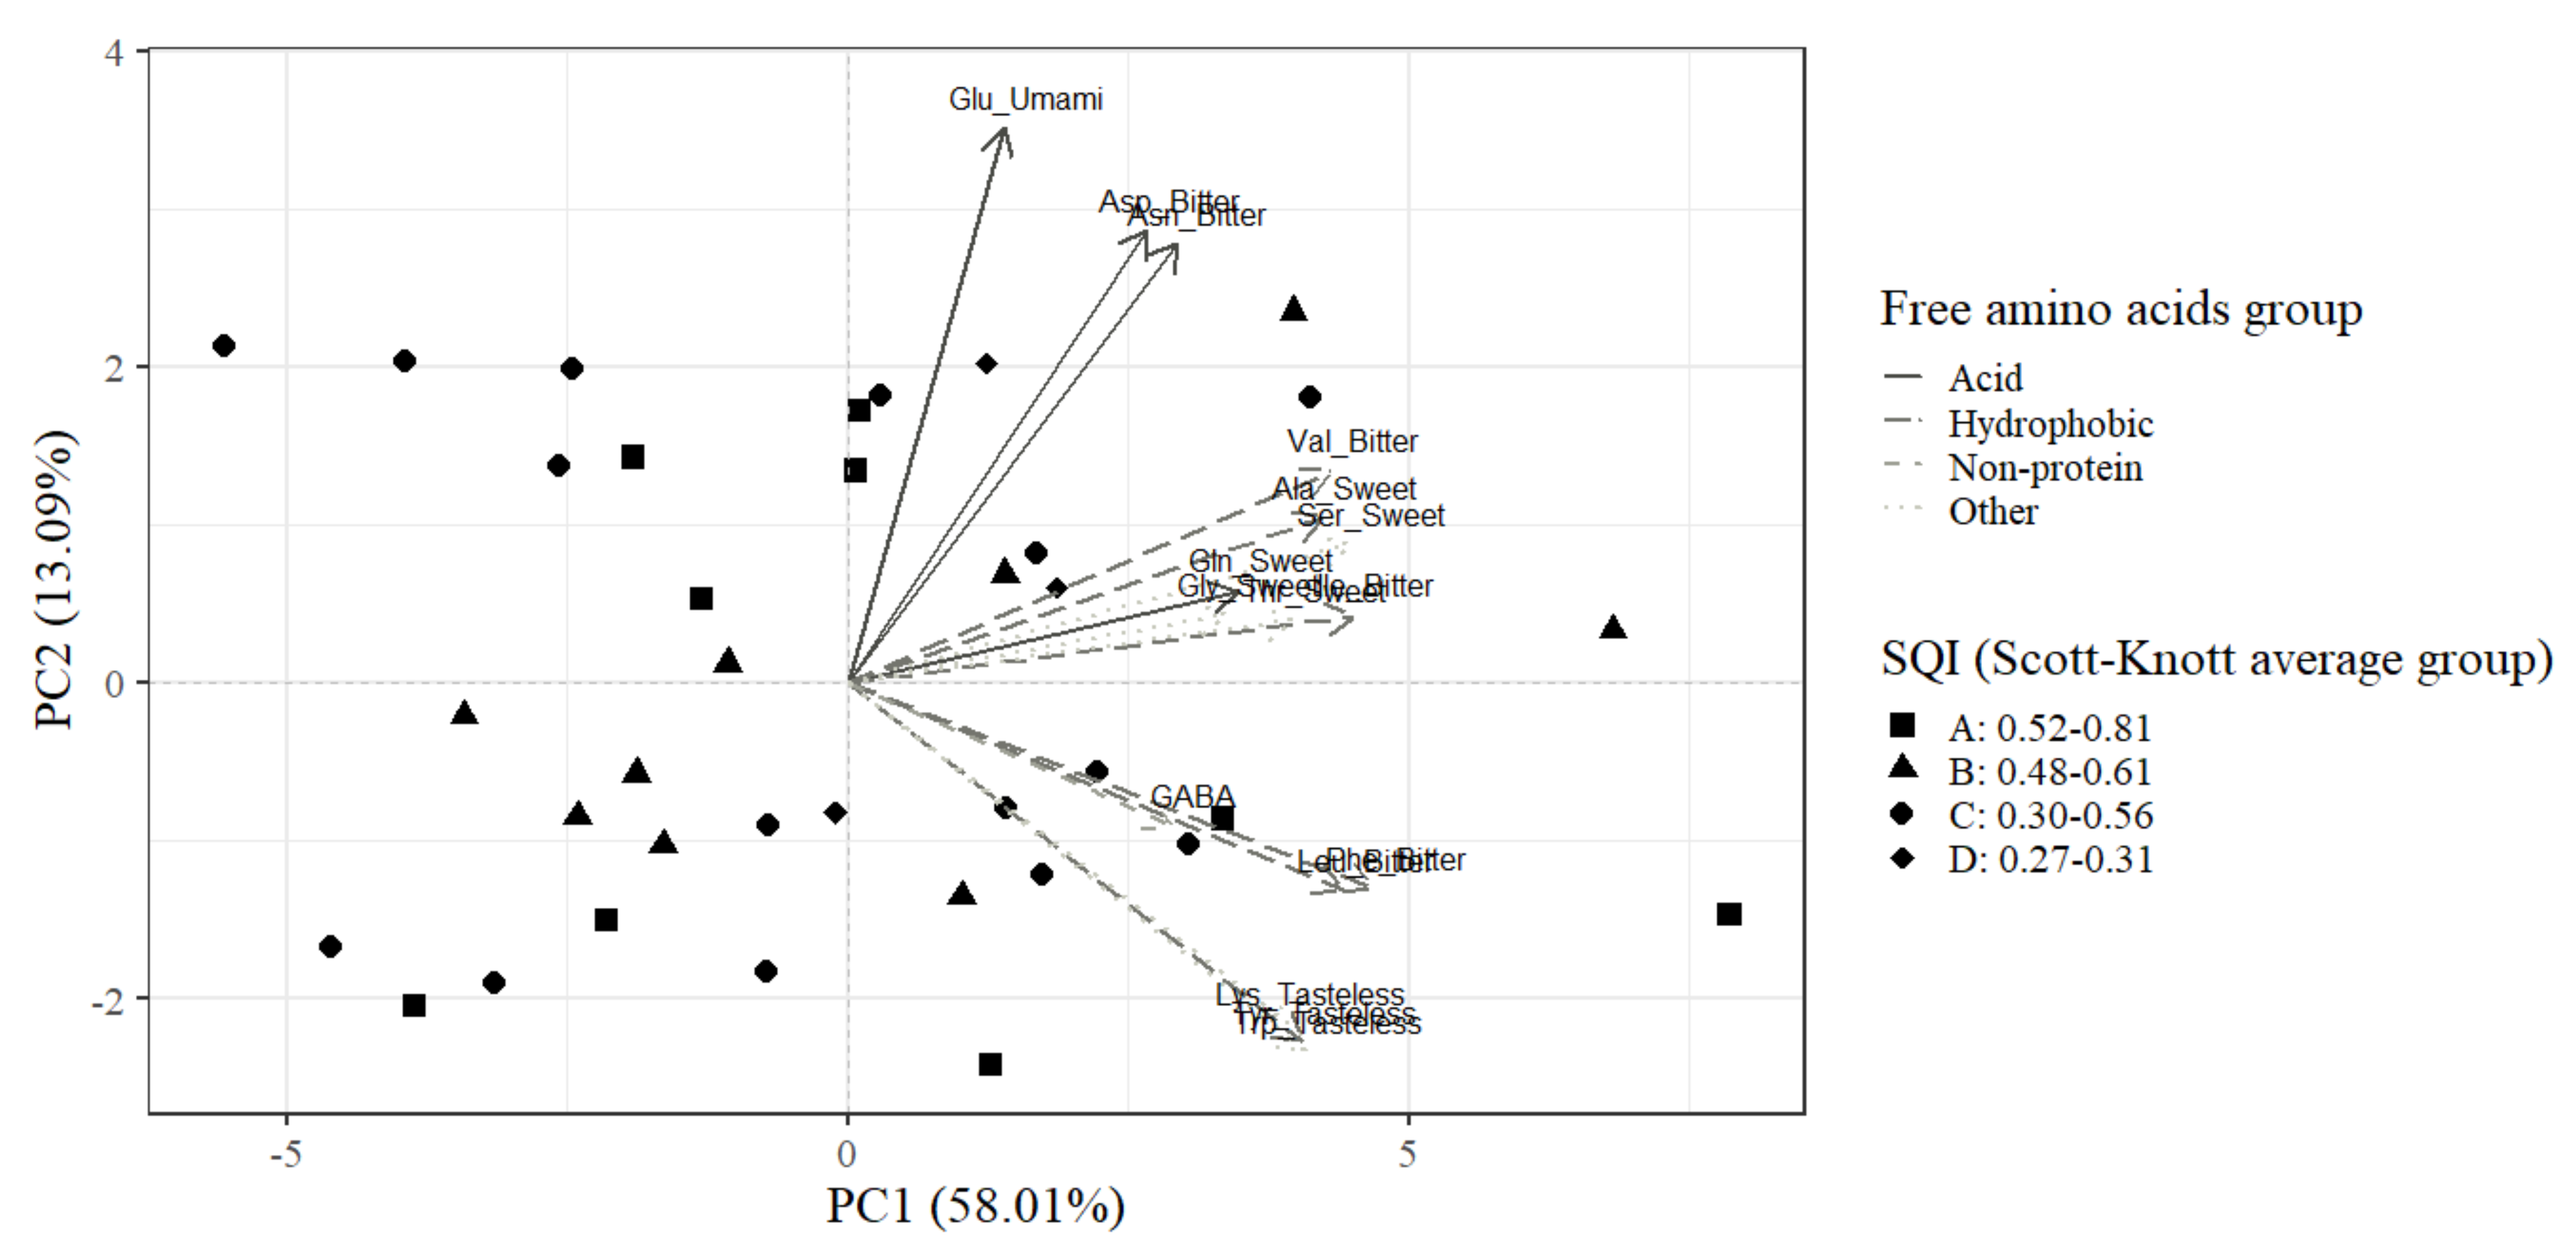
| Variable | Taste Class 1 | Principal Component 1 | Principal Component 2 |
|---|---|---|---|
| Hydrophobic Free Amino Acids | Glutamic Acid | ||
| Phenylalanine (Phe) | Bitter | 0.94 | −0.26 |
| Isoleucine (Ile) | Bitter | 0.90 | 0.09 |
| Serine (Ser) | Sweet | 0.89 | 0.18 |
| Leucine (Leu) | Bitter | 0.88 | −0.26 |
| Valine (Val) | Bitter | 0.86 | 0.27 |
| Alanine (Ala) | Sweet | 0.85 | 0.21 |
| Tryptophan (Trp) | Tasteless | 0.82 | −0.47 |
| Tyrosine (Tyr) | Tasteless | 0.81 | −0.45 |
| Threonine (Thr) | Sweet | 0.80 | 0.08 |
| Lysine (Lys) | Tasteless | 0.78 | −0.43 |
| Glutamine (Gln) | Sweet | 0.70 | 0.12 |
| Glycine (Gly) | Sweet | 0.68 | 0.09 |
| Asparagine (Asn) | Bitter | 0.59 | 0.56 |
| Gamma-aminobutyric acid (GABA) 2 | NA 3 | 0.58 | −0.18 |
| Aspartic acid (Asp) | Bitter | 0.53 | 0.57 |
| Glutamic acid (Glu) | Umami | 0.28 | 0.70 |
| Eigenvalue | 9.28 | 2.09 | |
| Retained variance (%) | 58.01 | 13.09 | |
| Cumulative variance (%) | 58.01 | 71.09 | |
Publisher’s Note: MDPI stays neutral with regard to jurisdictional claims in published maps and institutional affiliations. |
© 2021 by the authors. Licensee MDPI, Basel, Switzerland. This article is an open access article distributed under the terms and conditions of the Creative Commons Attribution (CC BY) license (https://creativecommons.org/licenses/by/4.0/).
Share and Cite
de Araujo, Q.R.; de Abreu Loureiro, G.A.H.; Póvoas, C.E.M.; Steinmacher, D.; de Almeida, S.S.; Ahnert, D.; Baligar, V.C. Effect of Different Edaphic Crop Conditions on the Free Amino Acid Profile of PH-16 Dry Cacao Beans. Agronomy 2021, 11, 1637. https://doi.org/10.3390/agronomy11081637
de Araujo QR, de Abreu Loureiro GAH, Póvoas CEM, Steinmacher D, de Almeida SS, Ahnert D, Baligar VC. Effect of Different Edaphic Crop Conditions on the Free Amino Acid Profile of PH-16 Dry Cacao Beans. Agronomy. 2021; 11(8):1637. https://doi.org/10.3390/agronomy11081637
Chicago/Turabian Stylede Araujo, Quintino Reis, Guilherme Amorim Homem de Abreu Loureiro, Cid Edson Mendonça Póvoas, Douglas Steinmacher, Stephane Sacramento de Almeida, Dario Ahnert, and Virupax Chanabasappa Baligar. 2021. "Effect of Different Edaphic Crop Conditions on the Free Amino Acid Profile of PH-16 Dry Cacao Beans" Agronomy 11, no. 8: 1637. https://doi.org/10.3390/agronomy11081637