
Impact of Selected PSII Parameters on Barley DH Lines Biomass and Yield Elements


Abstract
:1. Introduction
2. Materials and Methods
2.1. Plant Material
2.2. Chlorophyll a Fluorescence
2.3. Selected Yield Components
2.4. Statistical Analysis
3. Results
3.1. Statistical Analysis
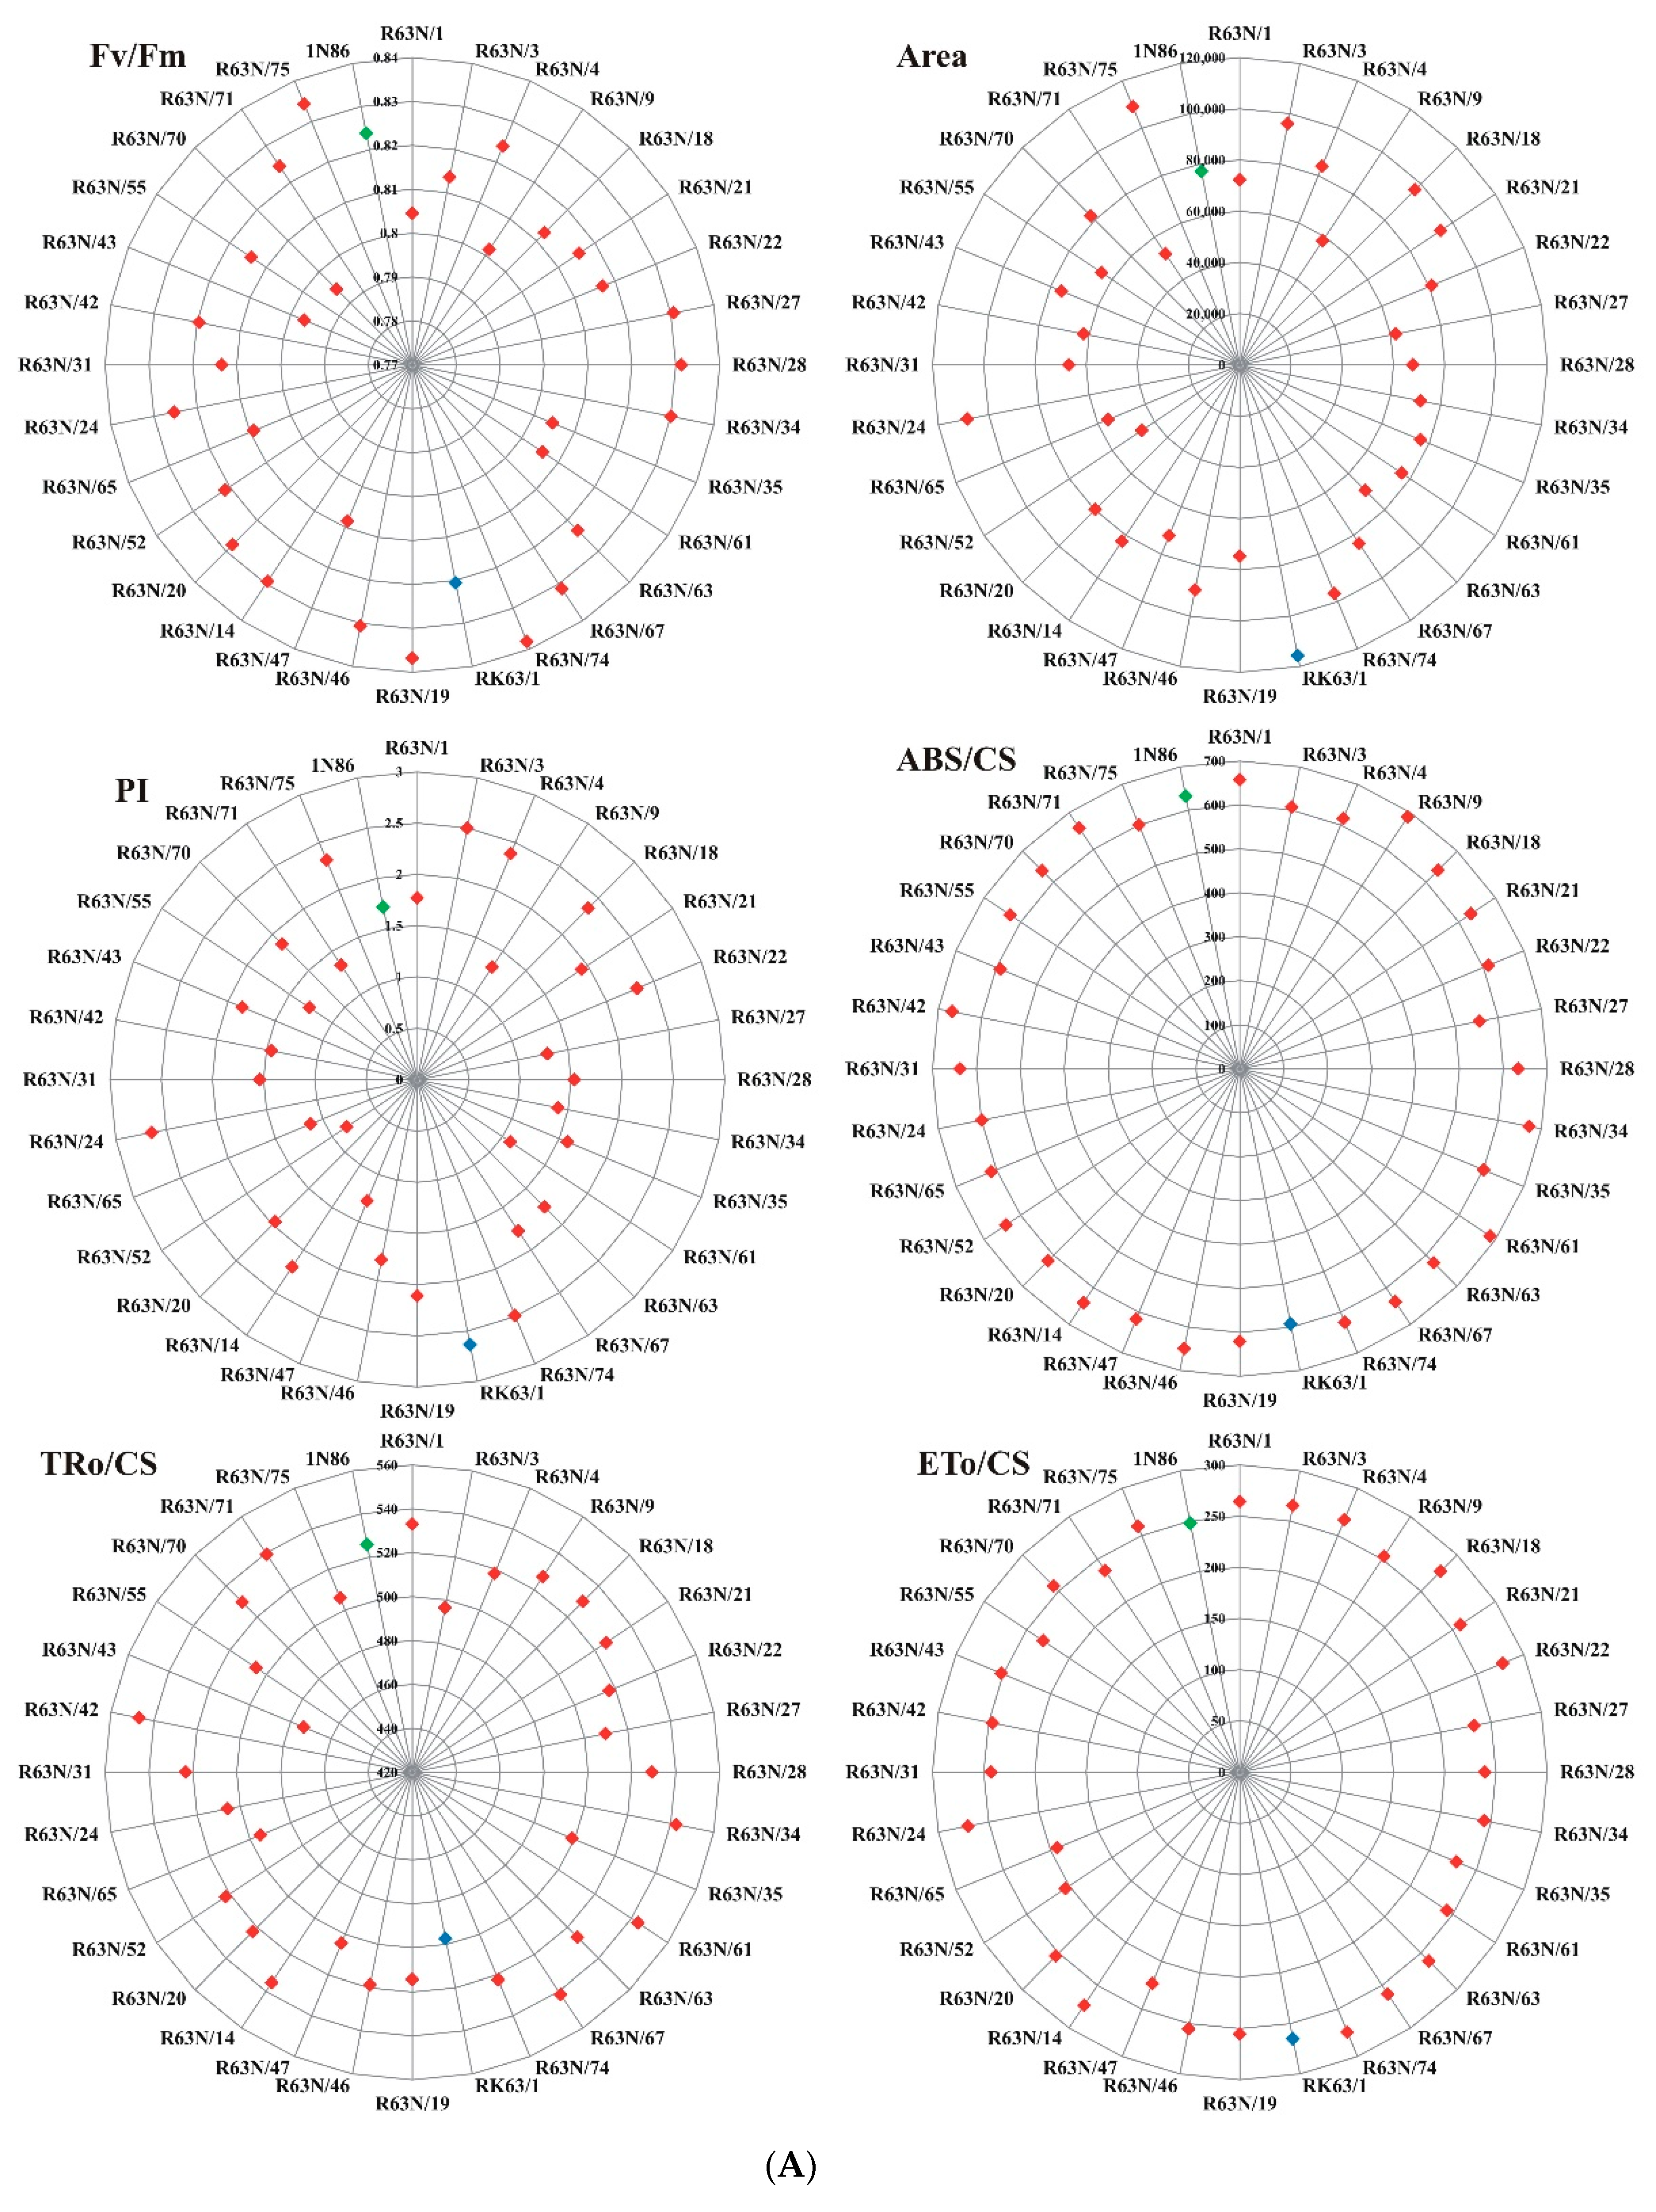
3.2. Chlorophyll a Fluorescence
3.3. Yield Components
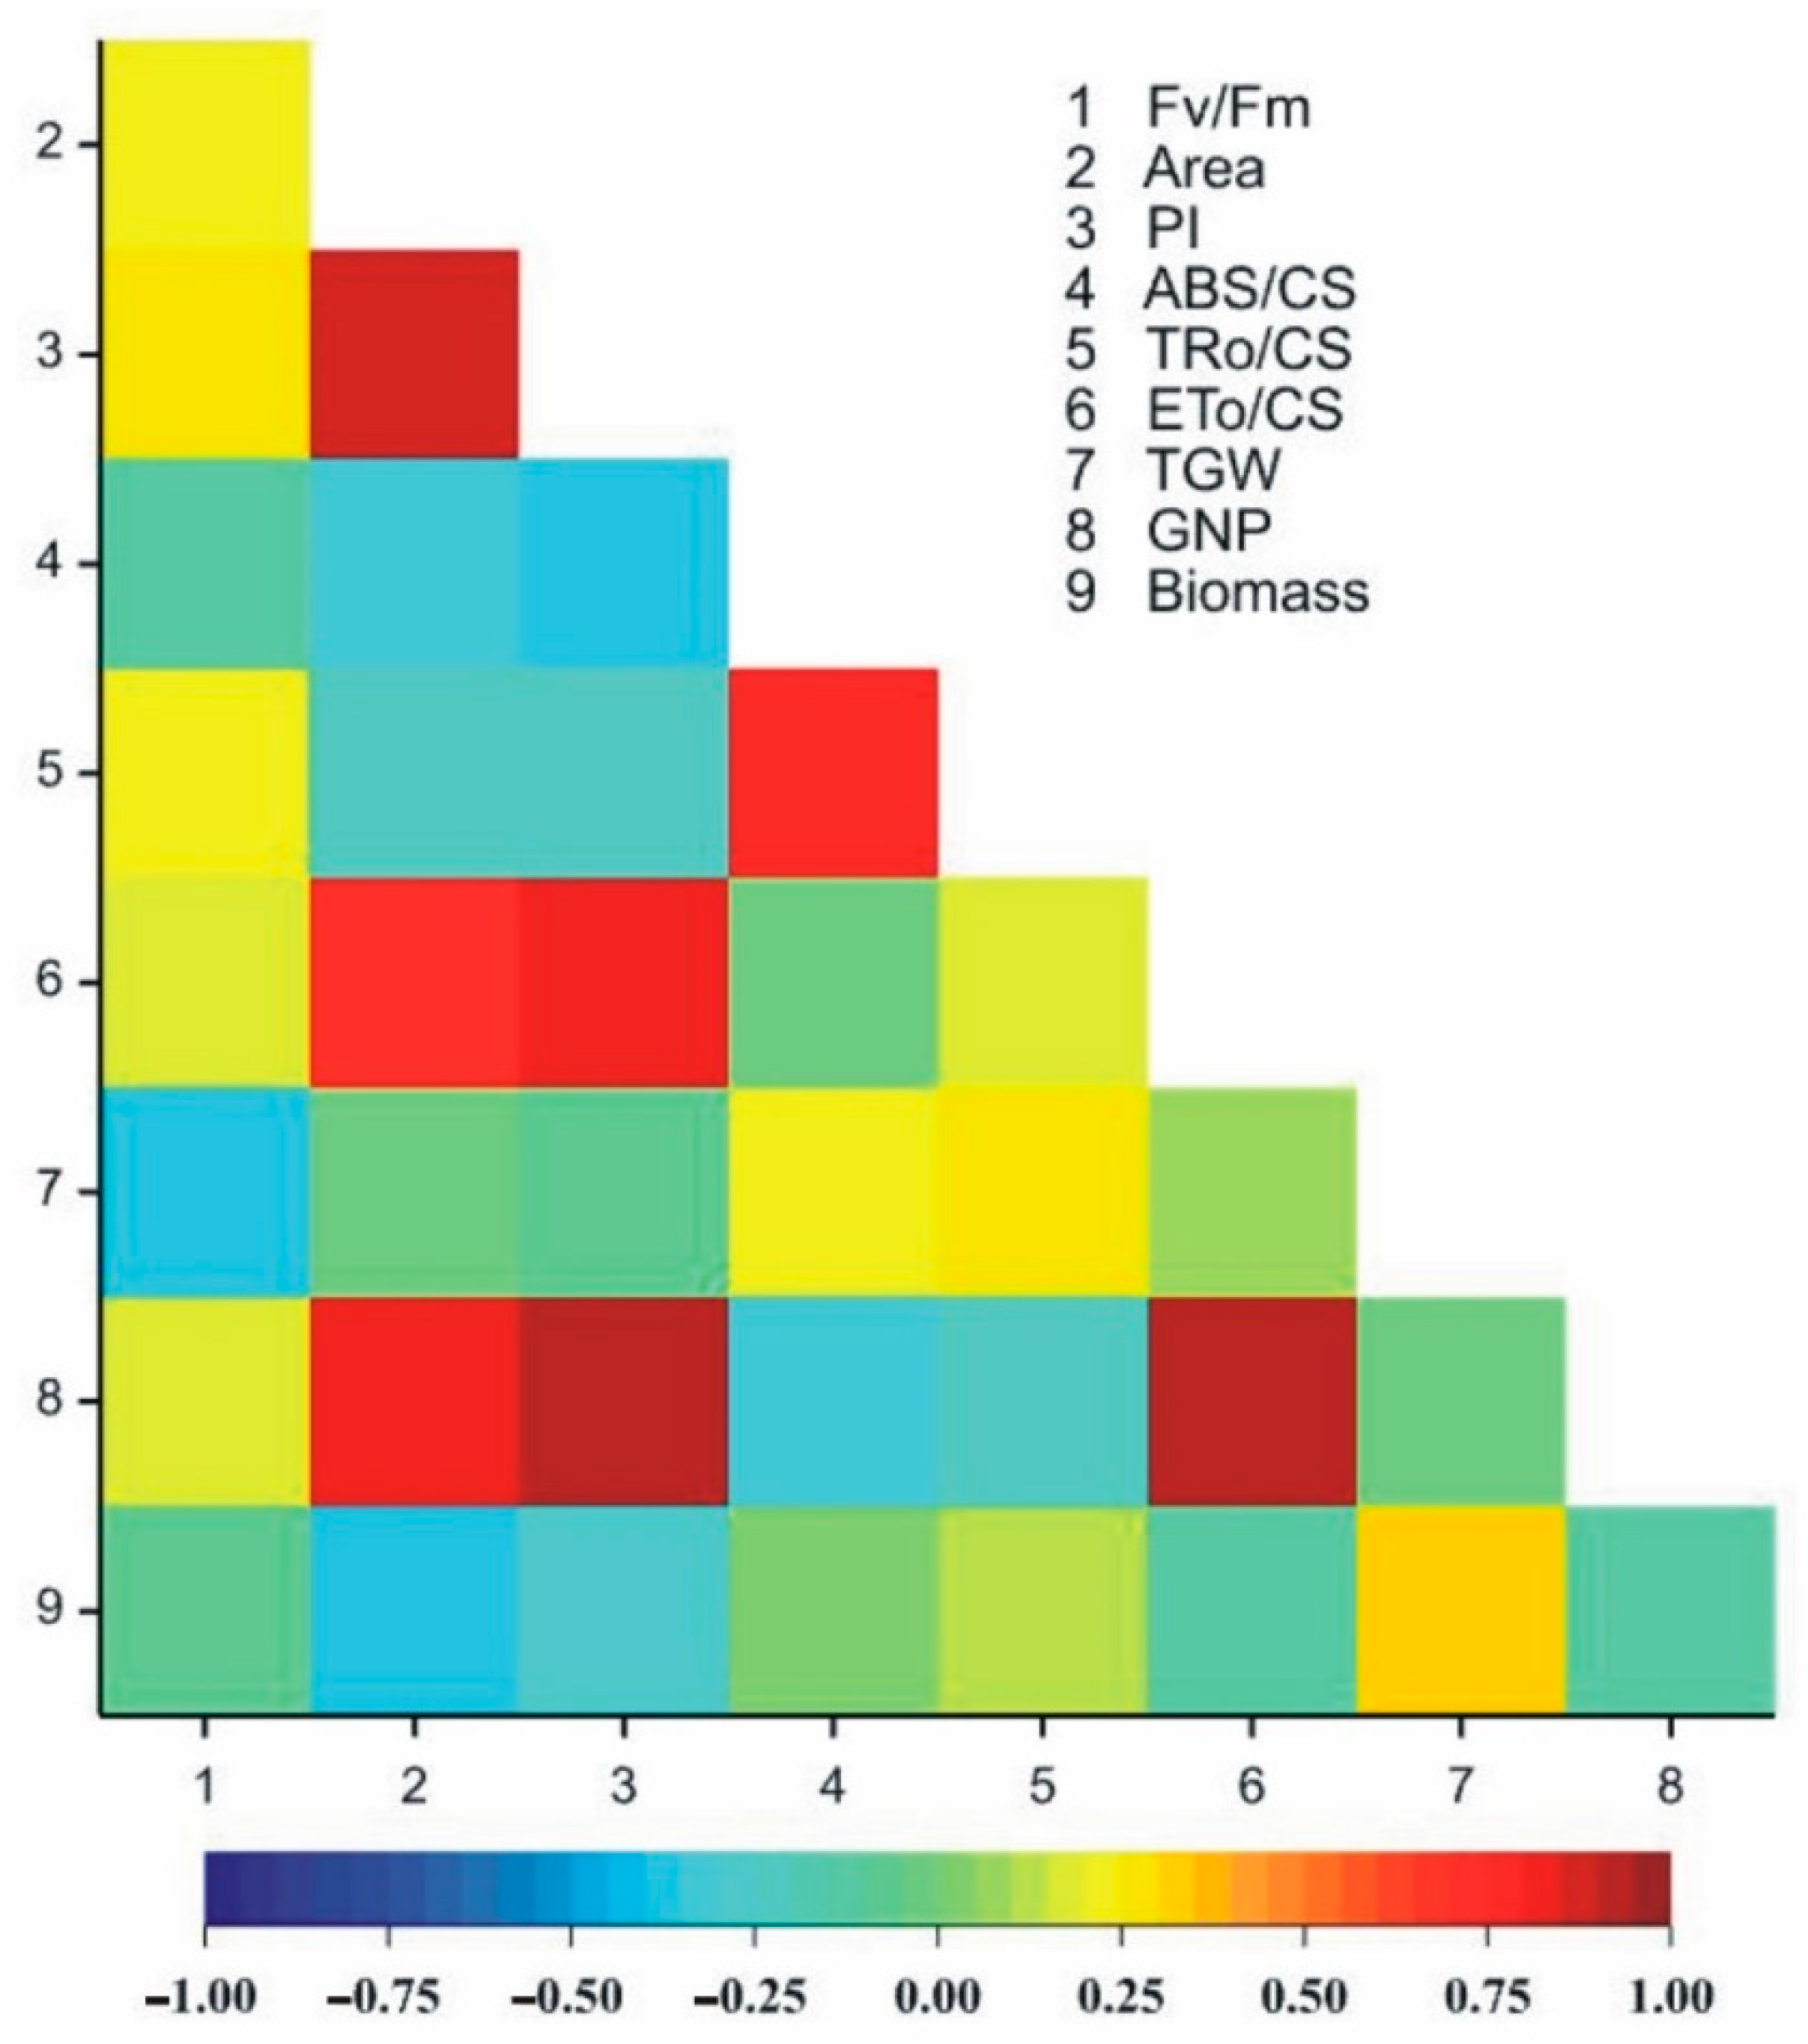
3.4. Correlation between Chlorophyll a Fluorescence Parameters and Yield Components
3.5. Prediction of the Heterosis Effect
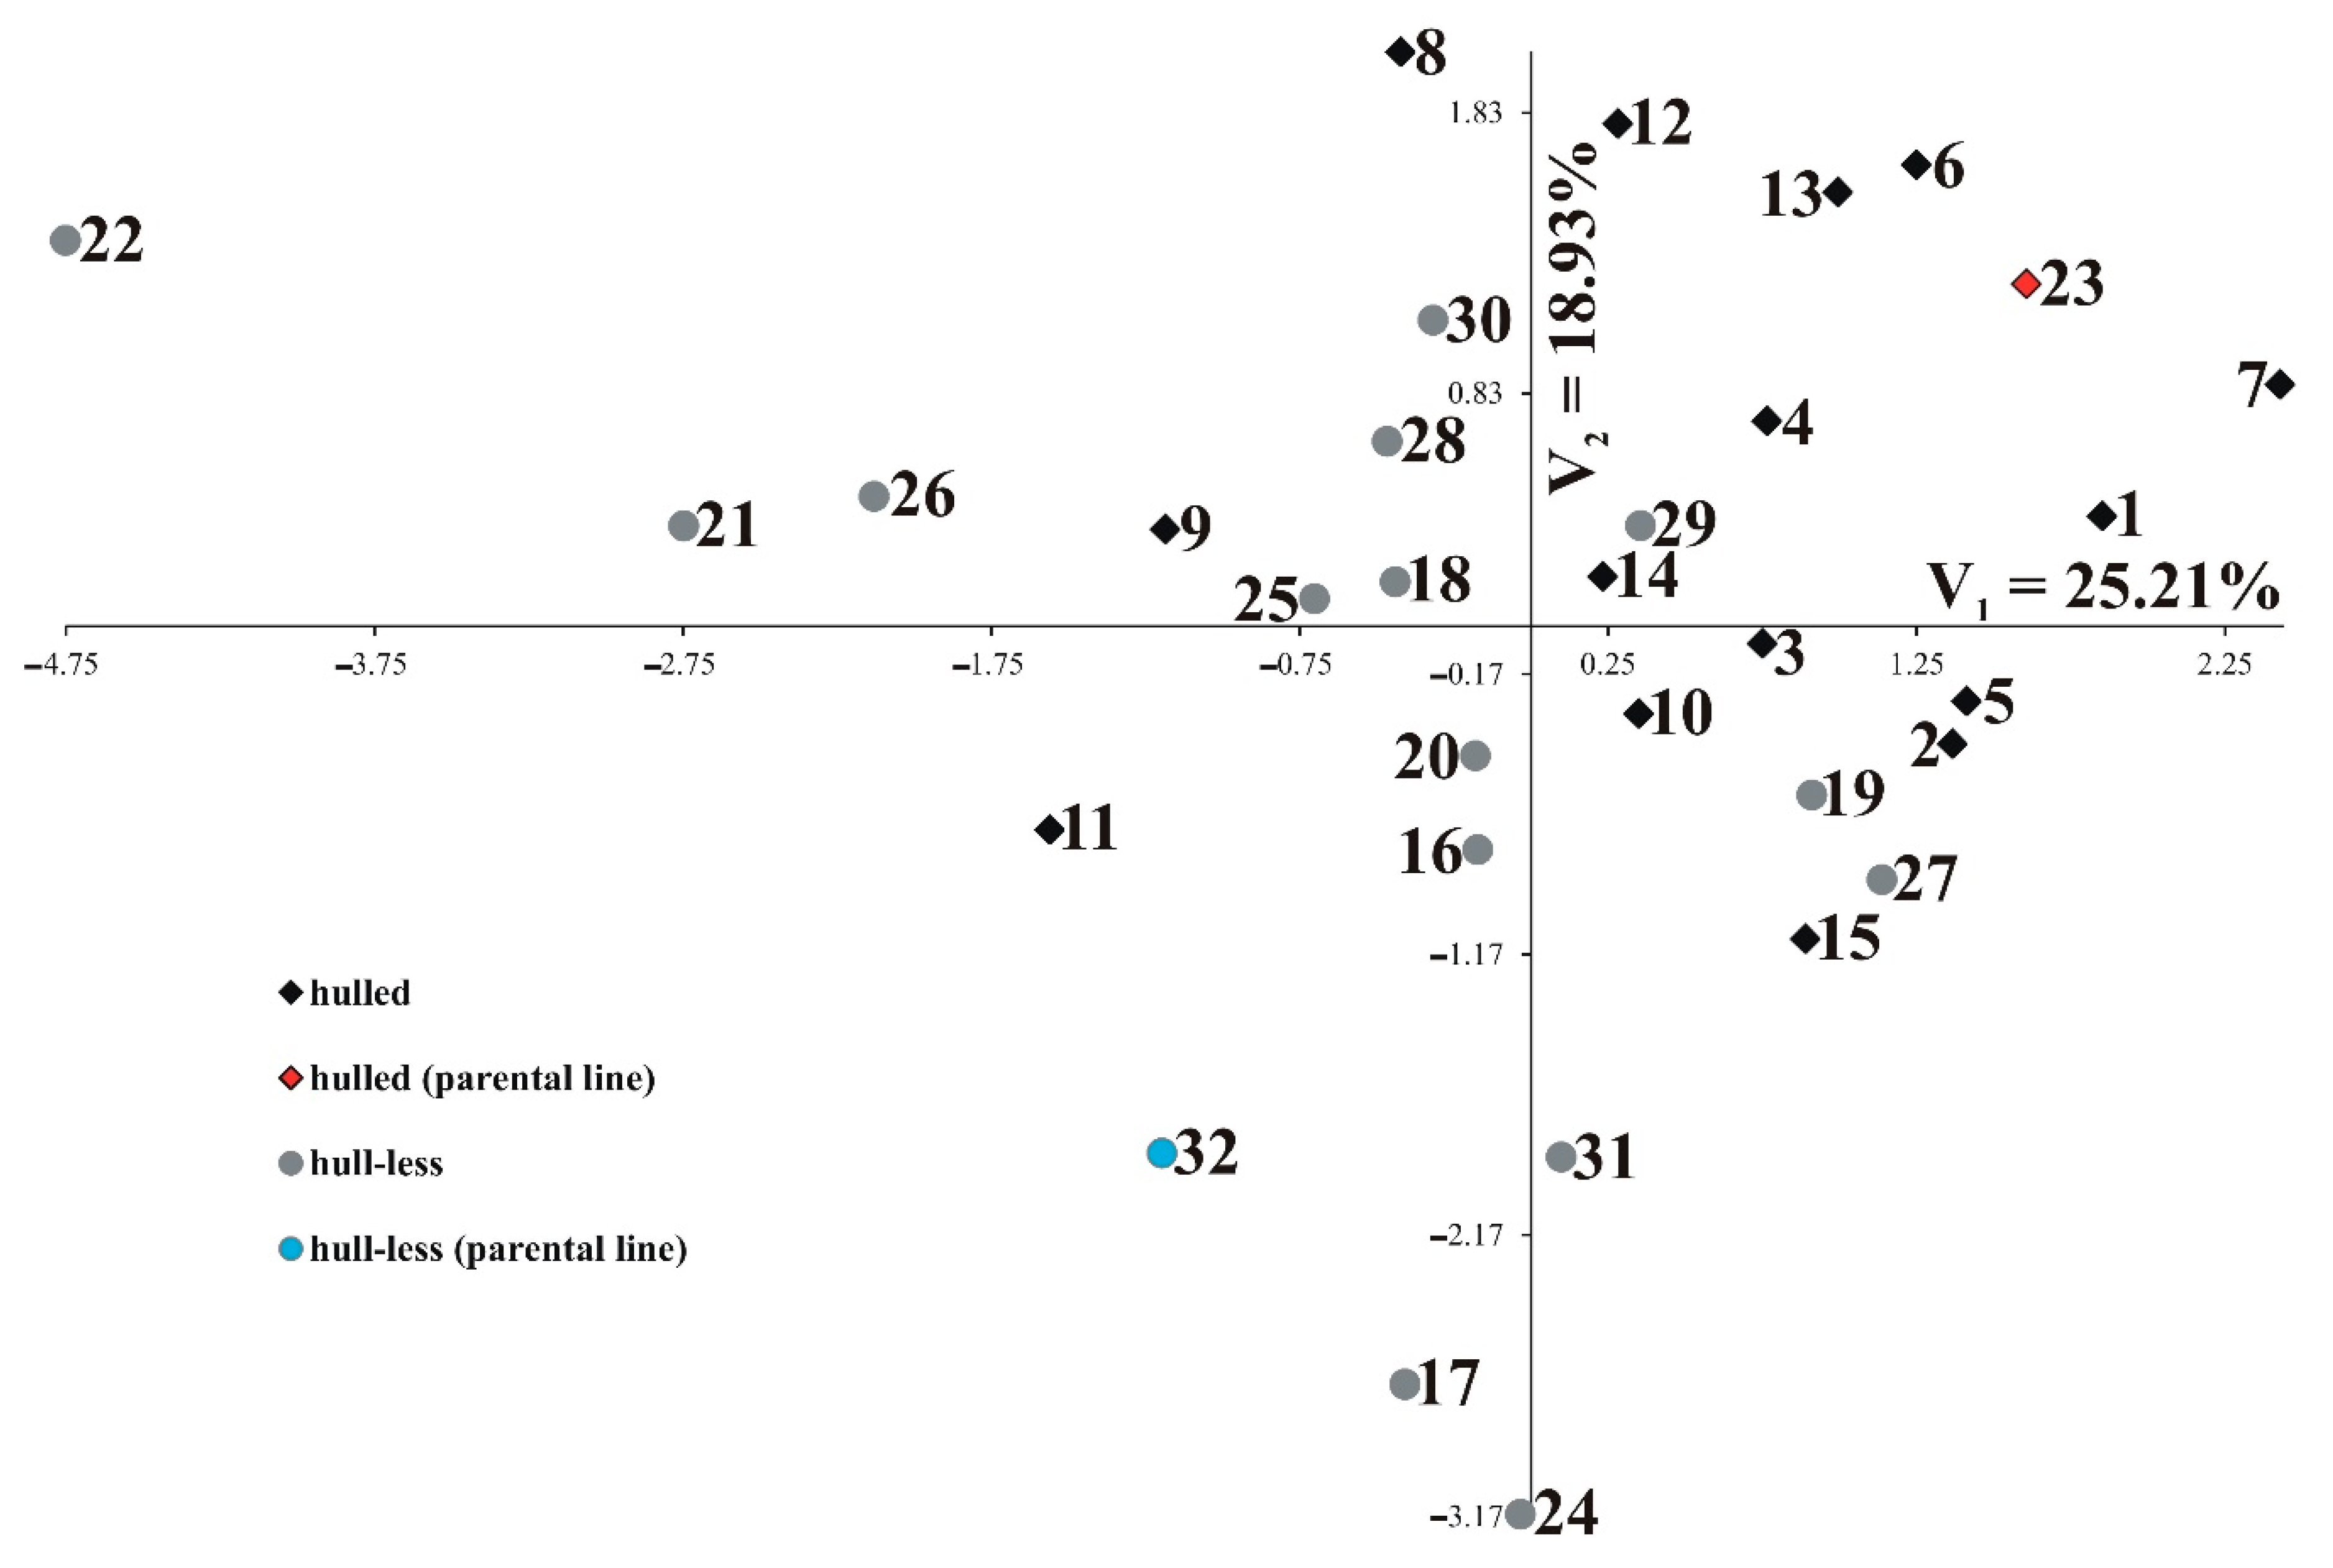
3.6. Canonical Variate Analysis
4. Discussion
Author Contributions
Funding
Institutional Review Board Statement
Informed Consent Statement
Data Availability Statement
Acknowledgments
Conflicts of Interest
References
- Worldwide Production of Grain in 2020/21, by Type. Available online: https://www.statista.com/statistics/263977/world-grain-production-by-type/ (accessed on 30 July 2020).
- MacGregor, A.; Bhatty, R. Barley: Chemistry and Technology; American Association of Cereal Chemists Inc.: Saint Paul, MN, USA, 1993. [Google Scholar]
- Chelkowski, J.; Kaptur, P.; Tomkowiak, M.; Kostecki, M.; Golinski, P.; Ponitka, A.; Slusarkiewicz-Jarzina, A.; Bocianowski, A. Moniliformin accumulation in kernels of triticale accessions inoculated with Fusarium avenaceum, in Poland. J. Phytopathol. 2000, 148, 433–439. [Google Scholar] [CrossRef]
- Eagles, H.A.; Bedggood, A.G.; Panozzo, J.F.; Martin, P.J. Cultivar and environmental effects on malting quality in barley. Aust. J. Agric. Res. 1995, 46, 831–844. [Google Scholar] [CrossRef]
- Kaczmarek, Z.; Adamski, T.; Surma, M.; Jezowski, S.; Lesniewska-Fratczak, M. Genotype-environment interaction of barley doubled haploids with regard to malting quality. Plant Breed. 1999, 118, 243–247. [Google Scholar] [CrossRef]
- Warzecha, T.; Adamski, T.; Kaczmarek, Z.; Surma, M.; Chelkowski, J.; Wisniewska, H.; Krystkowiak, K.; Kuczynska, A. Genotype-by-environment interaction of barley DH lines infected with Fusarium culmorum (W.G.Sm.) Sacc. Field Crop. Res. 2011, 120, 21–30. [Google Scholar] [CrossRef]
- Bocianowski, J.; Warzecha, T.; Nowosad, K.; Bathelt, R. Genotype by environment interaction using AMMI model and estimation of additive and epistasis gene effects for 1000-kernel weight in spring barley (Hordeum vulgare L.). J. Appl. Genet. 2019, 60, 127–135. [Google Scholar] [CrossRef] [Green Version]
- Tuvesson, S.; Dayteg, C.; Hagberg, P.; Manninen, O.; Tanhuanpaa, P.; Tenhola-Roininen, T.; Kiviharju, E.; Weyen, J.; Forster, J.; Schondelmaier, J. Molecular markers and doubled haploids in European plant breeding programmes. Euphytica 2007, 158, 305–312. [Google Scholar] [CrossRef]
- Havaux, M.; Bonfils, J.P.; Lutz, C.; Niyogi, K.K. Photodamage of the photosynthetic apparatus and its dependence on the leaf developmental stage in the npq1 Arabidopsis mutant deficient in the xanthophyll cycle enzyme violaxanthin de-epoxidase. Plant Physiol. 2000, 124, 273–284. [Google Scholar] [CrossRef] [PubMed] [Green Version]
- Warzecha, T.; Skrzypek, E.; Adamski, T.; Surma, M.; Kaczmarek, Z.; Sutkowska, A. Chlorophyll a fluorescence parameters of hulled and hull-less barley (Hordeum vulgare L.) DH lines inoculated with Fusarium culmorum. Plant Pathol. J. 2019, 35, 112–124. [Google Scholar] [CrossRef] [PubMed]
- Baker, N.R.; Rosenqvist, E. Applications of chlorophyll fluorescence can improve crop production strategies: An examination of future possibilities. J. Exp. Bot. 2004, 55, 1607–1621. [Google Scholar] [CrossRef] [PubMed] [Green Version]
- Oxborough, K.; Baker, N.R. Resolving chlorophyll a fluorescence images of photosynthetic efficiency into photochemical and non-photochemical components: Calculation of qP and Fv-/Fm-; without measuring Fo-. Photosynth. Res. 1997, 54, 135–142. [Google Scholar] [CrossRef]
- Zurek, G.; Rybka, K.; Pogrzeba, M.; Krzyzak, J.; Prokopiuk, K. Chlorophyll a fluorescence in evaluation of the effect of heavy metal soil contamination on perennial grasses. PLoS ONE 2014, 9, e91475. [Google Scholar] [CrossRef]
- Czyczylo-Mysza, I.; Tyrka, M.; Marcinska, I.; Skrzypek, E.; Karbarz, M.; Dziurka, M.; Hura, T.; Dziurka, K.; Quarrie, S.A. Quantitative trait loci for leaf chlorophyll fluorescence parameters, chlorophyll and carotenoid contents in relation to biomass and yield in bread wheat and their chromosome deletion bin assignments. Mol. Plant Breed. 2013, 32, 189–210. [Google Scholar] [CrossRef] [Green Version]
- Maxwell, K.; Johnson, G.N. Chlorophyll fluorescence: A practical guide. J. Exp. Bot. 2000, 51, 659–668. [Google Scholar] [CrossRef] [PubMed]
- Hura, K.; Hura, T.; Grzesiak, M. Function of the photosynthetic apparatus of oilseed winter rape under elicitation by Phoma lingam phytotoxins in relation to carotenoid and phenolic levels. Acta Physiol. Plant 2014, 36, 295–305. [Google Scholar] [CrossRef] [Green Version]
- Sayed, O.H. Chlorophyll fluorescence as a tool in cereal crop research. Photosynthetica 2003, 41, 321–330. [Google Scholar] [CrossRef]
- Warzecha, T.; Skrzypek, E.; Sutkowska, A. Effect of Fusarium culmorum infection on selected physiological and biochemical parameters of barley (Hordeum vulgare L.) DH lines. Physiol. Mol. Plant Pathol. 2015, 89, 62–69. [Google Scholar] [CrossRef]
- Gaines, R.L.; Bechtel, D.B.; Pomeranz, Y. A microscopic study on the development of a layer in barley that causes hull-caryopsis adherence. Cereal Chem. 1985, 62, 35–40. [Google Scholar]
- Baidoo, S.K.; Liu, Y.G. Hull-less barley for swine: Ileal and faecal digestibility of proximate nutrients, amino acids and non-starch polysaccharides. J. Sci. Food Agric. 1998, 76, 397–403. [Google Scholar] [CrossRef]
- Bhatty, R.S. The potential of hull-less barley—A review. Cereal Chem. 1986, 63, 97–103. [Google Scholar]
- Warzecha, T.; Adamski, T.; Kaczmarek, Z.; Surma, M.; Golinski, P.; Perkowski, J.; Chelkowski, J.; Wisniewska, H.; Krystkowiak, K.; Kuczynska, A. Susceptibility of hulled and hulless barley doubled haploids to Fusarium head blight. Cereal Res. Commun. 2010, 38, 220–232. [Google Scholar] [CrossRef]
- Bhatty, R.S. The potential of hull-less barley. Cereal Chem. 1999, 76, 589–599. [Google Scholar] [CrossRef]
- Wozniak, W.; Grundas, S.; Rybinski, W. Charakterystyki mechaniczne ziarna mutantów jęczmienia nieoplewionego. Acta Agrophys. 2006, 8, 1041–1047. [Google Scholar]
- Warzecha, T.; Zielinski, A.; Skrzypek, E.; Wojtowicz, T.; Mos, M. Effect of mechanical damage on vigor, physiological parameters, and susceptibility of oat (Avena sativa) to Fusarium culmorum infection. Phytoparasitica 2012, 40, 29–36. [Google Scholar] [CrossRef] [Green Version]
- Wisniewska, H.; Stepien, Ł.; Waskiewicz, A.; Beszterda, M.; Goral, T.; Belter, J. Toxigenic Fusarium species infecting wheat heads in Poland. Cent. Eur. J. Biol. 2014, 9, 163–172. [Google Scholar] [CrossRef]
- Noga, A.; Warchol, M.; Czyczylo-Mysza, I.; Marcinska, I.; Dziurka, K.; Warzecha, T.; Skrzypek, E. Chlorophyll a fluorescence parameters in the evaluation of oat DH lines yield components. Cereal Res. Commun. 2017, 45, 665–674. [Google Scholar] [CrossRef] [Green Version]
- Devaux, P.; Desprez, F. Yield of haploid production through the bulbosum method in a winter barley breeding programme. Cereal Res. Commun. 1986, 14, 273–279. [Google Scholar]
- Kasha, K.J.; Kao, K.N. High frequency haploid production in barley (Hordeum vulgare L.). Nature 1970, 225, 874–876. [Google Scholar] [CrossRef]
- Hoagland, D.; Arnon, D. A Water Culture Method for Growing Plants without Soil; California Agricultural Experiment Station: Berkely, CA, USA, 1938; Volume 347. [Google Scholar]
- Shapiro, S.S.; Wilk, M.B. An analysis of variance test for normality (complete samples). Biometrika 1965, 52, 591–611. [Google Scholar] [CrossRef]
- Seidler-Łozykowska, K.; Bocianowski, J. Evaluation of variability of morphological traits of selected caraway (Carum carvi L.) genotypes. Ind. Crop. Prod. 2012, 35, 140–145. [Google Scholar] [CrossRef]
- Bolhar-Nordenkampf, H.; Oquist, G. Chlorophyll fluorescence as a tool in photosynthesis research. In Photosynthesis and Production in a Changing Environment: A Field and Laboratory Manual; Hall, D., Scurlock, J., Bolhar-Nordenkampf, H., Leegood, R., Long, S., Eds.; Chapman and Hall: London, UK, 1993; pp. 193–206. [Google Scholar]
- Lopatynska, A.; Bocianowski, J.; Cyplik, A.; Wolko, J. Multidimensional analysis of diversity in DH lines and hybrids of winter oilseed rape (Brassica napus L.). Agronomy 2021, 11, 645. [Google Scholar] [CrossRef]
- Pan, R.Z.; Dong, Y.D. Plant Physiology; Higher Education Press: Beijing, China, 1995. [Google Scholar]
- Smillie, R.M.; Nott, R. Salt tolerance in crop plants monitored by chlorophyll fluorescence in vivo. Plant Physiol. 1982, 70, 1049–1054. [Google Scholar] [CrossRef] [Green Version]
- Pereira, W.E.; de Siqueira, D.L.; Martinez, C.A.; Puiatti, M. Gas exchange and chlorophyll fluorescence in four citrus rootstocks under aluminium stress. J. Plant Physiol. 2000, 157, 513–520. [Google Scholar] [CrossRef]
- Fracheboud, Y.; Leipner, J. The application of chlorophyll fluorescence to study light, temperature, and drought stress. In Practical Applications of Chlorophyll Fluorescence in Plant Biology; DeEll, J.R., Tiovonen, P.M.A., Eds.; Kluwer Academic Publishers: Boston, MA, USA, 2003; pp. 125–150. [Google Scholar]
- O’Neill, P.M.; Shanahan, J.E.; Schepers, J.S. Use of chlorophyll fluorescence assessments to differentiate corn hybrid response to variable water conditions. Crop. Sci. 2006, 46, 681–687. [Google Scholar] [CrossRef] [Green Version]
- Hura, T.; Hura, K.; Grzesiak, M.T. The usefulness of the chlorophyll fluorescence parameters in harvest prediction in 10 genotypes of winter triticale under optimal growth conditions. Plant Biosyst. 2009, 143, 496–503. [Google Scholar] [CrossRef]
- Falqueto, A.R.; Silva, F.S.P.; Cassol, D.; Magalhaes Junior, A.M.; Oliveira, A.C.; Bacarin, M.A. Chlorophyll fluorescence in rice: Probing of senescence driven changes of PSII activity on rice varieties differing in grain yield capacity. Braz. J. Plant Physiol. 2010, 22, 35–41. [Google Scholar] [CrossRef]
- Falqueto, A.R.; Cassol, D.; de Magalhaes Junior, A.M.; de Oliveira, A.C.; Bacarin, M.A. Physiological analysis of leaf senescence of two rice cultivars with different yield potential. Pesqui. Agropecu. Bras. 2009, 44, 695–700. [Google Scholar] [CrossRef]
- Planchon, C.; Sarrafi, A.; Ecochard, R. Chlorophyll fluorescence transient as a genetic marker of productivity in barley. Euphytica 1989, 42, 269–273. [Google Scholar] [CrossRef]
- Strasser, R.J.; Tsimilli-Michael, M.; Srivastava, A. Analysis of the chlorophyll a fluorescence transient. In Chlorophyll a Fluorescence; Papageorgiou, G.C., Govindjee, Eds.; Springer: Dordrecht, The Netherlands, 2004; pp. 321–362. [Google Scholar]
- Kalaji, M.; Guo, P. Chlorophyll fluorescence: A useful tool in barley plant breeding programs. In Photochemistry Research Progress; Sánchez, A., Gutierrez, S.J., Eds.; Nova Science Publishers: New York, NY, USA, 2008; Volume 29, pp. 439–463. [Google Scholar]
- Slapakauskas, V.; Ruzgas, V. Chlorophyll fluorescence characteristics of different winter wheat varieties (Triticum aestivum L.). Agron. Res. 2005, 3, 203–209. [Google Scholar]
- Zhang, K.; Fang, Z.; Liang, Y.; Tian, J. Genetic dissection of chlorophyll content at different growth stages in common wheat. J. Genet. 2009, 88, 183–189. [Google Scholar] [CrossRef]
- Jiang, H.; Wang, X.H.; Deng, Q.Y.; Yuan, L.P.; Xu, D.Q. Comparison of some photosynthetic characters between two hybrid rice combinations differing in yield potential. Photosynthetica 2002, 40, 133–137. [Google Scholar] [CrossRef]
- Shao, G.; Li, Z.; Ning, T.; Zheng, Y. Responses of photosynthesis, chlorophyll fluorescence, and grain yield of maize to controlled-release urea and irrigation after anthesis. J. Soil Sci. Plant Nutr. 2013, 176, 595–602. [Google Scholar] [CrossRef]
- Belkhodja, R.; Morales, F.; Abadia, A.; Gomezaparisi, J.; Abadia, J. Chlorophyll fluorescence as a possible tool for salinity tolerance screening in barley (Hordeum vulgare L.). Plant Physiol. 1994, 104, 667–673. [Google Scholar] [CrossRef] [PubMed] [Green Version]
- Herzog, H.; Olszewski, A. A rapid method for measuring freezing resistance in crop plants. J. Agron. Crop. Sci. 1998, 181, 71–79. [Google Scholar] [CrossRef]


| Type of Line | Genotype | No. | Fv/Fm | Area | PI | ABS/CS | TRo/CS | ETo/CS | TGW | GNP | Biomass | |||||||||
|---|---|---|---|---|---|---|---|---|---|---|---|---|---|---|---|---|---|---|---|---|
| Mean | s.d. | Mean | s.d. | Mean | s.d. | Mean | s.d. | Mean | s.d. | Mean | s.d. | Mean | s.d. | Mean | s.d. | Mean | s.d. | |||
| Hulled | R63N/1 | 1 | 0.805 | 0.030 | 72,200 | 27,819 | 1.769 | 1.100 | 657.4 | 17.0 | 533.0 | 11.7 | 264.2 | 19.1 | 51.16 | 2.03 | 497.5 | 40.56 | 23.10 | 1.28 |
| R63N/3 | 2 | 0.814 | 0.038 | 96,000 | 7624 | 2.499 | 0.369 | 606.4 | 9.3 | 496.4 | 16.1 | 265.4 | 5.8 | 48.36 | 1.99 | 534.9 | 12.05 | 20.00 | 2.46 | |
| R63N/4 | 3 | 0.824 | 0.021 | 83,933 | 22,268 | 2.382 | 0.336 | 616 | 12.1 | 517.9 | 6.0 | 266.7 | 7.7 | 49.24 | 2.61 | 515.1 | 20.62 | 18.98 | 2.46 | |
| R63N/9 | 4 | 0.802 | 0.072 | 58,267 | 30,877 | 1.315 | 1.088 | 688.4 | 60.6 | 527.1 | 32.0 | 253.5 | 28.7 | 51.03 | 4.03 | 467.5 | 47.98 | 22.98 | 2.22 | |
| R63N/18 | 5 | 0.813 | 0.030 | 96,733 | 4365 | 2.360 | 0.423 | 638.3 | 9.3 | 529.9 | 2.1 | 277.3 | 10.2 | 50.68 | 3.28 | 523.4 | 20.1 | 17.59 | 0.76 | |
| R63N/21 | 6 | 0.816 | 0.035 | 94,333 | 11,075 | 1.930 | 0.286 | 633.3 | 13.3 | 526.2 | 4.6 | 259.1 | 7.1 | 56.47 | 2.70 | 492.5 | 15.64 | 24.15 | 2.55 | |
| R63N/22 | 7 | 0.817 | 0.031 | 81,067 | 3646 | 2.322 | 0.637 | 612.6 | 19.7 | 517.1 | 18.5 | 277.7 | 7.2 | 52.41 | 0.96 | 537.2 | 10.4 | 23.61 | 6.47 | |
| R63N/27 | 8 | 0.831 | 0.022 | 62,067 | 30343 | 1.295 | 0.728 | 556.6 | 44.7 | 509.7 | 41.0 | 233.1 | 24.6 | 47.6 | 3.71 | 454.5 | 40.26 | 26.89 | 5.07 | |
| R63N/28 | 9 | 0.831 | 0.013 | 67,533 | 14589 | 1.532 | 0.088 | 634 | 25.0 | 529.2 | 25.0 | 239.3 | 14.1 | 41.84 | 7.90 | 452.1 | 11.44 | 26.27 | 2.85 | |
| R63N/34 | 10 | 0.830 | 0.033 | 72,000 | 28875 | 1.402 | 1.123 | 672.2 | 81.6 | 542.6 | 36.9 | 243.3 | 25.2 | 50.67 | 1.77 | 472.3 | 42.23 | 16.73 | 4.15 | |
| R63N/35 | 11 | 0.805 | 0.131 | 76,400 | 12817 | 1.587 | 0.409 | 601.3 | 17.2 | 498.8 | 13.5 | 229 | 16.3 | 41.63 | 2.60 | 459 | 24.29 | 17.82 | 5.49 | |
| R63N/61 | 12 | 0.806 | 0.027 | 76,067 | 13001 | 1.092 | 0.112 | 685.7 | 13.3 | 543.7 | 11.8 | 243.2 | 16.6 | 57.52 | 10.97 | 447.8 | 39.56 | 21.90 | 3.41 | |
| R63N/63 | 13 | 0.823 | 0.024 | 69,333 | 39461 | 1.757 | 1.416 | 624.7 | 22.8 | 526.4 | 19.9 | 261.1 | 33.8 | 50.57 | 4.54 | 492.2 | 57.82 | 26.54 | 4.73 | |
| R63N/67 | 14 | 0.831 | 0.018 | 83,867 | 13299 | 1.775 | 0.882 | 637.7 | 26.9 | 541.7 | 31.4 | 260.2 | 25.2 | 51.62 | 2.74 | 481.8 | 58.82 | 15.17 | 5.75 | |
| R63N/74 | 15 | 0.838 | 0.014 | 96,600 | 10173 | 2.491 | 0.338 | 625.2 | 20.3 | 522.3 | 13.6 | 274.4 | 3.6 | 43.1 | 3.60 | 525.5 | 7.94 | 19.99 | 4.88 | |
| RK63/1 (parental line) | 23 | 0.821 | 0.027 | 115,733 | 8075 | 2.636 | 0.616 | 592.3 | 22.2 | 497.3 | 22.2 | 264.9 | 24.5 | 54.13 | 6.92 | 532.2 | 33.52 | 25.89 | 3.53 | |
| Hull-Less | R63N/19 | 16 | 0.837 | 0.012 | 74,667 | 1419 | 2.110 | 0.573 | 620.6 | 6.8 | 514.4 | 4.1 | 255.5 | 12.6 | 42.97 | 2.32 | 496.8 | 27.36 | 19.32 | 1.81 |
| R63N/46 | 17 | 0.831 | 0.021 | 89,533 | 24730 | 1.793 | 0.780 | 649.3 | 13.0 | 518.6 | 16.9 | 255.2 | 18.5 | 34 | 8.79 | 492.8 | 46.15 | 16.96 | 4.13 | |
| R63N/47 | 18 | 0.809 | 0.027 | 72,133 | 18036 | 1.280 | 0.416 | 617 | 14.1 | 504.4 | 13.3 | 223.1 | 27.5 | 49 | 3.28 | 458.8 | 16.75 | 18.74 | 3.32 | |
| R63N/14 | 19 | 0.829 | 0.016 | 82,800 | 15096 | 2.198 | 0.526 | 640.7 | 31.0 | 535.2 | 16.4 | 273.3 | 10.4 | 46.3 | 8.54 | 511.1 | 25.83 | 18.72 | 0.89 | |
| R63N/20 | 20 | 0.828 | 0.031 | 79,800 | 13101 | 1.961 | 0.332 | 617.7 | 13.1 | 522.8 | 11.0 | 254 | 13.0 | 43.26 | 2.64 | 485.7 | 21.27 | 20.86 | 2.69 | |
| R63N/52 | 21 | 0.821 | 0.056 | 46,000 | 16975 | 0.828 | 0.663 | 640.3 | 81.3 | 522.2 | 34.2 | 204.6 | 16.6 | 38.36 | 5.68 | 419.8 | 46.12 | 27.45 | 6.46 | |
| R63N/65 | 22 | 0.809 | 0.041 | 55,667 | 15531 | 1.128 | 0.568 | 612.3 | 25.0 | 494.9 | 14.0 | 192.9 | 10.1 | 49.94 | 6.97 | 389.9 | 26.65 | 16.42 | 5.90 | |
| R63N/24 | 24 | 0.825 | 0.019 | 108,467 | 1332 | 2.643 | 0.309 | 599 | 12.5 | 505.8 | 3.7 | 270.4 | 2.9 | 32.07 | 8.99 | 534.5 | 6.87 | 16.38 | 2.00 | |
| R63N/31 | 25 | 0.813 | 0.068 | 66,733 | 16928 | 1.538 | 0.397 | 637 | 19.9 | 523.2 | 16.8 | 242.6 | 30.0 | 44.84 | 4.56 | 462.7 | 43.17 | 21.64 | 6.25 | |
| R63N/42 | 26 | 0.820 | 0.035 | 62,200 | 35807 | 1.451 | 0.402 | 667.7 | 21.9 | 546.8 | 18.0 | 246 | 17.6 | 46.92 | 8.55 | 432.9 | 15.96 | 17.98 | 2.13 | |
| R63N/43 | 27 | 0.797 | 0.056 | 75,333 | 36436 | 1.849 | 1.298 | 590 | 17.5 | 473.6 | 35.6 | 251.9 | 26.0 | 43.65 | 4.46 | 514.6 | 45.36 | 18.21 | 1.49 | |
| R63N/55 | 28 | 0.814 | 0.035 | 64,867 | 4291 | 1.265 | 0.140 | 628.7 | 26.3 | 505.6 | 12.0 | 230.7 | 10.3 | 48.14 | 3.07 | 456.2 | 10.22 | 22.08 | 4.00 | |
| R63N/70 | 29 | 0.794 | 0.078 | 82,267 | 9659 | 1.866 | 0.460 | 636.3 | 7.4 | 529.5 | 10.1 | 257 | 20.9 | 49.96 | 1.79 | 485.1 | 33.66 | 20.15 | 2.59 | |
| R63N/71 | 30 | 0.824 | 0.024 | 52,133 | 9758 | 1.337 | 0.530 | 658.3 | 14.2 | 539.3 | 4.4 | 236.7 | 24.8 | 48.73 | 3.33 | 454.9 | 16.21 | 26.18 | 1.34 | |
| R63N/75 | 31 | 0.834 | 0.018 | 109,067 | 8401 | 2.315 | 0.496 | 600.3 | 8.6 | 505.9 | 8.5 | 259.7 | 14.6 | 43.25 | 2.40 | 513.4 | 29.43 | 12.14 | 3.89 | |
| 1N86 (parental line) | 32 | 0.824 | 0.024 | 77,067 | 9843 | 1.713 | 0.373 | 632.3 | 31.3 | 525.8 | 15.9 | 247.8 | 4.8 | 38.56 | 1.04 | 471.6 | 20.12 | 14.01 | 2.20 | |
| LSD0.05 | 0.0264 | 31,295.7 | 1.0719 | 49 | 32.34 | 30.31 | 8.281 | 52.43 | 6.2 | |||||||||||
| F-statistics (p-value) | 1.86 (0.003) | 2.25 (0.003) | 1.68 (0.04) | 2.68 (<0.001) | 2.17 (0.005) | 3.4 (<0.001) | 4.04 (<0.001) | 3.77 (<0.001) | 3.35 (<0.001) | |||||||||||
| CV (%) | 7.24 | 36.92 | 47.49 | 7.71 | 5.63 | 13.95 | 21.80 | 13.18 | 34.01 | |||||||||||
| Trait | Fv/Fm | Area | PI | ABS/CS | TRo/CS | ETo/CS | TGW | GNP |
|---|---|---|---|---|---|---|---|---|
| Area | 0.205 | |||||||
| PI | 0.268 | 0.865 *** | ||||||
| ABS/CS | −0.144 | −0.34 | −0.392 * | |||||
| TRo/CS | 0.235 | −0.232 | −0.229 | 0.766 *** | ||||
| ETo/CS | 0.196 | 0.702 *** | 0.835 *** | −0.006 | 0.173 | |||
| TGW | −0.357 * | −0.048 | −0.096 | 0.239 | 0.251 | 0.095 | ||
| GNP | 0.166 | 0.804 *** | 0.919 *** | −0.301 | −0.2 | 0.903 *** | −0.02 | |
| Biomass | −0.078 | −0.375 * | −0.262 | 0.019 | 0.113 | −0.132 | 0.303 | −0.15 |
| Line | Fv/Fm | Area | PI | ABS/CS | TRo/CS | ETo/CS | TGW | GNP | Biomass |
|---|---|---|---|---|---|---|---|---|---|
| R63N/1 | 0.001 | −24,200 | −0.41 | 45 * | 21 | 8 | 4.8 | −4 | 3.1 |
| R63N/3 | −0.008 | −400 | 0.33 | −6 | −15 | 9 | 2 | 33 | 0 |
| R63N/4 | 0.005 | −12,467 | 0.21 | 4 | 6 | 10 | 2.9 | 13 | −1 |
| R63N/9 | −0.038 | −38,133 ** | −0.86 | 76 *** | 16 | −3 | 4.7 | −34 | 3 |
| R63N/18 | −0.006 | 333 | 0.19 | 26 | 18 | 21 | 4.3 | 21 | −2.4 |
| R63N/21 | −0.005 | −2067 | −0.24 | 21 | 15 | 3 | 10.1 ** | −9 | 4.2 |
| R63N/22 | −0.019 | −15,333 | 0.15 | 0 | 6 | 21 | 6.1 | 35 | 3.7 |
| R63N/27 | −0.014 | −34,333 * | −0.88 | −56 * | −2 | −23 | 1.2 | −47 * | 6.9 * |
| R63N/28 | −0.001 | −28,867 * | −0.64 | 22 | 18 | −17 | −4.5 | −50 * | 6.3 * |
| R63N/34 | −0.02 | −24,400 | −0.77 | 60 ** | 31 * | −13 | 4.3 | −30 | −3.2 |
| R63N/35 | −0.006 | −20,000 | −0.59 | −11 | −13 | −27 * | −4.7 | −43 | −2.1 |
| R63N/61 | −0.043 * | −20,333 | −1.08* | 73 *** | 32 * | −13 | 11.2 ** | −54 * | 1.9 |
| R63N/63 | −0.03 | −27,067 * | −0.42 | 12 | 15 | 5 | 4.2 | −10 | 6.6 * |
| R63N/67 | −0.01 | −12,533 | −0.4 | 25 | 30 * | 4 | 5.3 | −20 | −4.8 |
| R63N/74 | 0.008 | 200 | 0.32 | 13 | 11 | 18 | −3.2 | 24 | 0 |
| R63N/19 | 0.001 | −21,733 | −0.06 | 8 | 3 | −1 | −3.4 | −5 | −0.6 |
| R63N/46 | −0.02 | −6867 | −0.38 | 37 | 7 | −1 | −12.3 *** | −9 | −3 |
| R63N/47 | −0.018 | −24,267 | −0.89 | 5 | −7 | −33 * | 2.6 | −43 | −1.2 |
| R63N/14 | 0 | −13,600 | 0.02 | 28 | 24 | 17 | 0 | 9 | −1.2 |
| R63N/20 | 0.01 | −16,600 | −0.21 | 5 | 11 | −2 | −3.1 | −16 | 0.9 |
| R63N/52 | −0.051 ** | −50,400 *** | −1.35 ** | 28 | 11 | −52 *** | −8 * | −82 *** | 7.5 ** |
| R63N/65 | −0.027 | −40,733 ** | −1.05 * | 0 | −17 | −63 *** | 3.6 | −112 *** | −3.5 |
| R63N/24 | 0.009 | 12,067 | 0.47 | −13 | −6 | 14 | −14.3 *** | 33 | −3.6 |
| R63N/31 | −0.015 | −29,667 * | −0.64 | 25 | 12 | −14 | −1.5 | −39 | 1.7 |
| R63N/42 | −0.017 | −34,200 * | −0.72 | 55 * | 35 * | −10 | 0.6 | −69 ** | −2 |
| R63N/43 | −0.034 | −21,067 | −0.33 | −22 | −38 ** | −4 | −2.7 | 13 | −1.7 |
| R63N/55 | −0.031 | −31,533 * | −0.91 | 16 | −6 | −26 | 1.8 | −46 * | 2.1 |
| R63N/70 | −0.004 | −14,133 | −0.31 | 24 | 18 | 1 | 3.6 | −17 | 0.2 |
| R63N/71 | −0.016 | −44,267 ** | −0.84 | 46 * | 28 | −20 | 2.4 | −47 * | 6.2 * |
| R63N/75 | 0.007 | 12,667 | 0.14 | −12 | −6 | 3 | −3.1 | 12 | −7.8 ** |
| Trait | First Canonical Variate, V1 | Second Canonical Variate, V2 |
|---|---|---|
| Fv/Fm | −0.042 | −0.298 |
| Area | 0.541 ** | −0.458 ** |
| PI | 0.616 *** | −0.450 ** |
| ABS/CS | −0.012 | 0.12 |
| TRo/CS | 0.063 | 0.206 |
| ETo/CS | 0.846 *** | −0.303 |
| TGW | 0.375 * | 0.800 *** |
| GNP | 0.839 *** | −0.411 * |
| Biomass | 0.151 | 0.683 *** |
| Percentage variation | 25.21 | 18.93 |
| Line | 1 | 2 | 3 | 4 | 5 | 6 | 7 | 8 | 9 | 10 | 11 | 12 | 13 | 14 | 15 | 16 | |
|---|---|---|---|---|---|---|---|---|---|---|---|---|---|---|---|---|---|
| R63N/1 | 1 | ||||||||||||||||
| R63N/3 | 2 | 4.119 | |||||||||||||||
| R63N/4 | 3 | 3.281 | 1.891 | ||||||||||||||
| R63N/9 | 4 | 2.79 | 4.402 | 3.548 | |||||||||||||
| R63N/18 | 5 | 3.641 | 2.286 | 1.595 | 3.692 | ||||||||||||
| R63N/21 | 6 | 3.132 | 3.235 | 2.832 | 3.868 | 2.825 | |||||||||||
| R63N/22 | 7 | 4.05 | 2.399 | 2.425 | 4.388 | 2.593 | 3.385 | ||||||||||
| R63N/27 | 8 | 5.537 | 5.093 | 4.572 | 6.388 | 5.404 | 4.306 | 4.753 | |||||||||
| R63N/28 | 9 | 3.6 | 4.936 | 3.991 | 4.043 | 4.867 | 4.07 | 5.431 | 4.449 | ||||||||
| R63N/34 | 10 | 3.613 | 3.397 | 2.731 | 4.103 | 2.6 | 3.414 | 4.106 | 5.649 | 4.606 | |||||||
| R63N/35 | 11 | 4.557 | 3.548 | 3.063 | 4.775 | 3.923 | 3.971 | 4.972 | 4.261 | 3.16 | 3.58 | ||||||
| R63N/61 | 12 | 4.05 | 4.2 | 3.529 | 3.419 | 3.017 | 2.404 | 4.299 | 5.527 | 4.724 | 3.074 | 4.449 | |||||
| R63N/63 | 13 | 3.745 | 3.128 | 2.452 | 3.646 | 2.914 | 2.836 | 2.022 | 3.7 | 4.027 | 4.052 | 4.218 | 3.476 | ||||
| R63N/67 | 14 | 4.419 | 3.636 | 2.492 | 4.459 | 1.954 | 3.261 | 3.772 | 4.981 | 4.976 | 2.528 | 3.73 | 2.824 | 3.489 | |||
| R63N/74 | 15 | 2.922 | 2.452 | 1.801 | 3.563 | 2.217 | 3.218 | 3.333 | 5.044 | 3.357 | 3.085 | 3.026 | 4.07 | 3.144 | 3.322 | ||
| R63N/19 | 16 | 3.275 | 2.698 | 1.625 | 3.417 | 2.774 | 3.666 | 3.599 | 4.726 | 2.983 | 3.063 | 2.303 | 4.187 | 3.105 | 3.362 | 1.532 | |
| R63N/46 | 17 | 4.489 | 4.008 | 3.757 | 4.443 | 3.848 | 5.022 | 5.307 | 6.335 | 3.956 | 3.804 | 3.176 | 5.074 | 4.9 | 4.406 | 2.491 | 2.734 |
| R63N/47 | 18 | 4.229 | 3.038 | 2.989 | 4.926 | 3.602 | 3.179 | 4.329 | 4.182 | 4.148 | 2.608 | 2.183 | 3.812 | 4.032 | 3.445 | 3.446 | 3.08 |
| R63N/14 | 19 | 2.786 | 2.872 | 1.472 | 3.054 | 1.668 | 3.228 | 3.025 | 5.121 | 3.726 | 2.654 | 3.472 | 3.536 | 2.784 | 2.518 | 1.39 | 1.719 |
| R63N/20 | 20 | 2.79 | 3.5 | 2.425 | 3.731 | 3.311 | 3.219 | 4.198 | 4.146 | 2.009 | 3.288 | 2.226 | 4.129 | 3.37 | 3.542 | 1.788 | 1.594 |
| R63N/52 | 21 | 6.192 | 5.224 | 4.977 | 5.957 | 5.826 | 5.665 | 5.947 | 4.946 | 3.913 | 5.071 | 3.76 | 5.672 | 4.77 | 5.732 | 4.963 | 4.177 |
| R63N/65 | 22 | 8.203 | 6.648 | 6.126 | 7.164 | 6.728 | 6.724 | 7.697 | 6.775 | 6.48 | 6.453 | 4.828 | 6.026 | 6.705 | 5.932 | 6.973 | 5.974 |
| RK63/1 | 23 | 4.694 | 2.75 | 3.575 | 5.428 | 3.778 | 2.434 | 3.58 | 4.608 | 5.122 | 4.681 | 4.408 | 4.297 | 3.668 | 4.671 | 3.846 | 4.373 |
| R63N/24 | 24 | 5.219 | 3.652 | 3.751 | 5.684 | 4.046 | 5.318 | 5.114 | 5.986 | 4.598 | 4.486 | 3.296 | 5.982 | 5.066 | 4.719 | 2.598 | 3.001 |
| R63N/31 | 25 | 3.118 | 3.38 | 2.229 | 3.018 | 3.099 | 3.16 | 3.989 | 4.242 | 2.106 | 3.038 | 2.141 | 3.401 | 2.836 | 3.224 | 2.167 | 1.402 |
| R63N/42 | 26 | 5.264 | 5.658 | 4.21 | 3.882 | 4.427 | 5.033 | 5.922 | 6.232 | 4.177 | 4.681 | 4.28 | 3.975 | 4.63 | 3.824 | 4.49 | 3.864 |
| R63N/43 | 27 | 4.707 | 2.041 | 2.861 | 4.683 | 3.368 | 4.422 | 3.072 | 5.155 | 5.371 | 4.307 | 3.714 | 5.107 | 3.648 | 4.324 | 3.29 | 3.096 |
| R63N/55 | 28 | 3.512 | 2.742 | 2.275 | 3.369 | 3.082 | 2.684 | 3.605 | 3.919 | 3.092 | 2.994 | 2.089 | 3.06 | 2.68 | 3.279 | 2.754 | 2.134 |
| R63N/70 | 29 | 2.687 | 2.84 | 1.569 | 3.094 | 1.944 | 1.997 | 3.287 | 4.309 | 3.165 | 2.362 | 2.748 | 2.54 | 2.574 | 2.178 | 1.912 | 1.992 |
| R63N/71 | 30 | 2.837 | 4.111 | 3.09 | 3.303 | 4.009 | 3.404 | 4.189 | 4.458 | 2.307 | 3.331 | 3.56 | 3.803 | 3.054 | 4.233 | 3.184 | 2.621 |
| R63N/75 | 31 | 5.107 | 3.041 | 3.082 | 5.585 | 2.926 | 4.165 | 4.647 | 5.545 | 5.253 | 3.249 | 2.868 | 4.607 | 4.822 | 2.974 | 3.031 | 3.324 |
| 1N86 | 32 | 4.444 | 4.091 | 3.085 | 4.468 | 3.462 | 4.675 | 5.139 | 5.501 | 3.691 | 3.149 | 2.295 | 4.565 | 4.558 | 3.174 | 2.664 | 2.191 |
| 1 | 2 | 3 | 4 | 5 | 6 | 7 | 8 | 9 | 10 | 11 | 12 | 13 | 14 | 15 | 16 | ||
| 17 | 18 | 19 | 20 | 21 | 22 | 23 | 24 | 25 | 26 | 27 | 28 | 29 | 30 | 31 | |||
| R63N/47 | 18 | 4.182 | |||||||||||||||
| R63N/14 | 19 | 3.107 | 3.685 | ||||||||||||||
| R63N/20 | 20 | 3.01 | 3.004 | 2.2 | |||||||||||||
| R63N/52 | 21 | 4.838 | 4.27 | 5.254 | 4.389 | ||||||||||||
| R63N/65 | 22 | 7.031 | 5.524 | 6.841 | 6.404 | 5.375 | |||||||||||
| RK63/1 | 23 | 5.568 | 3.604 | 4.453 | 4.261 | 5.822 | 7.109 | ||||||||||
| R63N/24 | 24 | 1.993 | 4.308 | 3.557 | 3.334 | 5.116 | 7.331 | 5.185 | |||||||||
| R63N/31 | 25 | 3.064 | 2.917 | 2.128 | 1.374 | 3.733 | 5.534 | 4.353 | 3.779 | ||||||||
| R63N/42 | 26 | 4.729 | 5.334 | 3.819 | 4.073 | 5.436 | 4.973 | 6.608 | 5.742 | 3.186 | |||||||
| R63N/43 | 27 | 4.12 | 3.597 | 3.538 | 3.997 | 5.523 | 6.909 | 4.138 | 3.844 | 3.791 | 6.004 | ||||||
| R63N/55 | 28 | 3.705 | 2.022 | 2.834 | 2.332 | 3.756 | 5.192 | 3.517 | 4.214 | 1.541 | 4.071 | 3.088 | |||||
| R63N/70 | 29 | 3.548 | 2.68 | 1.585 | 1.801 | 4.829 | 6.008 | 3.596 | 4.041 | 1.583 | 3.622 | 3.709 | 1.856 | ||||
| R63N/71 | 30 | 4.359 | 3.482 | 3.041 | 2.399 | 3.727 | 6.429 | 4.687 | 5.049 | 1.938 | 4.273 | 4.796 | 2.49 | 2.558 | |||
| R63N/75 | 31 | 3.338 | 2.949 | 3.389 | 3.55 | 5.73 | 6.255 | 4.321 | 2.89 | 3.779 | 5.357 | 3.575 | 3.593 | 3.186 | 5.158 | ||
| 1N86 | 32 | 2.147 | 3.512 | 2.628 | 2.424 | 4.647 | 5.816 | 5.648 | 2.822 | 2.382 | 3.544 | 4.228 | 3.219 | 2.814 | 3.906 | 2.81 | |
| 17 | 18 | 19 | 20 | 21 | 22 | 23 | 24 | 25 | 26 | 27 | 28 | 29 | 30 | 31 | |||
Publisher’s Note: MDPI stays neutral with regard to jurisdictional claims in published maps and institutional affiliations. |
© 2021 by the authors. Licensee MDPI, Basel, Switzerland. This article is an open access article distributed under the terms and conditions of the Creative Commons Attribution (CC BY) license (https://creativecommons.org/licenses/by/4.0/).
Share and Cite
Warzecha, T.; Skrzypek, E.; Bocianowski, J.; Sutkowska, A. Impact of Selected PSII Parameters on Barley DH Lines Biomass and Yield Elements. Agronomy 2021, 11, 1705. https://doi.org/10.3390/agronomy11091705
Warzecha T, Skrzypek E, Bocianowski J, Sutkowska A. Impact of Selected PSII Parameters on Barley DH Lines Biomass and Yield Elements. Agronomy. 2021; 11(9):1705. https://doi.org/10.3390/agronomy11091705
Chicago/Turabian StyleWarzecha, Tomasz, Edyta Skrzypek, Jan Bocianowski, and Agnieszka Sutkowska. 2021. "Impact of Selected PSII Parameters on Barley DH Lines Biomass and Yield Elements" Agronomy 11, no. 9: 1705. https://doi.org/10.3390/agronomy11091705