1. Introduction
The majority of potato grown in Canada (~66%; [
1]) and the United States (~70%; [
2]) is destined for the processing market (French fry and chips). For processing size and shape of tubers are important traits that determine marketability of the harvested crop [
3,
4,
5]. Acceptable ranges for these traits depends on the destination market and specific requirements of processors, quick service restaurants and retailers. Potato breeders have rough guidelines when screening germplasm and progeny from crosses [
4]. Tubers that fall within ideal shape parameters for a given market class result in higher product output at the processing plant. Generally tubers destined for the French fry market are longer, with a length/width (L/W) ratio >1.8, while those destined for chipping are round or oval. Many of these observations are captured as observational, categorical or ordinal ranked index data. Aside from absolute tuber length or roundness an important trait is tuber shape uniformity.
Tuber shape is a combination of genetic and environmental effects. Tuber shape has a relatively high heritability and is generally a stable trait between generations, year to year [
6,
7,
8]. Negative early generation selection for tuber shape is possible due to high repeatability of this trait between generations [
9]. Quantitative trait loci (QTLs) associated with tuber shape have been identified, with loci on chromosome II [
10,
11], chromosome V [
12], chromosome X [
12,
13] and chromosome XII [
14]. Fixing shape traits within breeding parents will facilitate more rapid integration of novel traits such as disease resistance and traits linked to climate resiliency. However, tuber shape is not always a clearly defined trait. Tuber shape is sometimes defined as the L/W ratio, which can be measured and quantified (ex. L/W > 1.5 as elongated and ~1 as round); or classified using a subjective estimation (ex. a 1–4 scale 1 round, 2 oval, 3 long oval and 4 very long oval; as seen in [
11,
13]). Other developmental traits can also fall under tuber shape, such as tuber chains, secondary growths and cracking. While these traits contribute to tuber shape in terms of whether the tuber is marketable or ideal for a given market, they are potentially influenced by different physiological and environmental processes during tuber development. This makes the identification of markers for breeding and selection difficult. There is little quantitative, objective data on size and shape of populations at the individual tuber level that could be used to train selection models. While tuber L/W ratio is relatively easy parameter to measure that gives a quantitative number; it is labor intensive to perform manually. Digital imaging has been successfully used for L/W characterization of mangos [
15] and potatoes [
16,
17]; while in other fruits and vegetables roundness has also been assessed [
18,
19]. Methods to rapidly measure tuber shape at the individual tuber level could be used to generate a tuber shape phenotype dataset, which can then be integrated into a selection model. Such a dataset would assist in parental improvement and a rapid tuber shape phenotyping protocol would assist in screening progeny for different processing market classes. Particularly if these phenotyping protocols can be used to tease apart genetically controlled tuber shape (i.e., L/W ratio) versus abiotic and biotic stress induced tuber malformations.
The goal of the current study was to characterize phenotypic variance of tuber shape traits within a population of potato plants. We used true potato seed (TPS) generated by the Potato Breeding program located at the Lethbridge Research and Development Center, Agriculture and Agri-Food Canada. The parents used in these crosses includes French fry, chip and fresh market (primarily red skinned) varieties. Images of harvested tubers were captured using an off-the shelf RGB camera and shape parameters were measured using an image processing pipeline. Randomly selected images of tubers were used to create a survey for potato growers and agronomists to categorize the tubers based on their suitability for the chip and French fry markets. Based on the survey results we determined quantitative values for tubers of excellent shape and those with unacceptable shape. Tubers from plants grown in the greenhouse were planted in the field and field harvested tubers were also phenotyped for shape. We developed a model based on performance in the greenhouse to predict which clones produced tubers of appropriate shape for processing market classes and also identified parents that produced a higher proportion of progeny suited for chipping or French fry markets.
2. Materials and Methods
2.1. Crossing Protocol
Mature tubers (after 4–6 months storage) were planted into a growth cabinet with day/night temperature of 20 °C/14–16 °C and a day/night cycle of 16 h/8 h. One tuber/pot was planted into 2 gallon black pots filled with Cornell Mix. There were 2–3 pots planted per variety. Open flowers were picked and anthers removed. The anthers were dried in a 30 °C incubator for 4–6 h and then left at room temperature (RT) overnight. Anthers were stored in a labelled vial with a cork stopper at −20 °C. As flowers of female plants opened they were pollenated by touching a pollen covered cork to the pistol. Each flower in a cluster was pollinated with the pollen of the desired male and each cluster was identified with a tag. Seed balls clusters were bagged to prevent mixing. Crosses used in the current study are listed in
Table S1.
Mature seed balls were sliced in half using a scalpel then squeezed over a paper towel surface to separate seeds from the fruit flesh and skin. The seeds were scraped into a petri dish which were left uncovered overnight at RT to dry. Dried seeds were rolled in a piece of rubber tubing to break up lumps and carefully placed into labelled envelopes. The packaged seeds were placed into 4 °C for long term storage.
2.2. Seed Planting in the Greenhouse
True potato seed (TPS) was hydrated and treated with 1500 ppm gibberellic acid overnight. GA treated TPS was then surface sterilized by submersion in 10% bleach, followed by 70% ethanol and distilled water washes. Sterilized TPS was placed onto a 1% agar plate and allowed to germinate for up to seven days. As soon as evidence of germination was observed the seed was transferred into segmented foam cells (Rootcubes, Oasis Grower Solutions), with one seed per cell. Seedlings were grown in a growth cabinet for three weeks on the foam trays and subsequently transferred to black form 98 cell trays and allowed to grow for three additional weeks with a day/night cycle of 14:10 and a constant 21 °C. Seedlings were then transplanted into 4 inch pots containing Cornell mix and placed into greenhouses with a day/night cycle of 16:8 and a constant 21 °C. Plants were allowed to grow in the greenhouse for approximately 4–5 months until they entered senescence and tubers were developed.
2.3. Growing Plants in Field
The four largest tubers from each cultivar harvested from the greenhouse were planted in a field trial conducted at the AAFC Vauxhall Research Station (Vauxhall, AB, Canada; 50.005°, −112.134°); located in the Bow River Irrigation District of southern Alberta, on an irrigated Orthic Brown Chernozemic sandy loam. The site has a 30 year (1991–2020) mean precipitation of 301.6mm, a mean low daily temperature of −1.4 °C and a mean high daily temperature of 12.4 °C. During the 2020 growing season (late April to early September) the site had a mean low daily temperature of 7.9 °C, a minimum daily temperature of −3.5 °C, a mean high daily temperature of 23.2 °C, a maximum daily temperature of 35.7 °C and a cumulative precipitation of 271.2 mm.
Tuber seed was spaced 12″ with a 10′ space between lines. Rows were spaced 1 m center to center with a gap row between cultivars. Seed tubers were planted in late April-early May 2020 and allowed to grow until early September when tubers were harvested.
2.4. Image Acquisition
Potatoes from the greenhouse and the field were gently washed to remove clumps of dirt, allowed to dry and laid out a blue background along with a color card and an identification tag that was placed within a 3D printed tray positioned in the upper left corner of the image area. Images were acquired with a tripod mounted Canon EOS Rebel T7i. The camera setting was kept constant at F-stop 1/16, exposure time 0.8 s and ISO 100. Focal length was 50 cm. Each image was 6000 × 4000 pixels. A light box with fluorescent and LED lights positioned on the side and above the tubers was used to provide more even illumination and eliminate shadows.
2.5. Image Processing
Artifacts in images (dirt, attached stolons and roots, sloughed skin, sprouts, shadows, etc.) were masked in the images as needed using GIMP 2.8.10. All image processing was conducted using ImageJ software and the workflow created was automated in a macro that could be run over many images without user intervention. Based on the observations involving the Red and Blue digital number (
DN) values of the tubers and background, a gray scale image was created that highlighted the potatoes where:
The gray scale image (Igray) was converted to a binary image using the make binary routine in ImageJ, which is based on an unsupervised classification (isoclus). The tubers were identified as class 1 and the background as class 0. The binary image was subjected to the morphological operator (erode function) to mask attached stolons, bag threads and soil artifacts.
Image scale was derived using the color card (5.1 cm × 7.5 cm) positioned in the upper left hand corner. The image was segmented such that the first 550 columns of pixels and the maximum number of rows (4000) were selected to isolate the area of the image containing the card. The “Analyze Particles” routine was run in ImageJ to obtain the size of the card in pixels. These values were then use to set the image scale. The pixels sizes were approximately 0.005 × 0.005 cm
Analyze particles was run a second time excluding the first 550 columns (pixels) along the entire height of the image to remove the color card segment and the label for the tubers. The “Analyze Particles” routine was rerun and the results saved to an Excel file. The batch processing allowed the workflow to be run automatically on as many images as were present in the folder selected. The “Analyze Particles” routine directly provides information on tuber area, perimeter, width and height (based on a bounding rectangle), major and minor axis (based on best fitting ellipse) circularity (4π*area/perimeter2) and aspect ratio (major axis/minor axis). Statistics were calculated using R. Linear models were used to model and predict field grown tuber shape parameters using data collected from greenhouse grown tubers. Tuber shape parameters from greenhouse grown tubers used to build models for field grown tubers include the relevant parameter (AR or circularity) and the standard deviation for each progeny, cross and parent. The R package regsubsets (exhaustive search method) and a k-fold cross-validation approach was used to select the best model for AR and circularity.
2.6. Tuber Shape Survey
To determine the ideal shape parameters for potato tubers destined for different market classes we surveyed potato growers, industry agronomists and breeding researchers located primarily in Alberta, but also included a respondent from New Brunswick. Each participant was given a set of 30–40 randomly selected tuber images and was asked to rank them as (1) Excellent, (2) Acceptable, and (3) Not Acceptable. Excellent tubers are defined as the ideal shape for the given market classification. Acceptable are defined as marketable but not ideal, some shape defects. Not Acceptable are defined as not marketable, below industry standards and/or contains severe shape defects.
4. Discussion
Tuber shape is an important agronomic trait for potato with different acceptable ranges depending on the processing market class. Length to width ratio is a commonly used measurement to assess quality and suitability for new varieties destined for the processing industry. The use of machine vision and other camera systems to measure tuber shape has been previously demonstrated [
17,
20,
21]. In the current study our goal was to employ an imaging system using off-the shelf, inexpensive electronics that could easily integrate into an existing breeding program to accomplish three objectives: (1) provide quantitative data to support selection decisions; (2) evaluate usefulness of early selection by predicting progeny performance; (3) provide a method to identify parents that produce a high proportion of progeny with good tuber shape for a given processing market.
In comparison to other studies that have looked at using imaging based systems to characterize tuber shape our solution has some benefits and some deficiencies. Our setup is very similar to that described in [
17] with some important differences. We used a light box to ensure even light diffusion and a blue background which allows for more reliable tuber segmentation, particularly for red skinned tubers. In our pipeline we calculated two tuber shape parameters: AR and circularity, as a way to screen potential new varieties for suitability in different market classes. This allowed us to screen out knobby or otherwise misshapen tubers which is not possible when only calculating L/W ratios [
17,
22]. Our tuber imaging platform calculates a two-dimensional shape for tubers and does not flag flattened tubers, which are not desirable. Three-dimensional tuber imaging platforms have been developed that use multiple cameras at different angles [
20] or a rotating platform [
23]. 3D tuber imaging platforms generate much more detailed shape data compared to our platform and can be used to perform eye counts and calculate eye depth, which are important tuber traits. However, only one tuber can be imaged at a time and in the case of the rotating platform design [
20] it can take nearly a minute to complete a single imaging run. This severely decreases the throughput. Our tuber imaging platform is a compromise between throughput, tuber shape detail and equipment cost. Ultimately the choice of which platform to use depends on the question being asked and it is likely that different platforms will be needed in a breeding/agronomy program. Higher throughput is needed at earlier generations when the number of varieties being evaluated is high, while lower throughput but more detailed data is required for advanced selections and agronomy trials.
Using a DSLR camera we were able to capture images of tubers harvested from both greenhouse and field grown plants. During initial testing we used a flat black background for imaging but found that the image processing pipeline sometimes had trouble segmenting out red or purple skinned tubers. This problem was solved using a blue background (a layer of blue painters tape or a blue colored heavy cardstock). Using a light box provided even illumination that eliminated most shadows that otherwise would affect the shape calculation.
While the focus of the current study was on characterizing the shape of tubers we were able to estimate and predict tuber weight with a high degree of accuracy (
Figure 1). This is in agreement with other studies [
20,
24,
25] showing area in an image is a good indicator of tuber mass. In our study we calibrated the dimensions measured in relation to a standard color card used by photographers for color correction that we placed in the upper left corner of the image. So long as the same card is used for the entire batch of images the size of the tubers can be reliably estimated. Having an object in the image of a known dimension allowed us to run multiple cameras at a time and allow for quick correction on the occasion that the camera was moved inadvertently or when we needed to tear down and move the setup to another location. Information on the 3D printed card holder can be found in
File S1. While we did not examine skin color in the current study our intent is to return to the dataset to evaluate this trait.
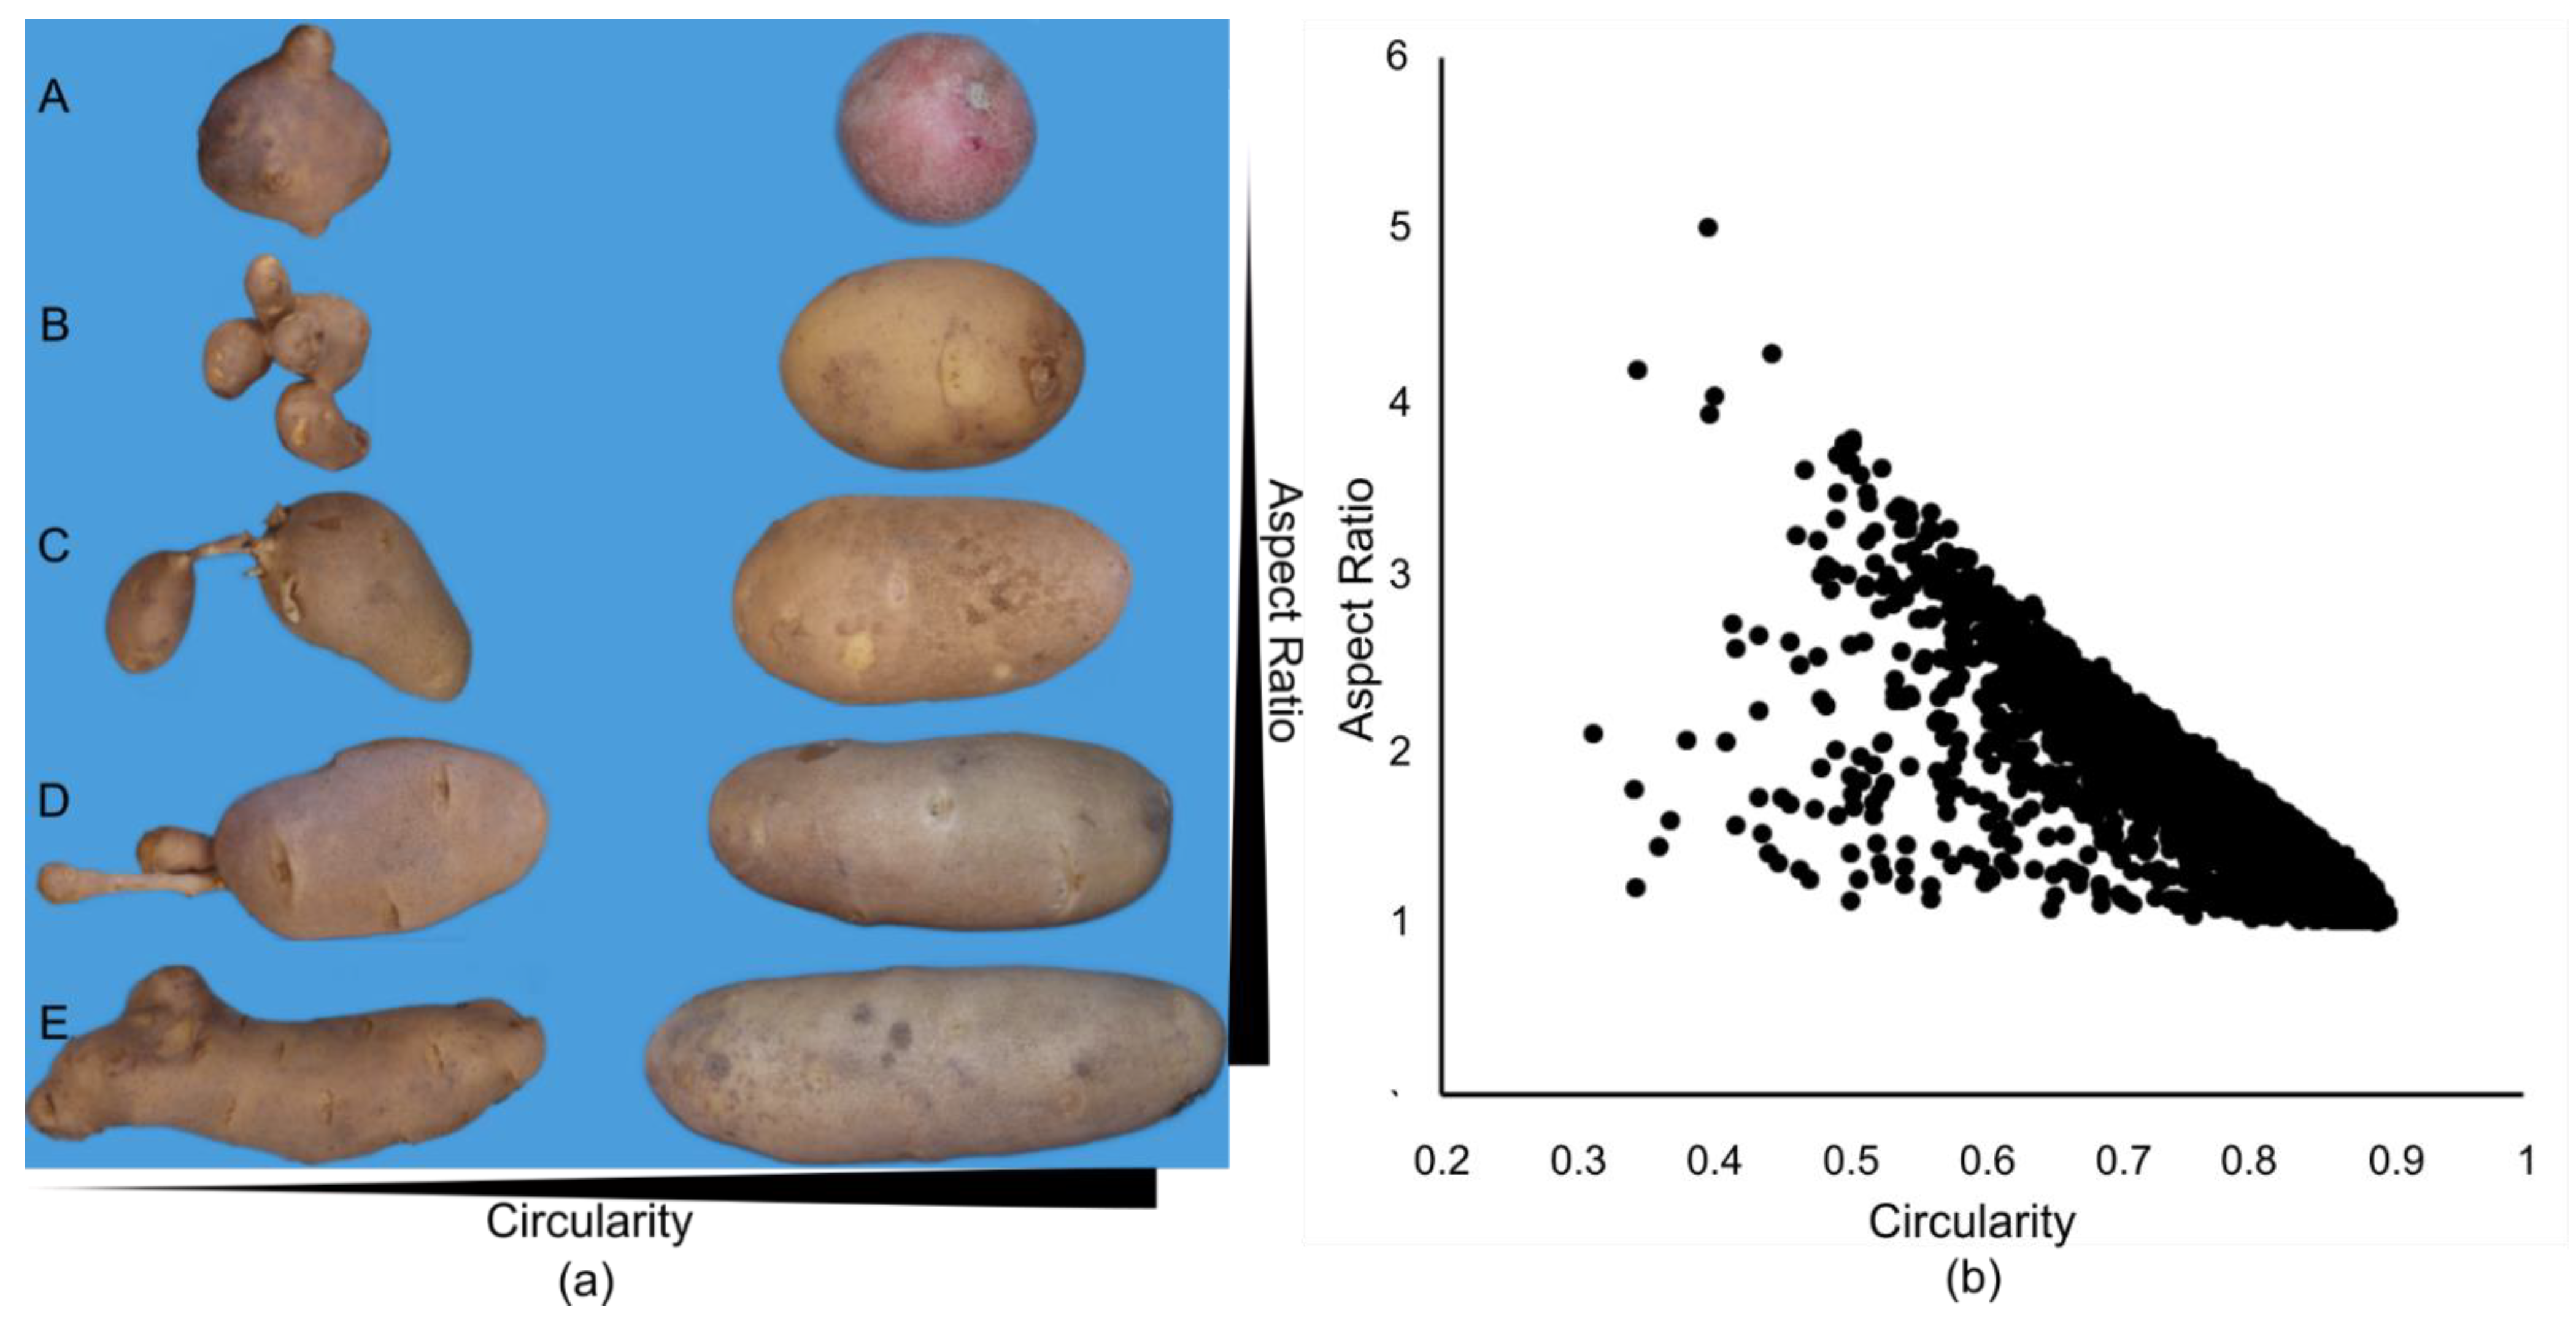
There is a general inverse relationship between AR and circularity (
Figure 2b). Tubers that exhibit stress related secondary growth, chain tubers, growth cracks and other tuber malformations [
26,
27,
28,
29,
30,
31] have lower circularity values. (
Figure 2a). By plotting AR versus circularity we were able to segregate tubers that have an overall ideal length for chipping and French fries from those that have an ideal length but undesirable malformations. Additionally, rather than pre-defining the delimitations for excellent tuber shape we calculated AR and circularity boundaries based on industry stakeholder classifications (
Figure 5,
Table 1). Using this information we were able to determine the proportion of Excellent, Acceptable and Not Acceptable shaped tubers for the French fry and chip markets for varieties selected by breeding technicians as promising as well as a randomly selected group of varieties (
Figure 5;
Table S2). This provides a non-subjective evaluation of a clone’s tuber shape and whether it meets industry specifications. In our case we defined market classification through a survey for broad market classes (French fry and chip). It is possible that how we defined these classifications in the current study would not be applicable to every processor’s specifications or for other market classes, such as fresh tubers or niche markets (fingerlings, creamers, etc.). It would be relatively easy to generate the required parameters by providing examples of Excellent, Acceptable and Not Acceptable tubers, imaging and running them through the established processing pipeline. Other parameters desirable by processors, such as retention (the amount of product produced per unit of tuber input) at the processing plant, could also be evaluated again by providing example tubers and running their images through the pipeline.
We observed a moderate, positive correlation between greenhouse grown and field grown tuber AR (
r = 0.65) and circularity (
r = 0.53;
Figure 3). When we grouped progeny from a single cross together we found that the correlation increased (AR:
r = 0.86; circularity:
r = 0.77). This may be due to having only a single individual at the greenhouse stage and that we grouped the four hills in the field together. Having more replication in the greenhouse and in the field may improve the modeling. When we used data from the greenhouse grown tubers to predict performance in the field we also observed that the model performed better at predicting the mean tuber shape for the cross versus progeny (
Figure 4). Tuber shape can be a complicated trait to calculate depending on the definition used. It should also be noted that AR is a different parameter from L/W ratio. AR is calculated as the length of the longest axis over the second longest axis, while L/W is calculated as the length from the stem attachment site on the tuber to the apical bud. For most tubers, particularly elongated tubers destined for the French fry market, these two parameters are likely the same. However, for flattened tubers or tubers that have abnormal shapes AR and L/W could be very different. As both AR, or L/W ratio, and knobbiness, as captured by circularity, are of interest to processors and will determine marketability we developed a protocol to use the predicted field shape parameters based on greenhouse performance to determine whether the mean tuber shape of the progeny are within the Excellent French fry and chip category (
Figure 5;
Table 2). We calculated a false negative rate of 14.3% and 10.2% and a false positive of 10.2% and 4.1% for French fry and chip market classes respectively. This indicates that by screening in the greenhouse there will be some good performing varieties that would be missed. However, the ability to rapidly grow up multiple rounds of crosses potentially allows for screening much more material for the same amount of field work.
To identify parents which produce tubers of ideal shape for the different market classes we took two approaches. Firstly we grouped all of the tubers together based on parent and then calculating the proportion of Excellent, Acceptable and Not Acceptable (
Figure 6). We then compared the performance of the parents to the population mean as well as the check varieties for the respective market classes. This identified parents that performed relatively well when looking at aggregate numbers. However, it is clear that not all progeny from a given parent have the same performance, as shown in
Table 3. Based on this data we were able to identify parents that produced progeny with a higher proportion of Excellent shaped tubers. It is understood that tuber shape has a strong genetic component and loci linked to the trait have been identified [
10,
11,
12,
13,
14]. In diploid potatoes the Ro locus has been identified as a major QTL for tuber roundness, as defined using L/W ratio [
13,
32]. Thus it should be possible to generate a genetic marker for marker assisted selection (MAS). Combining a marker screen with a rapid phenotyping platform for tuber shape would allow for rapid screening of parental material and progeny.


