Article

Exercise, Urban Food Production, Preparation and Consumption: Implications, Benefits and Risks to Grow-Your-Own (GYO) Gardeners

1
School of Biosciences, Sutton Bonington Campus, University of Nottingham, Loughborough LE12 5RD, UK
2
Information & Computational Sciences, The James Hutton Institute, Aberdeen AB15 8QH, UK
3
Environmental Science Centre, The British Geological Survey, Nicker Hill, Keyworth, Nottingham NG12 5GG, UK
*
Authors to whom correspondence should be addressed.
Agronomy 2022, 12(1), 181; https://doi.org/10.3390/agronomy12010181
Submission received: 4 December 2021 / Revised: 31 December 2021 / Accepted: 7 January 2022 / Published: 12 January 2022

Abstract

:
This study is the first to consider, and estimate, the influence of gardening routines on exposures to both health benefits and health risks. This holistic approach helped to contrast the healthy lifestyle of gardening with health risks from exposures to potentially toxic elements such as Cd and Pb in urban environments. A total of 120 participants who grew their own produce in an urban setting were recruited to the study. A detailed questionnaire was developed that included sections on gardening activity, cultivation and consumption of produce, consumption of commercially grown produce, and other lifestyle factors. Administered alongside the questionnaire was the Short Form 36 (v2) as a standardised tool for measuring physical and mental health. Fruit and vegetable consumption was found to be correlated with the amount of gardening individuals did in autumn/winter and was greater than fruit and vegetable consumption, on average, in the UK general population. Levels of physical activity were also found to be higher in our study than regional averages, whilst BMI was lower than average. This is the first study to find a relationship between gardening more regularly (in autumn/winter) and the physical component of the Short Form 36, and this relationship was elevated compared to non-gardening populations. The physical component scores from this study were also significantly higher for older participants, compared to means from a Western population. This finding supports studies suggesting that gardening may be more beneficial for the elderly generation. These benefits were assessed in the context of potential exposures estimated from the type and frequency of produce being consumed. The benefit of maintaining a healthy lifestyle is likely to outweigh the health risks of gardening on soils mildly contaminated with Cd and Pb but requires formal consideration within a risk management framework.

1. Introduction

Several authors have alluded that both the health benefits (from increased fruit and vegetable consumption, exercise, etc.) and health risks (exposure to contaminants) should be considered in the regulation of gardening activities on urban land [1,2,3,4]. Taking part in gardening activities is associated with a lifestyle that is beneficial to health. Gardeners have been observed to partake in greater levels of physical activity than non-gardeners and consume a greater number of portions of fruit and vegetables [5,6,7]. Gardeners have also been found to have a lower average body mass index (BMI) compared to non-gardeners, meaning they are less likely to be overweight or obese [8,9]. Finally, gardening activities have been shown to reduce stress levels [10,11] and are beneficial to psychological health in other ways, including through community cohesion [12] and through a sense of achievement associated with successfully growing produce [9,12]. Increased fruit and vegetable consumption and physical activity have been reported to have a protective effect against several health outcomes including heart diseases, stroke, and cancers [13,14], diseases that accounted for the top five causes of death in Western Europe between 1990 and 2010 [15].
In contrast to the health benefits of gardening, there have been many studies that found an association between neighbourhood soil contamination and ill-health: neighbourhood soil contamination with Pb has been associated with high blood Pb levels in children and linked to a reduction in IQ [16]. Soil contamination with arsenic has also been found to be correlated with mental retardation [17]. Furthermore, environmental exposure to Cd was associated with an increase in the likelihood of all-cause mortality, cardiovascular disease, and cancer in two prospective studies [18,19,20]. Staessen et al. [21] also observed that moderate environmental exposures to Cd were correlated with lower bone density in women, increasing the likelihood of fractures.
Health outcomes associated with gardening are dependent on the types of activities the gardeners are performing, how often they visit their garden, and what produce they grow and consume. Gardening routines, including the regularity and duration of visits to the allotment or home garden, could increase both health benefits and health risks [11,22]. Different types of gardening activities, such as digging, weeding, etc., play different roles in improving muscle strength, co-ordination, or cardiovascular fitness [23] and likely affect health risks through proximity to the soil and soil dusts. The volume of consumption of home-grown produce has not been widely investigated in the literature [24] but is associated with increased exposure to metals from the soil. Preparation of produce by peeling and washing during cooking or otherwise can reduce exposure to metals contained in soil particles or in the root/fruit exodermis [25]. The increase in fruit and vegetable consumption and physical activity from gardening and Grow-Your-Own can help tackle ‘sloth and obesity’ in the Western world [3].
In this paper, the influence of gardening routines on exposures to the health benefits and health risks of gardening is investigated through a questionnaire survey of gardeners living in and around Nottinghamshire, UK. This is the first study to explicitly evaluate gardening routines from the perspective of impact to both health benefits and risks. The aims of the questionnaire survey were to; (i) obtain data that could be used to estimate health risks and benefits for a group of gardeners, (ii) investigate the relationships between participation in gardening, fruit and vegetable consumption, exercise and health, and (iii) investigate the quantity and types of produce grown and consumed by gardeners.

2. Materials and Methods

2.1. Questionnaire Development

A self-administered ‘Gardening and Health’ questionnaire was used to capture data on gardening routines that might influence health benefits and risks. A copy of the questionnaire can be found in Supplementary Material. The questionnaire contained the following sections designed to obtain different information about the routines of gardeners:
Section A—Participation in gardening: Participants were asked where they had access to a garden (e.g., allotment, home garden) and how often they spent time gardening there.
Section B—Gardening activities: Participants were asked how often they engaged in different gardening activities from a preselected list.
Section C—Produce consumption: Participants were asked which produce they grew on their allotment/home garden from a preselected list and to estimate how often they consumed produce from their garden in portions per week/month.
Section D—Lifestyle: Participants were asked about their lifestyle, including fruit and vegetable consumption, exercise, smoking status, alcohol consumption, and socioeconomic questions.
Section E—Health: Participants were asked to fill in the Short Form (SF) 36 v2 questionnaire and to record their height and weight.
Section F—Further participation: Participants were asked if they would like to take part in future studies and to indicate their preferred choice of incentive.
Participants were asked to indicate their age and gender on the consent form. Except for Section E, which included the SF 36 v2 (see below), the questionnaire was designed by the research team. Questions were designed using previously published questions or responses from previous surveys where available (see individual questionnaire sections below) to reduce bias and allow for comparisons to be made with existing data sets. Most questions used a Likert scale format, recognisable in most surveys, with differing numbers of responses.
Section A—Gardening participation
Questions 1, 2, 3, 5 and 6 (see Supplementary Materials) were used to determine how many of the participants had access to an allotment or a home garden and the proportion of participants that used their gardens for growing food. Questions 4, 7 and 8 helped to determine how often participants gardened either at home or on their allotment; questions were divided into categories based on previous research ([26]—used by the CLEA model [22]) and divided into spring/summer, autumn/winter to account for differences in participant responses as a result of seasonality.
Section B—Gardening activities
The first 10 questions in this section were developed using a 5-point Likert scale and designed to ask respondents about their engagement in a variety of different gardening activities. These were based on Park et al. [23], which documented intensities of different activities measured in metabolic equivalents (METs) for a group of Korean gardeners. Respondents were asked in an open question (Q11) to list any other activities they regularly took part in. The contribution of gardening activities to the exercise regime of participants was assessed in Q12 using a 10-point Likert scale.
Section C—Produce consumption
Participants were given a table of suggested produce (with space to record their own) and asked to indicate which they grew, where they grew it, and how many times per week/month they consumed the produce. They were also asked to indicate whether they normally peeled the produce or washed it prior to consumption. Participants were also asked to indicate, for each type of produce, how much of their general consumption came from the supermarket or their home garden/allotment.
Section D—Lifestyle
This section included questions asking participants to describe their fruit and vegetable consumption and regularity of exercise. Participants were also asked about their alcohol consumption, cigarette use, household income before and after retirement, and highest qualification achieved. Respondents were asked to indicate their level of each lifestyle activity (e.g., fruit and vegetable consumption) over a recent time period (e.g., “How many portions of fruit and vegetables (not including potatoes) did you eat yesterday?”) as well as more generally. Fruit and vegetable consumption questions and responses and those for exercise were designed for comparison with Health Survey England 2013 data recorded in the Health and Social Care Information Centre [27]. Questions and answer categories for alcohol consumption and smoking were based on data from HSCIC [28,29]. Social economic status (SES) was assessed by a composite score calculated from the highest qualification achieved (education) and household income (household income before retirement was calculated for individuals who had retired). Responses were graded from 1 to n (with n considered the highest) and then multiplied together to give a score for SES (a similar framework to that used by the twofold or fourfold index [30]. Qualification responses including vocational and non-vocational qualifications were categorised according to the National Qualifications Framework v5. Responses for household income were categorised so that possible answers reflected the distribution of household income for the UK, according to the Institute for Fiscal Studies [31].
Section E—Health
The SF 36 v2 questionnaire was administered as a measure of physiological and psychological health and well-being. Participants were also asked to record their own height and weight and given the option to record this in metric or imperial units. Height and weight were converted to metric units (m and kg) and used to calculate body mass index (BMI).
The Short Form 36 v2 is recognised internationally as a validated, self-reported measure of physical and psychological health and well-being. The questionnaire contains 36 questions relating to eight categories: Physical Function (PF), Role Physical (RP), Bodily Pain (BP), General Health (GH), Vitality (VT), Social Function (SF), Role Emotional (RE), and Mental Health (MH). Composite scores for the first four categories are combined to give the Physical Component Score (PCS) and composite scores from the last four categories, the Mental Component Score (MCS). Scores for each category are normalised according to population means taken from a large Western population. The SF 36 v2 has also been previously used by several other researchers investigating health outcomes arising from gardening [11,23,32,33]. An additional question was used to ascertain whether the respondents’ responses to the SF 36 v2 were typical or whether they might have been affected by illness, injury, or a significant emotional experience such as marriage or becoming a parent. This was previously implemented for a similar study by [34] and is relevant for this study where a longer period than the usual recall period of 4 months is important.

2.2. Study Design and Administration

Participation in gardening in this study was considered to be a continuous variable, ranging from those who do little or no gardening to individuals who spend a lot of their time engaged in gardening activities. As a result, no control group was recruited for this study, the study population was instead compared to baseline studies that investigated health and well-being, fruit and vegetable consumption and exercise in larger populations. These include national and regional statistics for the consumption of fruit and vegetables and engagement in physical activity and normalised scores for the SF 36 v2 adjusted by age and gender [35].
Participants were firstly recruited as part of a wider study investigating the composition of the soils of allotment gardens. Details of access to participants, ethical approval, and permissions for this part of the study are included in the Supplementary Materials. Participants were also recruited at Grow-Your-Own events run by Nottingham City Council (NCC) on 6 September 2014 and 5 September 2015. The research team were invited by the NCC to host a stall at the event and hand out questionnaire packs containing questionnaires and consent forms (see Supplementary Material). The packs were pre-stamped and addressed for return. Entry into a prize draw for participants with the chance to win GBP 100 cash prize or a gardening equivalent prize (including membership to the RHS or National Trust) was offered as an incentive for the return of completed questionnaires. One winner was picked at random from the list of entries. All participants were required to be over 18 years old.

2.3. Scoring Responses and Data Entry

Questionnaire responses and personal information (names and contact details) were entered into separate databases linked using an ID number unique to each individual questionnaire. The questionnaire was set up as a tabbed form in Microsoft Access 2010. Entered data were automatically recorded in related data tables that were set up for each section of the questionnaire (Section C was split into two because of its size). Questions that required participants to answer using a Likert scale (e.g., ‘Never’, ‘Some of the time’, ‘Most of the time’, ‘All of the time’) were recorded numerically by the database software using numbered 0–nth responses. Non-responses were recorded as ‘999’ and removed prior to data analysis. Responses to open-ended questions were recorded in full. Hard copies of questionnaires and consent forms were kept in a locked cabinet for reference with contact details removed and shredded as per the ethical requirements.

2.4. Data Analysis

Statistical analyses and graphs were prepared using Minitab v 17.2.1. One-way analysis of co-variance (ANCOVA) was used to test the null hypothesis that gardening more regularly in spring/summer or autumn/winter (independent variable) is not correlated with an increase in fruit and vegetable consumption (number consumed yesterday), exercise (number of times in the last week), or the physical component or mental component sub-scales of the SF 36 v2. One-way ANCOVA (analysis of co-variance) was also used to test the null hypothesis that gardening more regularly (independent variable) is not correlated with a decrease in BMI. Age and SES scores were included as covariates in the analysis. Gender, alcohol consumption, and current cigarette use were included as confounding factors. Data from the produce consumption table (Section C of the questionnaire, Supplementary Material) were exported into a pivot table created using Microsoft Excel 2010. The annual consumption of produce (portions per year) was estimated using the number of portions consumed per week/month of each produce multiplied by the number of months per year this was grown (for example, for an individual who grew tomatoes for 5 months of the year and consumed 2 portions per week, the annual consumption would be 2 × (52.3/12) × 5 = 44 portions per year).

3. Results

3.1. Demographics

One-hundred-and-twenty participants filled in and returned completed questionnaires. The minimum age of the gardeners studied here was 30 years with a maximum of 85 years and an average (mean) of 59 years (under 18 was not included in the study). The study included 58 males and 56 females (6 respondents did not indicate their gender). Half of the respondents (50%) were currently employed, with 38% indicating that they had retired prior to receiving the survey. Reported household incomes of participants were similar to data for the East Midlands region (Figure 1). The majority of respondents (66%) stated that they held a qualification equivalent to a bachelor’s degree or above.

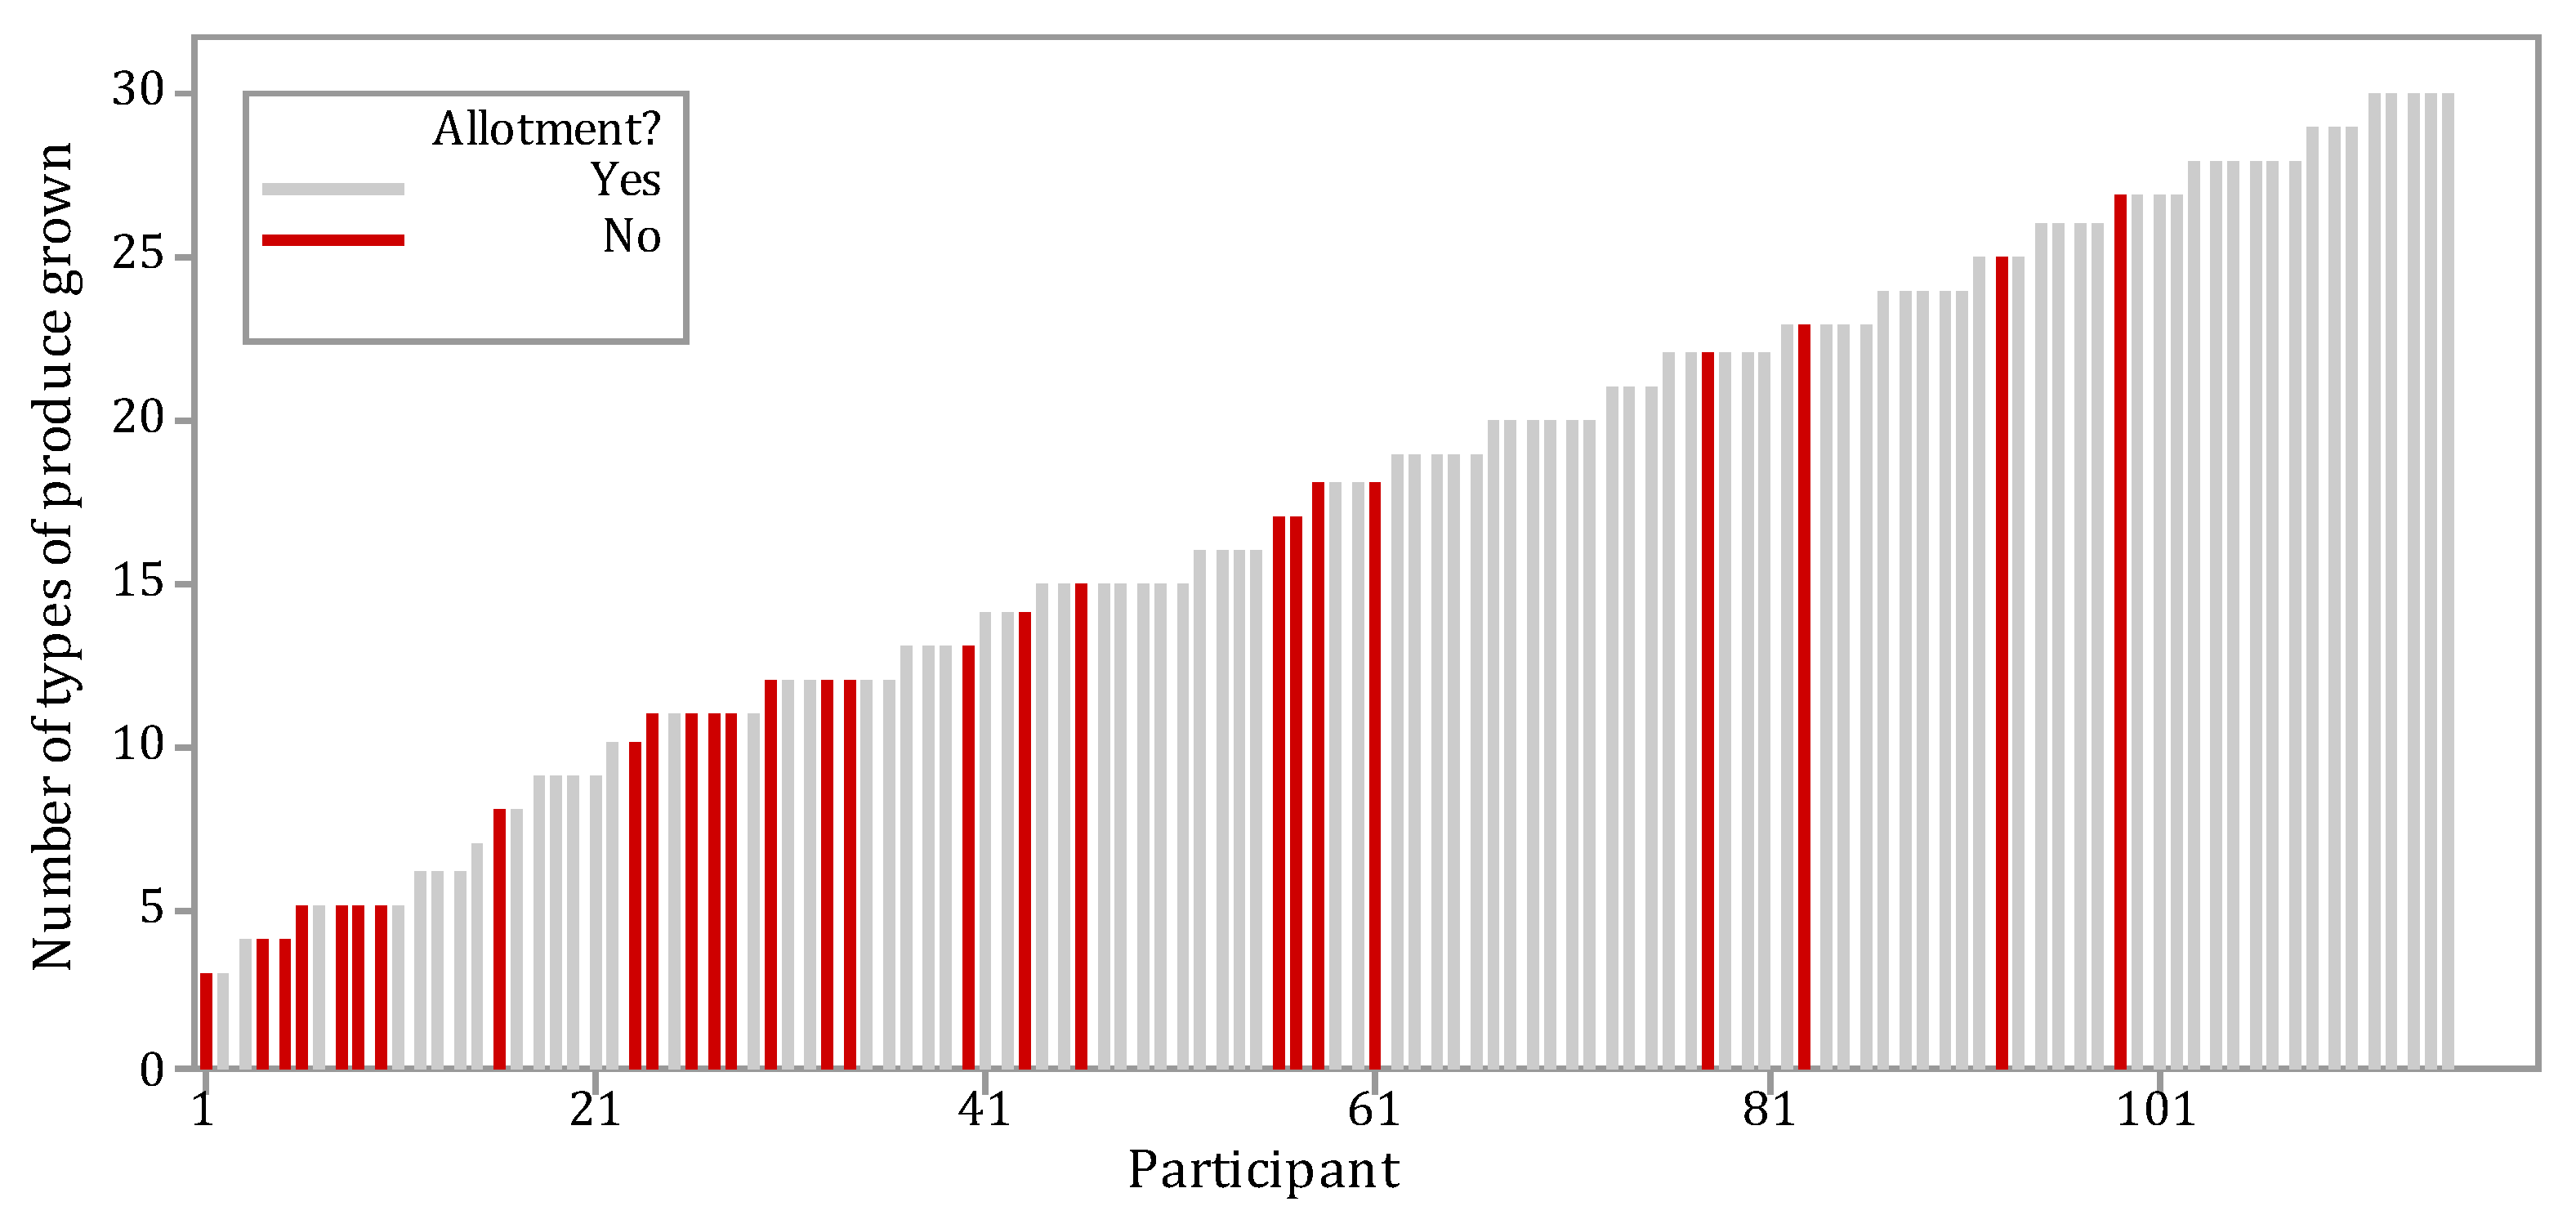
3.2. Participation in Gardening Activities

Out of 120 participants, 109 had access to a garden at home and 90 had access to an allotment. The participants varied in their engagement with gardening. Some participants reported gardening less than once a month whilst others reported gardening every day. One individual who had access to an allotment reported not doing any gardening. Individuals that had access to an allotment generally reported gardening more regularly than individuals that did not. The regularity with which participants took part in gardening activities was strongly dependent on the season. Participants who had an allotment were more likely to spend several hours in their allotment in spring/summer than autumn/winter. Most participants that had access to an allotment reported spending at least one hour on their allotment per visit regardless of season (94% of all respondents in spring/summer and 80% in autumn/winter).
Participants reported engaging in a wide range of gardening activities. As well as the pre-selected gardening activities in the questionnaire, participants also reported spending a lot of time maintaining hedgerows and outbuildings. Moderate intensity activities [23], including digging, raking, weeding, and tying plants to stakes, were performed to some extent by most of the respondents (Figure 2). More than two-thirds (n = 80) of the participants reporting either spending ‘some’ or ‘a lot’ of their time digging or weeding. Tying plants to stakes or raking the soil were less common activities, with the majority (more than 60) of respondents reporting spending ‘some’ or ‘a little’ of their time performing them. Low intensity activities [23], including watering with a watering can, harvesting produce, and cutting stems/flower heads, were also performed to some extent by most participants. The majority of respondents (more than 60), reporting spending ‘some’ or ‘a lot’ of their time watering with a watering can and ‘some’ of their time harvesting produce. Fewer participants reported spending much of their time cutting stems and removing flower heads (Figure 2).

3.3. Trends in Produce Growth and Consumption

The most commonly grown produce by the survey participants were potatoes and tomatoes, which were grown by 78% of participants that grew some kind of produce in their home garden, allotment garden, or elsewhere (GYO gardeners; n = 118). Leafy produce, including lettuces and herbs, known to accumulate Cd [36], were also grown by a large proportion of GYO gardeners (60 and 64% of gardeners grew lettuces and herbs, respectively). Consumption of some produce, such as berries, only occurred for a few months of the year when the produce was in season (although some participants did report consuming homemade jams and conserves all year round). Others, such as herbs, were grown and consumed fresh all year. Fruits were found to be grown and consumed more often than leaves, roots, or other edible tissues (Table 1). Consumption of GYO produce was found to contribute to an average of 627 portions, per person, per year. Using a crude conversion of one portion of fruit and vegetables ≈ 80 g fw, this equated to an average consumption of ≈960 g fw person−1 week−1 of all home-grown produce in the diet. The amount of produce grown by participants in the study varied substantially between those who grew and consumed none to those who grew and consumed 30+ different types of produce (Figure 3). Participants who had access to an allotment generally grew more produce than participants that did not, but some home gardeners still reported growing over 20 different types of produce in their gardens (Figure 3).
Preparation methods were dependent on the type of produce. Berries such as blueberries were not washed (washed by 33% of growers), whilst root/tuber vegetables such as potatoes and parsnips were more often washed than not (Table S1). Root produce was commonly peeled prior to consumption (Table S1). The contribution of GYO produce, compared to shop-bought produce, to the diet also depended on the type of produce. Commonly grown and consumed produce such as potatoes and tomatoes were normally supplemented with shop-bought produce. Less commonly consumed produce or produce that was expensive or a rarity on supermarket shelves, such as damsons and fennel, tended to be sourced completely from allotments and gardens (Table S1).

3.4. Lifestyle

3.4.1. Fruit and Vegetable Consumption

The contribution of GYO produce to the diet was hypothesised to correlate with increased fruit and vegetable consumption for participants who more regularly took part in gardening activities than those who did not. The results of a one-way ANCOVA suggested a significant (p = 0.037) relationship between regularity of gardening in autumn/winter and an increase in fruit and vegetable consumption. From Figure 4A, it can be observed that taking part in gardening more regularly in autumn/winter appeared to be correlated with increased fruit and vegetable consumption. The exception to the trend was for gardeners who took part in gardening activities most days (n = 10), who appeared to consume fewer portions of fruit and vegetables than gardeners in the other categories. The mean consumption of fruit and vegetables on the previous day for all participants (n = 119) was 4.1 portions. Men reported consuming 4 portions on average, whilst women reported consuming an average of 4.1 portions. These values were higher than averages for the East Midlands region of 3.4 and 3.6 portions for men and women, respectively [27].

3.4.2. Physical Activity

The UK government recommends that individuals should perform some form of moderate (e.g., walking or gardening) or more intensive exercise of 30 min or more on five separate occasions per week [37]. Most of the participants in the present study (71% of men and 51% of women) reported meeting the recommendations in the previous week (Figure 4B). This compared to only 39% of men and 29% of women who met the same government recommendation in 2008 [37]. Increased regularity of gardening activities in autumn/winter was found to be positively correlated with increased occasions of moderate or more intensive exercise by participants (one-way ANCOVA: p = 0.008).

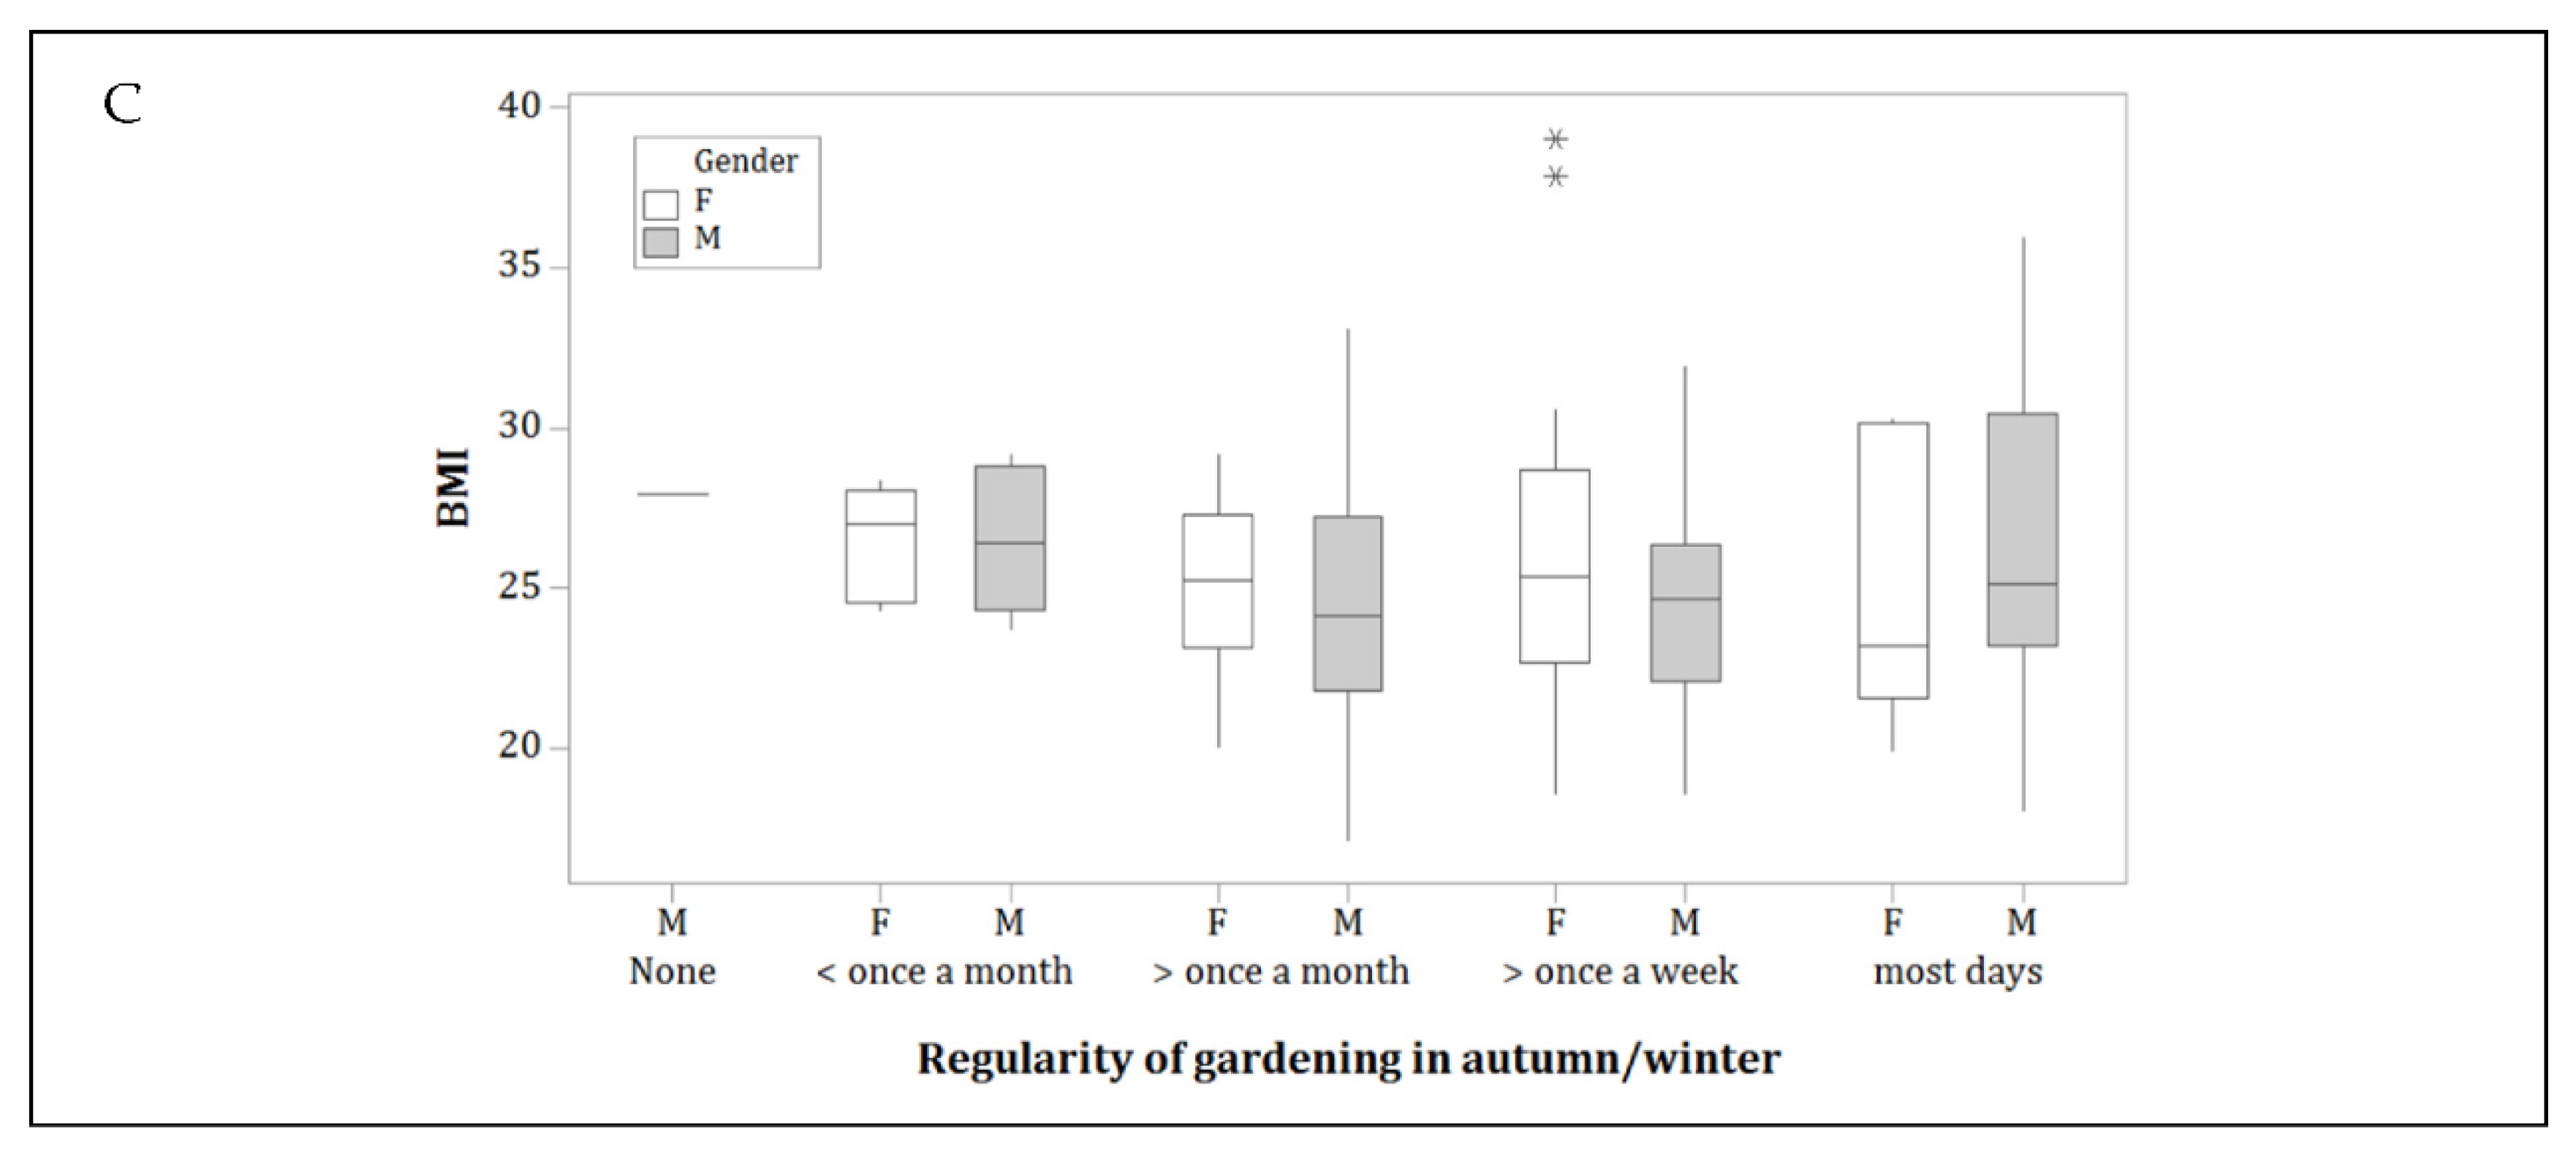
3.4.3. Body Mass Index (BMI)

Body mass index was calculated from self-reported height (m) and weight (kg). The average (mean) BMI was 25.3 kg m−2 for male participants (n = 56) and 25.5 kg m−2 for female participants (n = 50) (six participants did not provide their gender and/or height and weight which were used to calculate BMI). This compared to an average (mean) BMI for the general population (UK) of 27.4 kg m−2 for men and 27.1 kg m−2 for women [37]. There was no significant correlation between reduced BMI and regularity of gardening in spring/summer or autumn/winter (one-way ANCOVA: p = 0.675 and 0.341, respectively) (Figure 4C).

3.4.4. Alcohol Consumption and Cigarette Smoking

Alcohol consumption and cigarette smoking were recorded as confounding factors that could influence health outcomes from gardening lifestyles. Whilst not used directly in the analysis presented here, more details of a wider risk analysis including confounders can be found in Stubberfield [38]. A large majority, 88% of the study population, reported consuming alcohol in the last week to some extent. Over half (53%) of the study population consumed > 10 units in the previous 7 days; 5% of the study population consumed more than 30 units in the same time period. The number of participants that reported drinking in the last week was higher than data from a national survey (67% of men and 53% of women [28]). However, the number of ‘binge’ drinkers (those drinking more than double the recommended amounts at the time of the study: 14 units for women and 21 units for men) in the national survey was much higher than the data for the current survey, consisting of 31% of men and 24% of women [28]. Nearly half (45%) of the study participants reported that they had smoked regularly at some point in their lives. Of those who smoked cigarettes, only 22% reported smoking the previous day. The median number of cigarettes smoked was between 6 and 20, consistent with the national average of 12 cigarettes per day [29]. No individuals reporting smoking more than 30 cigarettes on the previous day.

3.5. Short Form 36 v2 Responses

3.5.1. Physical Component Scores

Scores from the physical component summary (PCS) suggested that gardeners in the study population had better physical health than the US population from which the survey was constructed. The mean PCS score was 51.8:51.0 for males and 52.7 for females. The scores were negatively skewed by some individuals in the study population scoring much lower than the 50 norm. When scores were adjusted for age and gender, older participants (age 45+) in the present study scored significantly higher than normalised scores from the US population (Table 2). Scores from the different sub-components forming the PCS were similar across age groups and genders. There was a significant increase in the PCS scores of gardeners who gardened more regularly in autumn/winter (p = 0.011). PCS scores appeared to increase with gardening regularity, but the increase appeared to reach a threshold for participants gardening once a week or more (Table 2).

3.5.2. Mental Component Scores

Scores from the mental component summary (MCS) were also higher than norms from the US population from which the SF 36 v2 was constructed. The mean MCS score from across the study population was 52.8; 53.0 for males and 52.5 for females respectively. The scores were negatively skewed by some individuals in the study population scoring much lower than the 50 norm. The scores from the study population were not significantly different from the mean scores in the US population when adjusted for age and gender (Table 2). Scores from the different sub-groups forming the MCS were similar between age and gender categories. There was no increase in MCS scores for participants who took part in gardening activities more regularly in autumn/winter or spring/summer (p = 0.649 and 0.165, respectively).

4. Discussion

4.1. Health Risks

Health risks from gardening are primarily related to chronic and sub-chronic exposures to soil contaminants, although some acute risks from, e.g., pesticide usage can occur. Exposure to heavy metals from gardening on urban and allotment soils is increased through increased consumption of GYO produce and increased incidence and duration of garden visits [22]. Plant uptake of metals varies according to the metal and edible plant tissue consumed [39,40]. In many urban settings, exposure to cadmium and lead are often of relatively highest concern owing to the low toxicological threshold (especially for Cd) and the ubiquitous nature of these pollutants [41].
For exposures to Cd, the main route for gardeners is expected to be through the consumption of produce, as Cd is very bioavailable in soils [42]. Potatoes and tomatoes, the most commonly grown produce by gardeners in this study, do not readily take up Cd [39], whereas leafy vegetables such as lettuces tend to accumulate Cd more readily [43]. The main contribution of Cd from produce grown by the study population was estimated to be from fruits and leaf vegetables [38]. Fruits were consumed more than the other produce types, and Cd accumulates in leafy vegetables. This suggested that reducing both the amount of produce and the amount of leafy produce consumed from urban gardens and allotments could be viable methods to reduce exposures to Cd.
The main exposure route to Pb for urban gardeners is likely to be through soil ingestion, as Pb is not readily taken up into produce (e.g., [44,45]). Inadvertent soil ingestion is linked to the number of hours gardeners spend on their gardens or allotment plots [22], as well as consumption of soil particles adhered to crop plant surfaces. The regularity and duration of visits to gardens were found to be strongly dependent on season (Figure 4A,B). Lead exposures are particularly pertinent for children, who may suffer from developmental toxicity as a result [16,46]. Reducing the amount of time children spend playing in urban soils may help to reduce their exposure. Furthermore, practices including wearing gloves and removing dust-ridden clothing prior to entering the house could further reduce exposures from soil Pb [4]. At least two-thirds of participants in this study reported peeling root vegetables prior to consumption. Most participants also washed produce prior to consumption, which also helps to reduce Pb exposure from soil particles adhered to produce [25]. The contribution of produce such as berries, which are commonly consumed without washing, to Pb exposures should also be considered.
There was a large variation in gardening practices and routines among participants in the survey. This could result in considerable under/over estimation of risk estimates if this individual-level variability in exposure is not accounted for [47]. In a review of risk assessment models, Swartjes (2007) [48] found variations in model outputs of adult exposure to be between one and two orders of magnitude. Swartjes (2007) [48] postulated that variation in model outputs could arise because of differences in model inputs and estimates of exposure. Stubberfield (2017) [38] showed that risk assessment models CLEA, RBCA, and RIVM may all under- or over-estimate plant uptake of metals by up to two orders of magnitude. The variation in both Cd and Pb exposures among gardeners in this study is likely to vary considerably among gardeners because of the differences in produce consumption, number and duration of garden visits, adding further variability to estimates of health risks. The inclusion of self-reported data on exposure, such as number and duration of visits to the garden, may help improve the accuracy of site-specific assessments. Assessing fruit and vegetable consumption in Section C of the questionnaire was difficult, and a number of participants in a pilot study reported this section difficult to answer. Pre-selection of produce in the questionnaire may have contributed a source of bias but reduced the amount of time participants spent answering this section. Another approach can be using food diaries to record produce consumption or ask participants to duplicate meals. However, these approaches are also subject to sources of bias and uncertainty and may not necessarily offer much improvement on 24-h recall designs [49].

4.2. Health Benefits

Whilst it is difficult to know if improved health results from gardening or is a precursor to taking up an activity such as gardening, similarities between the results of this study and previous studies supported the argument that gardening can help to promote healthier lifestyles and tackle national sloth and obesity (as suggested by Leake et al., 2009 [3]). Firstly, fruit and vegetable consumption by gardeners in this study was found to be correlated with the amount of gardening individuals did in autumn/winter and was greater than fruit and vegetable consumption, on average, of the UK general population. Two other studies have observed an increase in fruit and vegetable consumption among gardeners compared to non-gardeners [5,7]. Levels of physical activity were also found to be higher in our study than regional averages. This was supported by Van den Berg et al. (2010) [32], who found that physical activity levels in summer were significantly higher for gardeners compared to non-gardeners. Furthermore, the mean BMI of participants in this study (25.4 ± 4.0 kg m−2) was very similar to the mean BMI of participants in two other UK-based studies of allotment gardeners (25.5 ± 3.3 kg m−1 [11]; and 25.5 ± 3.5 kg m−2 [9]), as well as being lower than national averages.
This is the first study (to our knowledge) to find a relationship between gardening more regularly (in autumn/winter) and the physical component of the SF 36 v2. The median PCS score (53.8) observed in this study was similar to the median PCS score of 53.5 observed by Hawkins et al. (2011) [11] for a group of allotment gardeners. Another study, Park et al. (2009) [6], found a significant improvement in the physical component scores of the SF 36 v2 for gardeners, compared to a non-gardening control group. Park et al. (2009) [6] and Hawkins et al. (2011) [11] did not observe a difference between gardeners and non-gardeners in the mental component score from the SF 36 v2. The physical component scores from this study were also significantly higher for older participants, compared to means from a Western population [35]. This supported studies suggesting that gardening may be more beneficial for the elderly generation (e.g., [33]).
There was no difference between the MCS scores in the present study and the US population studied by Ware and Kosinski (2001) [35]. Van den Berg et al. (2010) [32] observed that gardeners had higher life satisfaction compared to their non-gardening counterparts, Wood et al. (2015) [9] that gardening improves self-esteem, whilst Hawkins et al. (2011) [11] and Van den Berg and Custers (2011) [10] found a correlation between gardening activities and reduced stress (measured by reduced cortisol production). It is possible that the SF 36 v2 may not be a sensitive enough tool, owing to the number of confounding factors that play a part in psychological health and well-being, to register a potentially small effect of gardening on mental health. The relatively small sample size of 126 participants in this study is also likely to be a limiting factor in identifying correlations between mental health and gardening exposures.
A surprising result of this study was the correlation between increased participation in gardening in autumn/winter, but not spring and summer, and PCS scores, increased fruit and vegetable consumption, and increased physical activity. The ANOVA used to determine differences in lifestyle and health because of participation in gardening was unbalanced as the number of individuals in each category (‘<once a month’, ‘>once a month’) etc. was different, so the results should be treated with caution. However, participants who did more gardening in spring/summer may not have been as active in autumn/winter (Figure 5), reducing the impact gardening may have had on their overall lifestyle, health, and well-being.

5. Conclusions

This study is the first to consider, and estimate, the influence of gardening routines on exposures to both health benefits and health risks. This holistic approach helped to contrast the healthy lifestyle of gardening with health risks from exposures to Cd and Pb in urban environments. The data from this survey were used to underpin a novel risk assessment model that balanced the trade-off between health benefits and health risks for urban gardeners [38].
Practical measures may help to reduce environmental Cd and Pb exposure for gardeners, whilst still allowing gardeners to enjoy and maintain a healthier lifestyle. Reduced exposures to Cd could be achieved by reducing the consumption of home-grown produce, especially leafy produce grown on urban gardening spaces, and through soil amendments to reduce the bioavailability of Cd [4]. Reduced exposures to Pb could be achieved through wearing gloves, washing and peeling produce, and reducing the amount of time children spend playing in urban garden soils. Participation in gardening was found to be beneficial for physical health and well-being among older gardeners and for maintaining a healthy lifestyle through increased fruit and vegetable consumption, physical activity, and a lower BMI. Participants in this study were generally healthier than national and regional averages. The benefit of maintaining a healthy lifestyle is likely to outweigh the health risks of gardening on soils mildly contaminated with Cd and Pb but requires formal consideration within a risk management framework.

Supplementary Materials

The following supporting information can be downloaded at https://www.mdpi.com/article/10.3390/agronomy12010181/s1, The Questionnaire used in this study, Table S1: Produce grown and consumption by gardeners. The number of participants who grew some produce in their home garden, allotment, or elsewhere was 118. Dashes in rows indicate occasions where data were insufficient or not applicable. The GYO contribution column is the average score gardeners reported for column h in the produce consumption table (Section C, Questionnaire) (0 = none from GYO, 10 = all from GYO).

Author Contributions

Conceptualisation, R.L.H., M.T., L.A., N.C. and S.D.Y.; methodology, J.S., R.L.H., M.T., L.A., N.C. and S.D.Y.; formal analysis, J.S. and N.C.; investigation, J.S.; resources, R.L.H. and S.D.Y.; data curation, J.S.; writing—original draft preparation, J.S.; writing—review and editing, M.T., L.A., N.C., S.D.Y. and R.L.H.; supervision, M.T., L.A., N.C., S.D.Y. and R.L.H.; funding acquisition, R.L.H. All authors have read and agreed to the published version of the manuscript.

Funding

This research was funded by the University of Nottingham (BBSRC), the James Hutton Institute (Scottish Government RESAS), and the British Geological Survey (NERC).

Institutional Review Board Statement

This study was conducted in accordance with the Declaration of Helsinki, and approved by the Ethical Review Committees of James Hutton Institute, Scotland, and the University of Nottingham, UK.

Informed Consent Statement

Informed consent was obtained from all subjects involved in the study.

Acknowledgments

The authors would like to acknowledge all the allotment associations and participants involved in this study.

Conflicts of Interest

The authors declare no conflict of interest.

References

  1. Brown, K.H.; Jameton, A.L. Public Health Implications of Urban Agriculture. J. Public Health Pol. 2000, 21, 20–39. [Google Scholar] [CrossRef]
  2. Frumkin, H. Beyond toxicity: Human health and the natural environment. Am. J. Prevent. Med. 2001, 20, 234–240. [Google Scholar] [CrossRef]
  3. Leake, J.R.; Adam-Bradford, A.; Rigby, J.E. Health benefits of ‘grow your own’ food in urban areas: Implications for contaminated land risk assessment and risk management? Environ. Health 2009, 8, S6. [Google Scholar] [CrossRef] [Green Version]
  4. Brown, S.L.; Chaney, R.L.; Hettiarachchi, G.M. Lead in Urban Soils: A Real or Perceived Concern for Urban Agriculture? J. Environ. Qual. 2016, 45, 26–36. [Google Scholar] [CrossRef] [Green Version]
  5. Alaimo, K.; Packnett, E.; Miles, R.A.; Kruger, D.J. Fruit and Vegetable Intake among Urban Community Gardeners. J. Nutr. Educ. Behav. 2008, 40, 94–101. [Google Scholar] [CrossRef]
  6. Park, S.-A.; Shoemaker, C.A.; Haub, M.D. Physical and psychological health conditions of older adults classified as gardeners or nongardeners. HortScience 2009, 44, 206–210. [Google Scholar] [CrossRef] [Green Version]
  7. Carney, P.A.; Hamada, J.L.; Rdesinski, R.; Sprager, L.; Nichols, K.R.; Liu, B.Y.; Pelayo, J.; Sanchez, M.A.; Shannon, J. Impact of a Community Gardening Project on Vegetable Intake, Food Security and Family Relationships: A Community-based Participatory Research Study. J. Commun. Health 2011, 37, 874–881. [Google Scholar] [CrossRef] [PubMed] [Green Version]
  8. Zick, C.D.; Smith, K.R.; Kowaleski-Jones, L.; Uno, C.; Merrill, B.J. Harvesting more than vegetables: The potential weight control benefits of community gardening. Am. J. Public Health 2013, 103, 1110–1115. [Google Scholar] [CrossRef] [PubMed]
  9. Wood, C.J.; Pretty, J.; Griffin, M. A case–control study of the health and well-being benefits of allotment gardening. J. Public Health 2015, 38, e336–e344. [Google Scholar] [CrossRef] [PubMed]
  10. Van den Berg, A.; Custers, M.H.G. Gardening Promotes Neuroendocrine and Affective Restoration from Stress. J. Health Psychol. 2011, 16, 3–11. [Google Scholar] [CrossRef] [PubMed]
  11. Hawkins, J.L.; Thirlaway, K.J.; Backx, K.; Clayton, D.A. Allotment Gardening and Other Leisure Activities for Stress Reduction and Healthy Aging. HortTechnology 2011, 21, 577–585. [Google Scholar] [CrossRef] [Green Version]
  12. Wakefield, S.; Yeudall, F.; Taron, C.; Reynolds, J.; Skinner, A. Growing urban health: Community gardening in South-East Toronto. Health Promot. Int. 2007, 22, 92–101. [Google Scholar] [CrossRef]
  13. Steinmetz, K.A.; Potter, J.D. Vegetables, Fruit, and Cancer Prevention: A Review. J. Am. Diet. Assoc. 1996, 96, 1027–1039. [Google Scholar] [CrossRef]
  14. Kruk, J. Physical activity in the prevention of the most frequent chronic diseases: An analysis of the recent evidence. Asian Pac. J. Cancer Prevent. 2007, 8, 325. [Google Scholar]
  15. Lozano, R.; Naghavi, M.; Foreman, K.; Lim, S.; Shibuya, K.; Aboyans, V.; Abraham, J.; Adair, T.; Aggarwal, R.; Ahn, S.Y.; et al. Global and regional mortality from 235 causes of death for 20 age groups in 1990 and 2010: A systematic analysis for the Global Burden of Disease Study 2010. Lancet 2012, 380, 2095–2128. [Google Scholar] [CrossRef]
  16. Zahran, S.; Laidlaw, M.A.S.; McElmurry, S.P.; Filippelli, G.M.; Taylor, M. Linking Source and Effect: Resuspended Soil Lead, Air Lead, and Children’s Blood Lead Levels in Detroit, Michigan. Environ. Sci. Technol. 2013, 47, 2839–2845. [Google Scholar] [CrossRef] [PubMed]
  17. Liu, Y.; McDermott, S.; Lawson, A.; Marjorie Aelion, C. The relationship between mental retardation and developmental delays in children and the levels of arsenic, mercury and lead in soil samples taken near their mother’s residence during pregnancy. Int. J. Hyg. Environ. Health 2010, 213, 116–123. [Google Scholar] [CrossRef] [Green Version]
  18. Nawrot, T.S.; Van Hecke, E.; Thijs, L.; Richart, T.; Kuznetsova, T.; Jin, Y.; Vangronsveld, J.; Roles, H.A.; Staessen, J.A. Cadmium-Related Mortality and Long-Term Secular Trends in the Cadmium Body Burden of an Environmentally Exposed Population. Environ. Health Persp. 2008, 116, 1620–1628. [Google Scholar] [CrossRef] [Green Version]
  19. Nawrot, T.S.; Staessen, J.A.; Roles, H.A.; Munters, E.; Cuypers, A.; Richart, T.; Ruttens, A.; Smeets, K.; Clijsters, H.; Vangronsveld, J. Cadmium exposure in the population: From health risks to strategies of prevention. BioMetals 2010, 23, 769–782. [Google Scholar] [CrossRef] [PubMed] [Green Version]
  20. Menke, A.; Muntner, P.; Silbergeld, E.K.; Platz, E.A.; Guallar, E. Cadmium Levels in Urine and Mortality among U.S. Adults. Environ. Health Persp. 2009, 117, 190–196. [Google Scholar] [CrossRef]
  21. Staessen, J.A.; Roles, H.A.; Emelianov, D.; Kuznetsova, T.; Thijs, L.; Vangronsveld, J.; Fagard, R. Environmental exposure to cadmium, forearm bone density, and risk of fractures: Prospective population study. Lancet 1999, 353, 1140–1144. [Google Scholar] [CrossRef]
  22. Environment Agency. Updated Technical Background to the CLEA Model; Environment Agency: Bristol, UK, 2009.
  23. Park, S.-A.; Lee, K.-S.; Son, K.-C. Determining exercise intensities of gardening tasks as a physical activity using metabolic equivalents in older adults. HortScience 2011, 46, 1706–1710. [Google Scholar] [CrossRef] [Green Version]
  24. Mulloli, T.P.; Air, V.; Vizard, C.; Singleton, I.; Rimmer, D.; Hartley, P. The legacy of historic land-use in allotment gardens in industrial urban settings: Walker Road allotment in Newcastle Upon Tyne, UK. Land Contam. Reclam. 2004, 12, 239–252. [Google Scholar] [CrossRef]
  25. Arif, I.A.; Khan, H.; Homaiden, A.A.; Ahmed, A. Determination of Cu, Mn, Hg, Pb, and Zn in the Outer Tissue Washings, Outer Tissues and Inner Tissues of Different Vegetables Using ICP-OES. Pol. J. Environ. Stud. 2011, 20, 835–841. [Google Scholar]
  26. Saunders, P. Towards Allotments 2000, National Survey of Allotment Gardeners Views in England and Wales; National Society of Allotment and Leisure Gardeners Ltd.: Corby, UK, 1993. [Google Scholar]
  27. HSCIC. Chapter 7: Fruit and vegetable consumption. In Health Survey England 2013 Vol. 1; The Health and Social Care Information Centre: Leeds, UK, 2013. [Google Scholar]
  28. HSCIC. Chapter 6: Alcohol consumption. In Health Survey England 2012; The Health and Social Care Information Centre: Leeds, UK, 2012; Volume 1. [Google Scholar]
  29. HSCIC. Statistics on Smoking: England 2013; The Health and Social Care Information Centre: Leeds, UK, 2013.
  30. Hollingshead, A.B. Four Factor Index of Social Status. Department of Sociology, Yale University, New Haven, CT, USA. 1975; Unpublished working paper. [Google Scholar]
  31. IFS Institute for Fiscal Studies. Living Standards, Inequality and Poverty Spreadsheet; Institute of Fiscal Studies: London, UK, 2016. [Google Scholar]
  32. Van den Berg, A.E.; van Winsum-Westra, M.; de Vries, S.; van Dillen, S.M.E. Allotment gardening and health: A comparative survey among allotment gardeners and their neighbours without an allotment. Environ. Health 2010, 9, 74. [Google Scholar] [CrossRef] [PubMed] [Green Version]
  33. Wang, D.; MacMillan, T. The Benefits of Gardening for Older Adults: A Systematic Review of the Literature. Activ. Adapt. Aging 2013, 37, 153–181. [Google Scholar]
  34. Boffetta, P.; Couto, E.; Wichmann, J.; Ferrari, P.; Trichopoulos, D.; Bueno-De-Mesquita, H.B.; Van Duijnhoven, F.J.B.; Büchner, F.L.; Key, T.; Boeing, H.; et al. Fruit and Vegetable Intake and Overall Cancer Risk in the European Prospective Investigation Into Cancer and Nutrition (EPIC). J. Natl. Cancer Inst. 2010, 102, 529–537. [Google Scholar] [CrossRef] [Green Version]
  35. Ware, J.E.; Kosinski, M. SF-36 Physical & Mental Health Summary Scales: A Manual for Users of Version 1; QualityMetric: Lincoln, RI, USA, 2001. [Google Scholar]
  36. Baldantoni, D.; Morra, L.; Zaccardelli, M.; Alfani, A. Cadmium accumulation in leaves of leafy vegetables. Ecotox. Environ. Saf. 2016, 123, 89–94. [Google Scholar] [CrossRef]
  37. HSCIC. Statistics on Obesity, Physical Activity and Diet: England, 2012; The Health and Social Care Information Centre: Leeds, UK, 2012.
  38. Stubberfield, J. The Health Benefits and Risks of Growing-Your-Own Produce in an Urban Environment. Ph.D. Thesis, Environmental Science, University of Nottingham, Nottingham, UK, 2017. [Google Scholar]
  39. Clemens, S. Toxic metal accumulation, responses to exposure and mechanisms of tolerance in plants. Biochimie 2006, 88, 1707–1719. [Google Scholar] [CrossRef]
  40. McLaughlin, M.J.; Smolders, E.; Degryse, F.; Rietra, R. Uptake of metals from soil into vegetables. In Dealing with Contaminated Sites; Swartjes, F., Ed.; Springer: Berlin, Germany, 2011; pp. 325–367. [Google Scholar]
  41. Hough, R.L.; Breward, N.; Young, S.D.; Crout, N.M.J.; Tye, A.M.; Moir, A.M.; Thornton, I. Assessing potential risk of heavy metal exposure from consumption of home-produced vegetables by urban populations. Environ. Health Persp. 2004, 112, 215–221. [Google Scholar] [CrossRef] [Green Version]
  42. Yang, J.; Guo, H.; Ma, Y.; Wang, L.; Wei, D.; Hua, L. Genotypic variations in the accumulation of Cd exhibited by different vegetables. J. Environ. Sci. 2010, 22, 1246–1252. [Google Scholar] [CrossRef]
  43. Alexander, P.D.; Alloway, B.J.; Dourado, A.M. Genotypic variations in the accumulation of Cd, Cu, Pb and Zn exhibited by six commonly grown vegetables. Environ. Pollut. 2006, 144, 736–745. [Google Scholar] [CrossRef]
  44. Intawongse, M.; Dean, J.R. Uptake of heavy metals by vegetable plants grown on contaminated soil and their bioavailability in the human gastrointestinal tract. Food Addit. Contam. 2006, 23, 36–48. [Google Scholar] [CrossRef] [Green Version]
  45. Clark, H.F.; Hausladen, D.M.; Brabander, D.J. Urban gardens: Lead exposure, recontamination mechanisms, and implications for remediation design. Environ. Res. 2008, 107, 312–319. [Google Scholar] [CrossRef]
  46. Canfield, R.L.; Henderson Jr, C.R.; Cory-Slechta, D.A.; Cox, C.; Jusko, T.A.; Lanphear, B.P. Intellectual impairment in children with blood lead concentrations below 10 μg per deciliter. N. Engl. J. Med. 2003, 348, 1517–1526. [Google Scholar] [CrossRef] [Green Version]
  47. Minh, N.D.; Hough, R.L.; Nyberg, Y.; Vinh, N.C.; Khai, N.M.; Oborn, I. Assessing dietary exposure to cadmium in a metal recycling community in Vietnam: Age and gender aspects. Sci. Total Environ. 2012, 416, 164–171. [Google Scholar] [CrossRef] [PubMed]
  48. Swartjes, F.A. Insight into the variation in calculated human exposure to soil contaminants using seven different European models. Integ. Environ. Assess. Man. 2007, 3, 322–332. [Google Scholar] [CrossRef]
  49. Bingham, S.A.; Gill, C.; Welch, A.; Day, K.; Cassidy, A.; Khaw, K.T.; Sneyd, M.J.; Key, T.J.A.; Roe, L.; Day, N.E. Comparison of dietary assessment methods in nutritional epidemiology: Weighed records v. 24 h recalls, food-frequency questionnaires and estimated-diet records. Br. J. Nutr. 1994, 72, 619. [Google Scholar] [CrossRef] [Green Version]
Figure 1. Comparison of annual household income (AHI) reported by participants in the gardening and health survey (gardeners), with estimated AHI from the East Midlands (ONS, 2017). Annual household income for gardeners was calculated using the mid-point of the categories over which AHI was assessed in question D18 from the questionnaire (Supplementary Materials).
Agronomy 12 00181 g001
Figure 2. Histogram of responses (counts) describing the amount of time gardeners spend engaged in different activities. Key: AN = ‘almost none’, AL = ‘a little’, S = ‘some’, ALT = ‘a lot’ and AA = ‘almost all’. Bars show counts in each category out of 120. Non-responses are not recorded in the figure but amounted to a maximum of three for any one category.
Agronomy 12 00181 g002
Figure 3. Number of types of produce grown per gardener surveyed. Two individuals did not grow produce whilst another two failed to respond to this section of the survey.
Agronomy 12 00181 g003
Figure 4. Gardening and lifestyle factors; (A) self-reported fruit and vegetable consumption (portions) over the previous 24 h and regularity of gardening in autumn/winter, (B) self-reported frequency of moderate exercise in the previous week and regularity of gardening in autumn/winter, (C) regularity with which participants took part in gardening activities in autumn/winter and BMI (kg m−2). Boxes show 25th, 50th and 75th percentiles; whiskers show 1.5 × IQR and * shows outliers.
Agronomy 12 00181 g004aAgronomy 12 00181 g004b
Figure 5. Scatter plot showing the relationship between gardening regularity in spring/summer and autumn/winter. Darker points indicate higher frequency of responses.
Agronomy 12 00181 g005
Table 1. Produce consumption by produce group. Consumption of produce in g/week was calculated using a conversion factor of one portion ≈ 80 g fw (NHS, 2015). Values are averages (mean) ± standard deviation.
Produce GroupConsumption
(Average Portions/Year)
Consumption
(Average g fw/Week)
Flower16 ± 1924 ± 29
Fruit124 ± 107369 ± 164
Leaf131 ± 74201 ± 114
Root137 ± 71209 ± 110
Tuber66 ± 33102 ± 51
Other1 ± 72 ± 10
Total627 ± 230960 ± 353
Table 2. Physical component summary (PCS) and mental component summary scores from the SF 36 v2. Means for individual age and gender categories were compared to means from Ware and Kolinski (2001) [35] using a t-test.
PCSMCS
GenderAgenGardening SurveyWare
(2001) [35]
Statistical DifferenceGardening SurveyWare
(2001) [35]
Statistical Difference
meanSDmeanp valuemeanSDmeanp value
Male35–44349.864.8151.970.52744.115.7950.800.183
45–541056.326.0450.900.01949.247.0549.930.764
55–641153.235.9048.050.01552.588.1452.480.967
65+3047.859.8443.510.02256.184.7051.48<0.001
Female18–34256.464.0753.100.45148.765.4646.660.683
35–44644.4610.8251.650.16449.649.2548.440.764
45–541253.497.9947.900.03451.597.3350.690.679
55–641954.374.7647.51<0.00153.116.2951.790.372
65+1553.246.0542.17<0.00155.104.8553.020.119
All 52.08.2(50)-52.37.8(50)-
Publisher’s Note: MDPI stays neutral with regard to jurisdictional claims in published maps and institutional affiliations.

