Article

De Novo Transcriptome Assembly and SNP Discovery for the Development of dCAPS Markers in Oat

1
National Institute of Crop Science, Rural Development Administration, Wanju 55365, Korea
2
Rural Human Resource Development Center (RHRDC), Rural Development Administration, Jeonju 54874, Korea
*
Authors to whom correspondence should be addressed.
Agronomy 2022, 12(1), 184; https://doi.org/10.3390/agronomy12010184
Submission received: 21 December 2021 / Revised: 9 January 2022 / Accepted: 11 January 2022 / Published: 12 January 2022

Abstract

:
Cultivated oat (Avena sativa L.) is an important cereal crop that has captured interest worldwide due to its nutritional properties and associated health benefits. Despite this interest, oat has lagged behind other cereal crops in genome studies and the development of DNA markers due to its large and complex genome. RNA-Seq technology has been widely used for transcriptome analysis, functional gene study, and DNA marker development. In this study, we performed the transcriptome sequencing of 10 oat varieties at the seedling stage using the Illumina platform for the development of DNA markers. In total, 31,187,392~41,304,176 trimmed reads (an average of 34,322,925) were generated from 10 oat varieties. All of the trimmed reads of these varieties were assembled and generated, yielding a total of 128,244 assembled unigenes with an average length of 1071.7 bp and N50 of 1752 bp. According to gene ontology (GO) analysis, 30.7% of unigenes were assigned to the “catalytic activity” of the parent term in the molecular function category. Of the 1273 dCAPS markers developed using 491 genotype-specific SNPs, 30 markers exhibiting polymorphism in 28 oat varieties were finally selected. The transcriptome data of oat varieties could be used for functional studies about the seedling stage of oat and information about sequence variations in DNA marker development. These 30 dCAPS markers will be utilized for oat genetic analysis, cultivar identification, and breeders’ rights protection.

1. Introduction

Cultivated oat (Avena sativa L.) is an important cereal crop for human food and livestock feed worldwide. Oat ranks sixth in world grain production, following corn, wheat, barley, sorghum, and millet [1]. Compared to other cereal crops, oat is more suitable for cultivation under harsh environmental conditions, such as cool–wet climates and low-fertility soil [2]. Oat, a self-pollinating plant, has an approximate 12.5 Gb genome size and is an allohexaploid with a basic chromosome number of 2n = 6x = 42, consisting of A, C, and D sub-genomes [3,4].
Recently, interest in oats as human food has increased due to their nutritional properties and associated health benefits [5]. Oat contains 12–20% high-quality protein and low fat content (<8%). The water-soluble β-glucan contained in oat seed lowers cholesterol concentration in human blood serum, leading to a reduced risk of heart disease in humans [6,7,8]. Oat contains an antioxidant compound known as avenanthramide-C, which helps with recovery from Alzheimer’s disease symptoms, and memory and behavioral impairments [9]. For these reasons, the human demand for oat consumption has increased [10]. To meet the global oat demand, developing new and improved oat varieties with disease resistance, abiotic stress, and fortified with bioactive ingredients for human health has become necessary. To develop an oat variety, the genetic resources originating from various regions with useful genes have significant value in the oat breeding program. The conservation, evaluation, and utilization of genetic resources should also be carried out. However, the farming of landraces, adapted locally and genetically more diverse, was abandoned in the mid-20th century after the green revolution took place, and landraces were rapidly displaced by modern and semi-dwarf varieties with higher production capabilities [11]. Hence, in the process of selective breeding, the genetic diversity of oats is being eroded [12].
Molecular markers and genome information can be successfully utilized for the analysis of genetic diversity and molecular breeding to improve agronomically valuable characteristics in crops. The reference genomes were recently released for several crops [13,14,15,16,17]. In addition, technological advances in sequencing have drastically reduced the cost, and these advances offer new approaches for the development of a mass number of molecular markers. It is possible to detect the mass number of sequence variations, including single-nucleotide polymorphisms (SNPs), insertion–deletion polymorphisms (InDels), and simple sequence repeats (SSRs), by taking advantage of next-generation sequencing (NGS) technologies to compare the large-scale resequencing of whole genomes to high-quality reference genome sequences [18]. However, due to the complexity of highly repetitive DNA sequences and the large size of the allopolyploid genome, oat has experienced less progress in DNA marker development and genome sequencing than other cereal crops [19].
Several kinds of DNA markers have been employed to identify the genetic relationships in oat genetic resources. Genetic diversity has been studied using restriction fragment length polymorphism (RFLP) markers, based on a hybridization technique, in North American oat varieties [20]. Random amplified polymorphic DNA (RAPD) analysis was conducted to detect the genetic variations within Chinese and western oat accessions and compare the relative level of genetic diversity between two accession groups [21]. The amplified fragment length polymorphism (AFLP) marker was used to reveal the transition in allelic diversity in Canadian oat varieties [12] and identify the genetic diversity among sea oat varieties from the United States and oat varieties originating worldwide [22,23]. Li et al. [24] developed microsatellite markers using a microsatellite-enriched DNA library and discovered the relationships among Avena species and oat varieties. The genetic diversity of Polish landraces, Nordic varieties, and Nordic landraces were also identified using simple sequence repeat (SSR) markers in oat [25,26]. Tinker et al. [27] developed diversity array technology (DArT) markers, which have the benefit of whole-genome profiling without the need for sequence information and analyzed genetic diversity in 182 accessions of cultivated oat of worldwide origin. Genotyping-by-sequencing (GBS), a parallel high-throughput genotyping technique based on sequencing, was developed for complexity reduction in large complex genomes of crops. GBS was utilized for analysis of the genetic diversity, population structure, and genome-wide association study (GWAS) in oat germplasms [3,28,29].
The identified benefits of NGS include its robustness, cost-effectiveness, and ability to make high-throughput transcriptome analysis possible in crops. RNA-Seq is a powerful tool for transcriptome studies and is especially valuable for the sequence analysis of crops without a reference genome sequence. The large quantity of assembled transcriptomes can be used for gene prediction, gene annotation, gene ontology, gene expression level analysis, and identifying the regulation system of metabolic pathways in plant organisms [30,31,32,33,34]. RNA-Seq has been used for detecting sequence variations (SNPs, SSRs) to develop DNA markers without a reference genome [35,36,37,38]. In oat, a small number of markers have been developed using RNA-Seq. Oliver et al. [39] developed SNP markers using transcriptome data from four oat varieties. The genome sequence of oat has recently been released (PepsiCo OT3098, https://wheat.pw.usda.gov/GG3/graingenes-downloads/pepsico-oat-ot3098-v2-files-2021, accessed on 5 January 2022). Using this genomic information will bring progress to oat research. Nevertheless, the application of oat genome sequencing remains a challenge due to the difficulty of alignment after the sequencing process and the sequencing cost of oat’s large, complex genome. Further progress should be made in developing molecular markers and studying the genome for oat molecular breeding in parallel with the conservation and evaluation of genetic resources for their utilization.
In this study, we employed the high-throughput paired-end Illumina X platform to analyze transcriptome data in cultivated oat varieties. The specific objectives were (1) to construct transcriptome libraries from 10 oat varieties at the seedling stage and perform de novo transcriptome assembly for building a unigene set, (2) to perform a BLAST search and gene annotation analysis using public databases, (3) to identify genotype-specific SNPs by aligning the reads generated from transcriptome sequencing, (4) to develop dCAPS markers using SNPs and validate the dCAPS markers, and (5) to analyze the genetic distance among 28 oat varieties.

2. Materials and Methods

2.1. Plant Materials

Ten oat varieties were used for transcriptome analysis. Of the 10 oat varieties, 8 were bred at the National Institute of Crop Science (NICS), RDA, Korea. The other two oat varieties, Gehl and Swan, were bred at Agriculture and Agi-Food (AAFC), Ottawa, Canada, and the Department of Agriculture and Food, Western Australia (DAFWA), respectively (Table S5). Seeds from each oat variety were sown in a conical plastic tube (3 cm × 11 cm) filled with horticultural soil and grown under long-day photoperiod conditions (16/8 h light/dark) in a greenhouse in NICS, RDA, Jeonju, Korea. Water was supplied to seedlings as needed. Young leaves of each of the oat varieties were excised at 21 DAS (days after sowing) and stored at −80 °C until RNA extraction. Validation of genotype-specific SNPs was carried out using the 10 oat varieties used in transcriptome analysis and 18 additional oat varieties bred at NICS (Table S5).

2.2. Total RNA Extraction and Transcriptome Sequencing

Total RNA was extracted from leaf samples of each oat variety using a Hybrid-R kit (GeneAll, Seoul, Korea) according to the manufacturer’s protocol and was preserved at −80 °C. RNA quality and quantity were examined using a Bioanalyzer (Agilent Technologies, CA, USA), and RNA with a >7.0 RNA integrity number (RIN) was used for preparing the transcriptome sequencing library [40]. A quantity of 2 μg of the total RNA was used to construct paired-end sequencing libraries using an Illumina TruSeq RNA Sample Preparation Kit (Illumina, CA, USA), according to the manufacturer’s protocol. Library sequencing was conducted by outsourcing to Phygen (Suwon, Korea). Sequencing libraries of each oat variety were sequenced using the Illumina HiSeq X platform (Illumina, CA, USA), and paired-end reads of 151 bp were generated. All transcriptome sequences of the 10 oat varieties were deposited at NABIC (National Agricultural Biotechnology Information Center, http://nabic.rda.go.kr/ostd/basic/ngsSraList.do, accessed on 5 January 2022) with the accession numbers NN-7228-000001, NN-7230-000001, NN-7231-000001, NN-7232-000001, NN-7236-000001, NN-7237-000001, NN-7238-000001, NN-7239-000001, NN-7240-000001, and NN-7244-000001.

2.3. De Novo Assembly and Generation of the Unigene Set

To obtain high-quality clean reads, low-quality reads, duplicated reads, and adapter sequences were removed using Trimmomatic (v. 0.38) according to the following default parameters: removing a read with an average base quality (Q20) below 20 and removing a read less than 50 bp [41]. De novo assembly of cleaned, high-quality reads was carried out using Trinity (v. 2.8.4) with default parameters [42]. Subsequently, a two-step process was performed to eliminate redundant transcript sequences. Redundant transcript sequences were removed from the assembled transcript sequences using CD-HIT-EST (v. 4.7) with a similarity threshold of 90%, and then TGICL was used to remove the remaining redundant sequences from the transcript sequences generated in the first step, according to Pertea et al. [43] and Li and Godzik [44]. Only reads with a read-mapping depth of >10 were selected to generate the final non-redundant transcript sequences. The final non-redundant transcript sequences were designated as a unigene set and were used for further study.

2.4. Gene Functional Annotations

All assembled unigenes were searched against the non-redundant protein database (nr) of the National Center for Biotechnology Information (NCBI) using BLASTX mode in DIAMOND with a cutoff E-value of 10−5 for taxonomic classification [45]. With the nr annotation, all assembled unigenes were assigned gene ontology (GO) terms according to molecular function, biological process, and cellular component ontologies using Blast2GO (v. 5.2) [46]. ORFs (open reading frames) were predicted from the assembled unigenes using Transdecoder (v. 5.5) with a selection criterion of the longest ORFs by comparison with the Pfam database [47]. The predicted ORFs were used for the cluster of orthologous groups (COG) analysis and SNP annotation within ORFs. Deduced protein sequences of the ORFs were used for similarity searches using the BLASTP [48] mode in DIAMOND against the COG database [49] with a cutoff E-value of 10−5, and COG IDs and COG functional categories were assigned to the protein sequences.

2.5. SNP Identification

The high-quality, clean reads of each sample were mapped to the assembled reference sequences (all assembled unigene) using BWA (v. 0.7.17) with default parameters [50]. SAMtools (v. 1.9) was used to convert the mapping results into BAM files and filter the unmapped and non-unique reads [51]. Picard package v. 1.112 was used to remove the duplicated reads generated during the PCR amplification process. SNP calling was performed using the HaplotypeCaller module of the Genome Analysis Toolkit (GATK, v. 3.5) [52]. Raw VCF files were filtered to select significant SNPs with the following parameters: min coverage 5, max coverage 250, min quality 20, and SNP ratio ≥ 0.9. SNPs within predicted coding regions were classified as either non-synonymous or synonymous.

2.6. SNP Primer Design and SNP Validation

Genotype-specific SNPs were selected by comparing the selected significant polymorphic sites among cultivars with the following parameters: SNP ratio 1 and SNP depth ≥ 10. dCAPS Finder (v. 2.0) [53] was used for the design of derived cleaved amplified polymorphic sequence (dCAPS) markers based on the ±500 flanking sequences of genotype-specific SNPs from unigenes with the following parameters: mismatch 1 and 2, primer size 17–25 bp, GC content 50%, Tm 50–60 °C, and amplicon size 200–500 bp. Genomic DNA was isolated from the young leaves of each of the 28 varieties (Supplementary Table S4) using the Wizard Genomic DNA Purification Kit (Promega, WI, USA), according to the manufacturer’s protocol. PCR was performed in a total volume of 24 μL containing 2 μL of genomic DNA (50 ng/μL), 0.1 μL of Taq polymerase (5 unit/μL, Solgent, Daejeon, Korea), 1 μL of each primer (20 pmol/μL), 0.5 μL of dNTP mix (10 mM/μL), and 2.4 μL of 10× buffer. Touchdown PCR was employed for the PCR amplification of each sample with an initial denaturation at 95 °C for 5 min, followed by 10 cycles of the touchdown cycling step at 95 °C for 30 s, 60–66 °C for 20 s (auto delta, −0.6 °C/cycle), and 72 °C for 30 s, followed by 25 cycles at 95 °C for 30 s, 60 °C for 20 s, 72 °C for 30 s, and a final extension at 72 °C for 5 min [54]. The PCR products of each dCAPS marker were treated with a restriction enzyme at 37 or 52 °C for 1 h.

2.7. Analysis of Genetic Diversity

The genetic diversity statistics for each dCAPS marker, such as the number of alleles (Na), major allele frequency (MAF), gene diversity (GD), heterozygosity (Het.), and polymorphism information content (PIC), were estimated using PowerMarker (v. 3.25) [55]. A phylogenetic tree was constructed with MEGA X [56] using the unweighted pair group method with the arithmetic mean (UPGMA) statistical method [57] for the 28 oat varieties.

3. Results

3.1. Sequencing and Assembly of the Transcriptome

The RNA of each of the 10 oat varieties was extracted, and quality analysis was carried out. RNA samples with RIN 7 or higher were used for constructing paired-end sequencing libraries (Table S1). In total, 33,197,992~38,373,044 raw reads (an average of 36,568,569) were produced using the Illumina HiSeq X platform (Table 1).
These reads had an average GC content of 55.0%, and the Q20 of raw reads exceeded 98% across the 10 oat varieties (Table 1). To obtain high-quality clean reads, raw sequencing data were processed to remove low-quality reads, duplicated reads, and adapter sequences using Trimmomatic (v. 0.38). After these processes, trimmed reads of 31,187,392~41,304,176 were generated. The trimmed reads of the 10 oat varieties were assembled to generate the unigene set using Trinity (v. 2.8.4). Redundant transcript sequences were removed from the assembled transcript sequences three times using CD-HIT-EST (v. 4.7), and TGICL was used to remove the remaining redundant transcript sequences. Finally, a total of 128,244 assembled unigenes with a depth > 10 representing the transcript of the 10 oat varieties was used as the reference sequence (Table 2 and Table S2).
The assembled unigenes had 301,132,396 total reads with a total length of 137,438,033 bp (Table 2). The average length and N50 of the assembled unigenes were 1071.7 bp and 1752 bp, respectively (Table 2). Of the 128,244 assembled unigenes, 109,088 (85.1%) ranged in size from 1 to 2 kb, and 19,156 (14.9%) were longer than 2 kb (Figure 1).
Partial and complete ORFs were predicted from the 128,244 assembled unigenes. Among the predicted ORFs, 56,483 were partial ORFs, and 32,202 were complete ORFs (Table S2).

3.2. Functional Annotation

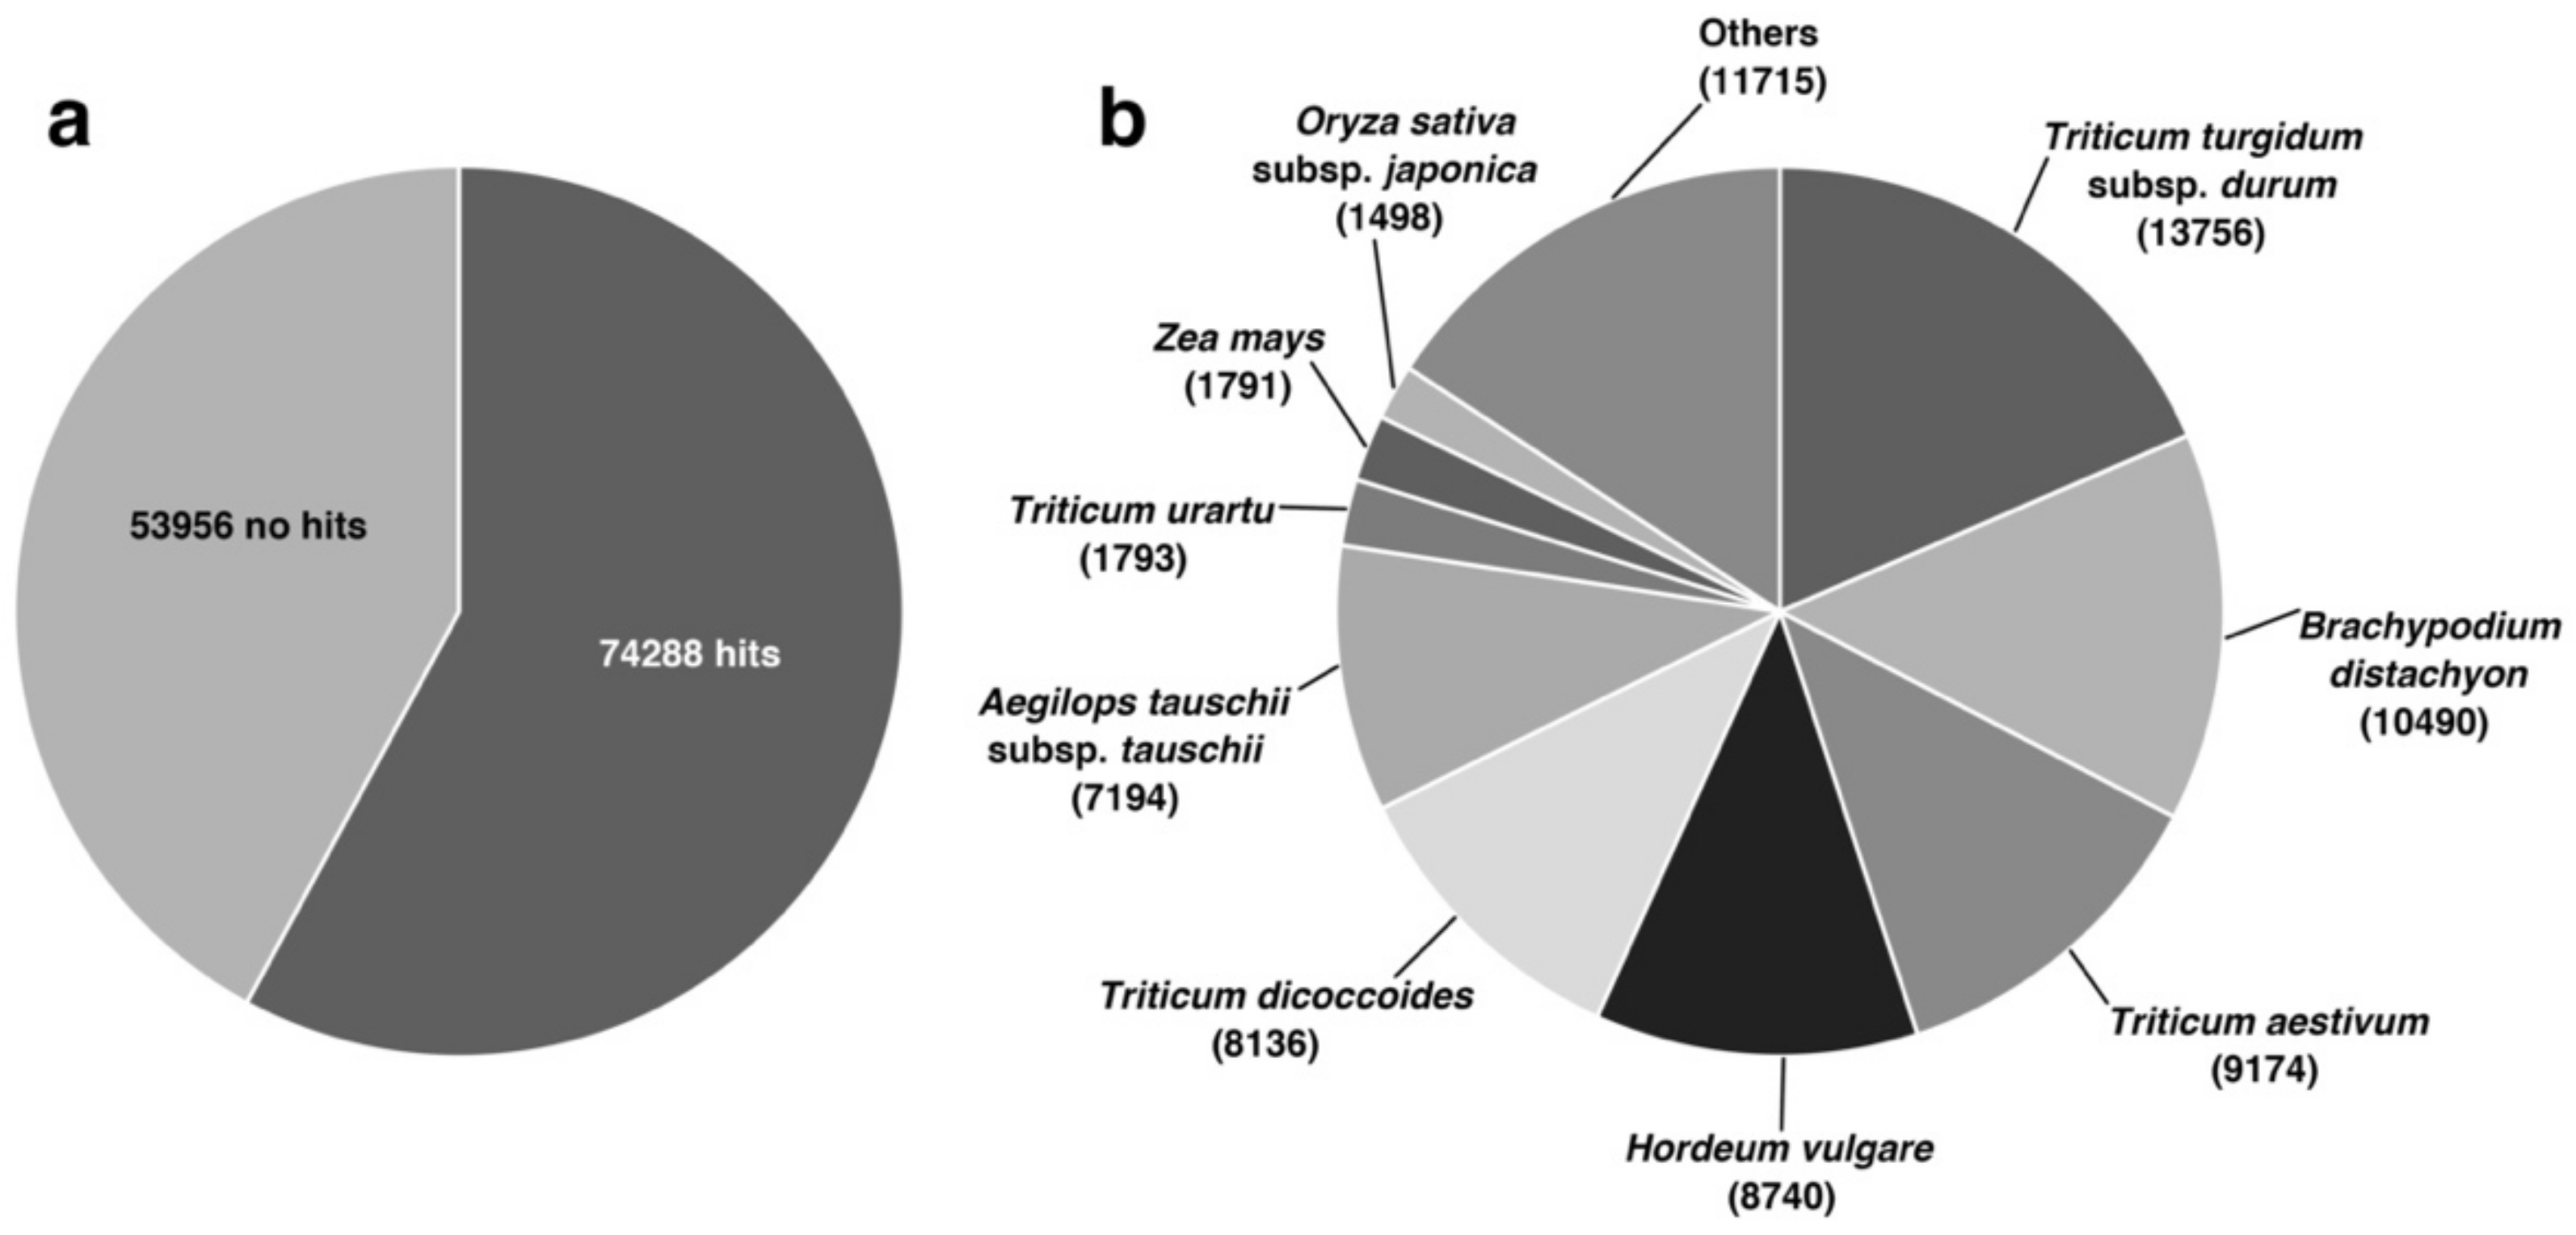
Of the 128,244 unigenes, 74,288 (57.93%) had homologs in the NR database, while 47,758 (37.24%) had similarities to the NR database, and 12,537 (9.78%) unigenes were obtained that matched genes in the COG database. However, a total of 53,956 (42.07%) unigenes could not be annotated by any database (Table S3). In total, 128,244 assembled unigenes were searched against the nr NCBI protein database with a cutoff E-value of 10−5 using BLASTX mode in DIAMOND. The entire unigene set was classified into 74,288 (57.9%) with blast hits and 53,956 (42.1%) without blast hits (Figure 2a).
After taxonomic classification analysis, among the top BLASTx hits, 13,756 (18.5%) unigenes had homology to Triticum turgidum subsp. durum, followed by Brachypodium distachyon (10,490; 14.1%), Triticum aestivum (9174; 12.3%), and Hordeum vulgare (8740; 11.8%) (Figure 2b).

3.3. Gene Ontology (GO)

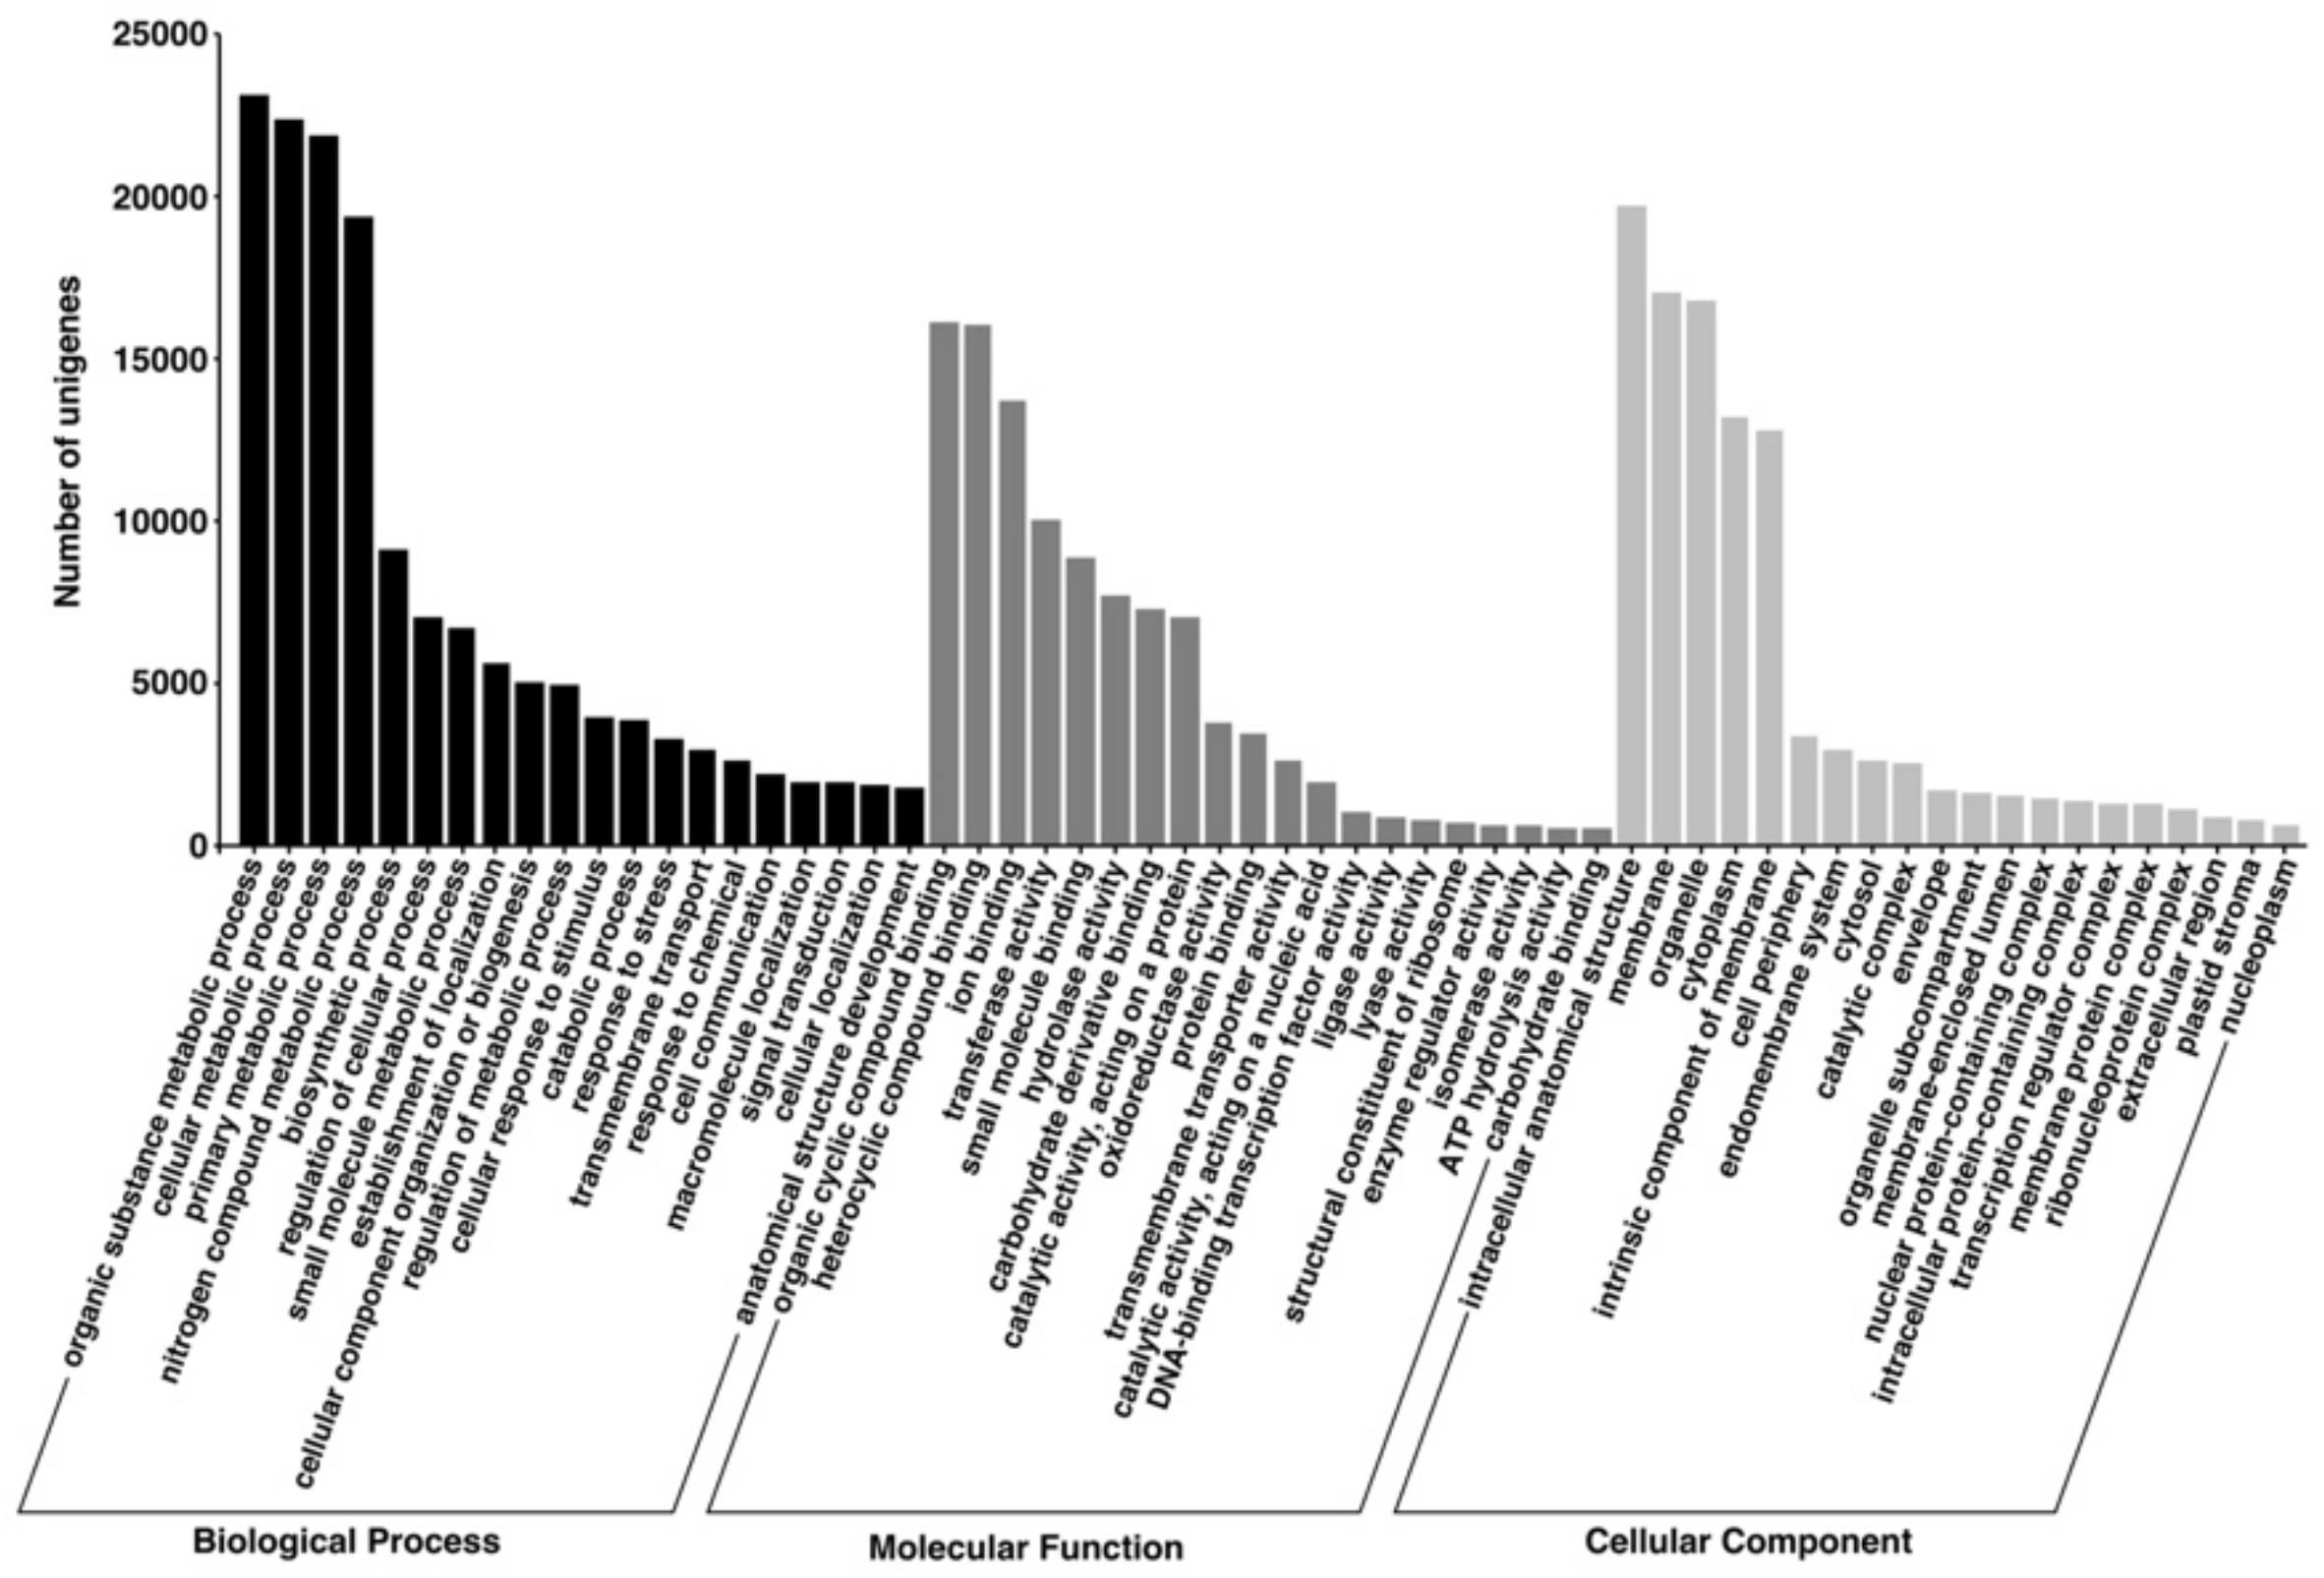
GO terms were used to assign all assembled unigenes according to three main categories: molecular function, biological process, and cellular component. Each of the three main categories was divided into the 20 most representative subcategories. Biological process accounted for the majority of the GO terms (151,878; 41.96%), followed by molecular function (104,807; 28.96%) and cellular component (105,256; 29.08%) (Figure 3).
Within the biological process category, “organic substance metabolic process” (23,126; 6.39%) was the predominant subcategory, followed by “cellular metabolic process” (22,391; 6.19%), “primary metabolic process” (21,832; 6.03%), and “nitrogen compound metabolic process” (19,339; 5.34%). Within the molecular function category, “organic cyclic compound binding” (16,092; 4.45%), “heterocyclic compound binding” (16,068; 4.44%), and “ion binding” (13,699; 3.78%) were prominently represented, and within the cellular component, “intracellular anatomical structure” (19,699; 5.44%), “membrane” (17,014; 4.70%), and “organelle” (16,802; 4.64%) were the most common.

3.4. Cluster of Orthologous Groups (COG)

The COG database was used to assign all assembled unigenes for functional prediction and classification. In total, 12,537 unigenes were annotated and classified into 25 COG categories (Figure 4).
The cluster for “signal transduction mechanisms” formed the largest group (1446; 10.36%) followed by “post-translational modification, protein turnover, and chaperones” (1371; 9.82%), “translation, ribosomal structure, and biogenesis” (1301; 9.32%), “carbohydrate transport and metabolism” (1237; 8.86), and “general function prediction only” (1208; 8.65%). Only a few unigenes were assigned to “RNA processing and modification”, “chromatin structure and dynamics”, and “extracellular structures”. In addition, 207 unigenes were assigned to “function unknown”, and the “nuclear structure group” had no assigned unigenes.

3.5. SNP Discovery and Validation

The unigene set, which was assembled through all transcripts of the 10 oat varieties, was used as a “reference sequence” for mining SNPs. Reads of each oat variety, generated by sequencing the cDNA libraries, were mapped to all assembled unigenes. Among the 10 oat varieties, 9,263,540~12,241,220 reads were mapped uniquely to all assembled unigenes with an 87.7% average mapping rate and a 15.78 average depth (Table 1). In total, 6634 putative bi-allele SNPs were identified among 3537 unigenes, corresponding to an average of 0.05 SNPs every 1 kbp (1 SNP every 20.7 kbp) (Table 3 and Table 4).
Of the 6634 putative SNPs, 5248 SNPs were substitutions of the ORF-predicted protein-coding sequence of 2889 unigenes. Among 5248 substitute SNPs, 1228 SNPs were non-synonymous, which could cause amino acid changes in 777 unigenes. In total, 1386 SNPs were detected on unigenes, which could not predict the ORFs. Of the total putative SNPs, non-synonymous substitutions accounted for 18.5%. Transition SNPs were predominant, with 3880 (58.5%) detected, while 2754 (41.5%) transversion SNPs were identified (Table 4). Transition variations consisted of 1941 A/G and 1939 C/T. In transversion variations, C/G was the most highly represented, with 1018 SNPs identified, and A/T was the least common, with 440 SNPs identified.
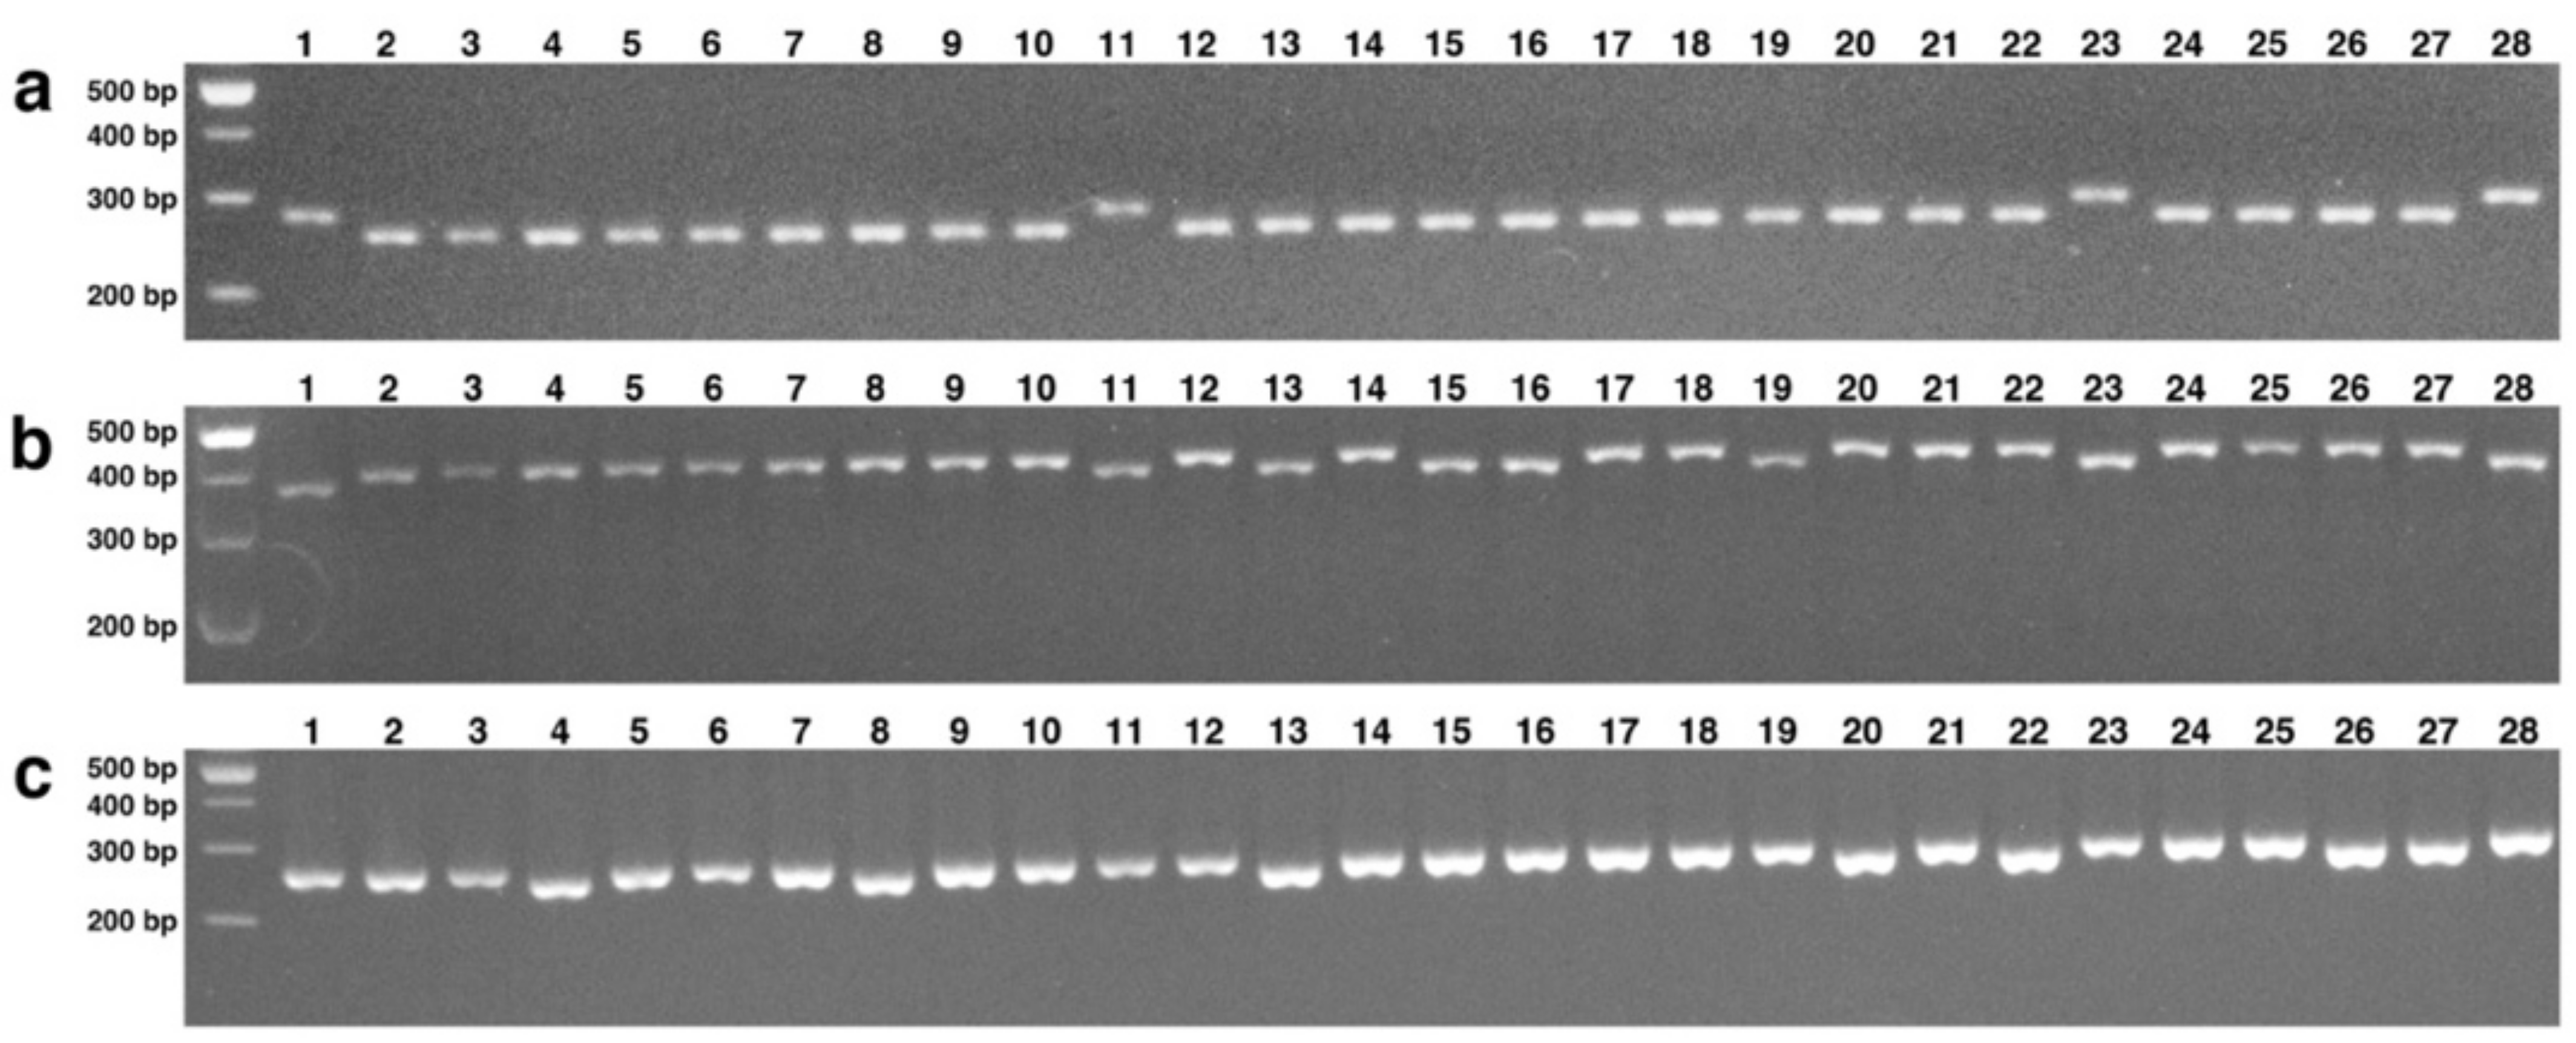
To develop the molecular markers, 636 genotype-specific SNPs were selected by comparison of significant polymorphic sites among the 10 oat varieties with the following parameters: SNP ratio 1; SNP depth ≥ 10 (Table S4). The genotype-specific SNPs were used to develop dCAPS markers using dCAPS Finder (v 2.0) to generate the mismatches near SNPs for the recognition site of restriction endonuclease. Of 636 genotype-specific SNPs, 571 SNPs could generate the mismatch nucleotides for the development of dCAPS markers. At least one dCAPS marker was developed from one SNP, and a total of 6422 dCAPS markers were developed. To evaluate whether each dCAPS marker worked in the PCR experiment and showed the polymorphisms between oat varieties, 1273 dCAPS markers that met the following conditions were selected: TM difference between primer pairs >10 °C, recognition site of restriction endonuclease = 1, and usage of commercially available 38 restriction endonuclease including HindIII. As a result of electrophoresis and enzyme digestion, a total of 30 dCAPS markers produced two distinct bands similar to the expected size and were easy to distinguish with a polymorphic band in the 28 oat varieties (Figure 5a,b).
OH-6-1 and SH-20-1 were used as InDel markers because they represent the polymorphisms even without restriction enzyme treatment (Figure 5c).

3.6. Analysis of Genetic Diversity

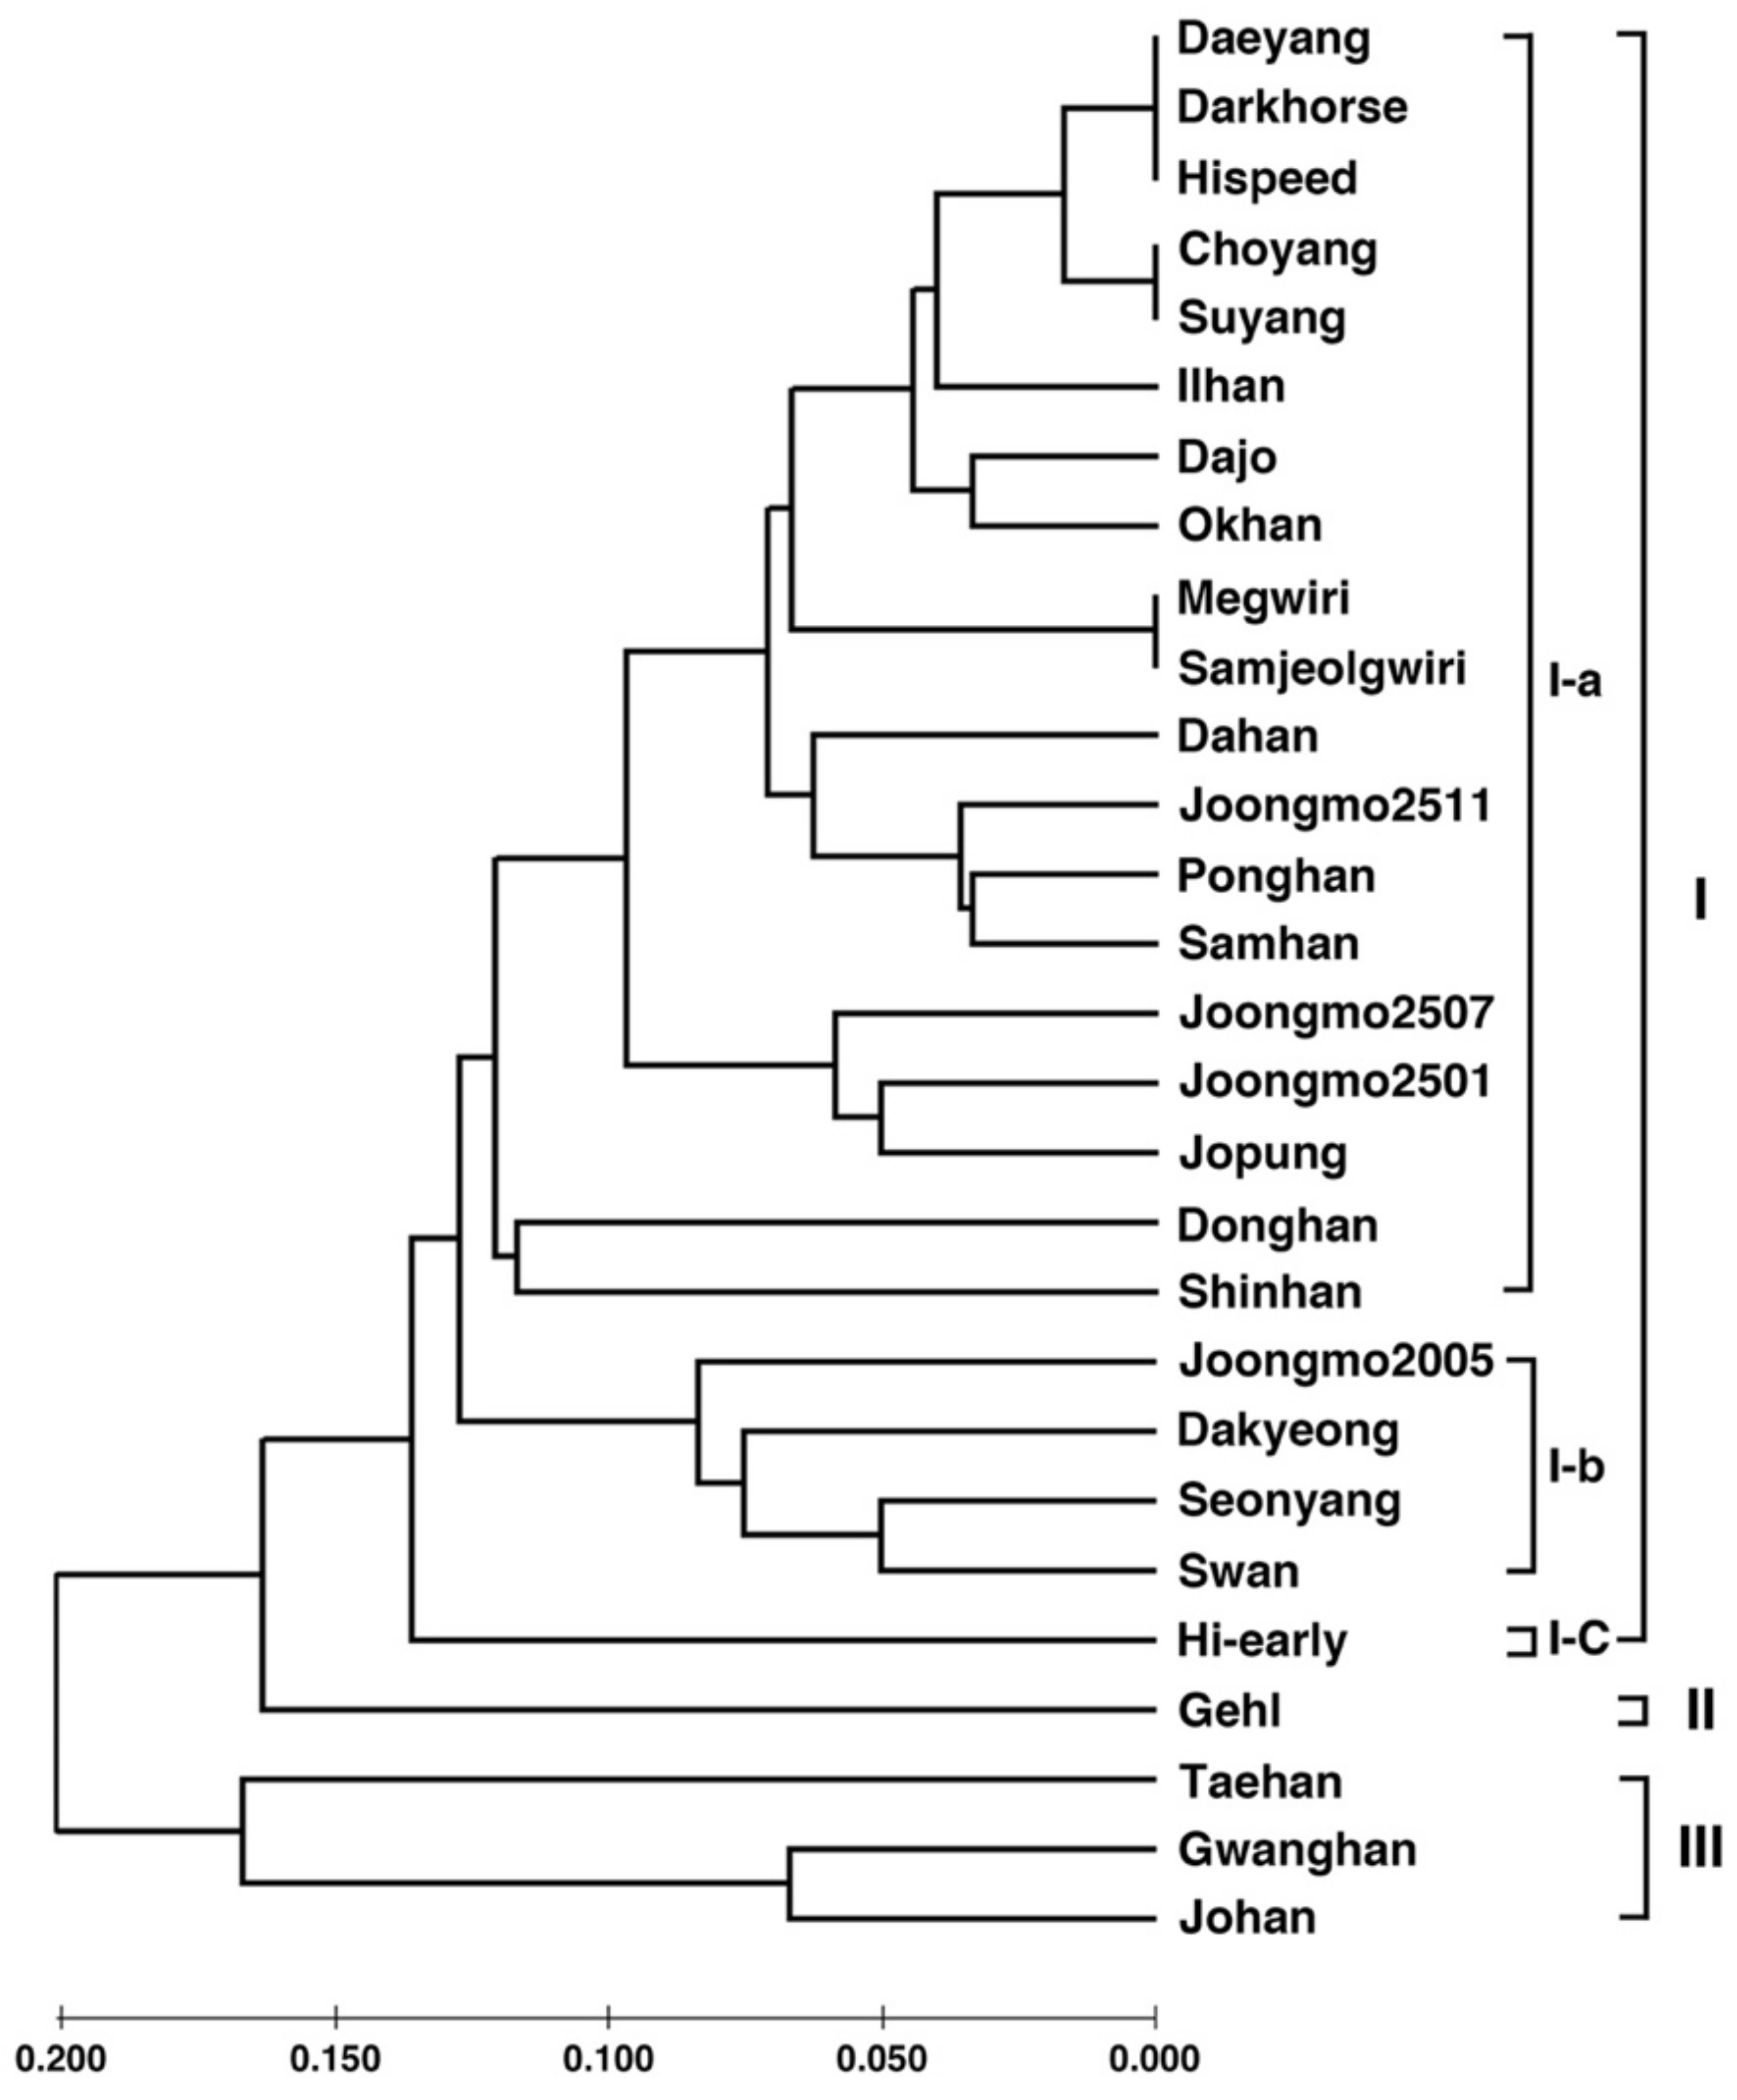
The genetic diversity of 30 polymorphic dCAPS markers in the 28 oat varieties was analyzed using PowerMarker (v. 3.25). The number of alleles (Na) of each dCAPS marker, developed using bi-allele SNPs, was two (Table S6). All polymorphic dCAPS markers had only two types of bands representing the homogeneous genotype; thus, the heterozygosity was zero. The PIC of each polymorphic dCAPS marker ranged from 0.354 to 0.067, with an average of 0.203. The gene diversity of each polymorphic dCAPS marker ranged from 0.069 to 0.459, with an average of 0.235. A UPGMA tree was constructed using the band scores of 30 dCAPS markers from the 28 oat varieties. The oat varieties were divided into three groups according to the phylogeny tree (Figure 6), and group I consisted of 24 accessions, which were further divided into three subgroups.

4. Discussion

Next-generation sequencing technology makes it possible, with less money and time, to generate a large amount of sequence data for crops. RNA-Seq has been performed for transcriptome analysis, functional annotation, and sequence variation identification. In particular, it is a powerful tool for developing DNA markers using sequence variation in crops with no reference genome and a large, complex genome based on de novo transcriptome assembly. The Illumina short read-length platforms produce higher coverage and lower sequencing cost per nucleotide compared with long read-length platforms and have been used for de novo transcriptome assembly along with the advances in read sequencing technology and computational tools. In several crops, including sugarcane [37], peanut [35], sainfoin [58], alfalfa [59], carrot [60], radish [61], sweet potato [62], and pumpkin [63], sequence variations (SNPs, InDels, and SSRs) have been discovered using the Illumina platform for DNA marker development. In oat, the number of available molecular markers for genetic studies and other purposes is insufficient. Moreover, genome research in oat has lagged relative to that of the other main crops because oat has a large complex allopolyploid genome. Therefore, more DNA markers need to be developed to accelerate the genetic improvement of oat.
In this study, we obtained approximately 343 Gb of clean reads from 10 oat varieties and assembled a unigene set consisting of 128,244 contigs used as a reference sequence with a mean size of 1071 bp and an N50 of 1752 bp (Table 1 and Table 2). The N50 value and mean length of the unigene set were much higher than those of the previously reported reference transcriptomes in oat [64,65]. The N50 value is a predictive factor for assembly quality [66]; therefore, this result indicated that the assembled unigenes in this study were of high quality and suitable for annotation. The number of assembled unigenes vary greatly depending on the experiments (182,267 [65], 186,035 [64], 128,414 [4], and 252,458 [67].
For functional annotation of all assembled unigenes, we employed software that utilizes a public database. Of all the assembled unigenes, 57.93% showed homologs in the public database and were assigned at least one functional annotation (Table S3). However, a total of 42.07% unigenes were not mapped to any database, likely due to the short read sequences, the presence of non-coding transcripts among the assembled unigenes, and the imperfection of the public databases [68,69,70]. The short length unigenes, 200–300 bp, were the most frequent (Figure 1). Zhang et al. [65] also reported that a large number of unannotated unigenes would occur as short-length unigenes in oat. Furthermore, the unannotated unigenes are more likely to represent either oat-specific genes or truncated transcripts derived from less conserved genes or untranslated regions [71]. In taxonomic classification analysis, 14.1% of unigenes had homology to Brachypodium distachyon, which was the plant species with the second-highest homology to all assembled unigenes in this study (Figure 2). Previous studies have suggested that the genomic information of Brachypodium distachyon could be usefully employed for assisting oat genetics and genomic research due to the paralogy relationships in the genomes despite the differences in genome size and ploidy [72,73]. In this study, unigenes assigned to the most representative GO terms were likely to be specific genes related to seedling development. In the molecular function category, a high proportion (30.7%) of unigenes were assigned to the “catalytic activity” of the parent term (Figure 3). This result is likely to reveal the physiological phenomenon by which the developmental seedling dedicates several resources to the catabolism of storage products (including carbohydrates and proteins) in seeds, which is subsequently remobilized for the growth of the shoot and root system [58]. Our transcript data collection might provide insights into the transcriptome level during oat seedling development.
SNPs are the most abundant sequence variation present between individuals within the same species [74]. SNPs have the following characteristics: evenly distributed throughout the genome in most plants, high frequency and density, high genotyping efficiency, and analytical simplicity [75]. As a result of these advantages, SNP markers have been widely used for variety identification, genetic map construction, and marker-assisted selection (MAS). We identified a total of 6634 SNPs after mapping reads of each of the 10 oat varieties on all assembled unigene sets as the reference sequence. The frequency of SNPs in this study was 0.05 SNPs/kbp, much lower than that of radish (1.32 SNPs/kbp), carrot (1.36 SNPs/kbp), cotton (1.65 SNPs/kbp), red clover (0.67 SNPs/kbp), and sesame (0.15 SNPs/kbp) [60,61,76,77,78]. Differences in SNP frequency might be due to genetic background, sequencing data sizes, SNP-detection criteria, various genome compositions, domestication history, reproductive habits (autogamous or allogamous), and the diversity of the populations under assessment [61,79]. In particular, the genetic distance between Korean oat varieties was very close; this might be due to the similar genetic background to other varieties, such as Choyang and Suyang, which have the same parents (Figure 6, Table S5). Introducing foreign varieties and using genetically close parents provide benefits that reduce the breeding period and improve the selection efficiency in the breeding program of a minor crop, such as oat. In total, 6634 SNPs were identified among the 10 oat varieties, of which 3880 (58.5%) transition SNPs were more dominant, while 2754 (41.5%) SNPs were transversions. This result is similar to that of several crops, including radish, carrot, cotton, cabbage, field pea, and Kabuli chickpea, in previous studies [36,60,61,79,80,81]. The frequency of transition SNPs is generally higher than that of transversion SNPs. During natural selection, transition is more acceptable because it is more likely to produce synonymous variations in protein-coding sequences compared with transversion [82].
We tested 1273 dCAPS markers, developed at a rate of 2~3 caps markers per SNP using 491 of the 571 SNPs capable of generating mismatches of adjacent SNPs for the recognition sites of restriction endonucleases, worked in PCR experiments. These dCAPS markers satisfied the following conditions: TM difference between primer pairs > 10 °C, recognition site of restriction endonuclease = 1, and the use of commercially available 38 restriction endonuclease including HindIII. A total of 30 dCAPS markers, developed using different SNPs, successfully amplified a single band and showed polymorphism in the oat varieties. Of the 491 genotype-specific SNPs, only a small proportion of 30 (6.1%) was verified using dCAPS markers. In most cases, if one marker out of a series of markers with different mismatch sequences developed using the same SNP does not work, neither does the other marker. The reason for this is most likely sequence differences due to the occurrence of mutations in the template DNA to which the primers are complementary. The PCR experiment will fail with high probability when the primer is developed using transcriptome sequences. Primarily, the reads generated from transcriptome sequencing are derived from mature RNA, which does not contain intron sequences. If one of the primers is developed using the junction sequence of two exons in the RNA, this primer set will not work in the PCR experiment because the primer will lose the binding site in its complementary DNA sequence. Incorrect assemble of reads can also lead to PCR amplification failures. Primers can also cause size differences in PCR products due to the presence or absence of repeats, InDels, and/or introns in the template DNA [63]. In this study, two markers, OH-6-1 and SH-20-1, which showed polymorphisms based on differences in band size in the oat cultivars, were used as InDel markers without restriction enzymes applied (Figure 5c). In addition, a dCAPS marker can cause multiple bands in gel electrophoresis due to the duplication sequences in chromosomes and the sequence homology between sub-genomes. We did not select the dCAPS marker that generated multiple bands to increase the accuracy and efficiency when classifying bands during the genotyping process in oat varieties. Accordingly, the number of selected dCAPS markers and verified SNPs would have decreased. For the development of DNA markers using sequence variations between varieties with similar genetic backgrounds, it would be efficient to use sequence variations, such as SSR and InDel, together with SNPs to complement SNPs, which have fewer variations in conserved regions.

5. Conclusions

We performed the transcriptome sequencing of 10 oat varieties at the seedling stage using the Illumina sequencing platform in order to identify the sequence variations. RNA-Seq is a useful method for high-throughput sequence variation discovery in non-model plants with large, complex genomes and no reference sequence. In total, 571 genotype-specific SNPs were selected and subsequently used for the development of dCAPS markers. In this study, 30 dCAPS markers were sufficient to discriminate Korean oat varieties, despite the low proportion of polymorphic markers and validated SNPs. The transcriptome information provides a valuable source for functional studies about the seedling stage of oat. The dCAPS markers developed using non-synonymous SNPs elucidate the relationships between the markers and nutritional properties, resistance to abiotic and biotic resistance, and other important agronomic traits in oat. The developed markers will be utilized for genetic analysis, cultivar identification, and breeders’ rights protection in Korean oat varieties.

Supplementary Materials

The following are available online at https://www.mdpi.com/article/10.3390/agronomy12010184/s1, Table S1: RNA used for cDNA library construction. Table S2: Summary of redundant sequence removal for de novo assembly and ORF prediction of assembled unigenes. Table S3: Summary of functional annotation of 128,244 assembled unigenes. Table S4: Summary of genotype-specific SNPs in 10 oat varieties. Table S5: List of 28 oat varieties used in this study. Table S6: Characteristics of 30 dCAPS markers and the genetic diversity detected in 28 oat varieties.

Author Contributions

Conceptualization, K.-H.K., J.-H.S. and Y.-M.Y.; Methodology, T.-H.K. and J.-H.P.; Validation, T.-H.K., J.-H.P. and Y.-M.Y.; Formal Analysis, T.-H.K., J.-H.P. and Y.-M.Y.; Investigation, T.-H.K., J.-C.P. and J.-H.P.; Resources, J.-C.P., J.-H.P., Y.-K.K. and Y.-M.Y.; Data Curation, T.-H.K.; Writing—Original Draft Preparation, T.-H.K.; Writing—Review & Editing, T.-H.K. and T.-I.P.; Visualization, T.-H.K.; Supervision, T.-H.K., T.-I.P. and Y.-M.Y.; Project Administration, T.-H.K. and Y.-M.Y.; Funding Acquisition, T.-I.P. and Y.-M.Y. All authors have read and agreed to the published version of the manuscript.

Funding

This work was supported by the Cooperative Research Program for Agriculture Science and Technology Development (Project title: development of molecular markers for identification of Korean oat varieties, Project No.: PJ014209022021) at the Rural Development Administration, Republic of Korea.

Institutional Review Board Statement

Not applicable.

Informed Consent Statement

Not applicable.

Data Availability Statement

All transcriptome sequences used in this work were deposited at NABIC (National Agricultural Biotechnology Information Center, http://nabic.rda.go.kr/ostd/basic/ngsSraList.do, accessed on 5 January 2022) with the accession number NN-7228-000001, NN-7230-000001, NN-7231-000001, NN-7232-000001, NN-7236-000001, NN-7237-000001, NN-7238-000001, NN-7239-000001, NN-7240-000001, and NN-7244-000001.

Conflicts of Interest

The authors declare no conflict of interest.

References

  1. Strychar, R.; Webster, F.; Wood, P. World oat production, trade, and usage. In Oats: Chemistry and Technology; AACC International, Inc.: St. Paul, MN, USA, 2011; pp. 1–10. [Google Scholar]
  2. Hoffman, L.A. World production and use of oats. In The Oat Crop; Springer: Berlin/Heidelberg, Germany, 1995; pp. 34–61. [Google Scholar]
  3. Bekele, W.A.; Wight, C.P.; Chao, S.; Howarth, C.J.; Tinker, N.A. Haplotype-based genotyping-by-sequencing in oat genome research. Plant Biotechnol. J. 2018, 16, 1452–1463. [Google Scholar] [CrossRef] [PubMed] [Green Version]
  4. Wu, B.; Hu, Y.; Huo, P.; Zhang, Q.; Chen, X.; Zhang, Z. Transcriptome analysis of hexaploid hulless oat in response to salinity stress. PLoS ONE 2017, 12, e0171451. [Google Scholar] [CrossRef]
  5. Ames, N.; Rhymer, C.; Storsley, J. Food oat quality throughout the value chain. In Oats Nutrition and Technology; Wiley: Hoboken, NJ, USA, 2013; pp. 33–70. [Google Scholar]
  6. Maki, K.; Galant, R.; Samuel, P.; Tesser, J.; Witchger, M.; Ribaya-Mercado, J.; Blumberg, J.; Geohas, J. Effects of consuming foods containing oat β-glucan on blood pressure, carbohydrate metabolism and biomarkers of oxidative stress in men and women with elevated blood pressure. Eur. J. Clin. Nutr. 2007, 61, 786–795. [Google Scholar] [CrossRef] [PubMed] [Green Version]
  7. Pomeroy, S.; Tupper, R.; Cehun-Aders, M.; Nestel, P. Oat b-glucan lowers total and LDL-cholesterol. Aust. J. Nutr. Diet. 2001, 58, 51–55. [Google Scholar]
  8. Ripsin, C.M.; Keenan, J.M.; Jacobs, D.R.; Elmer, P.J.; Welch, R.R.; Van Horn, L.; Liu, K.; Turnbull, W.H.; Thye, F.W.; Kestin, M. Oat products and lipid lowering: A meta-analysis. JAMA 1992, 267, 3317–3325. [Google Scholar] [CrossRef] [PubMed]
  9. Ramasamy, V.S.; Samidurai, M.; Park, H.J.; Wang, M.; Park, R.Y.; Yu, S.Y.; Kang, H.K.; Hong, S.; Choi, W.-S.; Lee, Y.Y. Avenanthramide-C restores impaired plasticity and cognition in Alzheimer’s disease model mice. Mol. Neurobiol. 2020, 57, 315–330. [Google Scholar] [CrossRef] [PubMed]
  10. US. Food and Drug Administration. Food labeling: Health claims; oats and coronary heart disease: Final rule. Fed. Regist. 1997, 62, 3584–3601. [Google Scholar]
  11. Nazco, R.; Villegas, D.; Ammar, K.; Pena, R.J.; Moragues, M.; Royo, C. Can Mediterranean durum wheat landraces contribute to improved grain quality attributes in modern cultivars? Euphytica 2012, 185, 1–17. [Google Scholar] [CrossRef]
  12. Fu, Y.B.; Peterson, G.W.; Scoles, G.; Rossnagel, B.; Schoen, D.J.; Richards, K.W. Allelic diversity changes in 96 Canadian oat cultivars released from 1886 to 2001. Crop Sci. 2003, 43, 1989–1995. [Google Scholar] [CrossRef] [Green Version]
  13. International Wheat Genome Sequencing Consortium. Shifting the limits in wheat research and breeding using a fully annotated reference genome. Science 2018, 361, eaar7191. [Google Scholar] [CrossRef] [Green Version]
  14. Khurana, P.; Gaikwad, K. The map-based sequence of the rice genome. Nature 2005, 436, 793–800. [Google Scholar]
  15. The International Barley Genome Sequencing Consortium. A physical, genetic and functional sequence assembly of the barley genome. Nature 2012, 491, 711–716. [Google Scholar] [CrossRef] [PubMed]
  16. Schmutz, J.; Cannon, S.B.; Schlueter, J.; Ma, J.; Mitros, T.; Nelson, W.; Hyten, D.L.; Song, Q.; Thelen, J.J.; Cheng, J. Genome sequence of the palaeopolyploid soybean. Nature 2010, 463, 178–183. [Google Scholar] [CrossRef] [PubMed] [Green Version]
  17. Schnable, P.S.; Ware, D.; Fulton, R.S.; Stein, J.C.; Wei, F.; Pasternak, S.; Liang, C.; Zhang, J.; Fulton, L.; Graves, T.A. The B73 maize genome: Complexity, diversity, and dynamics. Science 2009, 326, 1112–1115. [Google Scholar] [CrossRef] [Green Version]
  18. Bentley, D.R. Whole-genome re-sequencing. Curr. Opin. Genet. Dev. 2006, 16, 545–552. [Google Scholar] [CrossRef] [PubMed]
  19. Gutierrez-Gonzalez, J.J.; Tu, Z.J.; Garvin, D.F. Analysis and annotation of the hexaploid oat seed transcriptome. BMC Genom. 2013, 14, 471. [Google Scholar] [CrossRef] [Green Version]
  20. O’Donoughue, L.; Souza, E.; Tanksley, S.; Sorrells, M. Relationships among North American oat cultivars based on restriction fragment length polymorphisms. Crop Sci. 1994, 34, 1251–1258. [Google Scholar] [CrossRef]
  21. Baohong, G.; Zhou, X.; Murphy, J. Genetic variation within Chinese and Western cultivated oat accessions. Cereal Res. Commun. 2003, 31, 339–346. [Google Scholar] [CrossRef]
  22. Achleitner, A.; Tinker, N.A.; Zechner, E.; Buerstmayr, H. Genetic diversity among oat varieties of worldwide origin and associations of AFLP markers with quantitative traits. Theor. Appl. Genet. 2008, 117, 1041–1053. [Google Scholar] [CrossRef]
  23. Subudhi, P.K.; Parami, N.P.; Harrison, S.A.; Materne, M.D.; Murphy, J.P.; Nash, D. An AFLP-based survey of genetic diversity among accessions of sea oats (Uniola paniculata, Poaceae) from the southeastern Atlantic and Gulf coast states of the United States. Theor. Appl. Genet. 2005, 111, 1632–1641. [Google Scholar] [CrossRef] [PubMed]
  24. Li, C.; Rossnagel, B.; Scoles, G. The development of oat microsatellite markers and their use in identifying relationships among Avena species and oat cultivars. Theor. Appl. Genet. 2000, 101, 1259–1268. [Google Scholar] [CrossRef]
  25. Boczkowska, M.; Nowosielski, J.; Nowosielska, D.; Podyma, W. Assessing genetic diversity in 23 early Polish oat cultivars based on molecular and morphological studies. Genet. Resour. Crop. Evol. 2014, 61, 927–941. [Google Scholar] [CrossRef] [Green Version]
  26. Nersting, L.G.; Andersen, S.B.; von Bothmer, R.; Gullord, M.; Jørgensen, R.B. Morphological and molecular diversity of Nordic oat through one hundred years of breeding. Euphytica 2006, 150, 327–337. [Google Scholar] [CrossRef]
  27. Tinker, N.A.; Kilian, A.; Wight, C.P.; Heller-Uszynska, K.; Wenzl, P.; Rines, H.W.; Bjørnstad, Å.; Howarth, C.J.; Jannink, J.-L.; Anderson, J.M. New DArT markers for oat provide enhanced map coverage and global germplasm characterization. BMC Genom. 2009, 10, 39. [Google Scholar] [CrossRef] [PubMed] [Green Version]
  28. Yan, H.; Zhou, P.; Peng, Y.; Bekele, W.A.; Ren, C.; Tinker, N.A.; Peng, Y. Genetic diversity and genome-wide association analysis in Chinese hulless oat germplasm. Theor. Appl. Genet. 2020, 133, 3365–3380. [Google Scholar] [CrossRef]
  29. Huang, Y.-F.; Poland, J.A.; Wight, C.P.; Jackson, E.W.; Tinker, N.A. Using genotyping-by-sequencing (GBS) for genomic discovery in cultivated oat. PLoS ONE 2014, 9, e102448. [Google Scholar] [CrossRef] [PubMed] [Green Version]
  30. Jiang, H.; Tian, L.; Bu, F.; Sun, Q.; Zhao, X.; Han, Y. RNA-seq-based identification of potential resistance genes against the soybean cyst nematode (Heterodera glycines) HG Type 1.2.3.5.7 in “Dongnong L-10”. Physiol. Mol. Plant Pathol. 2021, 114, 101627. [Google Scholar] [CrossRef]
  31. Arora, K.; Panda, K.K.; Mittal, S.; Mallikarjuna, M.G.; Rao, A.R.; Dash, P.K.; Thirunavukkarasu, N. RNAseq revealed the important gene pathways controlling adaptive mechanisms under waterlogged stress in maize. Sci. Rep. 2017, 7, 10950. [Google Scholar] [CrossRef] [Green Version]
  32. Yousefirad, S.; Soltanloo, H.; Ramezanpour, S.S.; Zaynali Nezhad, K.; Shariati, V. The RNA-seq transcriptomic analysis reveals genes mediating salt tolerance through rapid triggering of ion transporters in a mutant barley. PLoS ONE 2020, 15, e0229513. [Google Scholar] [CrossRef] [Green Version]
  33. Iquebal, M.A.; Sharma, P.; Jasrotia, R.S.; Jaiswal, S.; Kaur, A.; Saroha, M.; Angadi, U.; Sheoran, S.; Singh, R.; Singh, G. RNAseq analysis reveals drought-responsive molecular pathways with candidate genes and putative molecular markers in root tissue of wheat. Sci. Rep. 2019, 9, 13917. [Google Scholar] [CrossRef] [Green Version]
  34. Hsu, S.-K.; Tung, C.-W. RNA-Seq analysis of diverse rice genotypes to identify the genes controlling coleoptile growth during submerged germination. Front. Plant Sci. 2017, 8, 762. [Google Scholar] [CrossRef] [Green Version]
  35. Zhang, J.; Liang, S.; Duan, J.; Wang, J.; Chen, S.; Cheng, Z.; Zhang, Q.; Liang, X.; Li, Y. De novo assembly and characterisation of the transcriptome during seed development, and generation of genic-SSR markers in peanut (Arachis hypogaea L.). BMC Genom. 2012, 13, 90. [Google Scholar] [CrossRef] [PubMed] [Green Version]
  36. Ma, Q.; Wu, M.; Pei, W.; Wang, X.; Zhai, H.; Wang, W.; Li, X.; Zhang, J.; Yu, J.; Yu, S. RNA-seq-mediated transcriptome analysis of a fiberless mutant cotton and its possible origin based on SNP markers. PLoS ONE 2016, 11, e0151994. [Google Scholar] [CrossRef]
  37. Xu, S.; Wang, J.; Shang, H.; Huang, Y.; Yao, W.; Chen, B.; Zhang, M. Transcriptomic characterization and potential marker development of contrasting sugarcane cultivars. Sci. Rep. 2018, 8, 1683. [Google Scholar] [CrossRef] [Green Version]
  38. Salgado, L.R.; Koop, D.M.; Pinheiro, D.G.; Rivallan, R.; Le Guen, V.; Nicolás, M.F.; De Almeida, L.G.P.; Rocha, V.R.; Magalhães, M.; Gerber, A.L. De novo transcriptome analysis of Hevea brasiliensis tissues by RNA-seq and screening for molecular markers. BMC Genom. 2014, 15, 236. [Google Scholar] [CrossRef] [PubMed] [Green Version]
  39. Oliver, R.E.; Lazo, G.R.; Lutz, J.D.; Rubenfield, M.J.; Tinker, N.A.; Anderson, J.M.; Morehead, N.H.W.; Adhikary, D.; Jellen, E.N.; Maughan, P.J. Model SNP development for complex genomes based on hexaploid oat using high-throughput 454 sequencing technology. BMC Genom. 2011, 12, 77. [Google Scholar] [CrossRef] [PubMed] [Green Version]
  40. Feng, H.; Zhang, X.; Zhang, C. mRIN for direct assessment of genome-wide and gene-specific mRNA integrity from large-scale RNA-sequencing data. Nat. Commun. 2015, 6, 7816. [Google Scholar] [CrossRef] [PubMed] [Green Version]
  41. Bolger, A.M.; Lohse, M.; Usadel, B. Trimmomatic: A flexible trimmer for Illumina sequence data. Bioinformatics 2014, 30, 2114–2120. [Google Scholar] [CrossRef] [PubMed] [Green Version]
  42. Grabherr, M.G.; Haas, B.J.; Yassour, M.; Levin, J.Z.; Thompson, D.A.; Amit, I.; Adiconis, X.; Fan, L.; Raychowdhury, R.; Zeng, Q. Full-length transcriptome assembly from RNA-Seq data without a reference genome. Nat. Biotechnol. 2011, 29, 644–652. [Google Scholar] [CrossRef] [Green Version]
  43. Pertea, G.; Huang, X.; Liang, F.; Antonescu, V.; Sultana, R.; Karamycheva, S.; Lee, Y.; White, J.; Cheung, F.; Parvizi, B. TIGR Gene Indices clustering tools (TGICL): A software system for fast clustering of large EST datasets. Bioinformatics 2003, 19, 651–652. [Google Scholar] [CrossRef] [Green Version]
  44. Li, W.; Godzik, A. Cd-hit: A fast program for clustering and comparing large sets of protein or nucleotide sequences. Bioinformatics 2006, 22, 1658–1659. [Google Scholar] [CrossRef] [PubMed] [Green Version]
  45. Buchfink, B.; Xie, C.; Huson, D.H. Fast and sensitive protein alignment using DIAMOND. Nat. Methods 2015, 12, 59–60. [Google Scholar] [CrossRef] [PubMed]
  46. Conesa, A.; Götz, S.; García-Gómez, J.M.; Terol, J.; Talón, M.; Robles, M. Blast2GO: A universal tool for annotation, visualization and analysis in functional genomics research. Bioinformatics 2005, 21, 3674–3676. [Google Scholar] [CrossRef] [PubMed] [Green Version]
  47. Haas, B.J.; Papanicolaou, A.; Yassour, M.; Grabherr, M.; Blood, P.D.; Bowden, J.; Couger, M.B.; Eccles, D.; Li, B.; Lieber, M. De novo transcript sequence reconstruction from RNA-seq using the Trinity platform for reference generation and analysis. Nat. Protoc. 2013, 8, 1494–1512. [Google Scholar] [CrossRef] [PubMed]
  48. Altschul, S.F.; Madden, T.L.; Schäffer, A.A.; Zhang, J.; Zhang, Z.; Miller, W.; Lipman, D.J. Gapped BLAST and PSI-BLAST: A new generation of protein database search programs. Nucleic Acids Res. 1997, 25, 3389–3402. [Google Scholar] [CrossRef] [PubMed] [Green Version]
  49. Tatusov, R.L.; Fedorova, N.D.; Jackson, J.D.; Jacobs, A.R.; Kiryutin, B.; Koonin, E.V.; Krylov, D.M.; Mazumder, R.; Mekhedov, S.L.; Nikolskaya, A.N. The COG database: An updated version includes eukaryotes. BMC Bioinform. 2003, 4, 41. [Google Scholar] [CrossRef] [Green Version]
  50. Li, H.; Durbin, R. Fast and accurate short read alignment with Burrows–Wheeler transform. Bioinformatics 2009, 25, 1754–1760. [Google Scholar] [CrossRef] [Green Version]
  51. Li, H.; Handsaker, B.; Wysoker, A.; Fennell, T.; Ruan, J.; Homer, N.; Marth, G.; Abecasis, G.; Durbin, R. 1000 Genome Project Data Processing Subgroup. The sequence alignment/map format and samtools. Bioinformatics 2009, 25, 2078–2079. [Google Scholar] [CrossRef] [PubMed] [Green Version]
  52. McKenna, A.; Hanna, M.; Banks, E.; Sivachenko, A.; Cibulskis, K.; Kernytsky, A.; Garimella, K.; Altshuler, D.; Gabriel, S.; Daly, M. The Genome Analysis Toolkit: A MapReduce framework for analyzing next-generation DNA sequencing data. Genome Res. 2010, 20, 1297–1303. [Google Scholar] [CrossRef] [PubMed] [Green Version]
  53. Neff, M.M.; Turk, E.; Kalishman, M. Web-based primer design for single nucleotide polymorphism analysis. TRENDS Genet. 2002, 18, 613–615. [Google Scholar] [CrossRef]
  54. Korbie, D.J.; Mattick, J.S. Touchdown PCR for increased specificity and sensitivity in PCR amplification. Nat. Protoc. 2008, 3, 1452–1456. [Google Scholar] [CrossRef] [PubMed]
  55. Liu, K.; Muse, S.V. PowerMarker: An integrated analysis environment for genetic marker analysis. Bioinformatics 2005, 21, 2128–2129. [Google Scholar] [CrossRef] [PubMed] [Green Version]
  56. Kumar, S.; Stecher, G.; Li, M.; Knyaz, C.; Tamura, K. MEGA X: Molecular evolutionary genetics analysis across computing platforms. Mol. Biol. Evol. 2018, 35, 1547. [Google Scholar] [CrossRef] [PubMed]
  57. Sneath, P.H.A.; Sokal, R.R. Unweighted pair group method with arithmetic mean. In Numerical Taxonomy; Freeman: San Francisco, CA, USA, 1973; pp. 230–234. [Google Scholar]
  58. Mora-Ortiz, M.; Swain, M.T.; Vickers, M.J.; Hegarty, M.J.; Kelly, R.; Smith, L.M.; Skøt, L. De-novo transcriptome assembly for gene identification, analysis, annotation, and molecular marker discovery in Onobrychis viciifolia. BMC Genom. 2016, 17, 756. [Google Scholar] [CrossRef] [Green Version]
  59. Li, X.; Acharya, A.; Farmer, A.D.; Crow, J.A.; Bharti, A.K.; Kramer, R.S.; Wei, Y.; Han, Y.; Gou, J.; May, G.D. Prevalence of single nucleotide polymorphism among 27 diverse alfalfa genotypes as assessed by transcriptome sequencing. BMC Genom. 2012, 13, 568. [Google Scholar] [CrossRef] [PubMed] [Green Version]
  60. Iorizzo, M.; Senalik, D.A.; Grzebelus, D.; Bowman, M.; Cavagnaro, P.F.; Matvienko, M.; Ashrafi, H.; Van Deynze, A.; Simon, P.W. De novo assembly and characterization of the carrot transcriptome reveals novel genes, new markers, and genetic diversity. BMC Genom. 2011, 12, 389. [Google Scholar] [CrossRef] [Green Version]
  61. Wang, S.; Wang, X.; He, Q.; Liu, X.; Xu, W.; Li, L.; Gao, J.; Wang, F. Transcriptome analysis of the roots at early and late seedling stages using Illumina paired-end sequencing and development of EST-SSR markers in radish. Plant Cell Rep. 2012, 31, 1437–1447. [Google Scholar] [CrossRef]
  62. Wang, Z.; Fang, B.; Chen, J.; Zhang, X.; Luo, Z.; Huang, L.; Chen, X.; Li, Y. De novo assembly and characterization of root transcriptome using Illumina paired-end sequencing and development of cSSR markers in sweetpotato (Ipomoea batatas). BMC Genom. 2010, 11, 726. [Google Scholar] [CrossRef] [PubMed] [Green Version]
  63. Kong, Q.; Liu, Y.; Xie, J.; Bie, Z. Development of simple sequence repeat markers from de novo assembled transcriptomes of pumpkins. Plant Mol. Biol. Rep. 2020, 38, 130–136. [Google Scholar] [CrossRef]
  64. Liu, T.; Liu, X.; Zhou, R.; Chen, H.; Zhang, H.; Zhang, B. De novo Transcriptome Assembly and Comparative Analysis Highlight the Primary Mechanism Regulating the Response to Selenium Stimuli in Oats (Avena sativa L.). Front. Plant Sci. 2021, 12, 1220. [Google Scholar] [CrossRef] [PubMed]
  65. Zhang, D.; Cheng, Y.; Lu, Z.; Wang, J.; Ye, X.; Zhang, X.; Luo, X.; Wang, H.; Zhang, B. Global insights to drought stress perturbed genes in oat (Avena sativa L.) seedlings using RNA sequencing. Plant Signal. Behav. 2021, 16, 1845934. [Google Scholar] [CrossRef]
  66. Kingan, S.B.; Heaton, H.; Cudini, J.; Lambert, C.C.; Baybayan, P.; Galvin, B.D.; Durbin, R.; Korlach, J.; Lawniczak, M.K. A high-quality de novo genome assembly from a single mosquito using PacBio sequencing. Genes 2019, 10, 62. [Google Scholar] [CrossRef] [Green Version]
  67. Xu, Z.; Chen, X.; Lu, X.; Zhao, B.; Yang, Y.; Liu, J. Integrative analysis of transcriptome and metabolome reveal mechanism of tolerance to salt stress in oat (Avena sativa L.). Plant Physiol. Biochem. 2021, 160, 315–328. [Google Scholar] [CrossRef] [PubMed]
  68. Hou, R.; Bao, Z.; Wang, S.; Su, H.; Li, Y.; Du, H.; Hu, J.; Wang, S.; Hu, X. Transcriptome sequencing and de novo analysis for Yesso scallop (Patinopecten yessoensis) using 454 GS FLX. PLoS ONE 2011, 6, e21560. [Google Scholar] [CrossRef] [PubMed] [Green Version]
  69. Chen, X.; Li, J.; Xiao, S.; Liu, X. De novo assembly and characterization of foot transcriptome and microsatellite marker development for Paphia textile. Gene 2016, 576, 537–543. [Google Scholar] [CrossRef] [PubMed]
  70. Chen, E.H.; Wei, D.D.; Shen, G.M.; Yuan, G.R.; Bai, P.P.; Wang, J.J. De novo characterization of the Dialeurodes citri transcriptome: Mining genes involved in stress resistance and simple sequence repeats (SSRs) discovery. Insect Mol. Biol. 2014, 23, 52–66. [Google Scholar] [CrossRef] [PubMed]
  71. Mardi, M.; Karimi Farsad, L.; Gharechahi, J.; Salekdeh, G.H. In-depth transcriptome sequencing of Mexican lime trees infected with Candidatus Phytoplasma aurantifolia. PLoS ONE 2015, 10, e0130425. [Google Scholar] [CrossRef] [PubMed] [Green Version]
  72. Oliver, R.E.; Tinker, N.A.; Lazo, G.R.; Chao, S.; Jellen, E.N.; Carson, M.L.; Rines, H.W.; Obert, D.E.; Lutz, J.D.; Shackelford, I. SNP discovery and chromosome anchoring provide the first physically-anchored hexaploid oat map and reveal synteny with model species. PLoS ONE 2013, 8, e58068. [Google Scholar] [CrossRef]
  73. Gutierrez-Gonzalez, J.J.; Garvin, D.F. Reference genome-directed resolution of homologous and homeologous relationships within and between different oat linkage maps. Plant Genome 2011, 4, 178–190. [Google Scholar] [CrossRef] [Green Version]
  74. Brookes, A.J. The essence of SNPs. Gene 1999, 234, 177–186. [Google Scholar] [CrossRef]
  75. Morin, P.A.; Luikart, G.; Wayne, R.K. SNPs in ecology, evolution and conservation. Trends Ecol. Evol. 2004, 19, 208–216. [Google Scholar] [CrossRef]
  76. Wang, K.; Wang, D.; Zheng, X.; Qin, A.; Zhou, J.; Guo, B.; Chen, Y.; Wen, X.; Ye, W.; Zhou, Y. Multi-strategic RNA-seq analysis reveals a high-resolution transcriptional landscape in cotton. Nat. Commun. 2019, 10, 4714. [Google Scholar] [CrossRef] [PubMed] [Green Version]
  77. Wei, L.; Miao, H.; Li, C.; Duan, Y.; Niu, J.; Zhang, T.; Zhao, Q.; Zhang, H. Development of SNP and InDel markers via de novo transcriptome assembly in Sesamum indicum L. Mol. Breed. 2014, 34, 2205–2217. [Google Scholar] [CrossRef]
  78. Yates, S.A.; Swain, M.T.; Hegarty, M.J.; Chernukin, I.; Lowe, M.; Allison, G.G.; Ruttink, T.; Abberton, M.T.; Jenkins, G.; Skøt, L. De novo assembly of red clover transcriptome based on RNA-Seq data provides insight into drought response, gene discovery and marker identification. BMC Genom. 2014, 15, 453. [Google Scholar] [CrossRef] [Green Version]
  79. Leonforte, A.; Sudheesh, S.; Cogan, N.O.; Salisbury, P.A.; Nicolas, M.E.; Materne, M.; Forster, J.W.; Kaur, S. SNP marker discovery, linkage map construction and identification of QTLs for enhanced salinity tolerance in field pea (Pisum sativum L.). BMC Plant Biol. 2013, 13, 161. [Google Scholar] [CrossRef] [PubMed] [Green Version]
  80. Agarwal, G.; Jhanwar, S.; Priya, P.; Singh, V.K.; Saxena, M.S.; Parida, S.K.; Garg, R.; Tyagi, A.K.; Jain, M. Comparative analysis of kabuli chickpea transcriptome with desi and wild chickpea provides a rich resource for development of functional markers. PLoS ONE 2012, 7, e52443. [Google Scholar] [CrossRef] [PubMed] [Green Version]
  81. Izzah, N.K.; Lee, J.; Jayakodi, M.; Perumal, S.; Jin, M.; Park, B.-S.; Ahn, K.; Yang, T.-J. Transcriptome sequencing of two parental lines of cabbage (Brassica oleracea L. var. capitata L.) and construction of an EST-based genetic map. BMC Genom. 2014, 15, 149. [Google Scholar] [CrossRef] [Green Version]
  82. Allegre, M.; Argout, X.; Boccara, M.; Fouet, O.; Roguet, Y.; Bérard, A.; Thévenin, J.M.; Chauveau, A.; Rivallan, R.; Clement, D. Discovery and mapping of a new expressed sequence tag-single nucleotide polymorphism and simple sequence repeat panel for large-scale genetic studies and breeding of Theobroma cacao L. DNA Res. 2012, 19, 23–35. [Google Scholar] [CrossRef] [PubMed] [Green Version]
Figure 1. Frequency length distribution of 128,244 unigenes.
Agronomy 12 00184 g001
Figure 2. Comparison of 128,244 unigenes against the nr NCBI database based on BLASTx analysis. (a) Matches; (b) Distribution of species with the highest nu mber of hits.
Agronomy 12 00184 g002
Figure 3. Gene ontology classification for the assembled unigenes of the 10 oat varieties.
Agronomy 12 00184 g003
Figure 4. Histogram representation of the cluster of orthologous groups (COG) classification for assembled unigenes of 10 oat varieties.
Agronomy 12 00184 g004
Figure 5. The PCR profiles of three dCAPS markers in the 28 oat varieties. (a,b) Electrophoresis results of SH-4 (a) and SH-28-2 (b) after restriction enzyme digestion. (c) Electrophoresis results of SH-20-1 display the polymorphism based on InDel variation; therefore, there is no need for the application of restriction enzymes after PCR. (1–28) The oat varieties used in this study are presented in Table S5.
Agronomy 12 00184 g005
Figure 6. The UPGMA phylogenetic tree of 28 oat varieties based on the 30 dCAPS markers.
Agronomy 12 00184 g006
Table 1. Statistical summary of Illumina sequencing data and mapping reads of 10 oat varieties.
VarietyRaw DataTrimmed DataMapped
Reads
Unique Hit PE
Reads
Unmapped ReadsRead
Mapping Rate (%)
Average Depth (x)
Total
Reads
Total
Nucleotide Length (bp)
GC
(%)
Q20
(%)
Average
Length
(bp)
Total
Reads
Total
Nucleotide Length (bp)
Average
Length
(bp)
Choyang34,091,9065,147,877,80654.8298.2715131,937,5984,679,320,810146.527,965,23810,594,2061,681,82887.615.11
Daeyang35,130,4205,304,693,42053.7998.2615132,872,6184,802,284,508146.128,806,50211,247,2621,873,27887.615.07
Darkhorse36,272,0325,477,076,83254.2498.3115134,014,9244,966,621,185146.029,804,2309,263,5401,838,30687.615.40
Gehl43,776,6946,610,280,79454.4098.4615141,304,1765,998,734,784145.236,786,40610,428,9801,723,98489.118.81
Gwanghan37,093,1965,601,072,59654.8598.3315134,804,4405,077,842,605145.930,422,82411,468,6221,710,07487.415.89
Hispeed33,197,9925,012,896,79254.0098.3415131,187,3924,554,914,836146.027,403,74610,556,1481,665,15687.914.79
Ilhan38,554,6065,821,745,50654.4898.2615136,046,3785,270,758,292146.231,349,72812,241,2202,073,42887.016.32
Okhan33,311,9185,030,099,61855.1598.2815131,244,8144,557,668,933145.927,511,95410,208,5681,410,19488.114.51
Samhan35,883,8865,418,466,78655.2098.4315133,811,1784,936,778,375146.029,786,05611,267,7561,727,03688.115.55
Swan38,373,0445,794,329,64454.1598.3115136,005,7305,268,310,072146.331,295,71210,038,7622,200,20886.916.31
Mean36,568,5695,521,853,97955.0098.0015134,322,9255,011,323,440146.030,113,24010,731,5061,790,34987.715.78
Table 2. Statistical summary of the de novo assembly of 10 oat varieties.
Number of unigenes128,244
Total read count301,132,396
Total contig length137,438,033 bp
Mean contig length1071.7 bp
Max. contig length21,849 bp
Min. contig length187 bp
N501752 bp
Table 3. Characterization of the 6634 putative single-nucleotide polymorphisms (SNPs).
Annotation of SNPsNumber of SNPsNumber of Associated Unigenes
Non-synonymous1228777
Synonymous1648951
Others a23721161
Not determined b1386648
Total66343537
a Start codon gained or lost, stop codon gained or lost, 3′ UTR or 5′ UTR region. b CDS was not predicted.
Table 4. Summary of 6634 putative single-nucleotide polymorphisms (SNPs) identified from the unigenes of the 10 oat varieties.
Number of Unigenes128,244
Total bases (bp)137,438,033
Number of SNPs6634
SNP frequency0.05 SNPs/kb
Transition3880
A/G1941
C/T1939
Transversion2754
A/C650
A/T440
C/G1018
G/T646
Publisher’s Note: MDPI stays neutral with regard to jurisdictional claims in published maps and institutional affiliations.