Article

Improvement of Root Characteristics Due to Nitrogen, Phosphorus, and Potassium Interactions Increases Rice (Oryza sativa L.) Yield and Nitrogen Use Efficiency

1
Rice Research Institute, Agronomy College, Shenyang Agricultural University, Shenyang 110866, China
2
Rice Research Institute, Heilongjiang Academy of Land Reclamation Sciences, Harbin 154007, China
*
Author to whom correspondence should be addressed.
Agronomy 2022, 12(1), 23; https://doi.org/10.3390/agronomy12010023
Submission received: 26 November 2021 / Revised: 19 December 2021 / Accepted: 21 December 2021 / Published: 23 December 2021

Abstract

:
Although nitrogen (N), phosphorus (P), and potassium (K) co-application improves crop growth, yield, and N use efficiency (NUE) of rice, few studies have investigated the mechanisms underlying these interactions. To investigate root morphological and physiological characteristics and determine yield and nitrogen use parameters, rhizo-box experiments were performed on rice using six treatments (no fertilizer, PK, N, NK, NP, and NPK) and plants were harvested at maturity. The aboveground biomass at the elongating stage and grain yield at maturity for NPK treatment were higher than the sum of PK and N treatments. N, P, and K interactions enhanced grain yield due to an increase in agronomic N use efficiency (NAE). The co-application of N, P, and K improved N uptake and N recovery efficiency, exceeding the decreases in physiological and internal NUE and thereby improving NAE. Increases in root length and biomass, N uptake per unit root length/root biomass, root oxidation activity, total roots absorption area, and roots active absorption area at the elongating stage improved N uptake via N, P, and K interactions. The higher total N uptake from N, P, and K interactions was due to improved root characteristics, which enhanced the rice yield and NUE.

1. Introduction

Nitrogen (N) is an elementary mineral nutrient required for plant growth and is widely applied in crop production [1]. The global N fertilizer consumption increased from 11 Tg in 1960 to 110 Tg in 2015, of which more than half was used for cereal production [2]. Unfortunately, crops commonly use less than 40% of the N fertilizers in the application year [3], and the recovery of N ranges from 30% to 50% [4]. Unreasonable fertilization management decreases N use efficiency (NUE) and enhances production costs and environmental risks [5]. Improving NUE is crucial to reduce economic cost and environmental impact while maintaining crop yield. Scientists have conducted many investigations on breeding N efficient cultivars, optimizing the application strategy of N fertilizer, and performing precision agriculture techniques [6,7,8]. Godfrey et al. reported that N recovery efficiency can increase up to 70% by optimizing fertilizer and crop management and providing suitable environmental conditions [9]. Balanced fertilizer application is the most crucial component of modern crop production technologies [10]. Studies have reported that interactive effects between N, phosphorus (P), and potassium (K) can affect plant growth, NUE, and grain yield [1,11]. The mechanisms underlying the interactions regarding the efficient utilization of N fertilizer by crops requires specific investigation.
P and K fertilizers influence the crop uptake and utilization of N, and the effects are influenced by the soil P or K status. P fertilizers can alter root morphology, such as root length, root biomass, and root number, potentially influencing N acquisition and redistribution [12,13,14]. K fertilizers can improve N uptake by providing K+, which acts as an electrochemical balance for NO3 [15]. Exchange interactions between K+ and NH4+ influence the N availability [16]. The effects of co-applying N, P, and K fertilizers on crop performance have been reported, and it is assumed that N, P, and K interactions could improve yield and fertilizer utilization efficiency. Metho et al. [17] reported that the yield and NUE of wheat upon co-application of N, P, and K fertilizer exceeded the sum of that obtained from adding each nutrient individually. A study on rice–wheat rotation showed that integrating N, P, and K increased the yield and N uptake and decreased N loss in both rice and wheat compared with that obtained upon N or NP application; however, post-application NUE was not significantly different between NPK or NP [18]. Schlegel and Havlin [19] demonstrated that the significantly improved grain yield, N uptake, agronomic N use efficiency (NAE), and N recovery by sorghum in Ulysses silt loam upon the co-application of N, P, and K was mainly due to N and P, rather than adding K. The continuous application of N, P, and K over 13 years in sandy loam increased the yield and apparent N recovery of spring barley; however, the increase was not significant [20]. Studies have suggested that the combination of fertilizers does not affect N utilization [21,22]. These contradictory results might be related to differences in soil fertility levels, crops, varieties, management strategies of cultivation, and experimental conditions [1,23,24].
The root is the primary organ in plants that absorb nutrients and water, and root characteristics are associated with the N uptake and utilization by plants [13]. Liao et al. proposed that the early growth and branching of roots in the 20–70 cm soil profile accounted for the superior N uptake by vigorous wheat [25]. The inter-sub-specific hybrid super rice cultivars had superior N uptake due to longer, larger, and high activity roots after the heading stage [26,27]. Collectively, these studies showed that high N uptake is related to a large root size and superior root activity. However, Moyassar et al. [28] compared the root morphological traits between nine wheat cultivars and found that the N uptake increased with decreasing total root length and root biomass. This is because increased NO3 affinity or activity of the roots improves the root efficiency in capturing N, which compensates for the loss in root size [29]. These results indicate that improved NUE could result from a large root system, high root activity, excellent root architecture, or a combination of these characteristics [30,31]. Previous studies have suggested that the total root length, root biomass, and root number are closely related to improved NUE and grain yield owing to the interactions between N, P, and K [4,11,32]. Most of these studies, however, failed to consider the interactive effects of N, P, and K on root growth pattern, root architecture, and root physiology. Rooting pattern, root distribution, and root activity have been shown to influence N uptake and utilization [26,27,28]. In this study, we aimed to investigate whether the interactions between N, P, and K promote the rapid growth and proliferation of roots, which improves the N uptake and potential utilization by Japonica rice. To assess this hypothesis, a rhizo-box experiment was performed to map root growth, distribution, and proliferation at 3–4 d interval and measure root activity.

2. Materials and Methods

2.1. Plant Material and Growth Conditions

A rhizo-box experiment was performed at the Heilongjiang Academy of Land Reclamation Sciences (46°75′ N, 130°43′ E) in Jiamusi, China, during the rice growing season (April–October) of 2020. Longjing31 (LJ31, Heilongjiang Academy of Agricultural Sciences, China) was selected because it is a high-yield Japonica rice cultivar with the largest planting area in the Heilongjiang province of Northeast China. This cultivar was commercially released in 2011 and has a plant height of 92 cm with 86 grains per panicle and 26.3 g of 1000-grain-weight under adapted growth conditions. The experimental soil was Albolls soil with 26.6 g kg−1 of organic matter, 1.3 g kg−1 of total N, 94 mg kg−1 of alkali hydrolysable N, 8.1 mg kg−1 of Olsen-P, and 62 mg kg−1 of exchangeable K, respectively.

2.2. Experimental Design

Rice seeds were sown in nursery trays (Taizhou Engineering Plastic Factory, China). The nursery tray was 61 cm long, 31.5 cm wide, and 2.5 cm deep with 448 holes per tray. One grain was seeded in each hole. When rice seedlings grew to the 3.1 leaf stage (35 days after sowing), 30 seedlings were selected to measure the total root length, following which the other seedlings were transplanted into 4.8 L glass-walled rhizo-boxes (24 cm long, 5 cm wide, and 40 cm deep; Supplementary Figure S1). The rhizo-box was made of polyvinyl chloride (PVC) on three sides and clear acrylic plastic (Perspex) on the fourth side. The clear Perspex side was used to visualize and measure root growth [11,33]. All rhizo-boxes were positioned on steel shelves and the clear Perspex side was angled down at 30° to allow the roots to grow along the clear side. At any time, except when the root growth and proliferation were mapped, a removable black PVC board covered the Perspex side to avoid the effects of ambient light on root growth.
Air-dried soil and sand were sifted through 2-mm sieves and then mixed in a ratio of 4:1. The mixed soil was transferred into rhizo-boxes for a soil weight and depth of 5 kg and 30 cm, respectively. Seven days before transplanting, the rhizo-boxes were watered and placed approximately 1 cm above the soil surface. Six nutrient treatments were designed: no fertilizer (Non−F), P and K fertilizer (PK), N fertilizer alone (N), N and K fertilizer (NK), N and P fertilizer (NP), and N, P, and K fertilizer (NPK). Additions of P alone and K alone were also implemented to calculate NAE, physiological N use efficiency (NPE), and internal N use efficiency (NIE). N fertilizer (as urea) was applied four times: 40% on May 17 as basal fertilizer, 30% on May 25 as tillering fertilizer, 10% on June 16 when the rice grew to the 7.5 leaf stage, and 20% on July 2 when the rice grew to the 9.5 leaf stage. P fertilizer was applied as a single dose of calcium superphosphate on May 17. K fertilizer as KCl was applied twice: 50% on May 17 as basal fertilizer, and 50% on July 2 (9.5 leaf stage). The application rates of N, P, and K fertilizers for each treatment are described in Table 1.
Two rice seedings at the 3.1 leaf stage were transplanted in a row in contact with the acrylic glass wall into each rhizo-box on May 18, approximately 12 cm apart. Each treatment had six replicates of rhizo-boxes in a randomized design. Root growth was recorded every 3–4 days interval, 5 days after transplanting (DAT). Briefly, during each examination, all the visible new roots were mapped on a removable and transparent PVC board using a waterproof permanent pen, and the procedure was repeated on the clear Perspex wall of the rhizo-boxes to facilitate recognition of new root growth at the next mapping time. The transparent PVC board with root traces was scanned using Win-RHIZO 2004 (Regent Instruments, Quebec City, QC, Canada). The Win-RHIZO system was used to analyze the JPG images to determine the total root length of new roots at each measurement time and calculate root extension rates. Because not all roots grown were observed on the acrylic glass wall, total root length and root extensive rates reflected root growth in the visual soil depth, which was approximately 0.5 cm [29]. The mapping work was completed at 42 DAT (elongating stage) when the roots of some samples grew to the bottom of the rhizo-boxes.

2.3. Sampling and Measurements

To measure the root morphological and physiological traits, six rhizo-boxes from each treatment were destructively sampled at 42 DAT. Three rhizo-boxes were used to measure the aboveground biomass, root weight, root number, and total root length. Shoots were cut from the roots at the crown. The soil profile in the rhizo-box was carefully removed and cut into three 10-cm sections. Immediately after the soil was washed, all the fresh roots were collected to manually measure the total root length and root number. The specific root length (SRL; cm root length g−1 root biomass) and root length density (RLD; cm root length cm−3 soil volume) were calculated. The shoot and root samples were desiccated at 105 °C, oven-dried at 80 °C to a constant weight, and then weighed. The N concentration of shoots was measured using semi-micro Kjeldahl digestion and distillation [34]. The shoot dry weight and N concentration were used to calculate plant N uptake and recovery efficiency of N (NRE). The fresh roots of three other rhizo-boxes were rinsed and collected to measure root oxidation activity by the method described by Zhang et al. [35], and to measure the total root absorption area and root active absorption area using the methyl thionine chloride dipping method [36]. At maturity (102 DAT), all the rhizo-box plants were harvested. The aboveground parts of the plants were cut from the root at the crown and separated into grain and straw. Then, the soil was carefully washed to collect the roots. The grain, straw, and roots of each plant were oven-dried to measure the dry weight. Grain and straw were used to analyze N concentration. Biomass and N concentrations in tissues were used to calculate total N uptake, NRE, NAE, NPE, and NIE.
Root extension rates (cm increased root length plant−1 d−1) were defined as the new root length per day. The N uptake and NAE were calculated using equation 1–7 [27].
Total N uptake (mg plant−1) = N concentration × aboveground biomass
N uptake per unit root length (mg m−1) = total N content/total root length
N uptake per unit root biomass (mg g−1) = total N content/total root biomass
Agronomic N use efficiency (NAE; g g−1) = (grain yield with N fertilizer − grain yield without N fertilizer)/N applied
The apparent recovery efficiency of N fertilizer (NRE; %) = (total N content with N fertilizer − total N content without N fertilizer)/N applied × 100
Physiological N use efficiency (NPE; g g−1) = (yield with N fertilizer − yield without N fertilizer)/(total N content with N fertilizer − total N content without N fertilizer)
Internal N use efficiency (NIE; g g−1) = grain yield/total N content

2.4. Statistical Analysis

To determine the effects of fertilization treatments on plant growth and NUE, data were calculated using Excel 2010 (Microsoft, Redmond, WA, USA), and all results were presented as mean ± standard error. Graphs were drawn with Sigma Plot12.5 (SYSTAT, San Jose, CA, USA). Analysis of variance was conducted using one-way analysis of variance (ANOVA) using SPSS v.23.0 (IBM, Armonk, NY, USA). The means were compared by the least significant difference at p < 0.05 (LSD 0.05).

3. Results

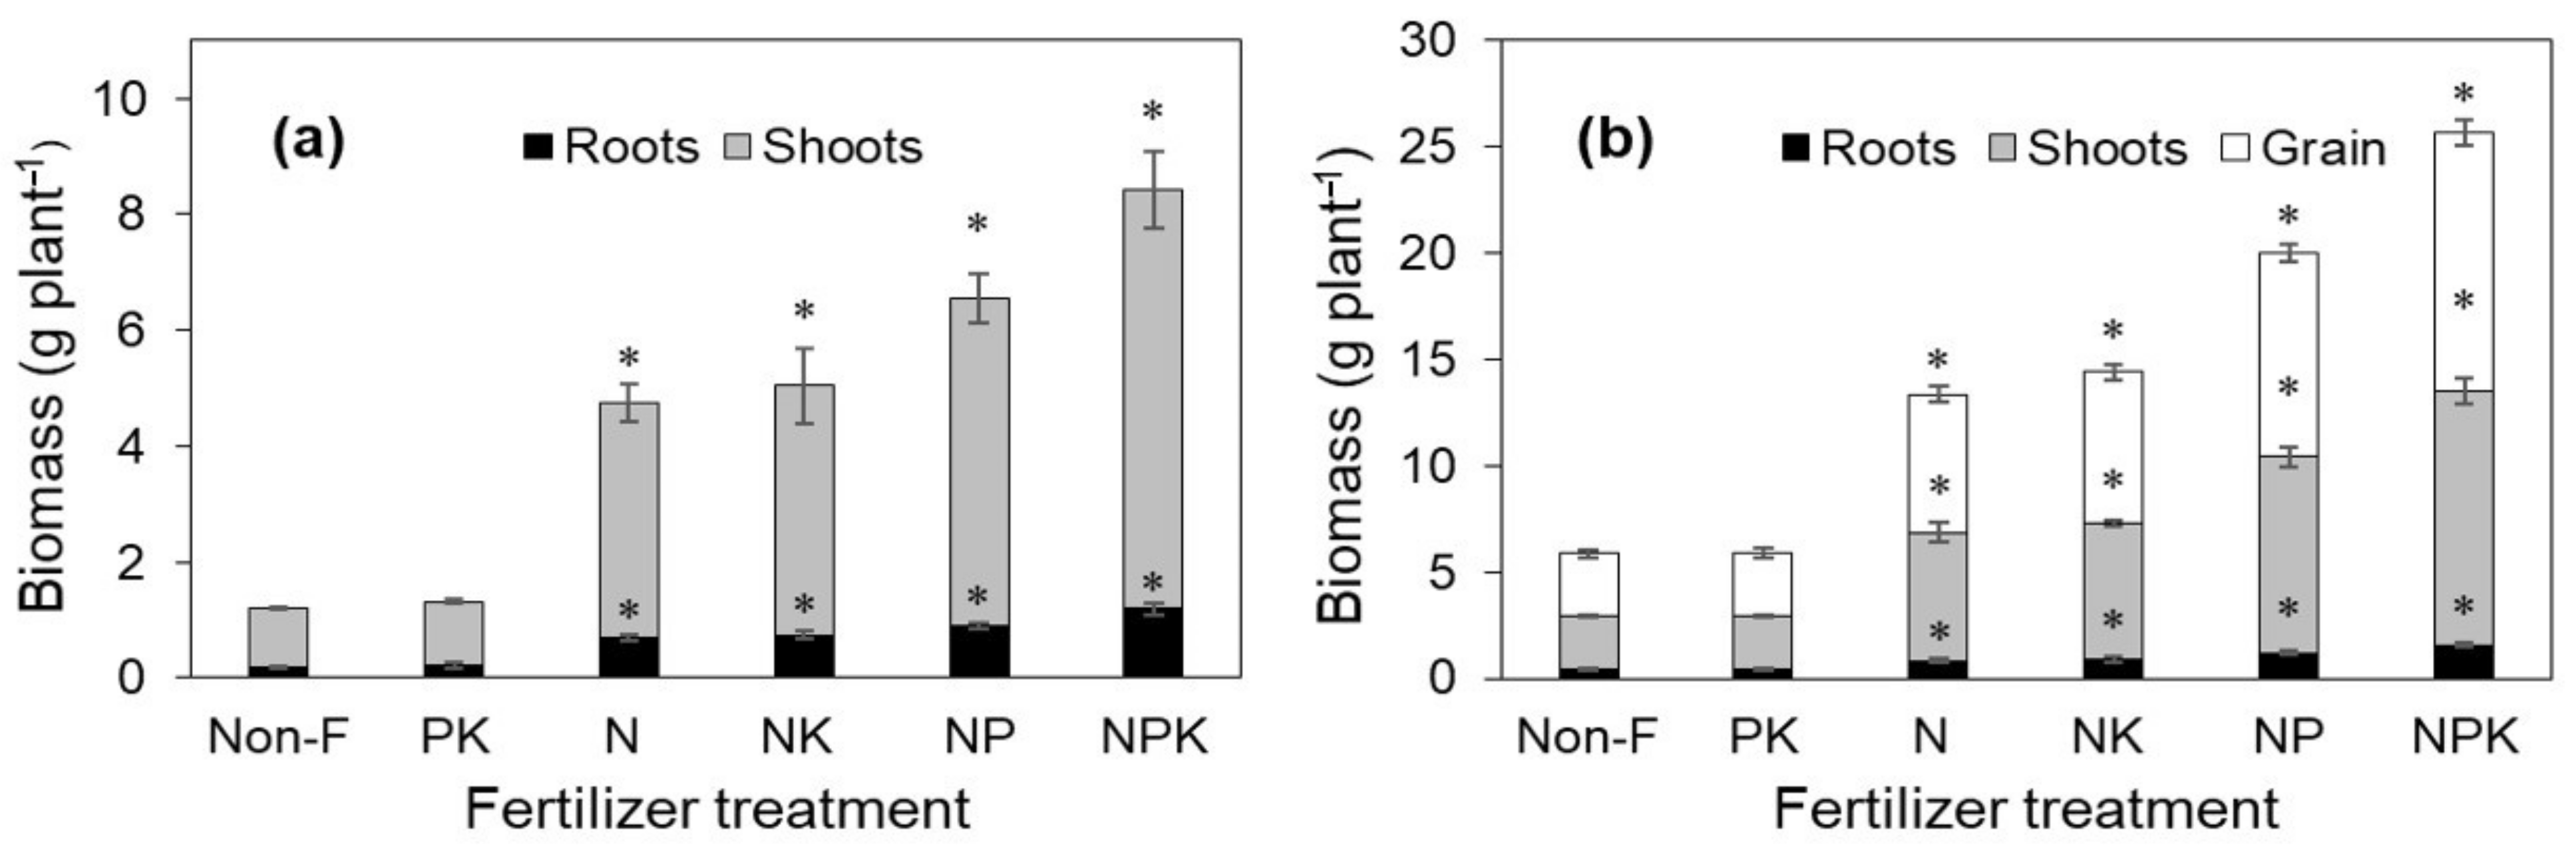
3.1. Plant Growth and Grain Yield

The rhizo-boxes were used to non-invasively investigate the root growth pattern from transplanting stage to 42 DAT (Supplementary Materials Figure S1); and then some of the plants were destructively sampled, while the other plants were grown to 102 DAT. No differences were observed between the Non−F and PK treatments in terms of plant biomass and grain yield. In comparison, N treatment significantly increased the shoot and root biomass at the elongating stage, and straw biomass, root biomass, and grain yield at maturity. Additionally, NP and NPK treatments further increased tissue biomass at the elongating stage and maturity. The biomass of each tissue from the plants undergoing NPK treatment was higher than the plants undergoing other fertilization treatments at the elongating stage and maturity (Figure 1). The biomass of shoots and roots from the NPK treatment group was approximately 1.4 and 1.3 times higher, respectively, than the sum of the corresponding values of PK and N treatment groups at the elongating stage. At maturity, the biomass of grain, shoot, and root from the NPK treatment group was approximately 1.3, 1.4, and 1.3 times higher, respectively, relative to the sum of the corresponding values of N and PK treatments. These results indicate there were obvious interactions between N, P, and K.
Adding N significantly decreased the root to shoot ratio (p < 0.05), regardless of whether P and K were applied (Table 2). Addition of P fertilizer further decreased the root to shoot ratio when N was present, but it was not significant.

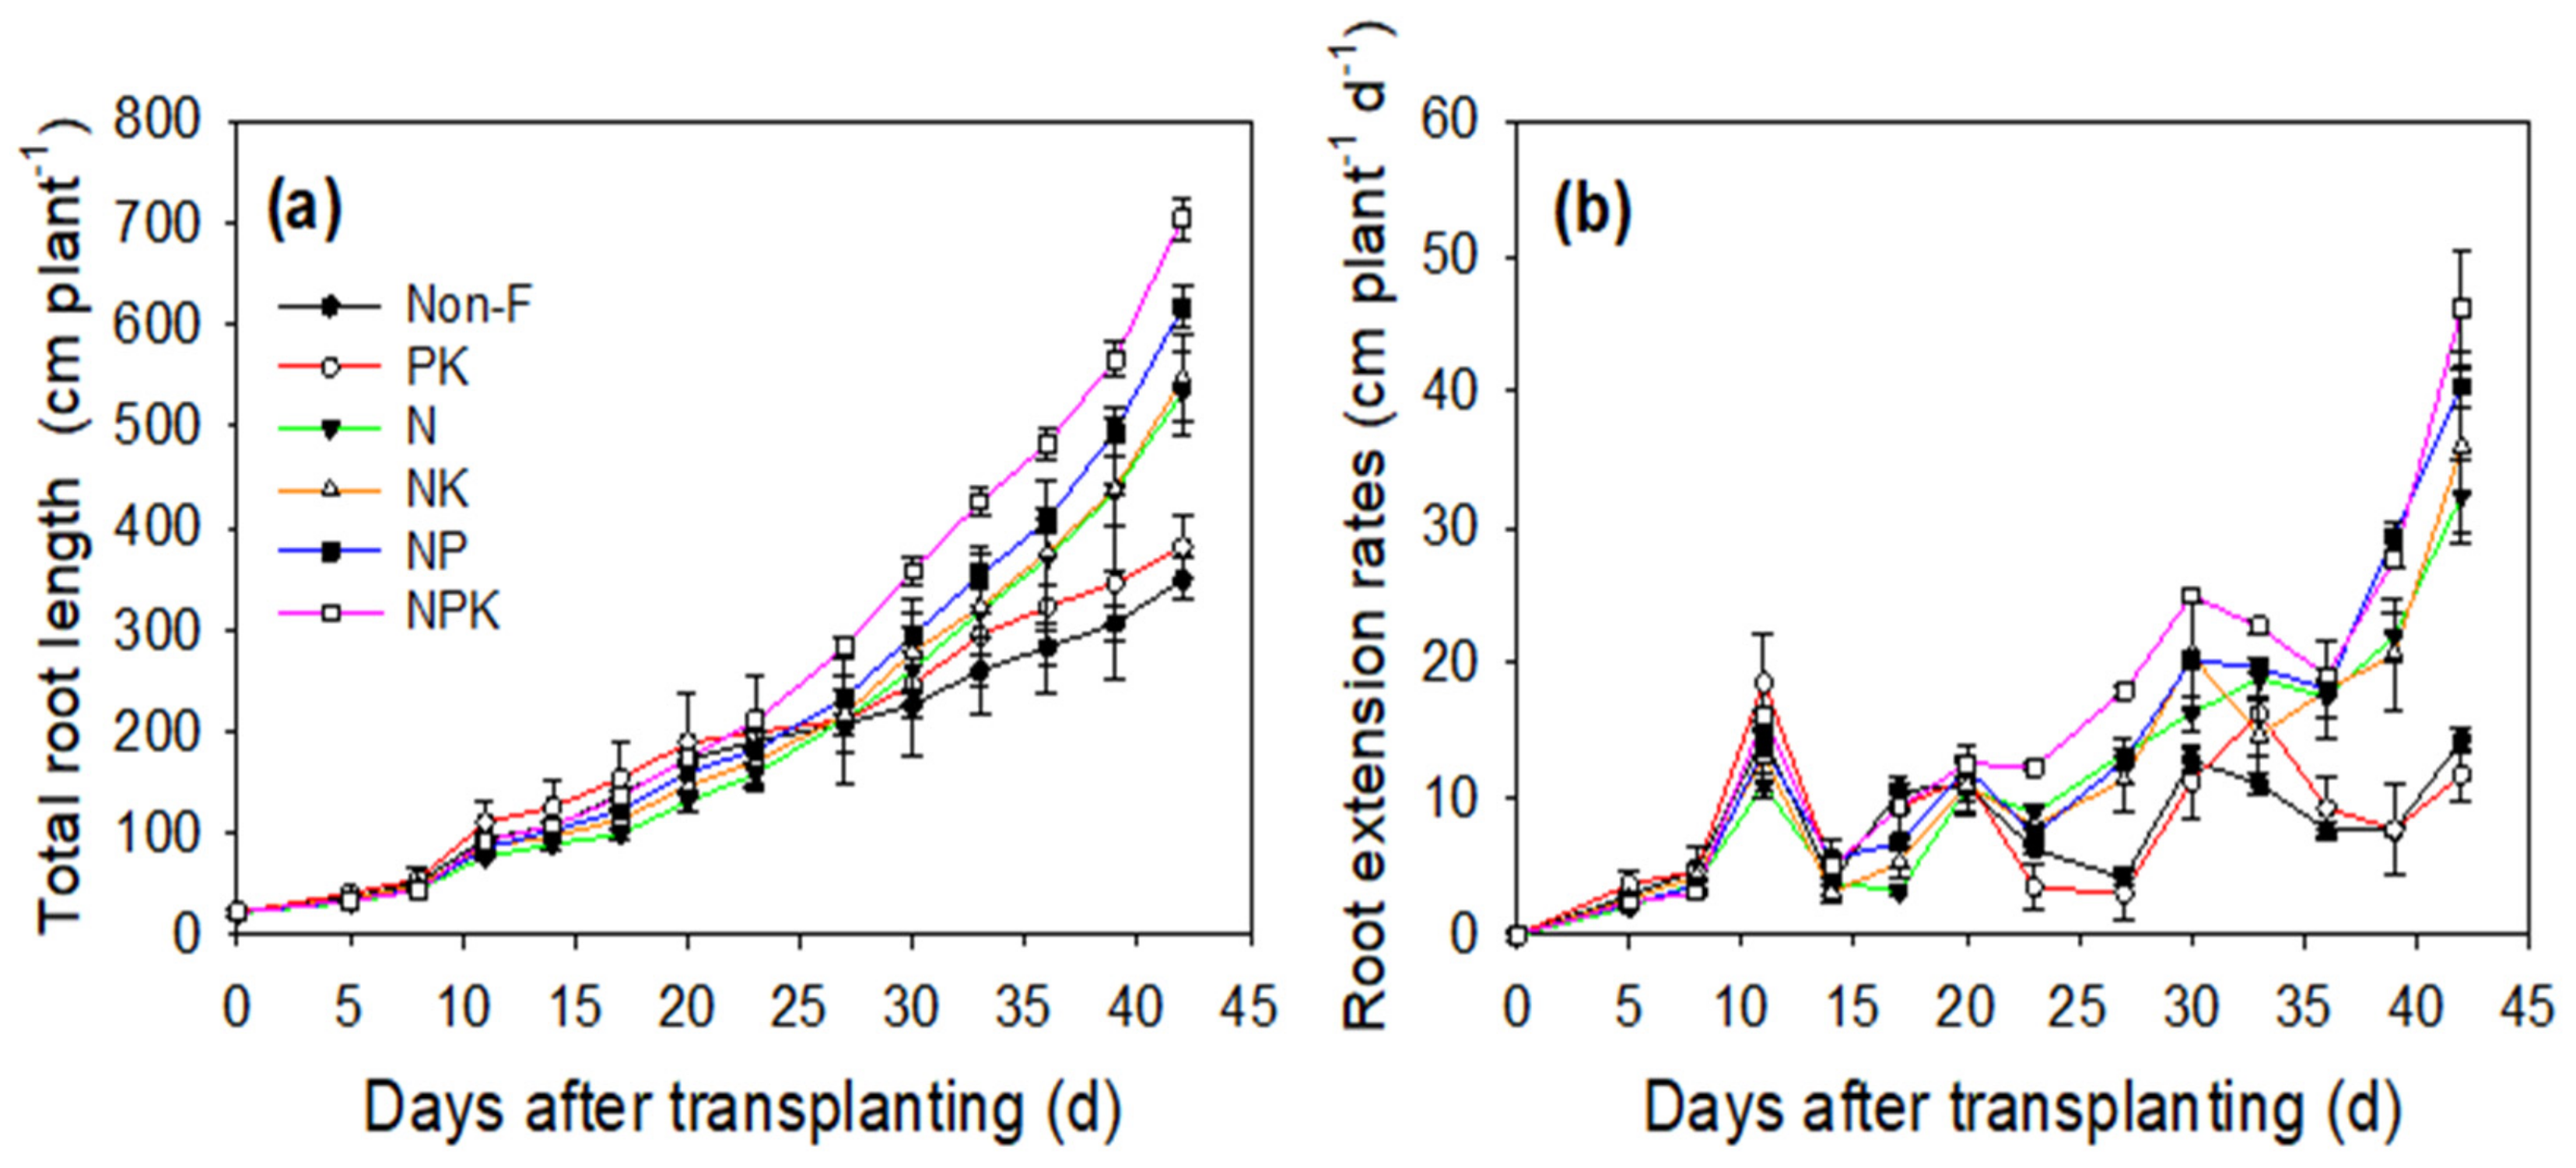
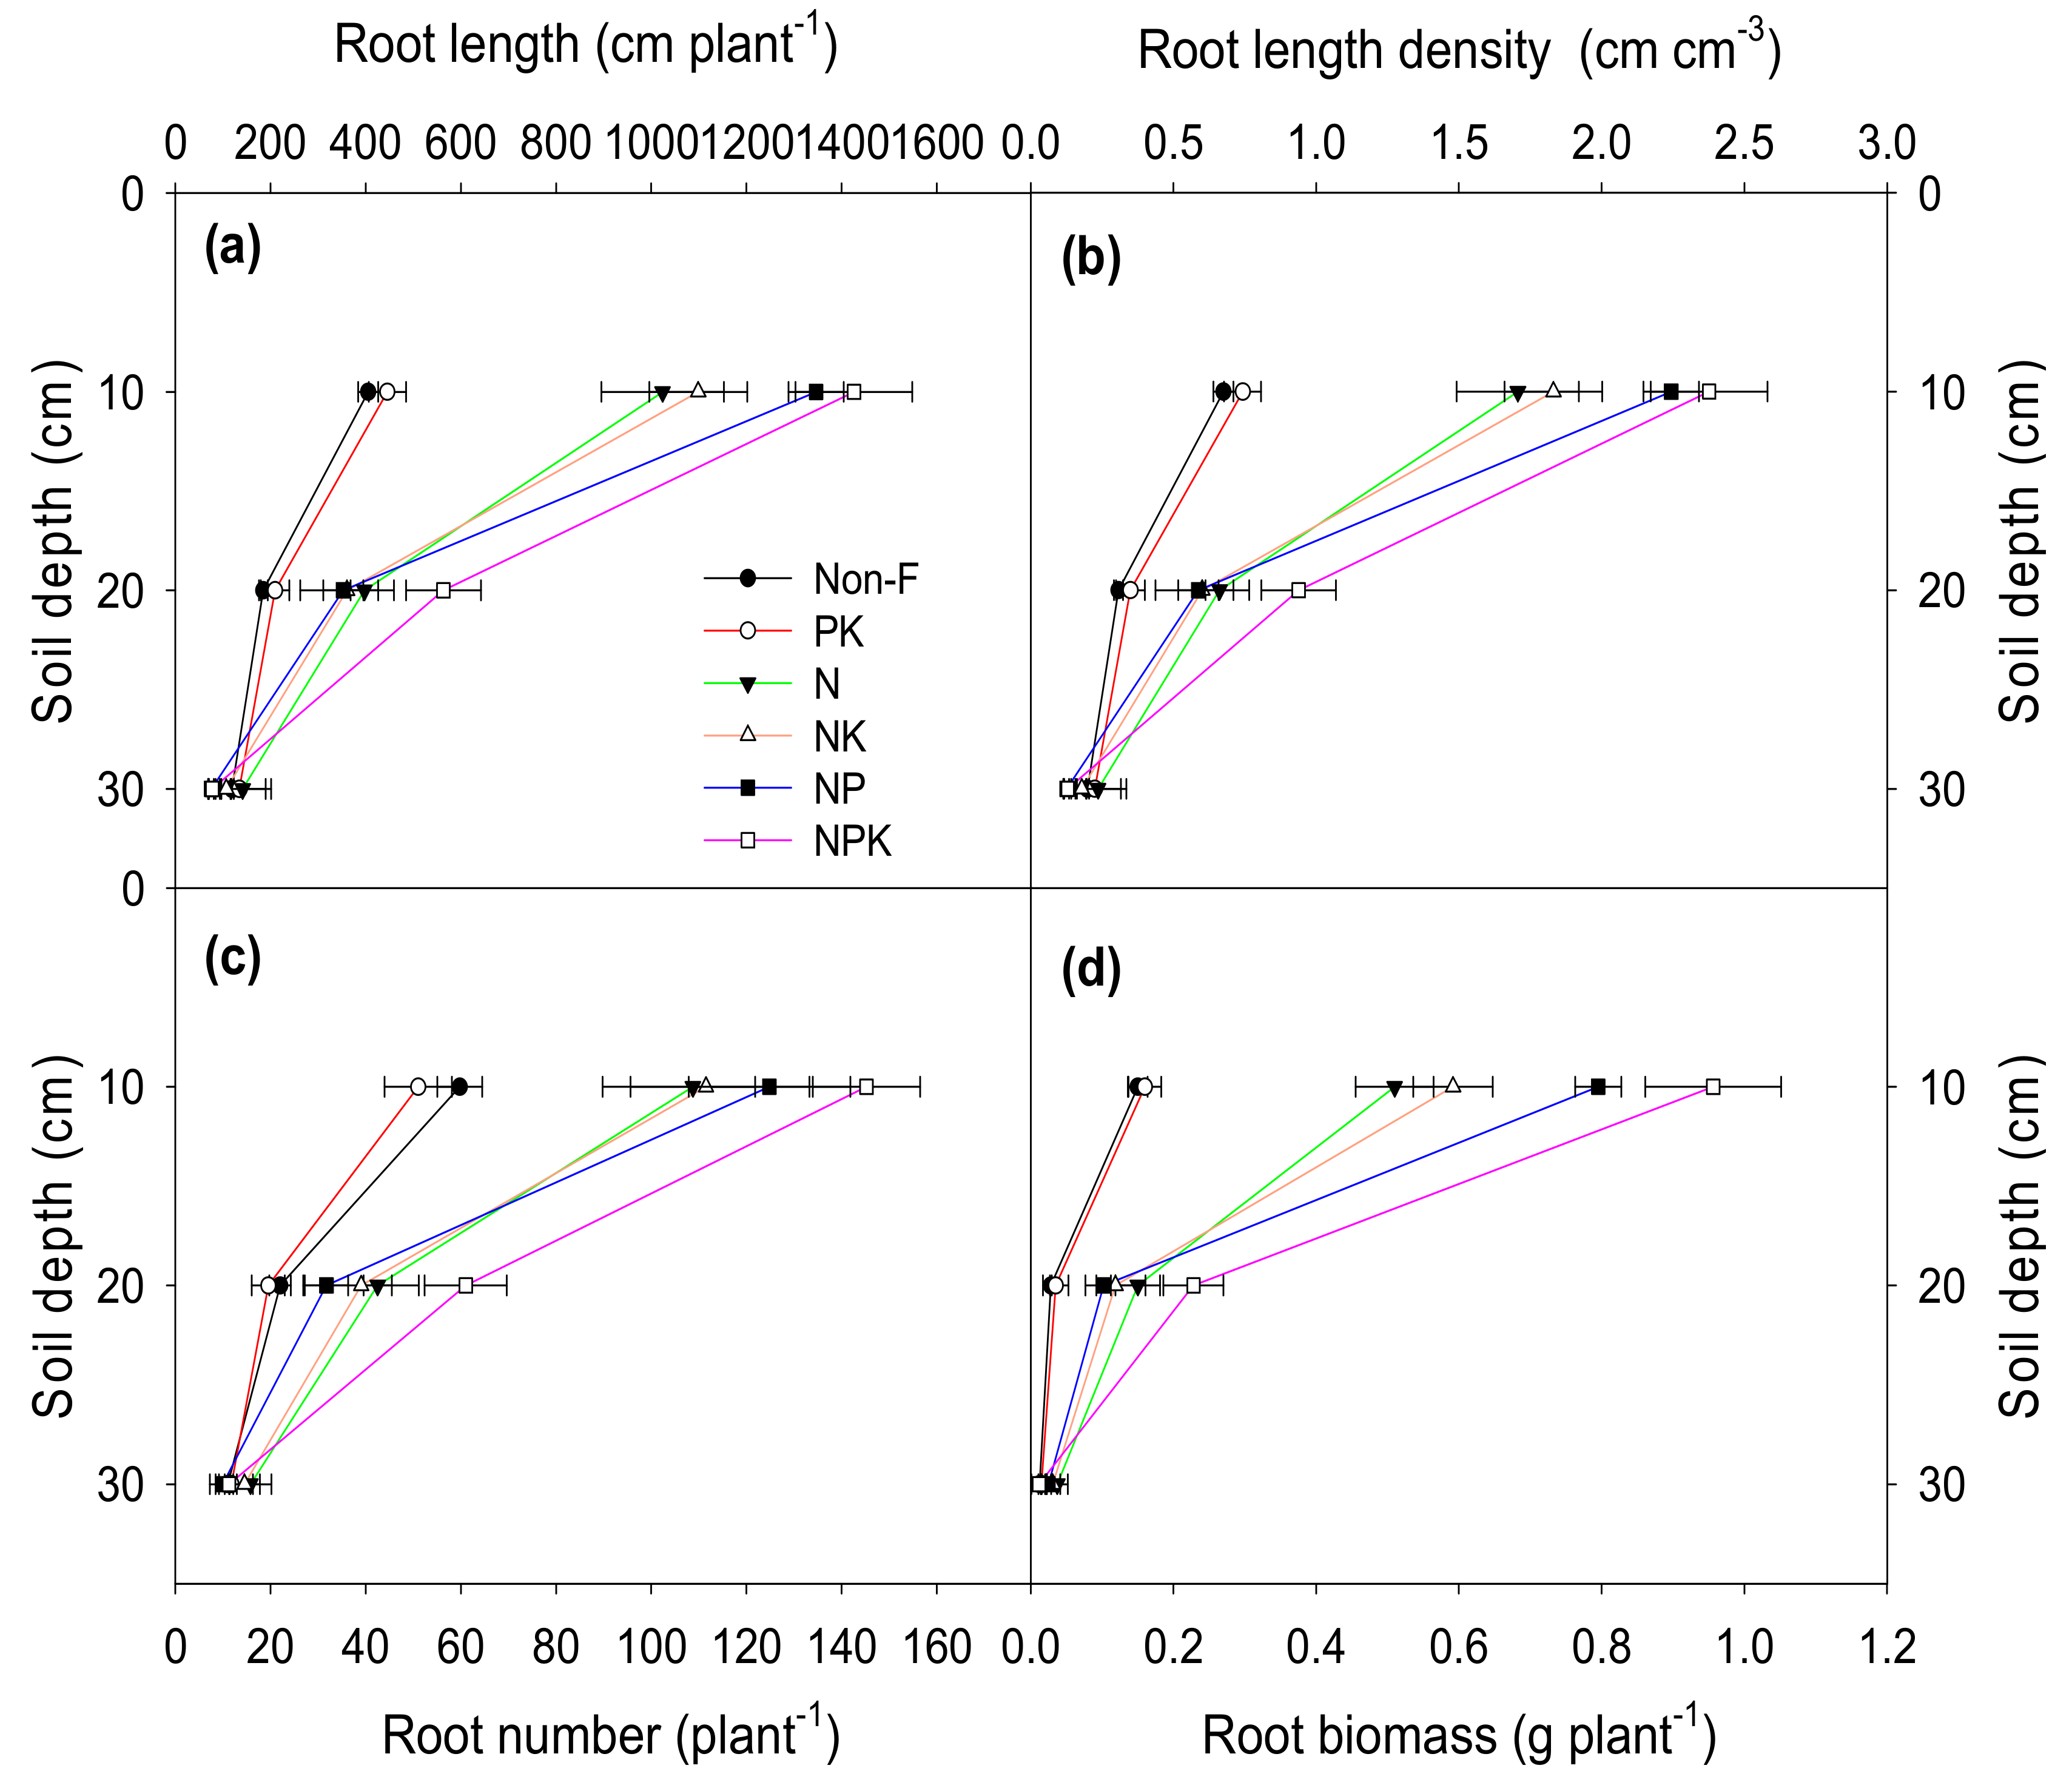
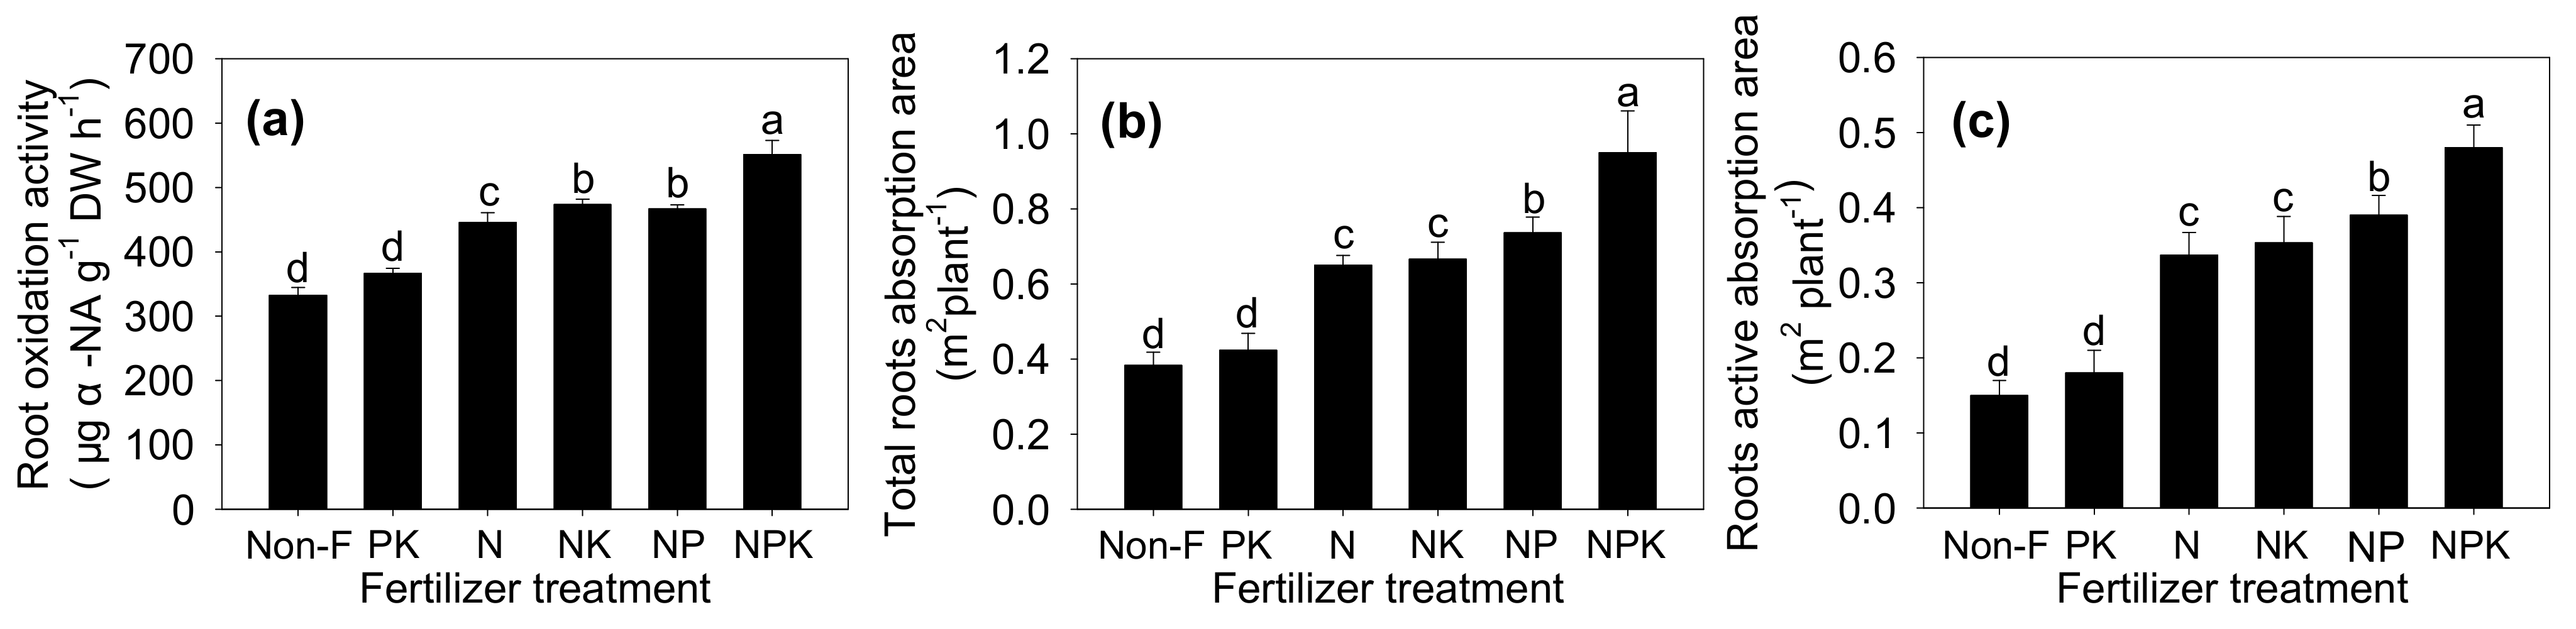
3.2. Root Morphology and Physiology

Fertilizer treatments influenced the rooting patterns and root growth (Figure 2 and Figure 3). The roots of plants that did not undergo N fertilizer treatment reached the bottom of the box at 42 DAT (Figure 3). The addition of N decreased the rooting depth irrespective of P or K fertilizer application (Figure 3). The total root length showed no significant difference among the six treatments before 23 DAT, and before 17 DAT, plants that did not receive N (no fertilizer and PK treatments) showed a slightly greater total root length than the plants that received N (Figure 2a). At 30 DAT, the total root length was significantly greater in the NPK treatment group than in the other groups (p < 0.05). The differences in total root length between treatments were due to changes in the root extension rates. At 20 DAT, the root extension rates did not significantly differ among the fertilization treatments (Figure 2b). After 23 DAT, NPK treatment resulted in higher root extension rates compared to other fertilization treatments due to the proliferation of roots rather than an increase in rooting depth (Figure 2a and Figure 3). The total root length and root extension rates of plants treated with NPK were higher than those that underwent other N treatments after transplanting, indicating that with N fertilizer application, the addition of P and K fertilizers further improved root growth.
Root morphology showed various responses to the fertilizer combinations (Figure 3 and Figure 4). The results from destructive sampling indicated that adding N fertilizer clearly increased the total root length, RLD, and root number, and decreased SRL. Four parameters did not exhibit significant differences between Non−F and PK treatments, or between N and NK treatments. The total root length, RLD, and root number in NP and NPK treatment plants were higher than those treated with N and NK. Three parameters for the NPK group were significantly higher than for other groups, and increased by 32.2%, 32.2%, and 32.6% relative to N treatment (Figure 4a–c). The SRL of the N and NK groups were significantly higher than those of NP and NPK, and lower than those of Non−F and PK. SRL in the NPK treatment group was significantly lower than that in the other groups, except the NP treatment group (Figure 4d).
Fertilization treatments influenced root distribution in the 0–30 cm soil profile (Figure 5). The root length, RLD, and root number in the groups without N were significantly lower than in those with N in the 0–10 and 10–20 cm layers (p < 0.05) (Figure 5a–c). No differences were found between the Non−F and PK treatment groups for each layer. In the 0–10 cm layer, the root length, RLD, and root number for the NPK treatment group were significantly higher than those of N and NK treatments, except for NP (p < 0.05), and were significantly greater than those of the other treatments in the 10–20 cm layer.
No differences in root length, RLD, and root number were observed among treatments with N, NK, and NP in the 0–10- and 10–20-cm layers. In the 20–30-cm layer, the N group had greater root length, RLD, and root number than combinations without N. Three parameters in the NPK treatment were significantly lower than those in the other treatments in this layer, except NP (p < 0.05). The addition of N significantly increased root biomass in the 0–10- and 10–20-cm layers, and no differences were found between Non−F and PK, or between N and NK treatments in each layer (Figure 5d). Root biomass for NP was higher in the 0–10-cm layer and lower in the 10–20-cm layer than in groups treated with NK and N. In comparison with other treatment groups, the root biomass for NPK was significantly higher in the 0–10- and 10–20-cm layers, and lower in the 20–30-cm layer (p < 0.05). These results demonstrated that root growth and proliferation in the 0–20-cm soil profile were responsible for the higher total root length and root biomass in the NPK group.
Root activity exhibited significant differences among the groups at the elongating stage (Figure 6). N application increased the root oxidation activity, and there was no significant difference between Non−F and PK or between NK and NP (Figure 6a). With the application of N, the addition of P, K, or P + K further enhanced root oxidation activity. The root oxidation activity for NPK was significantly higher than the other combinations. Application of N fertilizer increased the total root absorption area and root active absorption area, and there were similarities between Non−F and PK or between N and NK treatments (Figure 6b,c). With the addition of N, the application of P or P + K further increased both parameters. The total roots absorption area and roots active absorption area were significantly higher in NPK than in other combinations. These results indicated that the interactions of N, P, and K improved root activity.

3.3. Nitrogen Uptake and Utilization Efficiency

Fertilizer treatments influenced N uptake at the elongating stage and maturity (Table 2 and Table 3). The absence of N significantly decreased total N uptake, N uptake per unit root biomass, N uptake per unit root length at the elongating stage, and total N uptake at maturity (p < 0.05). These parameters did not show significant differences between the Non−F and PK or between the N and NK groups. The total N uptake for NP at both sampling times was higher than N and NK, but was significantly lower than NPK treatment (p < 0.05). In comparison with the sum of PK and N treatments, the total N uptake in NPK at the elongating stage and maturity increased by approximately 1.9 times and 1.4 times, respectively. A similar result was found for N uptake per unit root length (Table 2). At the elongating stage, the N uptake per unit root length in NPK (4.6 mg m−1) increased by approximately 1.1, 1.5, 1.6, 4.8, and 4.7 times, respectively, relative to that in the NP, NK, N, PK, and Non−F treatments. There was a significant increase in N uptake per unit root biomass in the NP and NPK relative to N or NK groups, and no significant difference was found between NPK and NP combinations. N uptake per unit root biomass in the NPK treatment was 1.0, 1.2, 1.3, 2.2, and 2.2 times higher than that in the NP, NK, N, PK, and Non−F combinations, respectively. These results suggested that co-application of N, P, and K fertilizers improved the N uptake ability of roots.
Besides increasing N uptake, the integration of N, P, and K fertilizers improved the NUE of rice (Table 2 and Table 3). At the elongating stage and maturity, the NRE of the NP treatment group was significantly higher than treatments with N and NK, but significantly lower than NPK treatment (p < 0.05). In comparison with N treatment, NRE of NPK treatment increased by approximately 2.7-fold. Comparable results were also observed for NAE. Compared to N treatment, NAE of the NPK group increased by approximately 2.6-fold. In contrast, co-application of N, P, and K decreased NPE and NIE at maturity (Table 3). NPE and NIE were similar between treatments with N, NK, and NP, and they were significantly higher than NPK. NIE did not exhibit a significant difference between treatments without N.

4. Discussion

4.1. Effects of N, P, and K Interactions on Root Growth

The application of N, P, or K fertilizers or the integration of these fertilizers can influence plants root growth and development [12,13,14,30]. Duncan et al. 2018 reported that the root biomass and length of wheat co-treated with N, P, and K were approximately seven and two times higher than those of wheat exposed to N fertilizer at tillering stage [11]. In this study, the root biomass in the NPK treatment group was higher than the sum of the corresponding values in the PK and N groups at elongating stage, indicating there are obvious interactive effects among N, P, and K fertilizers in improving root growth (Figure 1). The improved effects were also observed in the total root length and root number (Figure 4). This suggests that the increased roots size upon co-application of N, P, and K was caused mainly by greater root proliferation, branching, and dry matter accumulation (Figure 2 and Figure 3). The absence of N significantly increased the SRL and root-to-shoot ratio of plants regardless of the presence of P and K. This is consistent with the results of a previous study, which reported that when adjusting to low N, the plants allocate photosynthate and energy to lengthen roots to acquire nutrition [13,37]. Expending a lower carbon cost to increase root length is a more economic strategy in rice [38]. The significant decrease in SRL upon adding N, with further decrease upon co-application of N, P, and K demonstrates that root growth was regulated by not only N supply level, but also the interactions between N and other nutrients, such as P or K or a combination of P and K.

4.2. Increase in Yield and NUE Due to N, P, and K Interactions Are Associated with Improved Root Morphological and Physiological Traits

The interaction of N, P, and K can improve the growth and grain yield of cereal crops such as wheat and rice [4,14,15], and the interactive effects are influenced by soil fertility level. Metho et al. reported that the wheat yield upon co-application of N, P, and K was higher than the sum of the yields from individually adding N, P, and K [17]. However, in other studies, the grain yield did not clearly increase after the application of P or K [18,19,39]. Dodd and Mallarino (2005) found that fertilization did not improve corn yield in high P soil until Non−Fertilizer production for 8–9 years [40]. The application of P and K even decreased soybean yield on soil with high P and K contents [39]. It is well established that soil with high fertility level may lead to a low incidence of nutrients deficiency, and thus reduces the improved effects on crops yield by fertilization. In this study, plants were grown in soil with low N, P, and K content. The aboveground biomass in the elongating stage and grain yield at maturity upon NPK treatment increased by approximately 1.4- and 1.3-fold, respectively, relative to the sum of PK and N treatments (Figure 1), indicating that interactive effects among N, P, and K in improving crop growth and yield might be more than additive when subjected to nutrient stress.
The improvement in NAE was closely related to increased grain yield in the NPK group (Table 3). Further analysis indicated that plants that received N, P, and K had higher NAE primarily due to improved N uptake rather than increased use of the absorbed N. Compared to other treatments with N, co-application of N, P, and K fertilizers decreased NPE and NIE, but improved NRE, which overrode the reduction in grain production per unit absorbed N, effectively explaining the increase in NAE. N uptake is a key component of the NRE equation; therefore, it potentially influences yield and NUE. These results suggested that the increased N uptake was responsible for the improved yield and NUE due to N, P, and K interactions.
Interactions between nutrients are guided because the availability of one influence the absorption of others. Application of K can improve N uptake by plants because K+ acts as an electrochemical balance for NO3 [15]. Exchange interactions between K+ and NH4+ influence N availability [16]. P can influence root growth to regulate N acquisition [12,13,14]. Both P and K can favorably influence N acquisition [12,13,14,15,16]. Therefore, the increased total N uptake in this study upon co-application of N, P, and K may be due to increased N availability in the rhizosphere and improved root morphological traits (Table 2 and Table 3 and Figure 4). Studies have demonstrated that the improved N uptake by nutrients interactions, such as N and P, N and K, or N, P, and K were associated with increases in root length and root biomass [11,18]. However, a large root system may be redundant for the capture of N. Moyassar et al. [29] compared nine wheat varieties and found that N uptake increased with decreasing root length and biomass, since the improvement in N uptake per unit root length exceeded the decrease in root size. In this study, the N uptake per unit root length and per unit root biomass for the NPK treatment group in this study was higher than or similar to all other treatments, implying that N, P, and K interactions improved N capture ability of the roots. High root oxidation activity, total roots absorption area, and roots active absorption area have been shown to contribute to increased N absorption [27,41]. Therefore, the superior N uptake per unit root length and per unit root biomass for the NPK treatment group may be due to the enhanced root activity (Figure 6). The improved root size and enhanced root activity by N, P and K interactions might be a win–win effect, since increased root length, root biomass, and root number increased exploration of the soil volume to increase N uptake, while improved root activity enhanced N capture ability of the roots to further increase N absorption. Thus, increases in roots size and root activity might be partially responsible for the improved N uptake by N, P, and K interactions. Another reason for the improvement in the total N uptake of rice might be the larger aboveground biomass production of NPK groups at the elongating stage (Figure 1a). The rapid growth and large size of the aboveground biomass drove the demand for N within the plant, which improved N absorption of plants [11]. The results of present study indicated that N, P, and K interactions improved root characteristics related to N uptake, and thus potentially increased NUE and yield. Therefore, we supposed that balanced fertilization base on local soil fertility level can improve root growth to potentially further increased rice yield and NUE. This study improves our understanding of physiological significance of balanced fertilization for improved yield and NUE, and provide useful information to optimize fertilization management base on the root growth response to nutrients supply.

5. Conclusions

N, P, and K interactions increased the grain yield and NUE, which was associated with an increase in N uptake. Compared to other fertilizer combinations, plants exposed to N, P, and K showed decreased NPE and NIE, but improved NRE, which overrode the reduction in the yield produced per absorbed N, effectively explaining the increase in NAE. Increases in root length and biomass in the 0–20 cm of the soil profile, N uptake per unit root length, N uptake per unit root biomass, root oxidation activity, total root absorption area, and root active absorption area at the elongating stage were responsible for the improved total N uptake due to N, P, and K interactions. The results of the current study demonstrated that N, P, and K interactions improved root characteristics associated with N uptake, which was closely related to increases in yield and NUE. Although the information reported here must be tested under field conditions, it support the fact that the balanced application of N, P, and K fertilizers can improve the yield and NUE of rice, and thus potentially reduce fertilizer N inputs and increase environmental and economic benefits. This study has demonstrated that nutrient supply influences yield and NUE through changes in root traits; thus, more cultivars with excellent root characteristics should be tested under various soil fertility conditions to optimize the productivity of rice production systems.

Supplementary Materials

The following are available online at https://www.mdpi.com/article/10.3390/agronomy12010023/s1, Figure S1: The rhizo-box used for root mapping

Author Contributions

Conceptualization, W.Z.; methodology, M.D.; software, M.D.; validation, W.Z.; formal analysis, J.G.; investigation, M.D.; resources, W.Z.; data curation, M.L., Y.Z. (Yan Zhou), D.H., Y.Z. (Yanze Zhao), S.L.; writing—original draft preparation, M.D.; writing—review and editing, M.D.; visualization, M.L.; supervision, J.G.; project administration, J.G.; funding acquisition, W.Z. All authors have read and agreed to the published version of the manuscript.

Funding

This research was funded by the Key Research and Development Program of Liaoning Province (2020JH2/10200031) and The Project of Promoting Talents in Liaoning Province (XLYC2002073 and XLYC2007169).

Institutional Review Board Statement

Not applicable.

Informed Consent Statement

Not applicable.

Data Availability Statement

The data used to support the findings of this study are available from the corresponding author upon request.

Conflicts of Interest

The authors declare no conflict of interest. The funder had no role in the design of the study; in the collection, analyses, or interpretation of data; in the writing of the manuscript; or in the decision to publish the results.

References

  1. Duncan, E.G.; O’Sullivan, C.A.; Roper, M.M.; Biggs, J.S.; Peoples, M.B. Influence of Co-Application of Nitrogen with Phosphorus, Potassium and Sulphur on the Apparent Efficiency of Nitrogen Fertiliser Use, Grain Yield and Protein Content of Wheat: Review. Field Crops Res. 2018, 226, 56–65. [Google Scholar] [CrossRef]
  2. FAOStat. Available online: https://www.fao.org/faostat/en/ (accessed on 8 November 2021).
  3. Sun, H.; Zhang, H.; Powlson, D.; Min, J.; Shi, W. Rice production, nitrous oxide emission and ammonia volatilization as impacted by the nitrification inhibitor 2- chloro-6-(trichloromethyl)-pyridine. Field Crops Res. 2015, 173, 1–7. [Google Scholar] [CrossRef]
  4. Fageria, N.K.; Oliveira, J.P. Nitrogen, Phosphorus and Potassium Interactions in Upland Rice. J. Plant Nutr. 2014, 37, 1586–1600. [Google Scholar] [CrossRef]
  5. Somaweera, K.A.T.N.; Suriyagoda, L.D.B.; Sirisena, D.N.; De Costa, W.A.J.M. Accumulation and Partitioning of Biomass, Nitrogen, Phosphorus and Potassium among Different Tissues during the Life Cycle of Rice Grown under Different Water Management Regimes. Plant Soil 2016, 401, 169–183. [Google Scholar] [CrossRef]
  6. Chu, G.; Chen, S.; Xu, C.; Wang, D.; Zhang, X. Agronomic and physiological performance of indica/japonica hybrid rice cultivar under low nitrogen conditions. Field Crops Res. 2019, 243, 1–10. [Google Scholar] [CrossRef]
  7. Chen, H.; Yu, C.; Li, C.; Xin, Q.; Huang, X.; Zhang, J.; Yue, Y.; Huang, G.; Li, X.; Wang, W. Modeling the impacts of water and fertilizer management on the ecosystem service of rice rotated cropping systems in China. Agric. Ecosyst. Environ. 2016, 219, 49–57. [Google Scholar] [CrossRef]
  8. Cormier, F.; Foulkes, J.; Hirel, B.; Gouache, D.; Moënne-Loccoz, Y.; Le Gouis, J. Breeding for Increased Nitrogen-Use Efficiency: A Review for Wheat (T. Aestivum L.). Plant Breed. 2016, 135, 255–278. [Google Scholar] [CrossRef]
  9. Godfrey, D.; Hawkesford, M.J.; Powers, S.J.; Millar, S.; Shewry, P.R. Effects of Crop Nutrition on Wheat Grain Composition and End Use Quality. J. Agric. Food Chem. 2010, 58, 3012–3021. [Google Scholar] [CrossRef] [PubMed]
  10. Zheng, W.; Liu, Z.; Zhang, M.; Shi, Y.; Zhu, Q.; Sun, Y.; Zhou, H.; Li, C.; Yang, Y.; Geng, J. Improving Crop Yields, Nitrogen Use Efficiencies, and Profits by Using Mixtures of Coated Controlled-Released and Uncoated Urea in a Wheat-Maize System. Field Crops Res. 2017, 205, 106–115. [Google Scholar] [CrossRef]
  11. Duncan, E.G.; O’Sullivan, C.A.; Roper, M.M.; Palta, J.; Whisson, K.; Peoples, M.B. Yield and Nitrogen Use Efficiency of Wheat Increased with Root Length and Biomass Due to Nitrogen, Phosphorus, and Potassium Interactions. J. Plant Nutr. Soil Sci. 2018, 181, 364–373. [Google Scholar] [CrossRef]
  12. Teng, W.; Deng, Y.; Chen, X.; Xu, X.; Chen, R.; Lv, Y.; Zhao, Y.; Zhao, X.; He, X.; Li, B.; et al. Characterization of root response to phosphorus supply from morphology to gene analysis in field-grown wheat. J. Exp. Bot. 2013, 64, 1403–1411. [Google Scholar] [CrossRef]
  13. Deng, Y.; Teng, W.; Tong, Y.; Chen, X.; Zou, C. Phosphorus Efficiency Mechanisms of Two Wheat Cultivars as Affected by a Range of Phosphorus Levels in the Field. Front. Plant Sci. 2018, 9, 1–12. [Google Scholar] [CrossRef]
  14. Fageria, N.K.; Moreira, A.; Moraes, L.A.C.; Moraes, M.F. Root Growth, Nutrient Uptake, and Nutrient-Use Efficiency by Roots of Tropical Legume Cover Crops as Influenced by Phosphorus Fertilization. Commun. Soil Sci. Plant Anal. 2014, 45, 555–569. [Google Scholar] [CrossRef]
  15. Blevins, D.G.; Barnett, N.M.; Frost, W.B. Role of Potassium and Malate in Nitrate Uptake and Translocation by Wheat Seedlings. Plant Physiol. 1978, 62, 784–788. [Google Scholar] [CrossRef] [PubMed]
  16. Miller, A.J.; Cramer, M.D. Root Nitrogen Acquisition and Assimilation. In Root Physiology: From Gene to Function; Plant Ecophysiology; Lambers, H., Colmer, T.D., Eds.; Springer: Dordrecht, The Netherlands, 2005; Volume 4, pp. 1–36. [Google Scholar] [CrossRef]
  17. Metho, L.A.; Hammes, P.S.; de Beer, J.M.; Groeneveld, H.T. Interaction between Cultivar and Soil Fertility on Grain Yield, Yield Components and Grain Nitrogen Content of Wheat. S. Afr. J. Plant Soil 1997, 14, 158–164. [Google Scholar] [CrossRef]
  18. Duan, Y.; Shi, X.; Li, S.; Sun, X.; He, X. Nitrogen Use Efficiency as Affected by Phosphorus and Potassium in Long-Term Rice and Wheat Experiments. J. Integr. Agric. 2014, 13, 588–596. [Google Scholar] [CrossRef]
  19. Schlegel, A.J.; Havlin, J.L. Irrigated grain sorghum response to 55 years of nitrogen, phosphorus, and potassium fertilization. Agron. J. 2020, 113, 1–14. [Google Scholar] [CrossRef]
  20. van der Bom, F.; Magid, J.; Jensen, L.S. Long-Term P and K Fertilisation Strategies and Balances Affect Soil Availability Indices, Crop Yield Depression Risk and N Use. Eur. J. Agron. 2017, 86, 12–23. [Google Scholar] [CrossRef]
  21. Colwell, J.; Grove, T. Assessments of Potassium and Sulphur Fertilizer Requirements of Wheat in Western Australia. Aust. J. Exp. Agric. 1976, 16, 748. [Google Scholar] [CrossRef]
  22. Bertic, B.; Loncaric, Z.; Vukadinovic, V.; Vukobratovic, Z.; Vukadinovic, V. Winter Wheat Yield Responses to Mineral Fertilization. Cereal Res. Commun. 2007, 35, 245–248. [Google Scholar] [CrossRef]
  23. Singh, V.K.; Dwivedi, B.S.; Tiwari, K.N.; Majumdar, K.; Rani, M.; Singh, S.K.; Timsina, J. Optimizing Nutrient Management Strategies for Rice–Wheat System in the Indo-Gangetic Plains of India and Adjacent Region for Higher Productivity, Nutrient Use Efficiency and Profits. Field Crops Res. 2014, 164, 30–44. [Google Scholar] [CrossRef]
  24. Hawkesford, M.J. Genetic Variation in Traits for Nitrogen Use Efficiency in Wheat. J. Exp. Bot. 2017, 68, 2627–2632. [Google Scholar] [CrossRef]
  25. Liao, M.; Palta, J.A.; Fillery, I.R.P. Root Characteristics of Vigorous Wheat Improve Early Nitrogen Uptake. Aust. J. Agric. Res. 2006, 57, 1097. [Google Scholar] [CrossRef]
  26. Wei, H.; Zhang, H.; Blumwald, E.; Li, H.; Cheng, J.; Dai, Q.; Huo, Z.; Xu, K.; Guo, B. Different Characteristics of High Yield Formation between Inbred Japonica Super Rice and Inter-Sub-Specific Hybrid Super Rice. Field Crops Res. 2016, 198, 179–187. [Google Scholar] [CrossRef]
  27. Wei, H.; Hu, L.; Zhu, Y.; Xu, D.; Zheng, L.; Chen, Z.; Hu, Y.; Cui, P.; Guo, B.; Dai, Q.; et al. Different Characteristics of Nutrient Absorption and Utilization between Inbred Japonica Super Rice and Inter-Sub-Specific Hybrid Super Rice. Field Crops Res. 2018, 218, 88–96. [Google Scholar] [CrossRef]
  28. Pang, J.; Milroy, S.P.; Rebetzke, G.J.; Palta, J.A. The Influence of Shoot and Root Size on Nitrogen Uptake in Wheat Is Affected by Nitrate Affinity in the Roots during Early Growth. Funct. Plant Biol. 2015, 42, 1179. [Google Scholar] [CrossRef]
  29. Moyassar, M.A.; Jairo, A.; Palta, J.A.; Kadambot, H.M.S.; Victor, O.S. Five decades of selection for yield reduced root length density and increased nitrogen uptake per unit root length in Australian wheat varieties. Plant Soil. 2016, 413, 181–192. [Google Scholar] [CrossRef]
  30. McMurtrie, R.E.; Iversen, C.M.; Dewar, R.C.; Medlyn, B.E.; Näsholm, T.; Pepper, D.A.; Norby, R.J. Plant Root Distributions and Nitrogen Uptake Predicted by a Hypothesis of Optimal Root Foraging. Ecol. Evol. 2012, 2, 1235–1250. [Google Scholar] [CrossRef] [PubMed]
  31. Palta, J.A.; Chen, X.; Milroy, S.P.; Rebetzke, G.J.; Dreccer, M.F.; Watt, M. Large Root Systems: Are They Useful in Adapting Wheat to Dry Environments? Funct. Plant Biol. 2011, 38, 347. [Google Scholar] [CrossRef]
  32. Epie, K.E.; Maral, E. Shoot and Root Biomass, Phosphorus and Nitrogen Uptake of Spring Wheat Grown in Low Phosphorus and Moisture Content Conditions in a Pot Experiment. J. Plant Nutr. 2018, 41, 2273–2280. [Google Scholar] [CrossRef]
  33. Benlloch-Gonzalez, M.; Berger, J.; Bramley, H.; Rebetzke, G.; Palta, J.A. The Plasticity of the Growth and Proliferation of Wheat Root System under Elevated CO2. Plant Soil 2014, 374, 963–976. [Google Scholar] [CrossRef]
  34. Nelson, D.W.; Sommers, L.E. Total Nitrogen Analysis of Soil and Plant Tissues. J. AOAC Int. 1980, 63, 770–778. [Google Scholar] [CrossRef]
  35. Zhang, H.; Xue, Y.; Wang, Z.; Yang, J.; Zhang, J. Morphological and Physiological Traits of Roots and Their Relationships with Shoot Growth in “Super” Rice. Field Crops Res. 2009, 113, 31–40. [Google Scholar] [CrossRef]
  36. Chu, G.; Chen, T.; Wang, Z.; Yang, J.; Zhang, J. Reprint of Morphological and physiological traits of roots and their relationships with water productivity in watersaving and drought-resistant rice. Field Crops Res. 2014, 165, 36–48. [Google Scholar] [CrossRef]
  37. Sun, H.; Bi, Y.; Tao, J.; Huang, S.; Hou, M.; Xue, R.; Liang, Z.; Gu, P.; Yoneyama, K.; Xie, X.; et al. Strigolactones Are Required for Nitric Oxide to Induce Root Elongation in Response to Nitrogen and Phosphate Deficiencies in Rice: Modulation of Root Elongation by N and P Supply. Plant Cell Environ. 2016, 39, 1473–1484. [Google Scholar] [CrossRef] [PubMed]
  38. Eissenstat, D.M. Costs and Benefits of Constructing Roots of Small Diameter. J. Plant Nutr. 1992, 15, 763–782. [Google Scholar] [CrossRef]
  39. Boring, T.J.; Thelen, K.D.; Board, J.E.; De Bruin, J.L.; Lee, C.D.; Naeve, S.L.; Ross, W.J.; Kent, W.A.; Ries, L.L. Phosphorus and Potassium Fertilizer Application Strategies in Corn–Soybean Rotations. Agronomy 2018, 8, 195. [Google Scholar] [CrossRef]
  40. Dodd, J.R.; Mallarino, A.P. Soil-test phosphorus and crop grain yield response to long-term phosphorus fertilization for corn-soybean rotations. Soil Sci. Soc. Am. J. 2005, 69, 1118–1128. [Google Scholar] [CrossRef]
  41. Xin, W.; Liu, H.; Zhao, H.; Wang, J.; Zheng, H.; Jia, Y.; Yang, L.; Wang, X.; Li, J.; Li, X.; et al. The response of grain yield and root morphological and physiological traits to nitrogen levels in paddy rice. Front Plant Sci. 2021, 12, 1–15. [Google Scholar] [CrossRef]
Figure 1. Destructively measured biomass of shoot, root, and grain per plant from different treatments at 42 d after transplanting (a) and 102 d after transplanting (b). Vertical bars indicate ± SE (n = 3); * represents a statistically significant difference (p < 0.05) compared with the no fertilizer treatment.
Agronomy 12 00023 g001
Figure 2. Non−invasive measurements of the total root length per plant (a) and root extension rates per plant (b) from transplanting stage to 42 d after transplanting in rice plants under various fertilization combinations grown in the rhizo-box experiment. Vertical bars indicate ± SE (n = 3).
Agronomy 12 00023 g002
Figure 3. The images of rice root grown in rhizo-box at 42 d after transplanting at the 0–30 cm soil depth.
Agronomy 12 00023 g003
Figure 4. Destructively measured the total root length (a), root length density (b), root number (c), and specific root length (d) of per plant at 42 d after transplanting. Vertical bars indicate ± SE (n = 3). The lowercase letters indicate the statistical difference between treatments (p < 0.05).
Agronomy 12 00023 g004
Figure 5. Destructively measured vertical profiles of total root length (a), root length density (b), root number (c), and root biomass (d) per plant up to a 30 cm soil depth at 42 d after transplanting (the root soil was divided into three 10-cm sections from the top to bottom of each rhizo-box). Vertical bars indicate ± SE (n = 3).
Agronomy 12 00023 g005
Figure 6. Destructively measured root oxidation activity (a), total roots absorption area (b), and roots active absorption area (c) for rice at 42 d after transplanting. Vertical bars indicate ± SE (n = 3). The lowercase letters indicate a significant difference among the treatments (p < 0.05).
Agronomy 12 00023 g006
Table 1. The amount of N, P, and K fertilizers used in different treatments for the rhizo-box experiment.
TreatmentsN
(g box−1)
P
(g box−1)
K
(g box−1)
Non−F000
P040
K000.8
PK040.8
N2.0800
NK2.0800.8
NP2.0840
NPK2.0840.8
N was applied as urea (46% N), P as calcium superphosphate (12% P2O5), and K as potassium chloride (60% K2O).
Table 2. Total N uptake per plant, N uptake per unit root length, N uptake per unit root biomass, apparent recovery efficiency of N fertilizer (NRE), and root to shoot ratio for rice at 42 days after transplanting.
TreatmentTotal N Uptake
(mg Plant−1)
N Uptake per
Unit Root Length
(mg m−1)
N Uptake per
Unit Root Biomass
(mg g−1)
NRE
(%)
Root to Shoot
Ratio
Non−F6.9 ± 0.1 d0.98 ± 0.01 d36.3 ± 0.4 cna0.187 ± 0.005 a
PK7.6 ± 0.1 d0.96 ± 0.01 d36.2 ± 0.4 cna0.190 ± 0.007 a
N44.1 ± 0.3 c2.82 ± 0.02 c 63.3 ± 0.4 b9.7 ± 0.1 c0.172 ± 0.014 b
NK48.7 ± 0.4 c3.11 ± 0.02 c65.6 ± 0.5 b10.4 ± 0.1 c0.172 ± 0.005 b
NP73.7 ± 0.3 b4.15 ± 0.01 b81.9 ± 0.3 a17.4 ± 0.1 b0.163 ± 0.007 b
NPK95.6 ± 0.9 a4.63 ± 0.05 a79.9 ± 0.8 a23.0 ± 0.2 a0.165 ± 0.009 b
Vertical bars indicate ± SE (n = 3). The lowercase letters indicate statistical differences between the treatments (p < 0.05).
Table 3. Total N uptake per plant, apparent NRE, agronomic N use efficiency (NAE), physiological N use efficiency (NPE), and internal N use efficiency (NIE) for rice plants at 102 d after transplanting.
TreatmentTotal N Uptake
(mg Plant−1)
NRE
(%)
NAE
(g g−1)
NPE
(g g−1)
NIE
(g g−1)
Non−F66.1 ± 1.1 dnsnsns44.1 ± 1.3 a
PK67.4 ± 2.2 dnsnsns44.3 ± 2.5 a
N 152.0 ± 6.9 c18.0 ± 0.6 c7.5 ± 0.5 c41.5 ± 1.2 a 42.8 ± 1.0 b
NK164.3 ± 5.5 c20.5 ± 1.3 c8.7 ± 1.0 c42.2 ± 2.4 a43.2 ± 2.6 b
NP224.4 ± 8.9 b33.1 ± 1.8 b13.9 ± 1.4 b42.0 ± 1.9 a42.8 ± 3.2 b
NPK298.8 ± 11.4 a48.4 ± 1.5 a19.2 ± 1.0 a39.0 ± 1.0 b40.1 ± 1.4 c
Vertical bars indicate ± SE (n = 3). The lowercase letters indicate statistical differences between the treatments (p < 0.05).
Publisher’s Note: MDPI stays neutral with regard to jurisdictional claims in published maps and institutional affiliations.

