Article

Resting Subtropical Grasslands from Grazing in the Wet Season Boosts Biocrust Hotspots to Improve Soil Health

1
NUE Lab, School of Agriculture and Food Sciences, The University of Queensland, St Lucia, QLD 4074, Australia
2
Department of Natural Resources, Institute of Plant Sciences, Agricultural Research Organization Gilat Research Center, Negev 8531100, Israel
3
Queensland Department of Agriculture and Fisheries, Charters Towers, QLD 4820, Australia
4
NT Department of Industry, Tourism and Trade, Darwin, NT 0801, Australia
*
Author to whom correspondence should be addressed.
Agronomy 2022, 12(1), 62; https://doi.org/10.3390/agronomy12010062
Submission received: 11 November 2021 / Revised: 15 December 2021 / Accepted: 21 December 2021 / Published: 28 December 2021

Abstract

:
Effective grazing management in Australia’s semi-arid rangelands requires monitoring landscape conditions and identifying sustainable and productive practice through understanding the interactions of environmental factors and management of soil health. Challenges include extreme rainfall variability, intensifying drought, and inherently nutrient-poor soils. We investigated the impacts of grazing strategies on landscape function—specifically soil health—as the foundation for productive pastures, integrating the heterogenous nature of grass tussocks and the interspaces that naturally exist in between them. At Wambiana—a long-term research site in north-eastern Australia—we studied two soil types, two stocking rates (high, moderate), and resting land from grazing during wet seasons (rotational spelling). Rotational spelling had the highest biocrust (living soil cover), in interspaces and under grass tussocks. Biocrusts were dominated by cyanobacteria that binds soil particles, reduces erosion, sequesters carbon, fixes nitrogen, and improves soil fertility. Rotational spelling with a moderate stocking rate emerged as best practice at these sites, with adjustment of stocking rates in line with rainfall and soil type recommended. In drought-prone environments, monitoring the presence and integrity of biocrusts connects landscape function and soil health. Biocrusts that protect and enrich the soil will support long-term ecosystem integrity and economic profitability of cattle production in rangelands.

Graphical Abstract

1. Introduction

Beef cattle grazing is the dominant industry in Australia’s subtropical and tropical savannas and grasslands that cover much of the continent. Vast grazing properties of 10- to 100-thousand hectares require land managers to maintain pasture composition and production [1]. Inherently nutrient-poor soils and highly variable rainfall mainly driven by ENSO (El Niño/La Niña Southern Oscillation) cycles constrain the quantity and quality of forage. Significant economic loss [2] and declines in ecosystem function [3] result from a failure to manage for seasonal rainfall variability and landscape heterogeneity at large spatial scales. Northern Australia’s rangelands, the focus of this study, have a distinct dry season over mild winter months followed by a hot summer wet season (2–6 months) when most pasture growth occurs. Resting the landscape (i.e., temporary cattle removal) during the dry winter months when grasses are dormant is deemed ineffective, while resting during the summer growing season can improve composition and production of perennial grasses [2]. However, the benefits of resting are modulated by stocking rates, as resting combined with excessive stocking does not improve pasture [1,4], while conservative stocking rates with year-round grazing, or some wet season resting, facilitated recovery and productive pastures [4]. These findings demand refinement; Australia is the hottest and driest continent and profoundly impacted by climate change, it is therefore a matter of urgency to identify sustainable practices [5]. Much of the continent has experienced rainfall declines accompanied by more frequent and intensive droughts and rising temperatures [6]. Managing sustainability and profitably is a challenge for northern Australian beef producers, as cattle carrying capacity and pasture productivity is heavily influenced by month-to-month and year-to-year rainfall variability [7]. The principles of good grazing management require sound methods of landscape monitoring and understanding how land management and ecosystems interact. Our focus is soil health as a critical factor for grazing extensive rangelands. Soil and biological nitrogen fixation provide the essential nutrient elements for plant growth and productivity. In environments where nutrient cycling is limited by soil moisture, most nutrients occur within the upper few centimeters of the soil [8]. While most nutrients become available via decomposition of organic matter and soil weathering, nitrogen input occurs via bacterial (biological) fixation of atmospheric nitrogen, so that nitrogen removed through grazing and export of the herd can be replenished. Nitrogen as a renewable source is important. It is the essential building block of proteins, and accounts for over 60% of the essential nutrients. Additionally, low nitrogen often limits pasture productivity, particularly in high rainfall years [9,10]. Insufficient nitrogen availability limits both productivity and pasture quality, and low forage quality is a major constraint to cattle production that leads to poor weight gains—or even weight loss—in northern Australian rangelands [11]. Landscape function analysis (LFA) [12] is a widely used monitoring tool for quantifying soil health, soil fertility and effects of land management in context of the spatial organization of the landscape. A range of parameters link to the flow of resources across a patchy landscape, facilitate the quantification of landscape heterogeneity, and define resilience to disturbance. Here, we applied LFA’s soil function indices to understand the role of microorganism communities that cover the soil surface, so-called biocrusts (also termed biological, microbiotic or cryptogamic crusts). By quantifying the presence of biocrusts with different grazing management, we examined their contribution to the nutrient content of grazed rangelands. Biocrusts form at the critical zone between the soil and atmosphere, and are a key component of soil function [13], including nutrient cycling, water infiltration, and soil stability [14]. In northern Australia’s rangelands, biocrusts grow between perennial grasses and contain diverse bacterial communities and non-vascular plants such as liverworts [15]. These biocrusts are dominated by photosynthesizing cyanobacteria that exude sticky polysaccharides to bind soil particles and protect from erosion. Cyanobacteria and other diazotrophic bacteria improve soil fertility with nitrogen fixation generating bioavailable nitrogen for pasture plants [16,17]. We investigated the drivers of soil function that influence the key principles for grazing management in northern Australia [18] including: (1) manage stocking rates to meet goals for livestock production and land condition, (2) periodically rest pastures to maintain a good condition, and (3) restore pastures from poor condition to increase productivity. It follows that cattle stocking rates influence soil condition through the removal of the understory vegetation with grazing and the trampling of the soil’s surface. Our study used a long-term research site that has tested cattle stocking strategies over 24 years [1] and that is representative of typical cattle properties in the region, albeit at a smaller scale. The objectives of this study were to examine the long-term impacts of heavy and moderate grazing pressure (stocking) and a combination of moderate stocking with wet season resting (rotational spelling) on several response variables of ecosystem function in two contrasting soil types. There is evidence that biocrusts growing in interspaces (open areas) between grass patches perform vital ecosystem functions. A previous study showed that interspaces with nitrogen-fixing biocrust communities had similar nutrient cycling as the soil under grasses [8]. We therefore hypothesized that biocrust-covered interspaces are important drivers of the soil–plant continuum, providing soil stability, water infiltration, and plant-available nutrients. We expect the preferential use of interspaces by cattle as easy passageway to access pasture to be impacted by stocking density, exacerbated by rainfall deficiencies and drought [19]. We also evaluated whether periodic wet season resting from cattle provides the opportunity for biocrust recovery.

2. Materials and Methods

2.1. Site Background

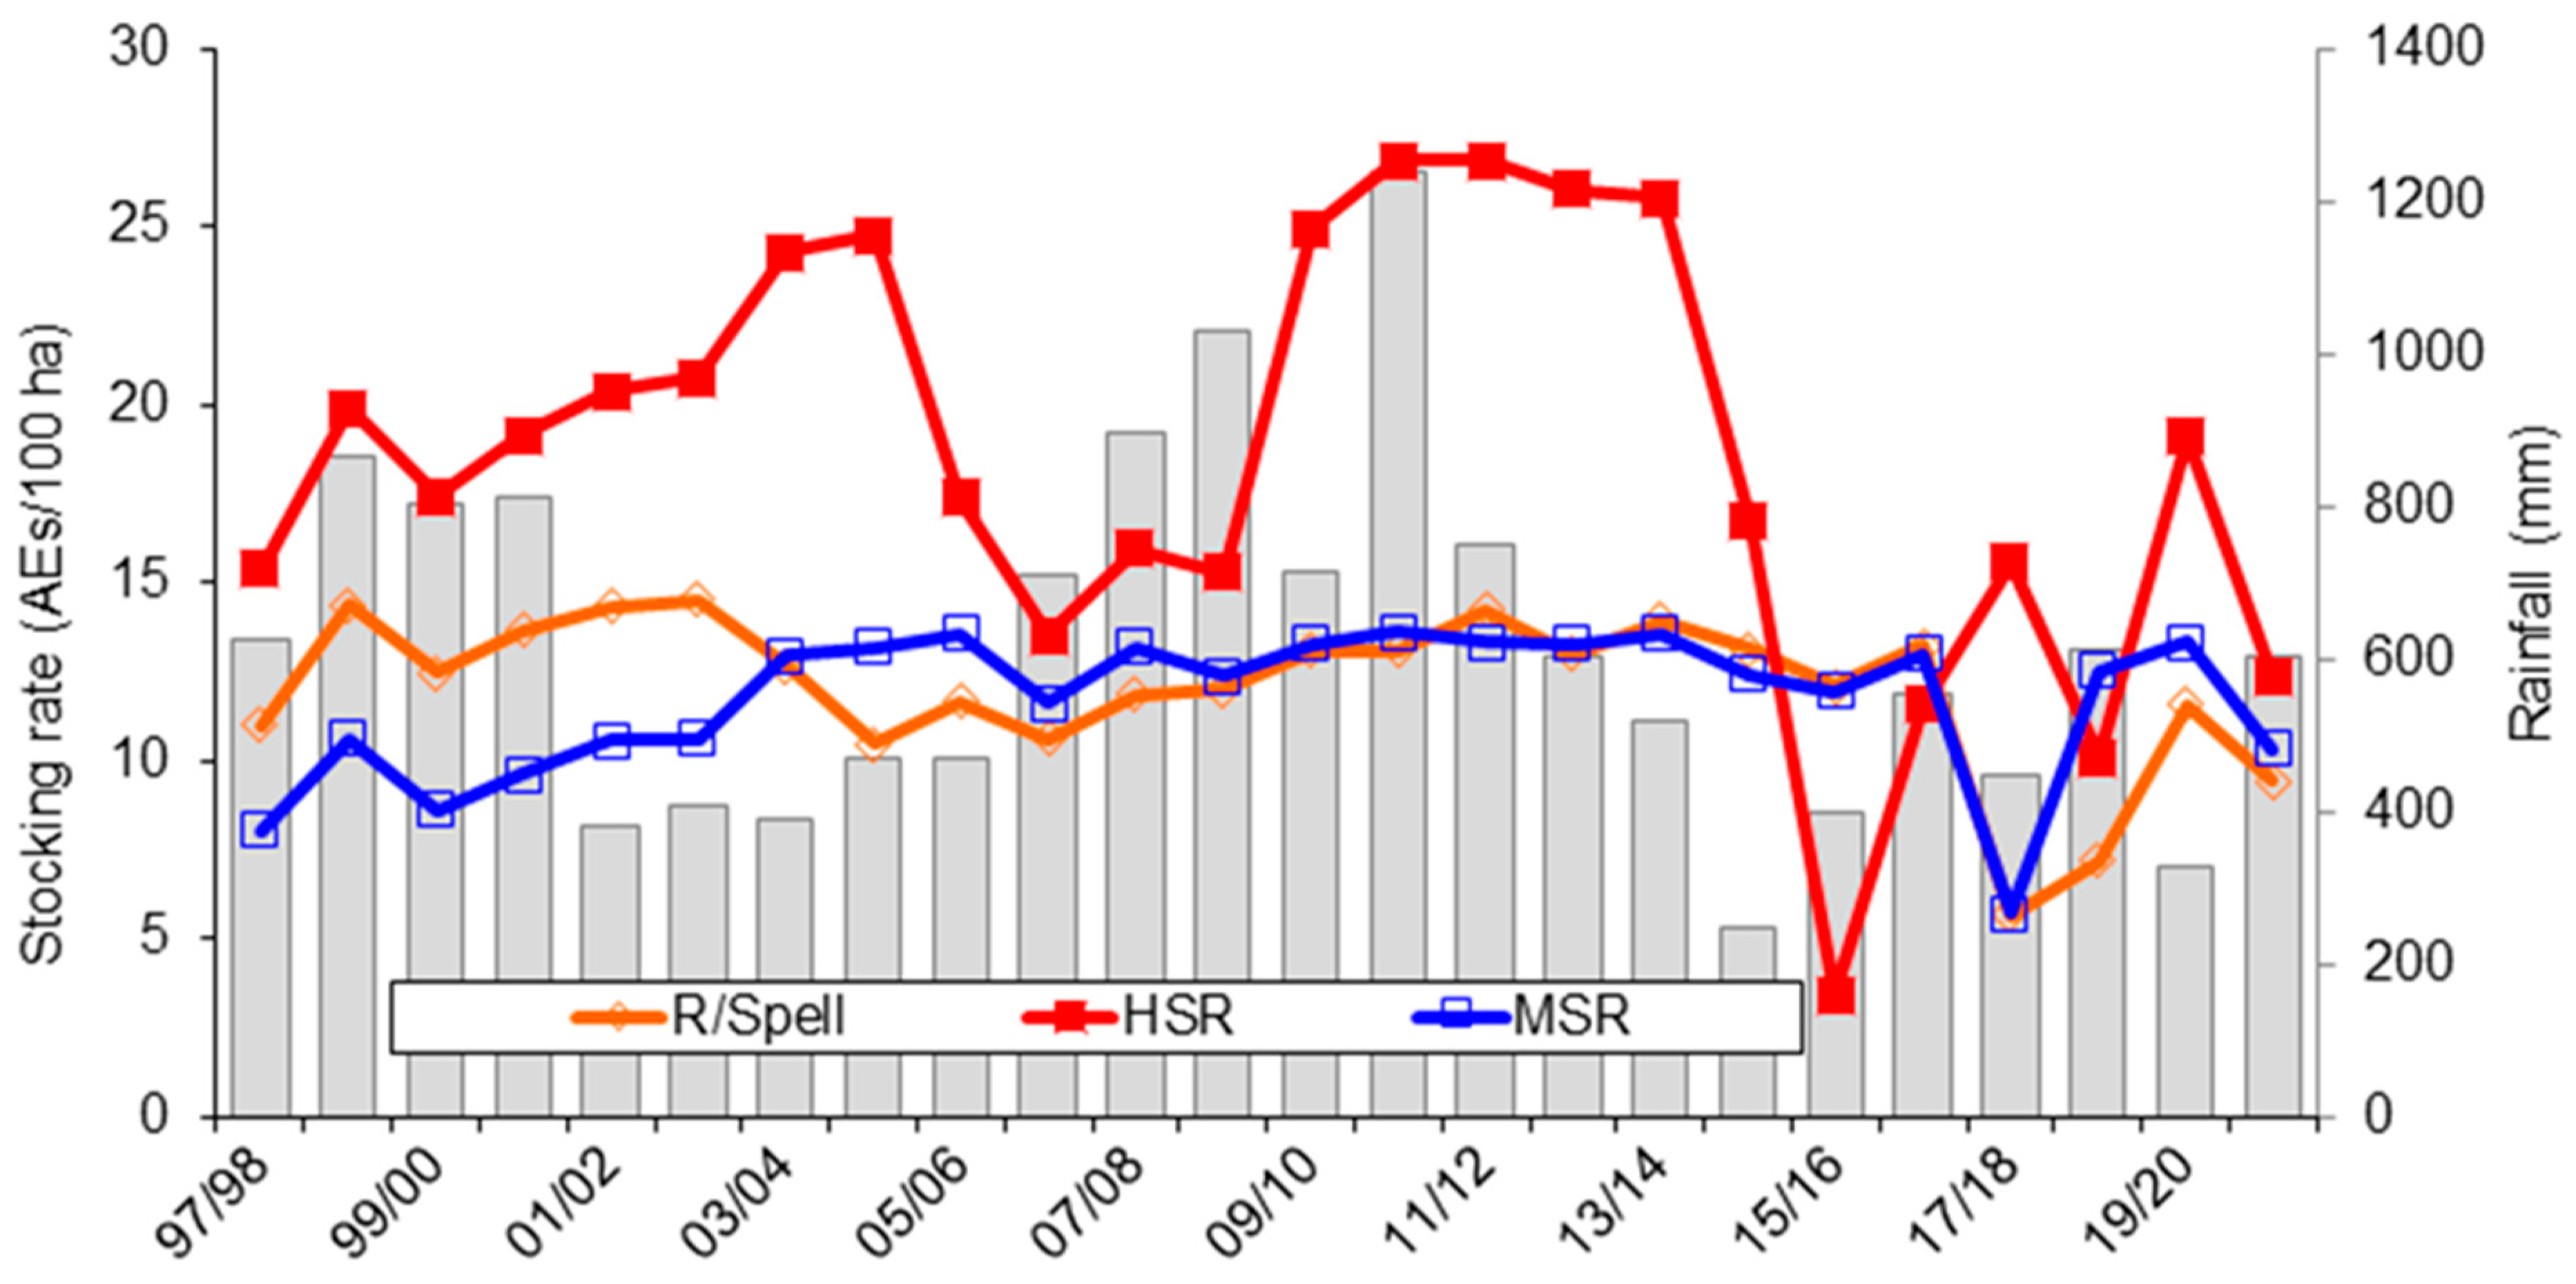
The grazing trial is located on Wambiana, a working cattle station near Charters Towers, Queensland, Australia (wambianastation.com.au (accessed on 3 November 2021)). Average annual rainfall in the region is 630 mm ranging from 200 to 1400 mm with most (70%) rainfall received in the warmer summer months. The vegetation is a relatively open Eucalypt-Acacia woodland underlain by native tropical C4 tussock grasses. The native shrub Carissa ovata is also widespread on some soil types. Stocking strategies are set in response to rainfall and pasture availability. The trial is testing five stocking strategies replicated twice (see [20] for more detail). Paddocks are approximately 100 hectares in size and contain three main soil types (Figure 1). We studied the two main soil types: duplex soils associated with Eucalyptus brownii (Reid River Box) and red-yellow earths associated with E. melanophloia (Mugga Ironbark) [21]. The three main management strategies investigated here were: (1) moderate stocking (MSR) at the recommended 8 to 10 hectares per Adult Equivalent (8 ha/AE, 1 AE = 450 kg), (2) heavy stocking (HSR) at 4 to 5 ha/AE and, (3) moderate stocking with rotational wet season resting (R/Spell) (Figure 2). In addition, we sampled exclosures (XCL) that were small, fenced areas within the paddocks (~25 × 25 m and 5 ha in R/Spell), protected from grazing. In drought years, stock numbers in the HSR were reduced and fed supplements to ensure animal welfare (Figure 2).

2.2. Field Methods

The paddocks consisted of two main soil types and were treated at two levels. Firstly, the whole paddock was treated as a management unit as there was a gradient of soils throughout. This reflects typical grazing properties that comprise large paddocks (hundreds to thousands of hectares) with changing soil types across them. Secondly, ecosystem responses across the paddock were measured within the soil types at the soil cover-biocrust level. Each long-term grazing trial paddock has several permanent one-hectare monitoring sites consisting of five 100-m transects set 20 m apart. Sites are stratified by soil type (Figure 1). Sampling was conducted in November 2020, following a season of well below average rainfall (384 mm) and a succession of five drought years, with 2014/15 the fourth driest year on record. We used the two replicate paddocks for each of the three treatments. On each of the two soil types we selected one monitoring site. Here, we selected two transects (50 m apart), then laid out a 30 m tape in the same direction as the 100 m transect. Alongside these 30 m lines, a 1 m2 quadrat was placed at 6 m intervals (Figure 3). There were two soil types of duplex soils (DC), and red-yellow earths (RY). Two paddocks were selected for each treatment (HSR, MSR, R/Spell, and XCL), two transects per paddock and, six quadrats per transect. Exclosure (XCL) treatments were fenced areas within these paddocks with no access for stock. In total, 24 quadrats per treatment per soil type were assessed.

2.2.1. Landscape Function

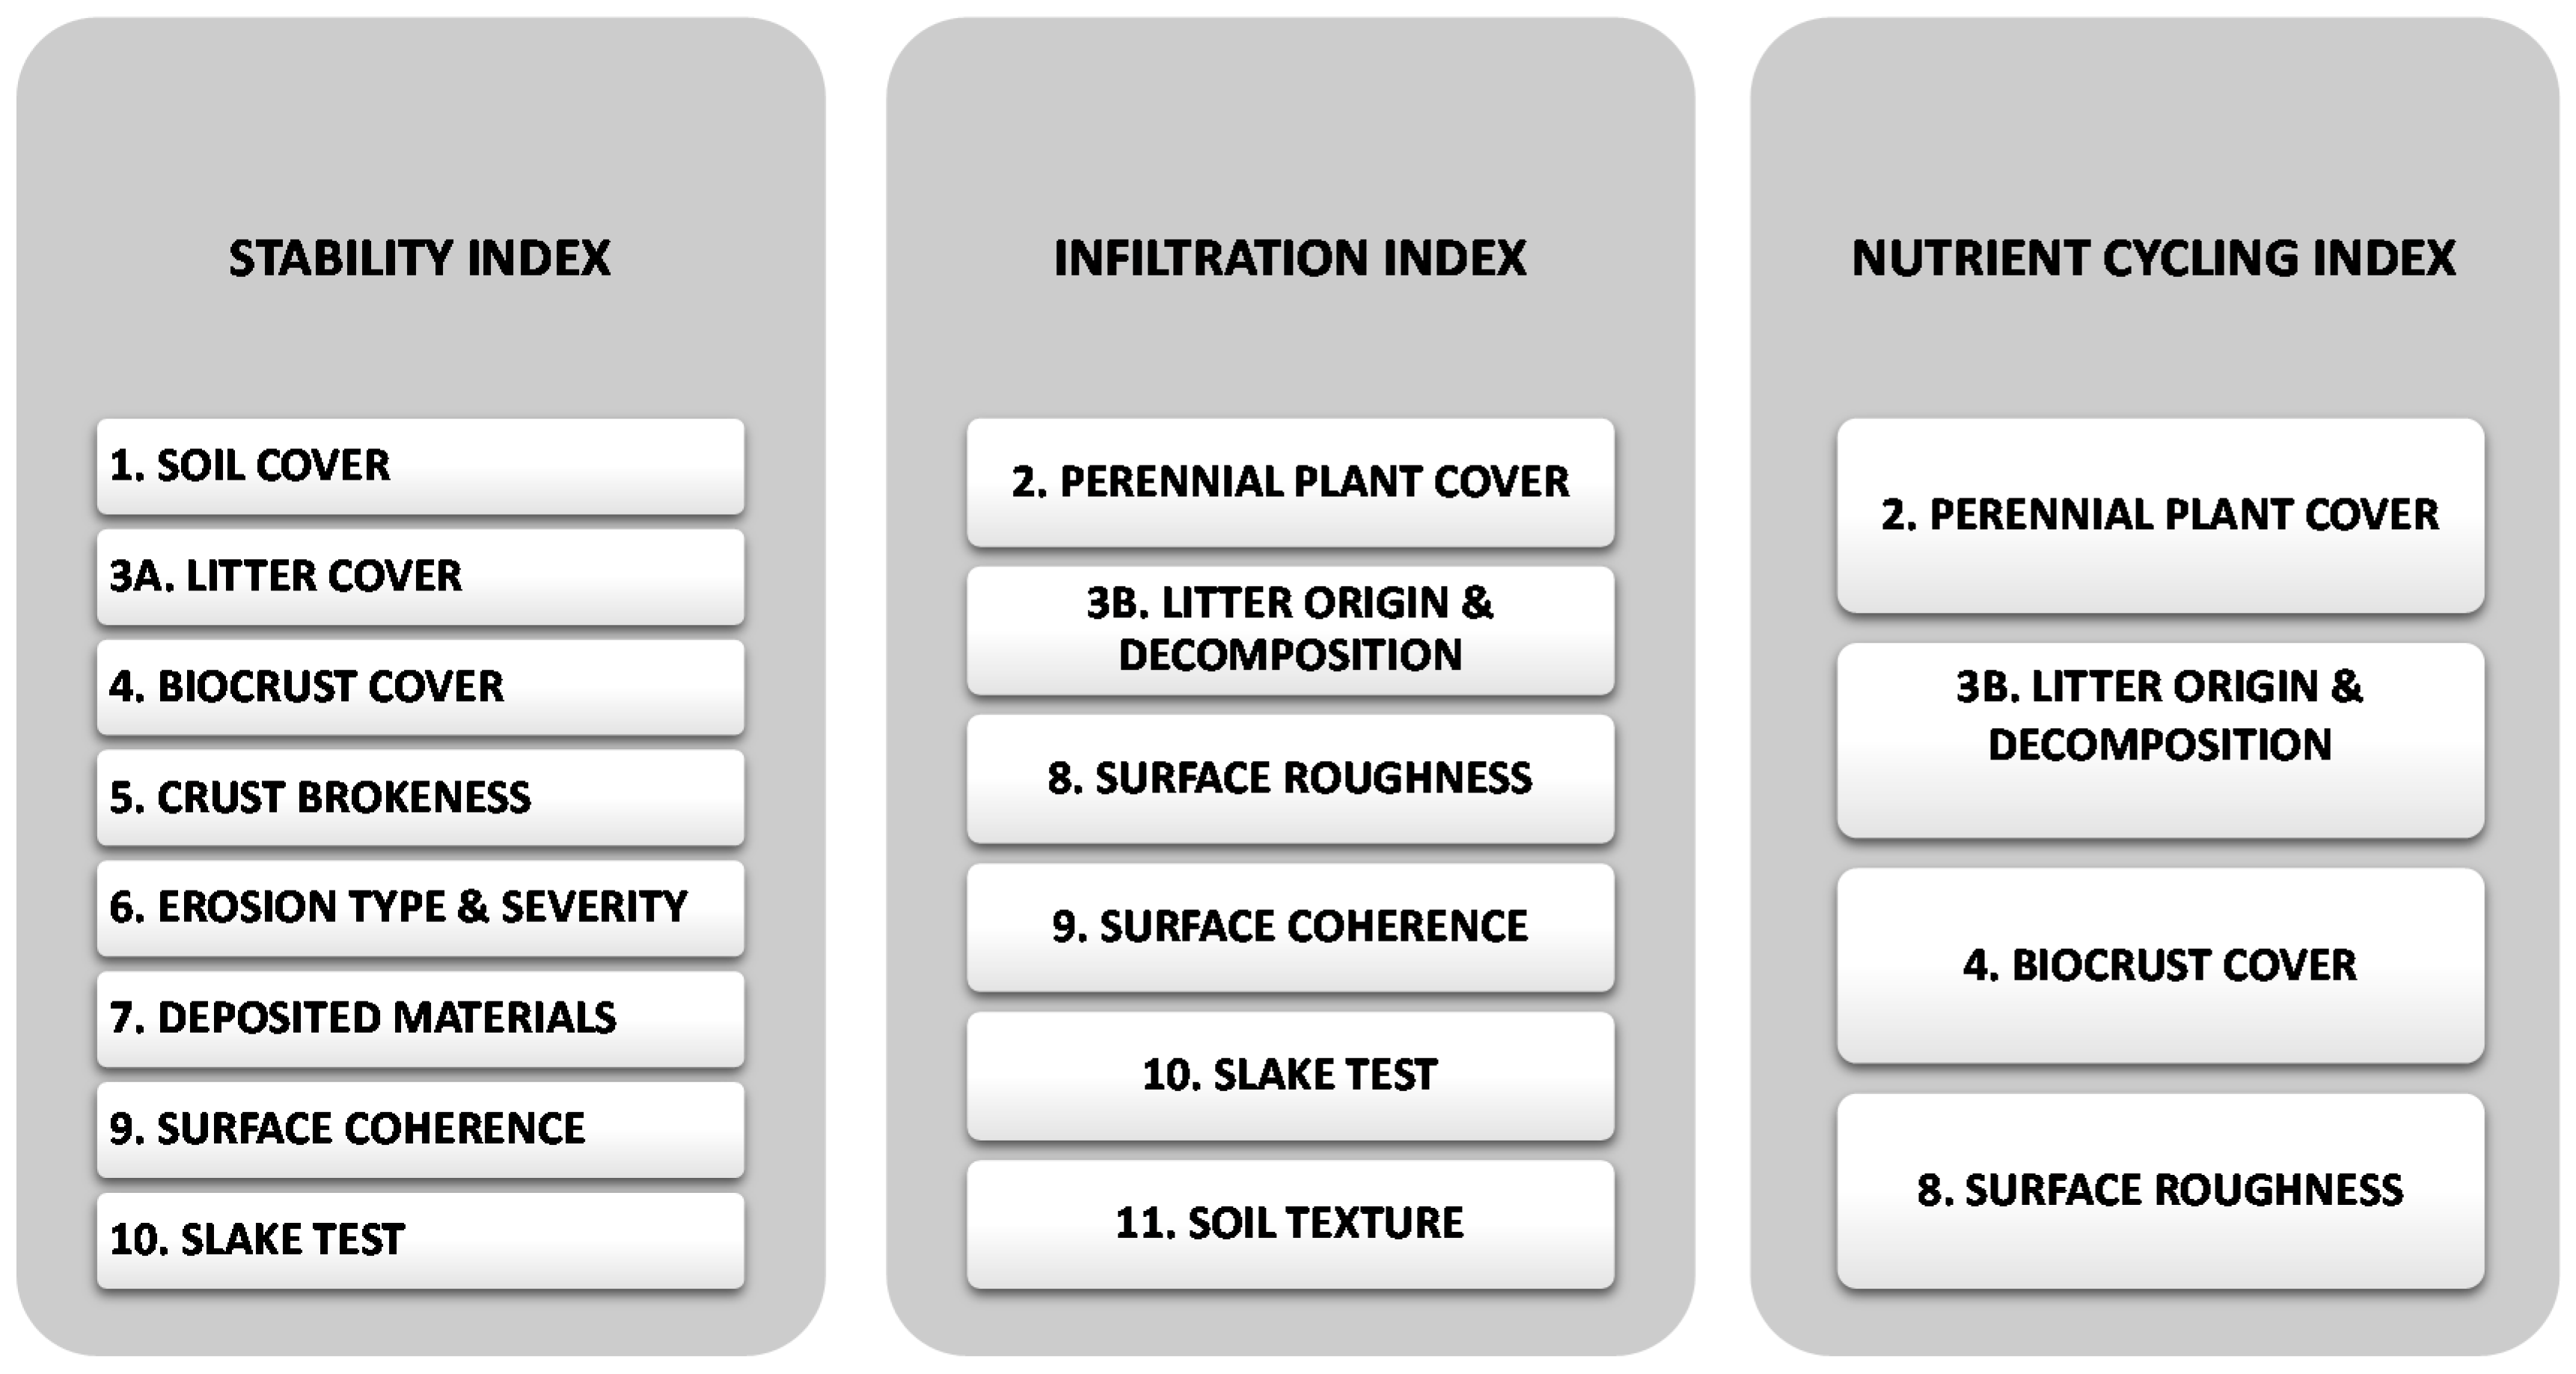
Landscape function analysis (LFA) [12] has been developed to establish soil surface indicators for measuring and analyzing the nature and severity of problems in a dysfunctional or degraded ecosystem [3,22]. The conceptual framework is based on the spatial organization of clumps of grasses and shrubs that capture, accumulate, and retain resources (called patches). The interspaces (or inter-patches) are the open areas between the grass patches and can be natural ‘hotspots’ for biocrusts due to less competition for light, moisture, and litter. In this study, we focused on the role of these biocrust hotspots in determining the three LFA indices: stability, infiltration, and nutrient cycling. These three indices are assessed by 11 soil surface indicators (Figure 4) that are individually scored and provide the percentage level of each index. The indices are a relative measure and are independent of each other. In this study, we assumed the exclosures with no cattle grazing would be a benchmark for the best condition. The higher the index the better the condition. The LFA complete soil surface assessment (SSA) data spreadsheet and detailed methodology is located in the LFA manual [23] and SSA details provided in the Supplementary Material (Figure S1). Our aim was to compare the different management strategies for each of the three indices that were representative of ecosystem function with a focus on the interspaces. For each quadrat, the LFA attributes were recorded and ranked (Figure S1). Later, they were separated into their dominant category: patches or interspaces. Only the interspaces were used in the data analysis and separately analyzed as either biocrust dominant (cover > 10% based on LFA category assessments) or bare soil dominant (where biocrust cover < 10%). For each treatment and soil type there were at least five quadrat replicates used in the analysis. Quadrats that matched the criteria were analyzed on separate soil surface assessment (SSA) worksheets in the LFA program.

2.2.2. Ground Cover

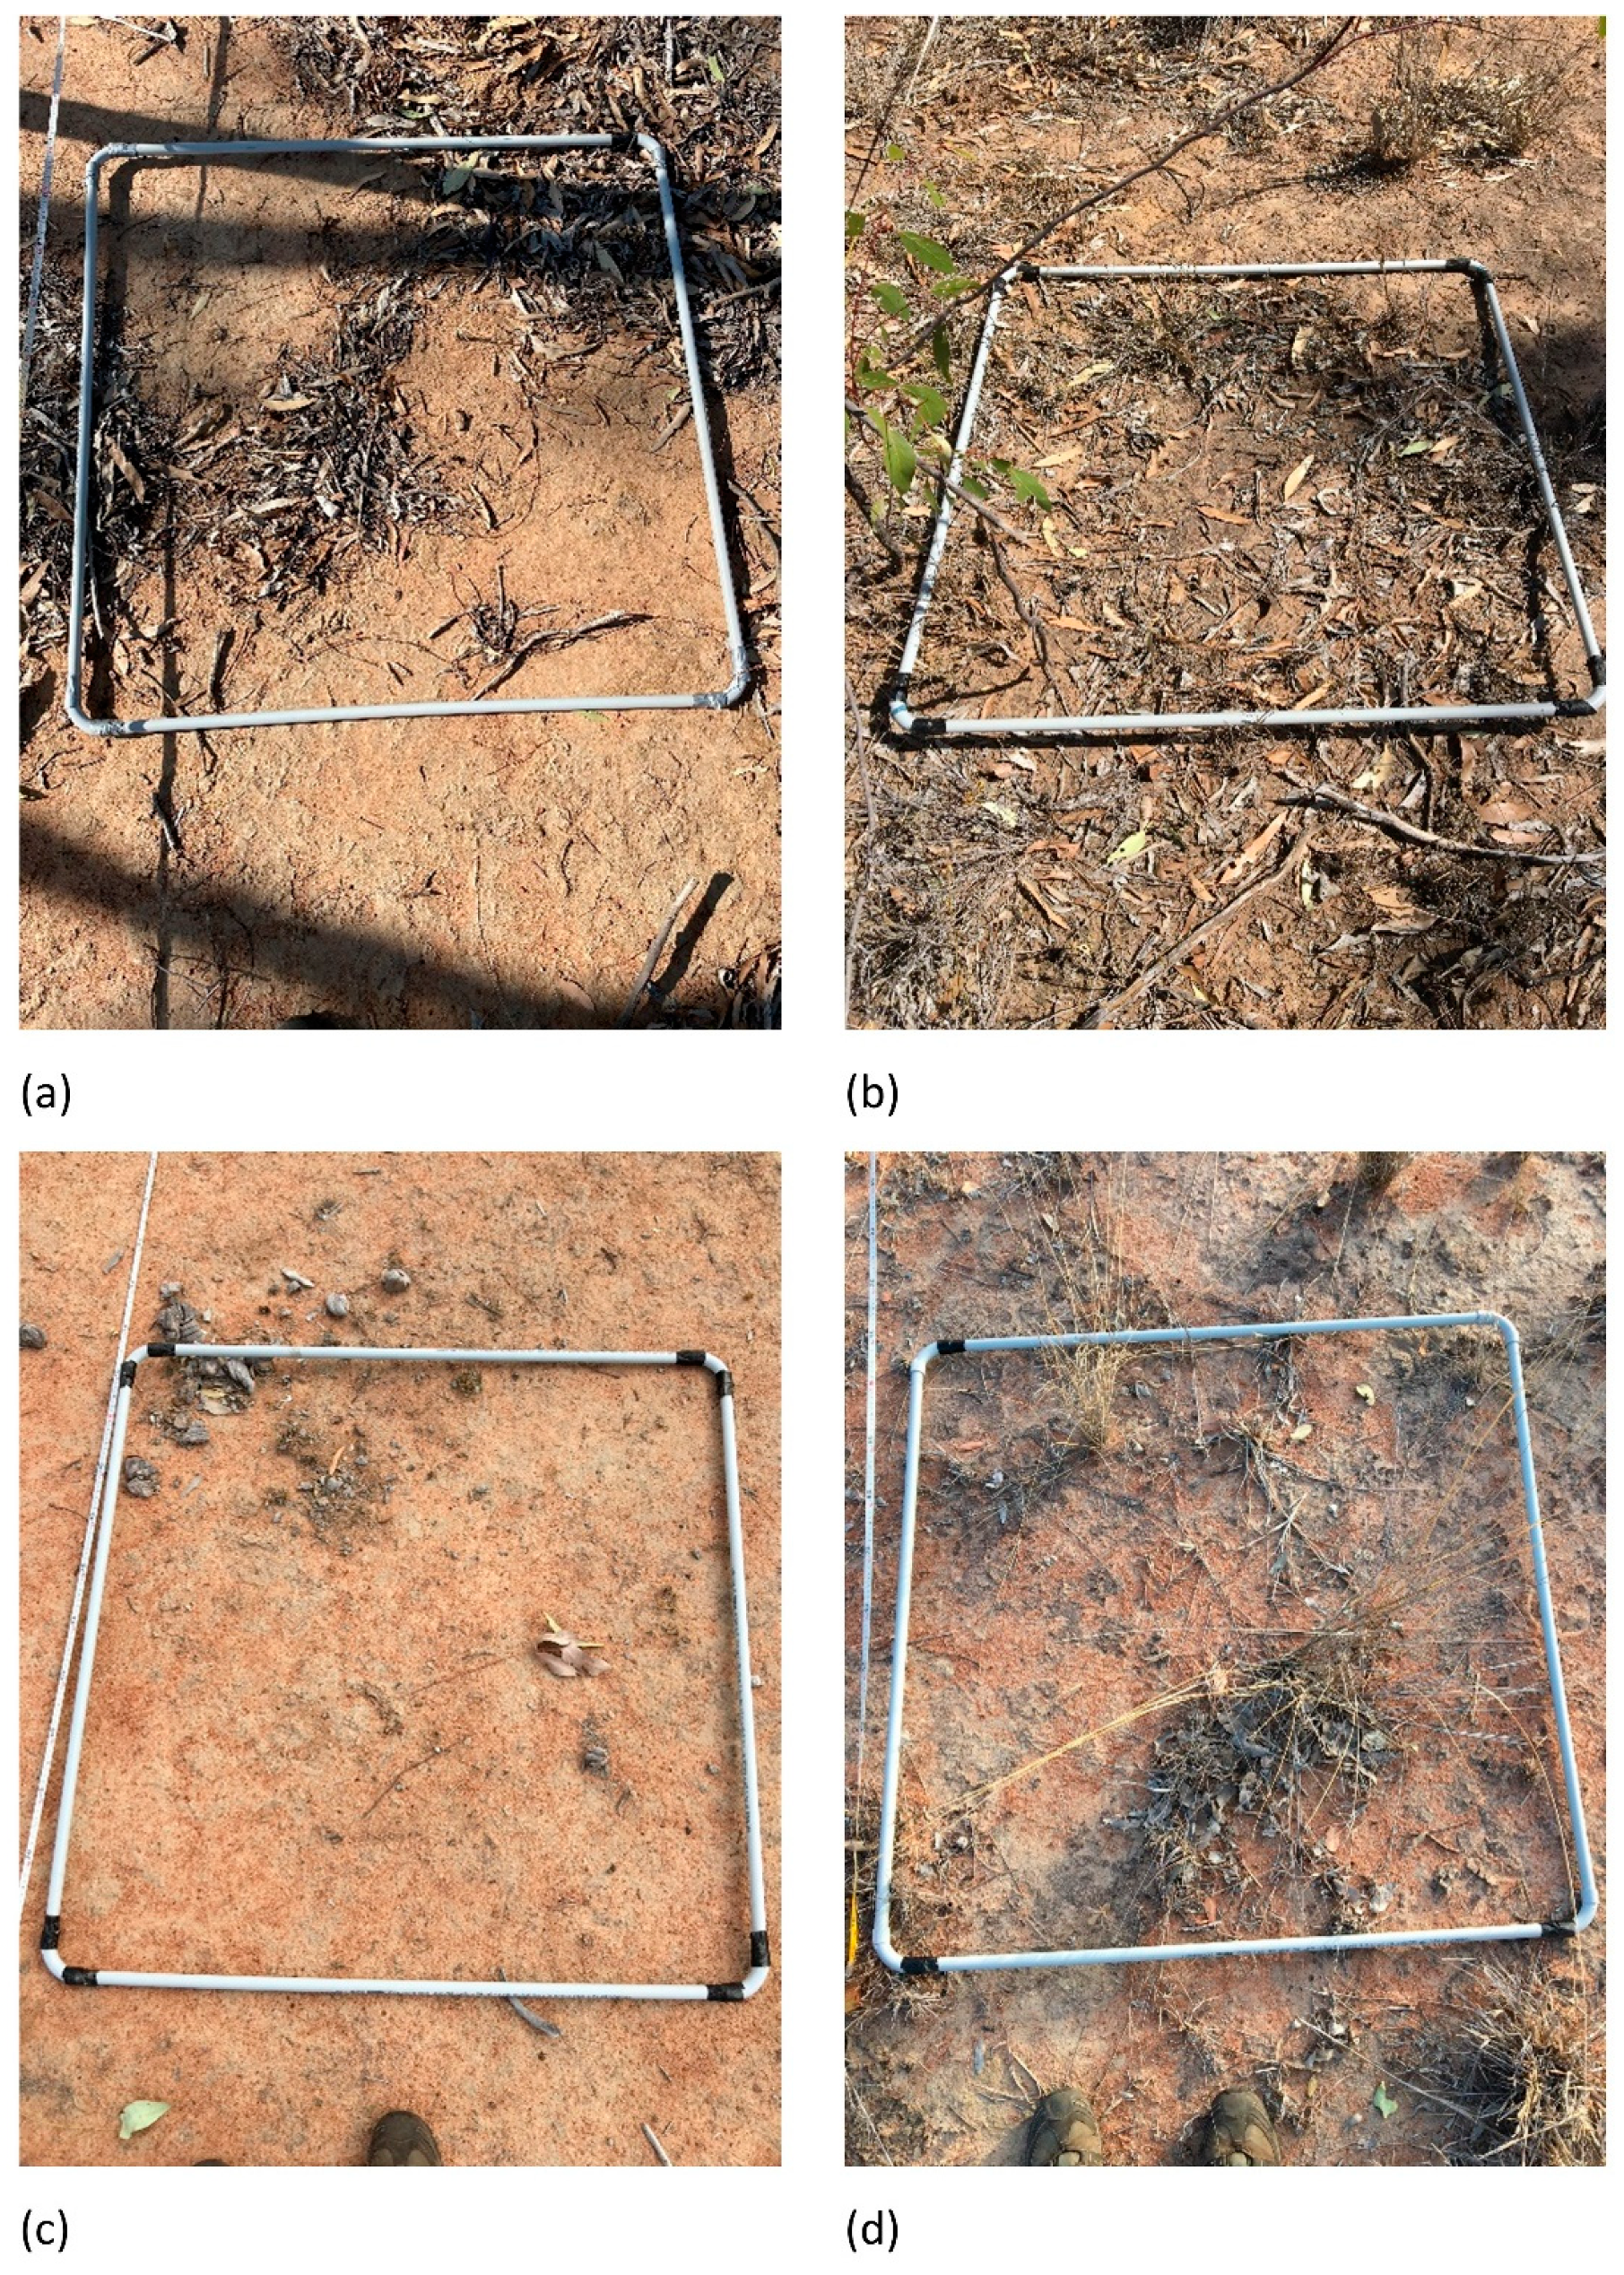
Ground cover was measured in each 1 m2 quadrat (Figure 5) in two ways. Firstly the overall grass cover was recorded; C. ovata patches were identified separately. This was followed by estimating the ground-level cover for each component as a total percentage of the cover categories within each quadrat. These categories comprised biocrust, bare soil, basal area of grass plants, and litter cover and equaled 100%.

2.3. Biocrust Structure

Scanning Electron Microscope (SEM) Imaging

Representative biocrusts for imaging were selected from samples collected on 11–13 November 2020. The images were processed at the University of Queensland’s Centre for Microscopy and Microanalysis. Double-sided carbon stickers were attached to round aluminum specimen stubs. Silver conducting paint was added to the stickers for enhanced stability of biocrust samples. Sections were made to appropriate sizes to fit on to stubs and placed using tweezers. After samples were prepared on stubs, they were coated with platinum, using the Safematic CCU-010 Compact Coating Unit. Ensuring the appropriate settings were in use, the chamber was pressurized before samples were coated for 10 s. Following platinum coating, samples were positioned on the viewing stage of the Hitachi TM4000Plus II Tabletop Scanning Electron Microscope© (Hitachi High-Technologies Corporation Tokyo, Japan). Three samples were added to the stage at one time, and individually imaged.

2.4. Statistical Analysis

We examined the differences in biocrusts, bare soil, basal grass area, and litter cover across all treatments using ANOVAs (Minitab V20, [24]) and applied Tukey’s method to identify significant differences between treatments. To establish the three LFA indices for all quadrats, we processed the attributes in the LFA spreadsheet , available online accompanying the manual [22] and detailed in Section 2.2.1. Once the indices had been calculated, we examined the differences in a General Linear Model with fixed factors to look at the effect on the three stocking levels for each variable. We then used Tukey’s pairwise comparison tests to determine where significant differences occurred between treatments.

3. Results

3.1. Biocrust Hotspots in Duplex Soils

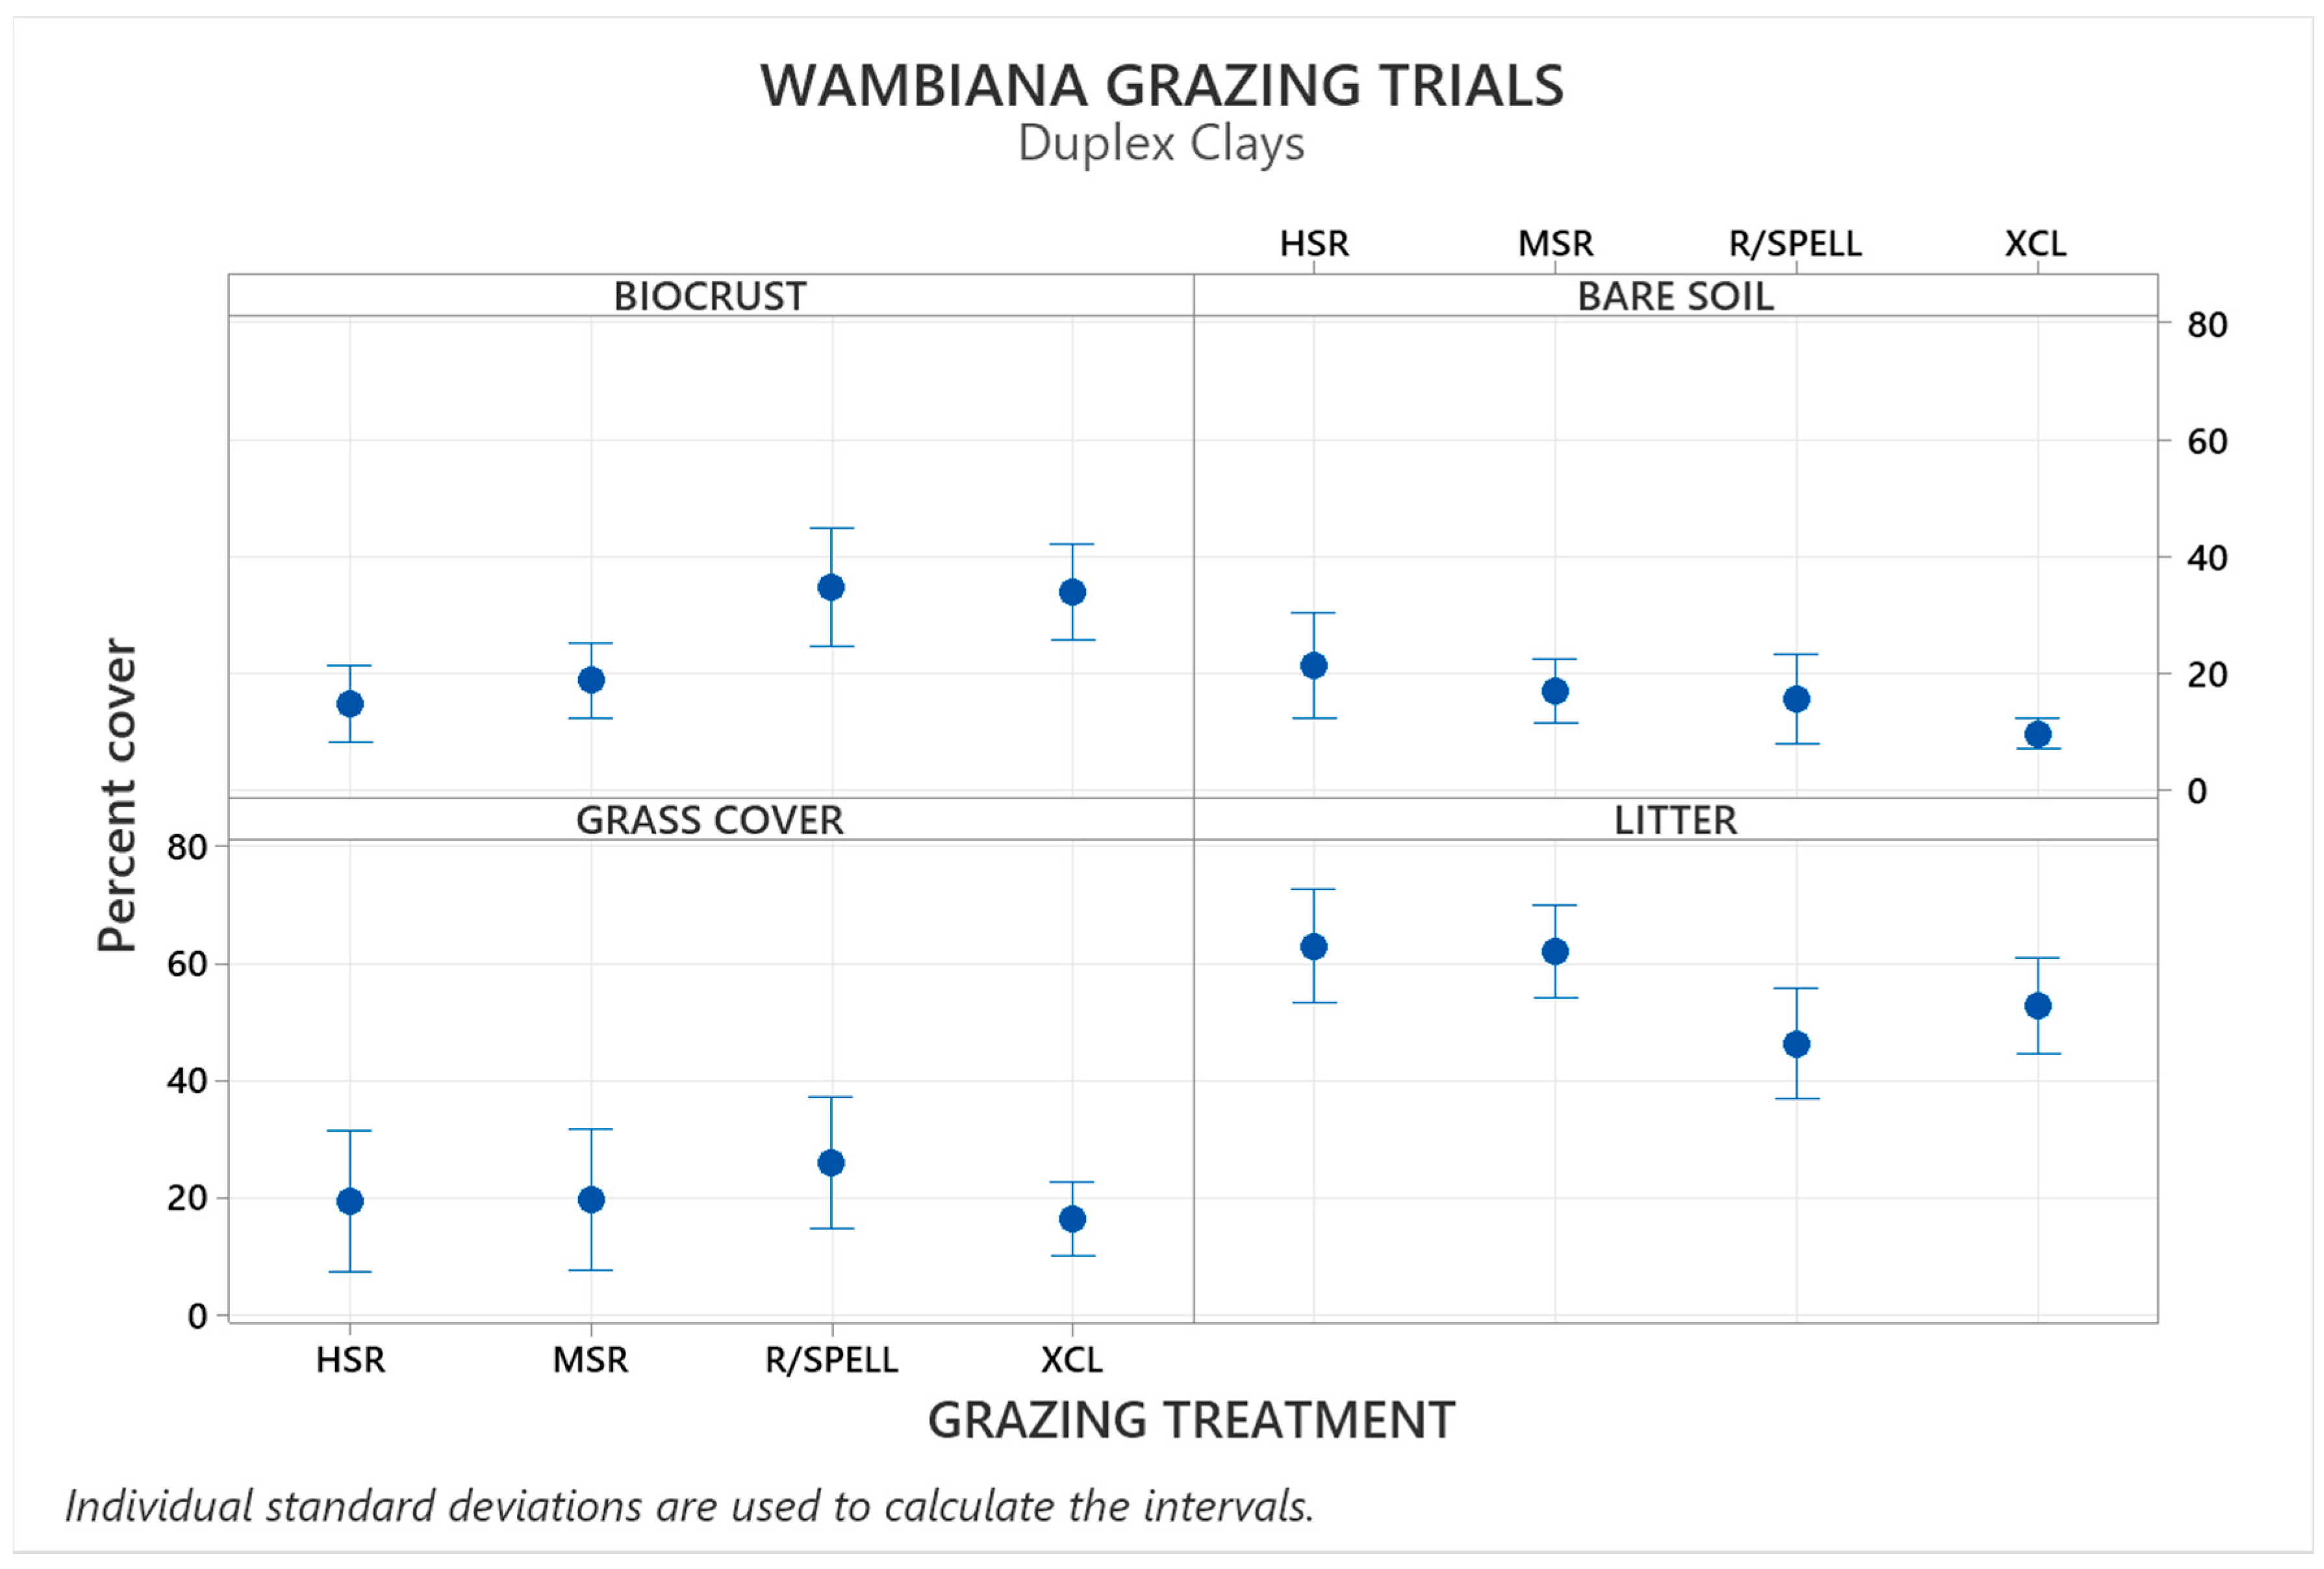
The biocrust cover was significantly higher in the exclosures (XCL), and the rotational spelled paddocks (R/Spell) compared to the heavily (HSR) and moderately (MSR) stocked paddocks (p < 0.001). Biocrust cover across the XCL and R/Spell averaged ~34%, about double that of both MSR (18.7%) and HSR (14.6%) (Figure 6).
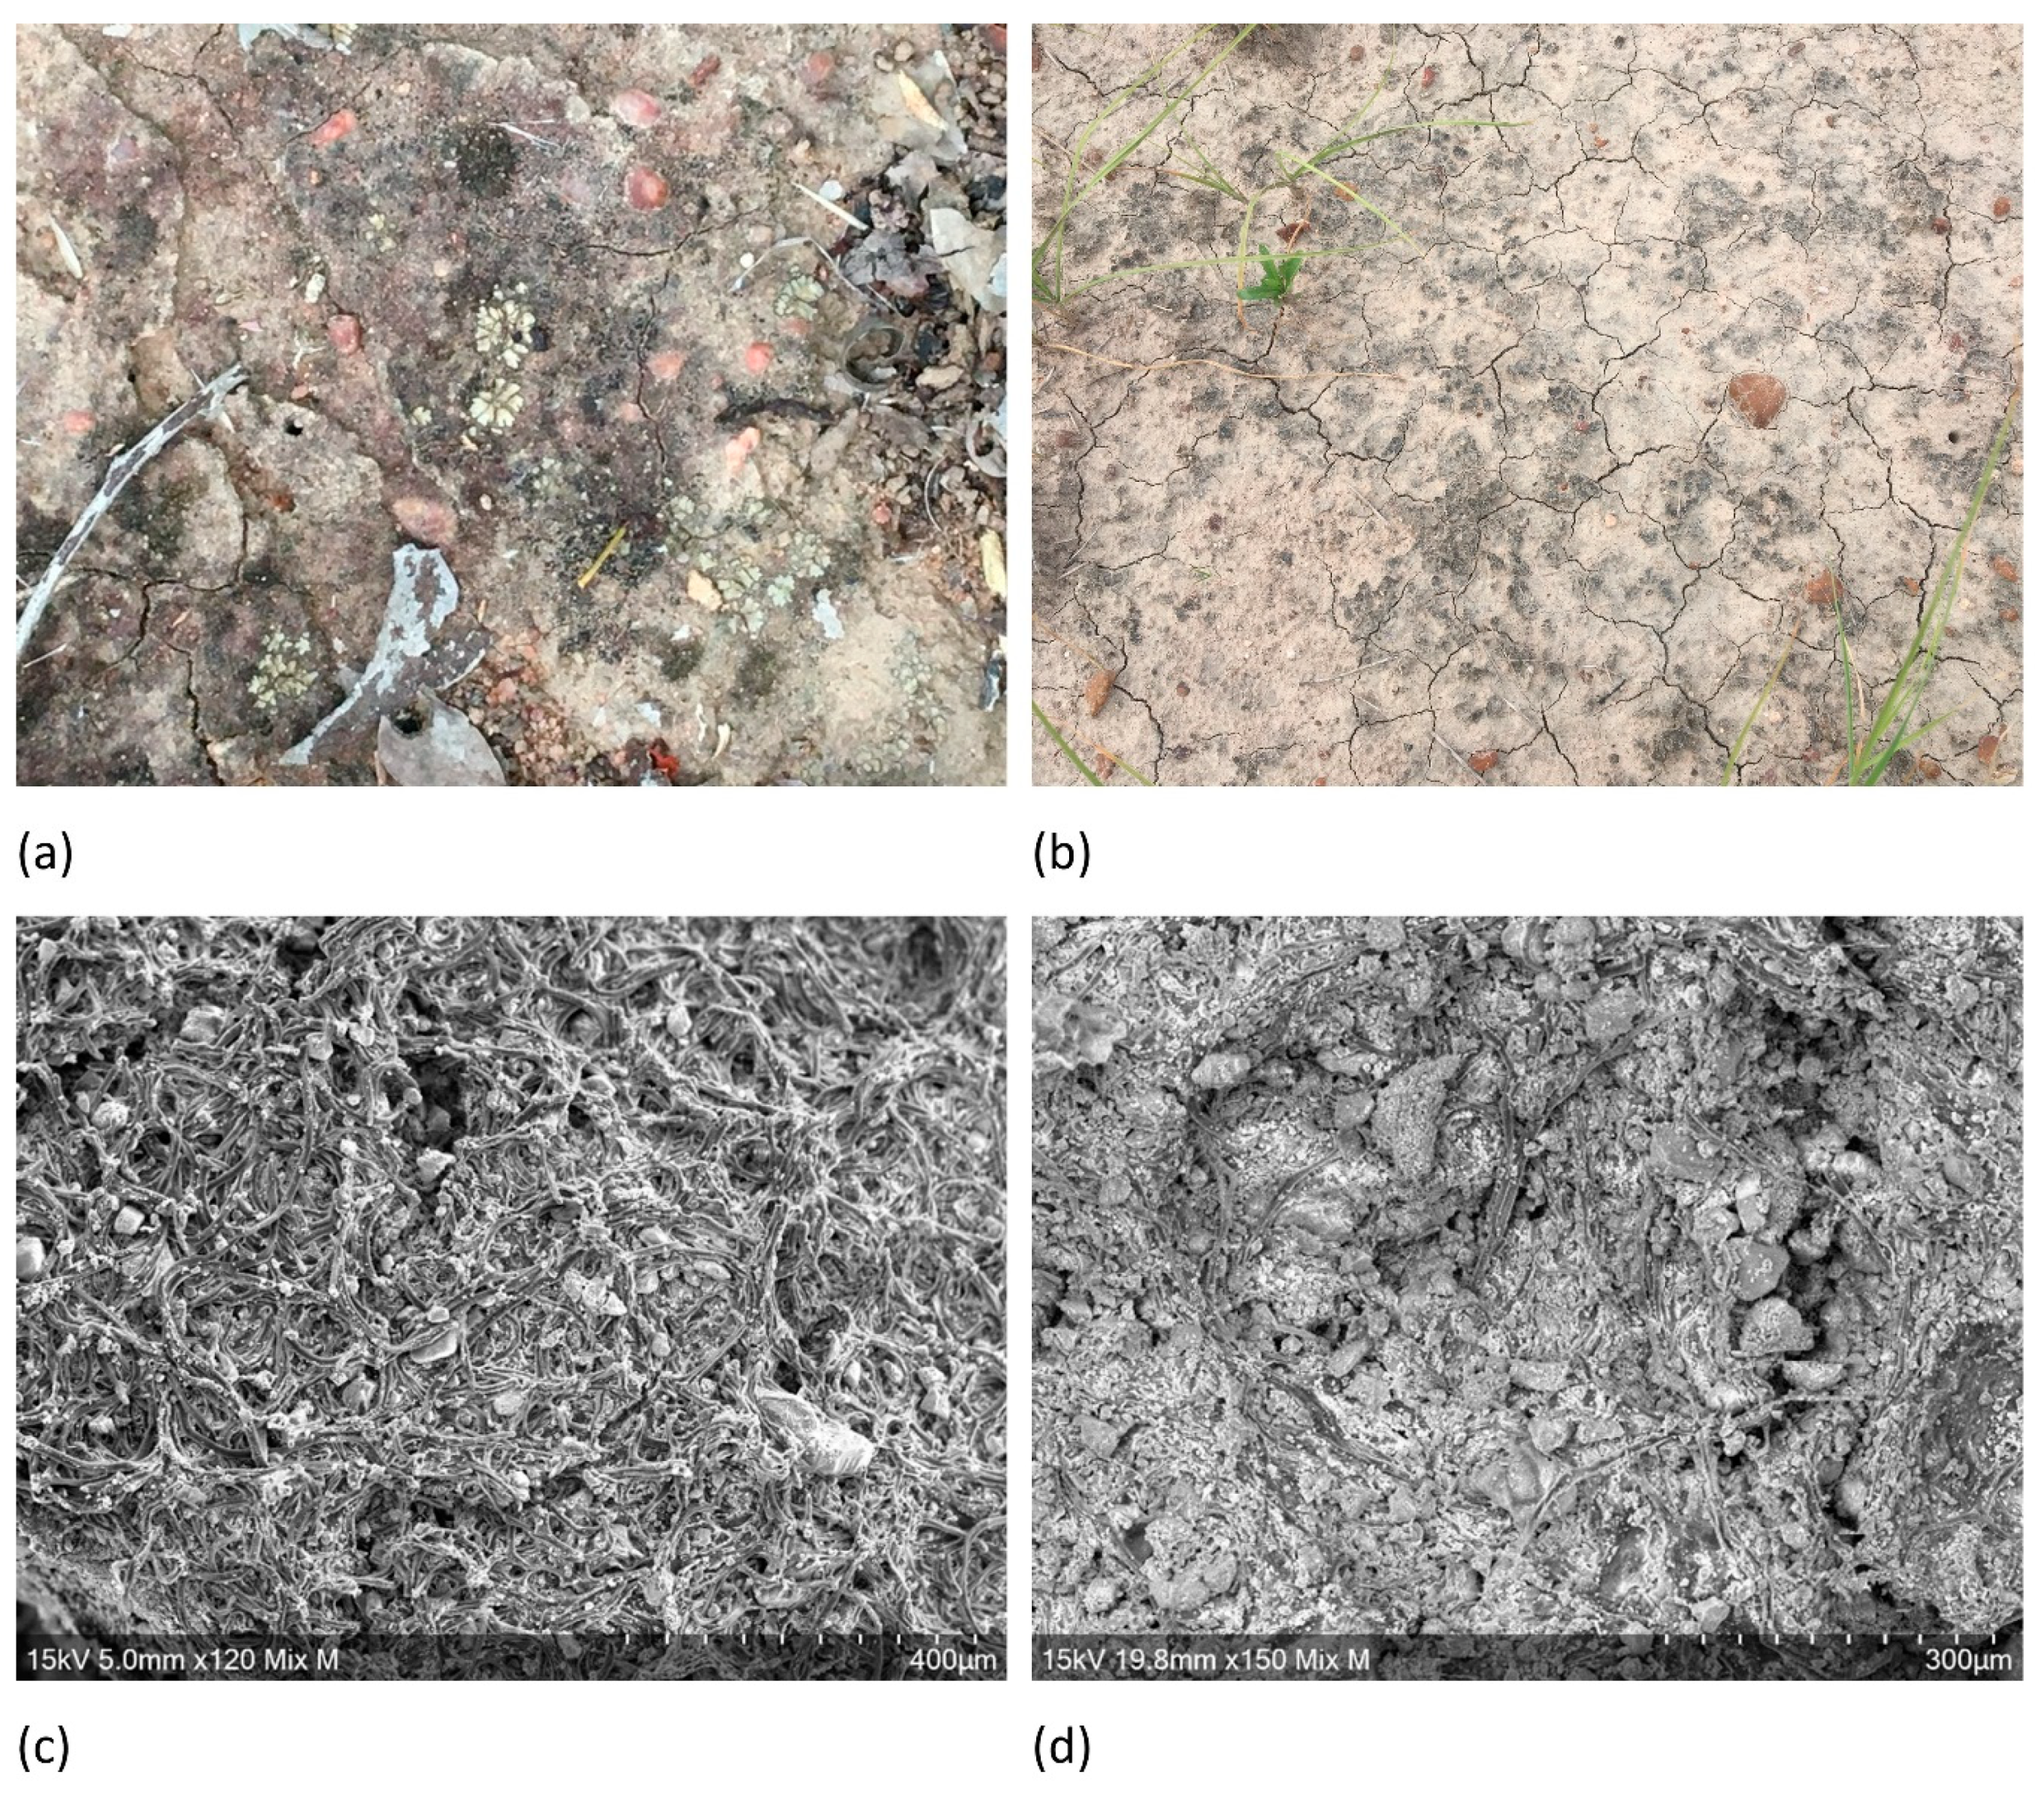
In-paddock observations, followed by SEM, demonstrated well-developed and cyanobacterial dominated biocrusts in the XCL’s and R/Spell treatments compared to HSR treatments that were almost completely devoid of biocrust (Figure 7). Bare ground cover was significantly lower in the exclosures (9.6%) compared with HSR (p = 0.03, 21.3%) but were similar between XCL, MSR, and R/Spell (9.6–16.9%). There were no significant differences between treatments for grass/shrub or litter cover (Figure 6).

3.2. Biocrusts in Red-Yellow Earths

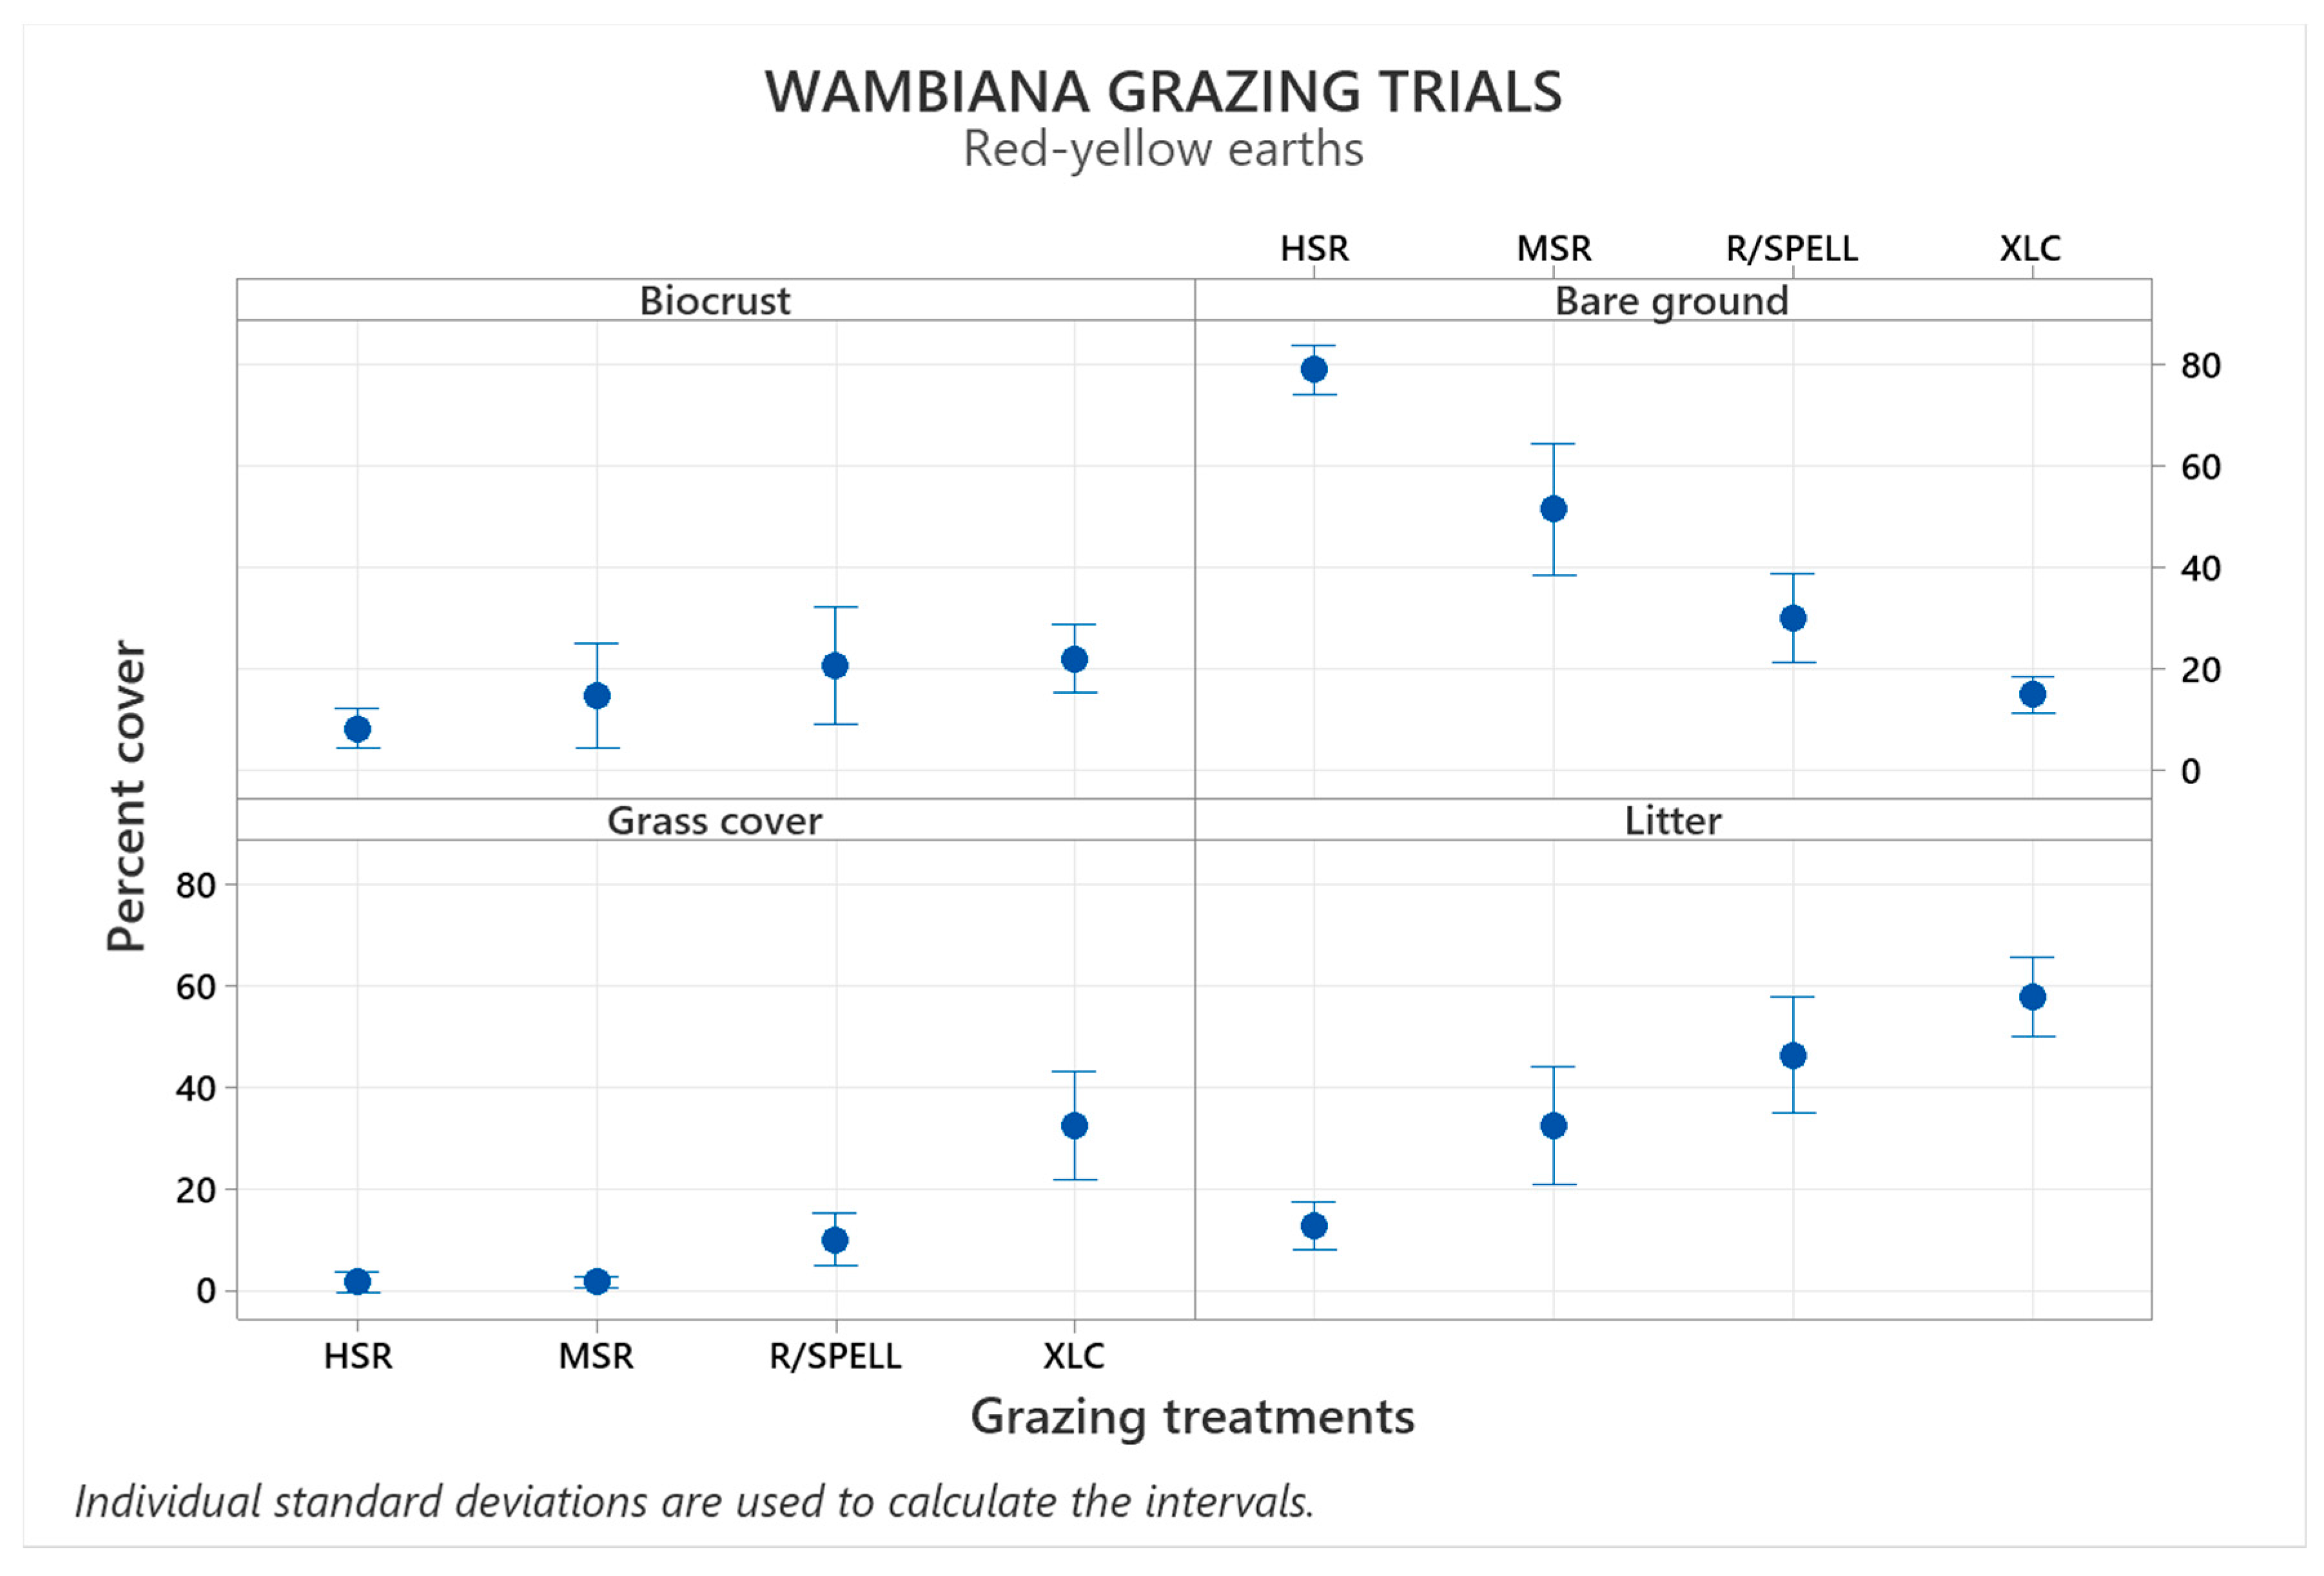
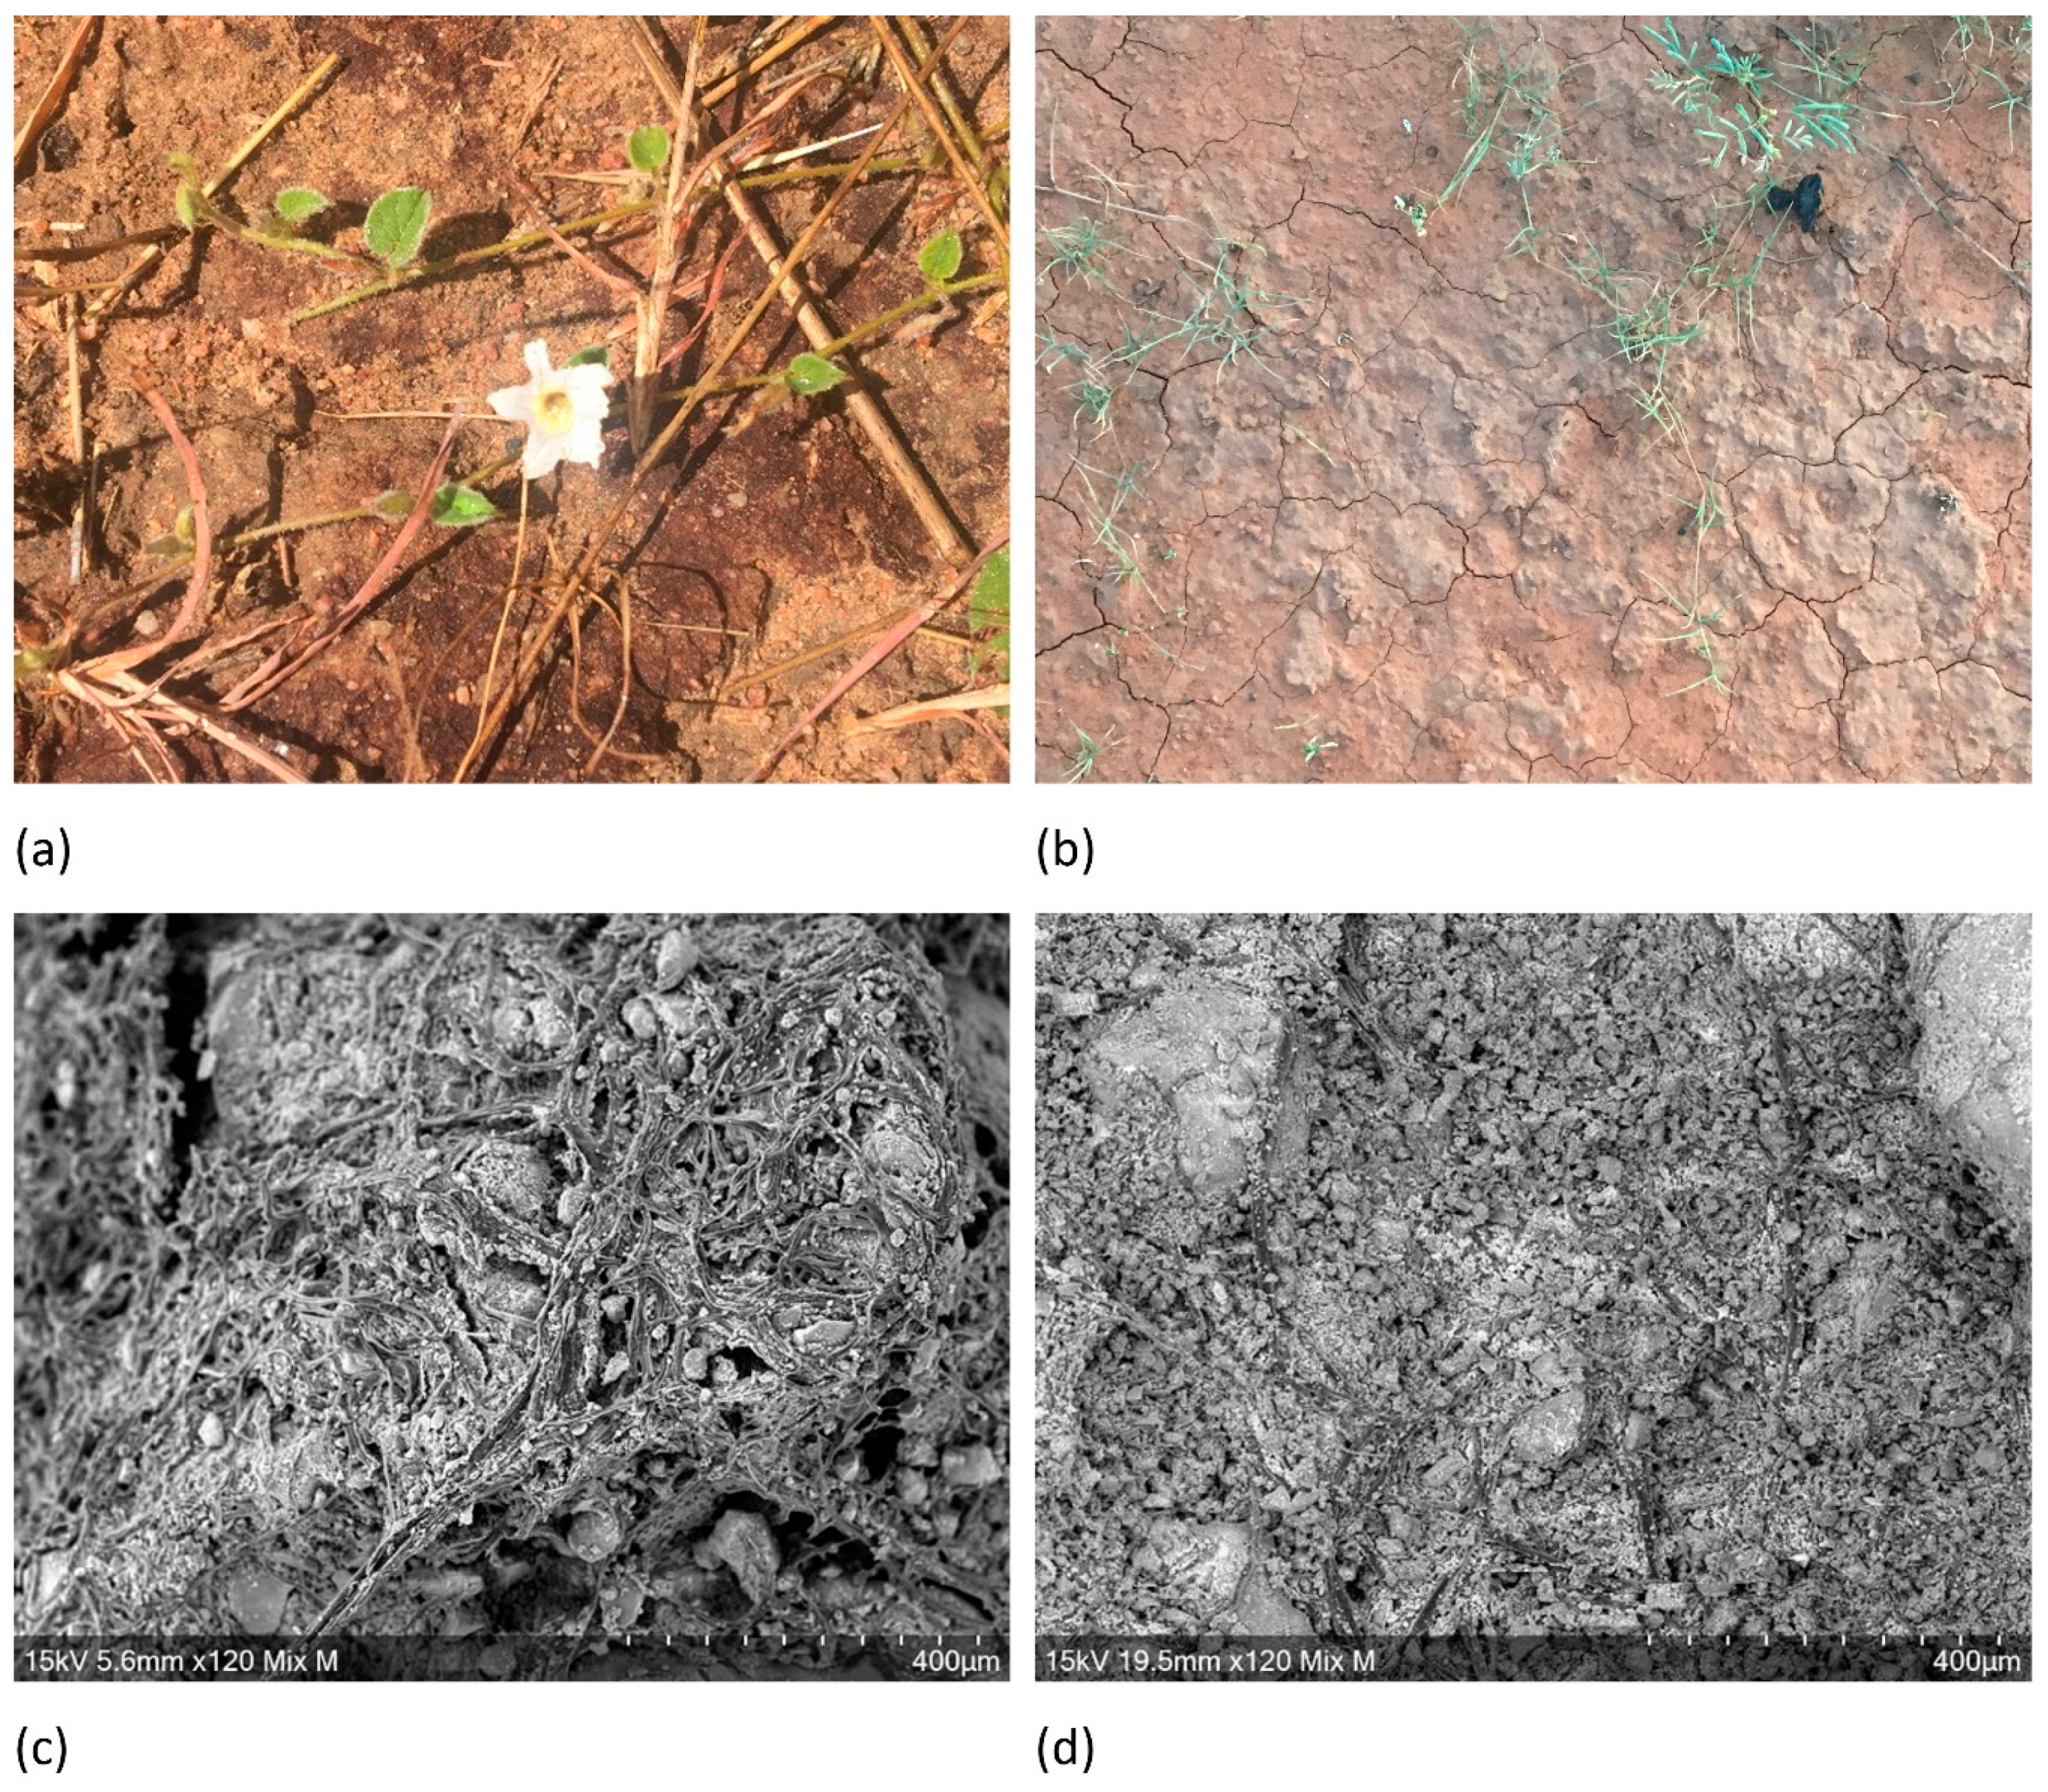
The red-yellow earths (RY) did not significantly differ in their biocrust cover across grazing treatments; however, the bare ground in the heavily grazed paddocks was up to 2.5 times higher than the XCL, R/Spell and MSR (p < 0.001). Overall, the various treatments were significantly different from each other where the bare ground cover (mean % ± SD) in the XCL was the lowest (14.8 ± 11.75) and R/Spell (29.9 ± 20.7) compared to the HSR (79 ± 11.5) and MSR (51.4 ± 30.9), (Figure 8). Observations in the paddock showed that the biocrusts on the RY soils were often thin and fragile and easily broken. We followed up with SEM that confirmed cyanobacterial dominated biocrusts in the XCL, and HSR were almost devoid of biocrust (Figure 9). Grass and litter cover were both significantly different across the grazing treatments (p < 0.001). Although grass cover (mean % ± SD) in the XCL was by far the highest (32.4 ± 34.3), this was also highly variable. However, HSR and MSR were similar (1.6 ± 5.1% and 1.6 ± 2.4% respectively) while R/Spell grass cover was 9.9 ± 12.3%, highly variable and statistically similar to HSR and MSR. Litter cover ranged from 57.7% (XCL) to 12.7% (HSR), with a significant difference between the XCL and R/Spell (p < 0.001); however, these were significantly different from MSR and HSR (Figure 8).

3.3. Landscape Function across Interspaces

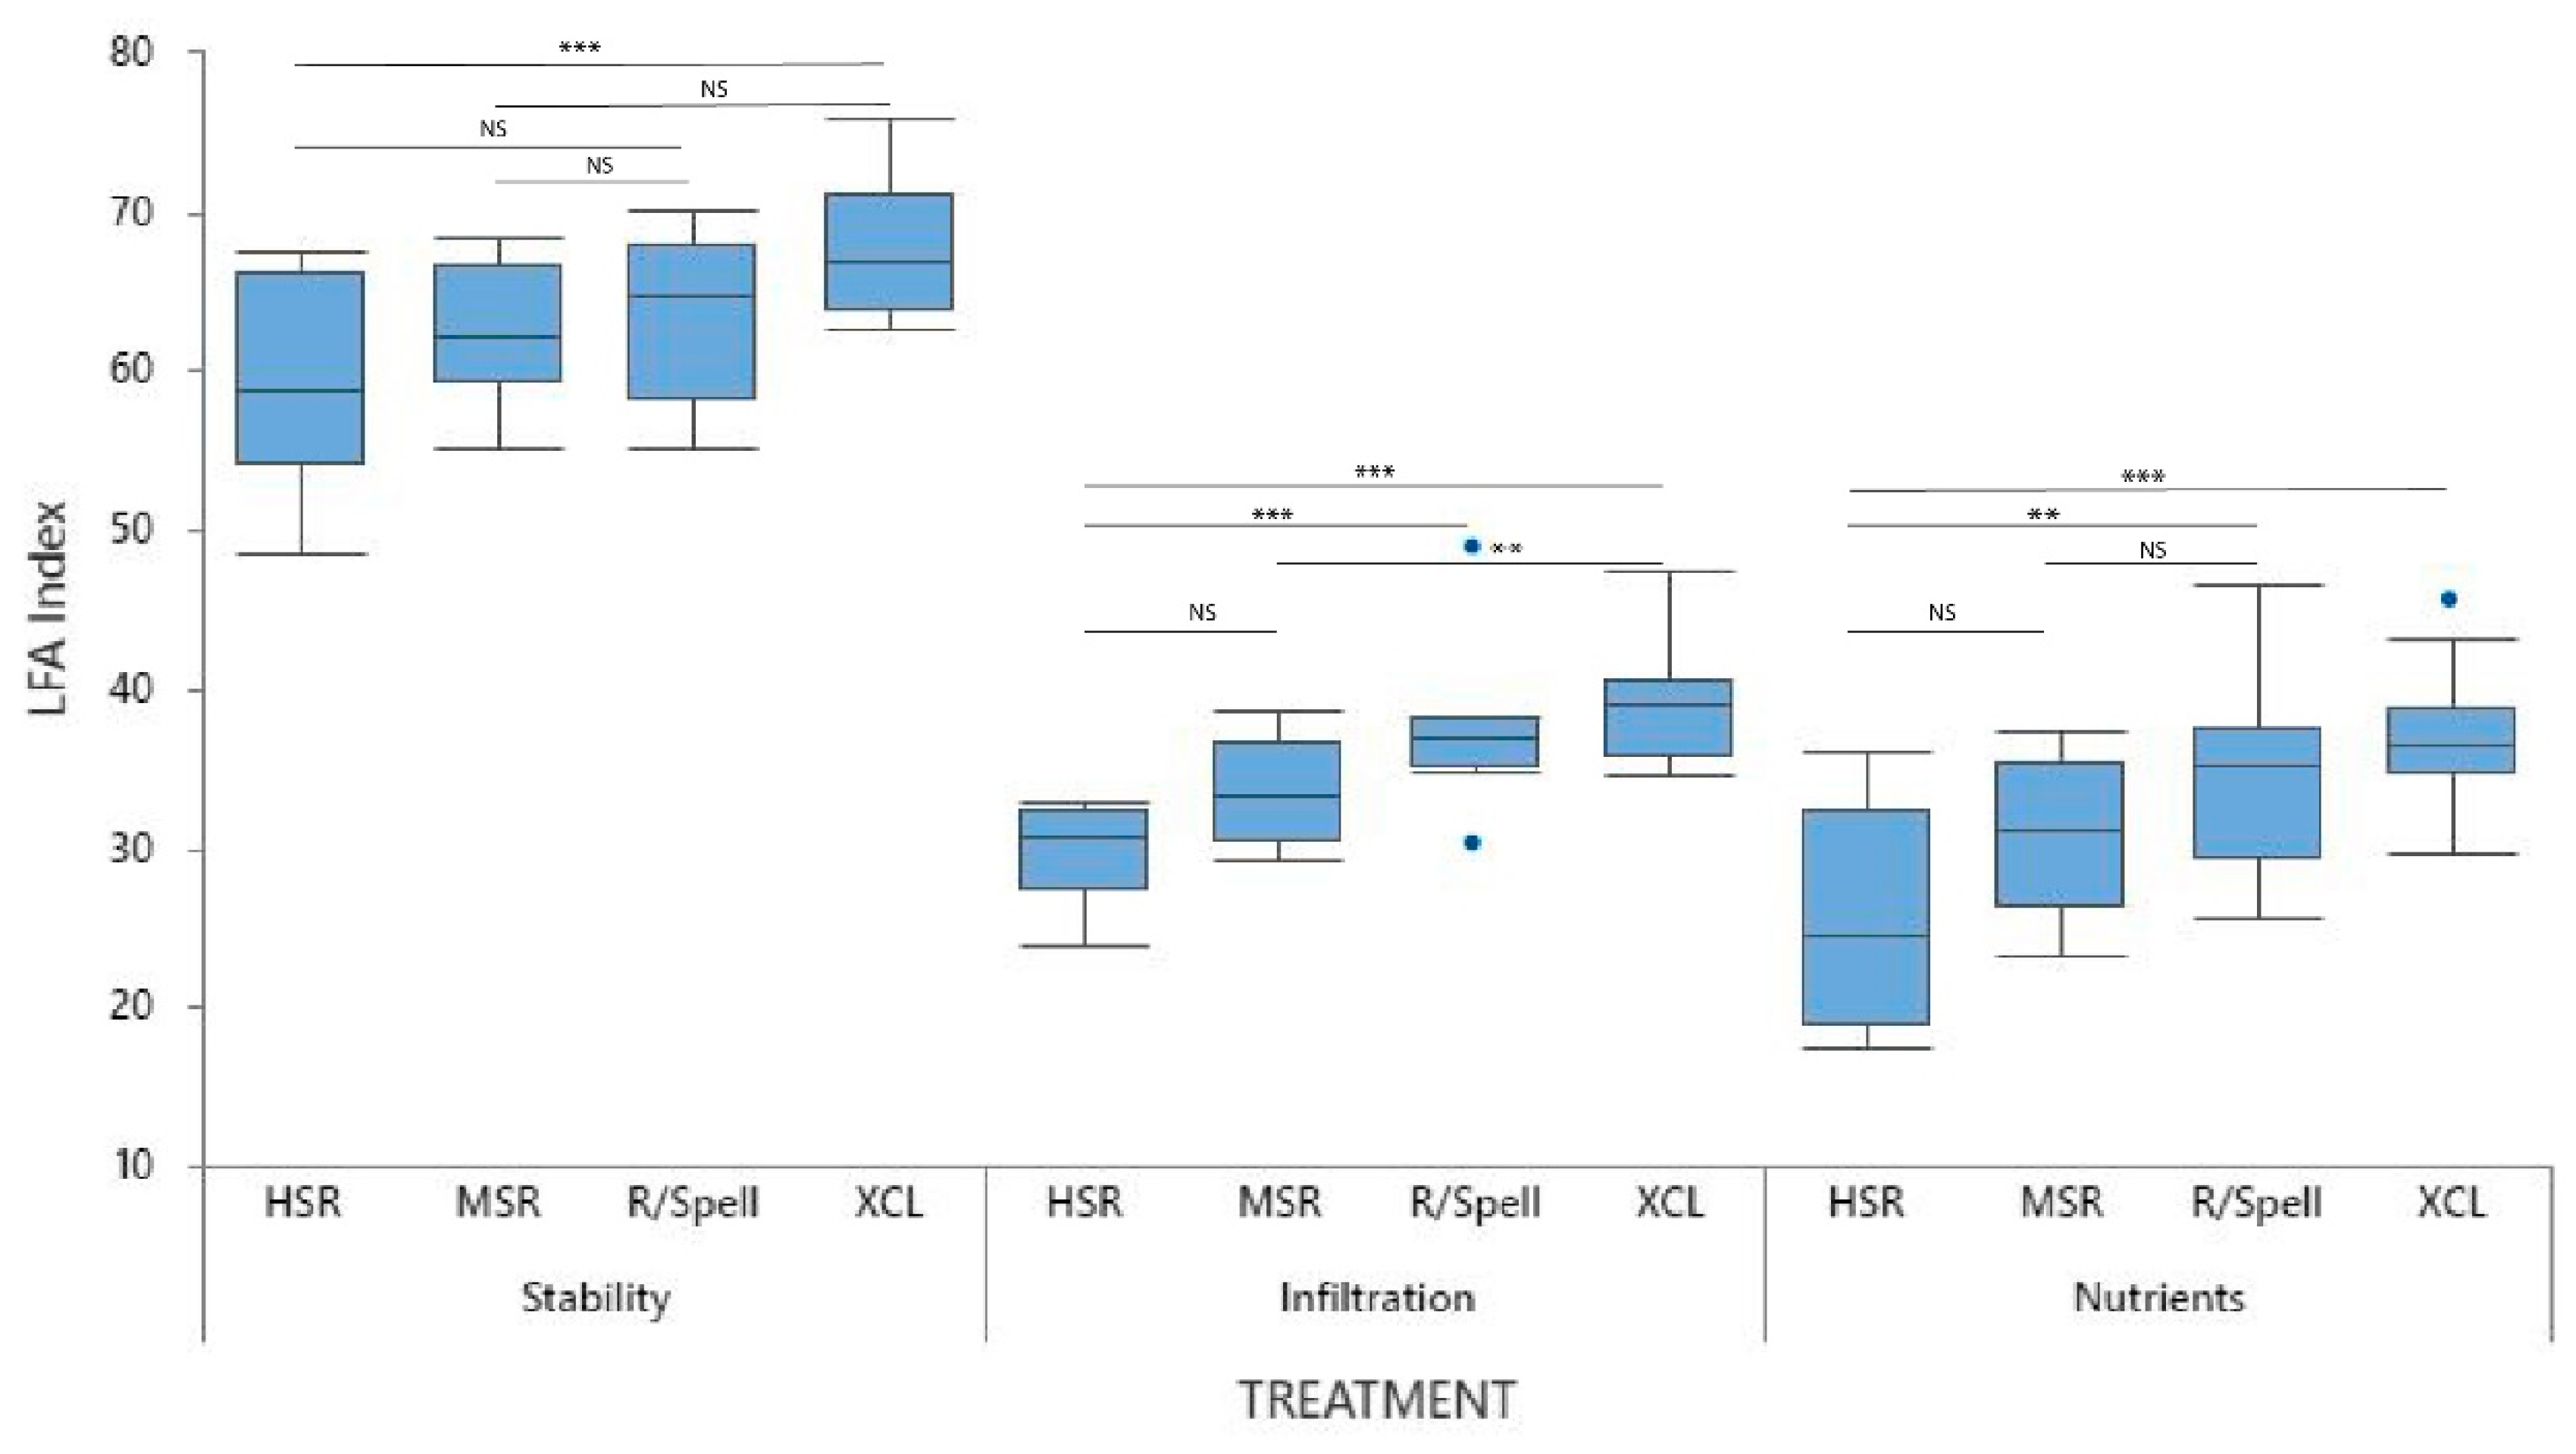
Across the interspaces, all LFA indices were negatively affected by HSR management strategies, which had the lowest percentage indices for stability, infiltration, and nutrient cycling (Figure 10). However, there were varied differences between the LFA indices across all treatments, particularly in the RY soil types (Figure 8 and Figure 11), especially in HSR that was dominated by >80% bare soil, and very low levels of biocrusts (Figure 8). Although the rotational spelling (R/Spell) had the highest average levels of landscape function of all the grazed treatments, due to the high variance, especially in the RY soil type, there were no significant differences, and it was not included in the overall analysis (Table 1).

3.3.1. Stability

The duplex soils (DC) and red-yellow earths (RY) that dominated the Box and Ironbark woodlands differed in their structure [21], and the stability of the interspaces was significantly different (p = 0.04) (Figure S1). In the DC soils, the exclosures (XCL) had significantly higher stability compared to the HSR paddocks (p = 0.003), and although not significant, XCL was somewhat different to MSR (p = 0.06). RY soil stability indices (mean %) had the widest ranges between 53.8% (RY, HSR) and 68.5% (XCL) (Table 1, Figure 10).

3.3.2. Infiltration

DC and RY soils did not significantly differ in their infiltration indices (p = 0.89) (Figure 11), however XCL had significantly higher infiltration compared to HSR (p < 0.001), and MSR (p = 0.009) (Figure 10). RY infiltration indices (mean %) also showed the widest range between 28.2% for the HSR and 40.6% for the XCL (Table 1).

3.3.3. Nutrient Cycling

At the paddock scale nutrient cycling across the interspaces was significantly different (p = 0.05) however there were no significant differences between the DC and RY soil types (Figure 11). The XCL had significantly higher nutrient cycling levels than both the HSR paddocks (p < 0.001), and for the MSR paddocks (p = 0.03) over both soil types. Yet, due to the high variability in DC soils (Table 1), HSR and MSR were not significantly different (p = 0.13). High litter levels in DC likely contributed to this (Figure 6). Nutrient cycling indices in the RY soils also widely differed (mean %) from 19.4% (HSR) to 36.7% (XCL) (Table 1).

4. Discussion

4.1. Sustaining Landscape Function during Drought

The understory of northern Australian savannas and grasslands is dominated by perennial tussock grasses providing pasture and protecting the soil surface from erosion. Loss of these grasses due to drought or excessive grazing pressure by cattle results in a loss of pasture condition, and an increase in bare ground, soil loss, and unpalatable weed invasion [1]. In landscapes that are intact and managed sustainably, the soil surface of the interspaces between grass tussocks is covered with biocrusts, which protect soil from erosion, ensure water infiltration, and add organic carbon and nitrogen to the soil [25,26]. Our landscape function and soil health study occurred after five years of drought at a long-term grazing trial (Figure 2 [1]). Irrespective of the grazing strategy applied, landscape function was compromised, compared to ungrazed exclosures, likely due to the prolonged deficiency from well below-average rainfall. Despite this, we found strong evidence that rotational spelling during the wet season, combined with a moderate stocking rate, improved both biocrust and pasture cover. Resting paddocks from livestock grazing in the wet season to allow pasture plant recruitment and growth is recommended as an important management strategy. Leaving pasture areas to rest can deliver rapid improvements, provided stocking rates had not been excessive [1]. Prior to the point when drought starts to affect the landscape, understanding the role of the interspaces between grass tussocks is critically important [19]. We showed that, by examining landscape function during a drought year, following five years of below-average rainfall, these interspaces significantly contributed to the three key areas of maintaining a functional landscape: nutrient cycling, infiltration, and stability.

4.2. Biocrusts Protect the Soil during Drought

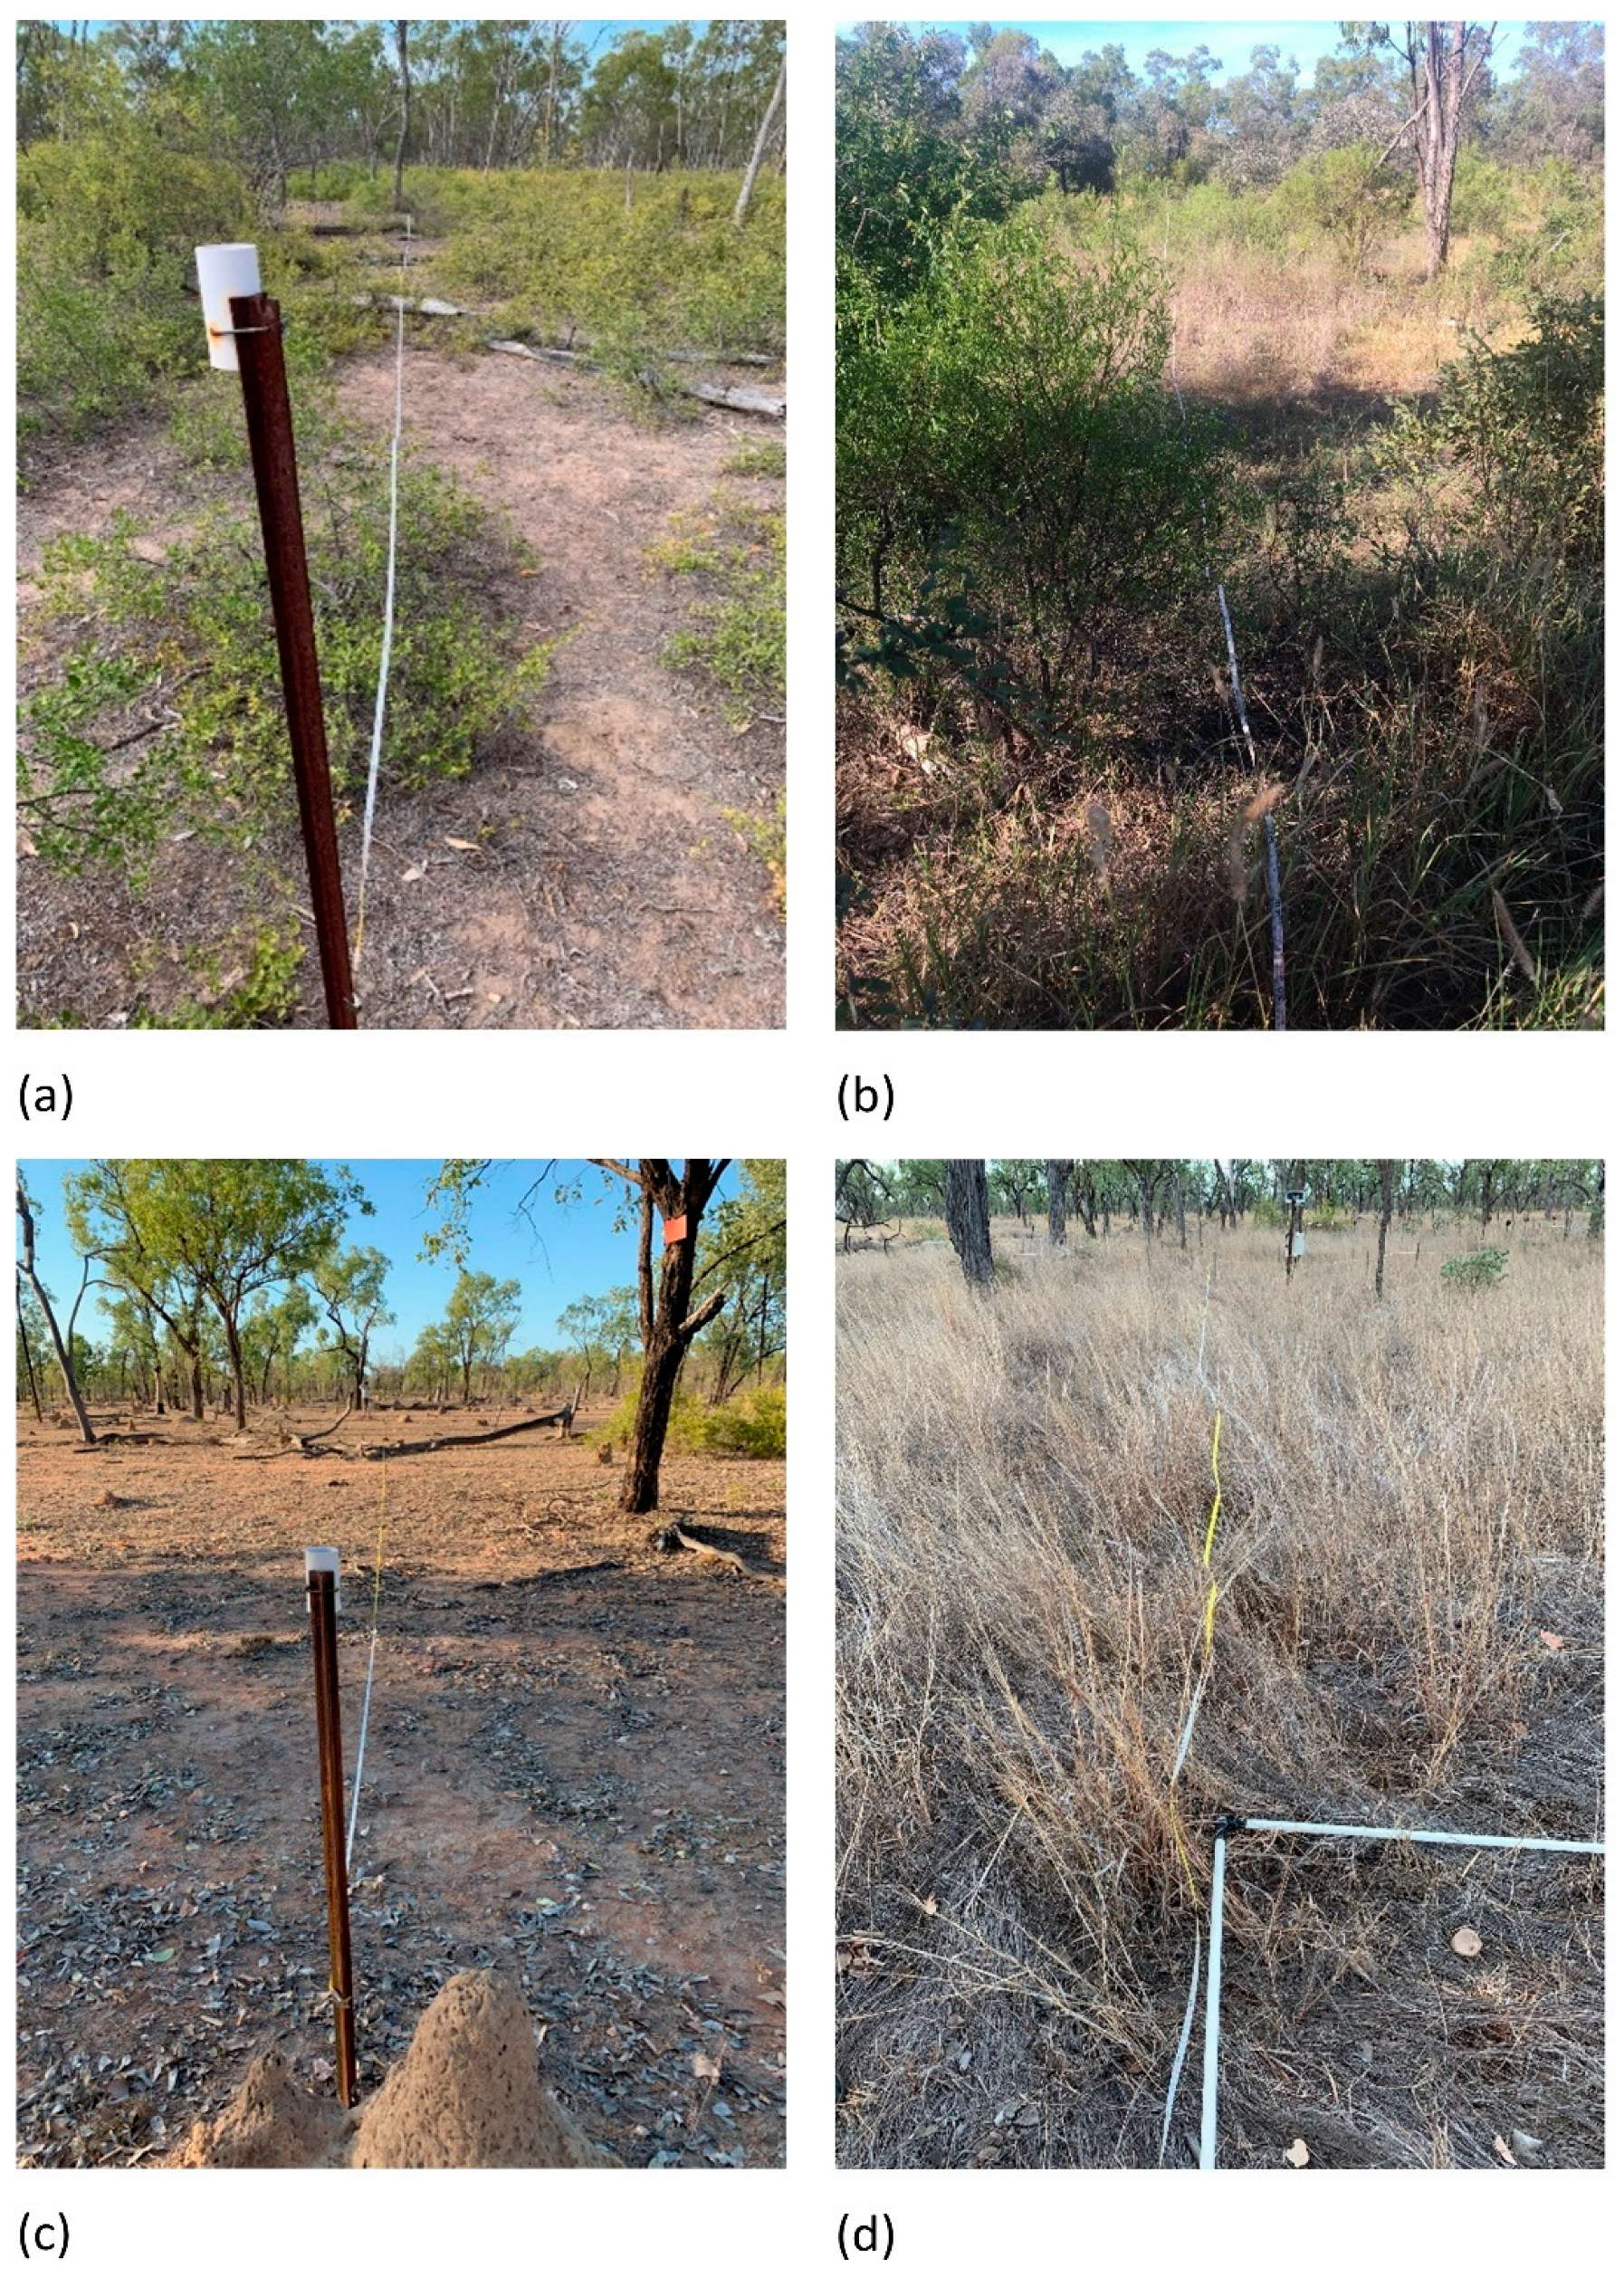
Biocrust cover across the interspaces on both soil types provided protection and contributed to soil nutrient cycling. Biocrust cover in the wet season spelled paddocks was almost as extensive as cattle exclosures on duplex soils. Furthermore, the biocrust cover was about twice that of the moderately stocked paddocks and more than double that of the heavily stocked paddocks. Significantly, neither of these latter strategies had any form of spelling. The biocrust cover was highly visible across the paddocks. The grasses had almost disappeared, leaving large tracts of bare ground with large patches of non-desirable and prickly unpalatable C. ovata shrub dominating the understory (Figure 3a). As cattle avoid C. ovata patches and preferentially used interspaces there is a consequential increase in grazing pressure in the interspaces between the C. ovata [4]. We predict that, should the drought conditions continue, increased grazing pressure on the remaining perennial grasses and trampling will lead to a more rapid decline in land condition. Once a threshold of biocrust removal is reached, the cover loss becomes exponential, and the topsoil is vulnerable to erosion [27]. In sandy and loam soils of the Australian Mallee regions, mechanically disturbed biocrusts had soil losses increase 1.6 times. Post-disturbance, the soil loss was 6.7 times the erosion target [27]. Removal of the biocrust increased the risk of erosion from less than five percent to greater than twenty percent [27]. We found a similar occurrence in the red-yellow earths (sandy loams), where the loss of biocrust in all the stocked paddocks has resulted in a significant loss of landscape function across all three soil health indices. Although the exclosure had on average >20% biocrust cover, sandy loams require >31% cover to protect them and maintain soil transport below erosion limits of 5 g m2 [27]. It should be noted that the grass cover in the exclosure and rotational spelled red-yellow soil averaged 10%, thus in combination with the biocrusts, it would provide adequate protection from soil loss. In red-yellow soils with rotational spelling, the biocrust cover was around the 20% threshold, although the impact of the drought meant that treatment differences were non-significant. At Wambiana, unprotected soil would be washed away by the overland flow of water from heavy rains, and following the loss of biocrust cover [28]. The most pronounced degradation was observed in the heavy stocking rate with over 80% bare ground with little to no protection from biocrusts, which only covered 10%, and were poorly developed (Figure 5, Figure 7 and Figure 9). On the more stable duplex clay-richer soils, in the exclosure and rotational spelled sites, the biocrust cover was well over the threshold (~34%). By comparison, moderate and heavy stocking rates without spelling had less than 15% cover and consequently were highly vulnerable to soil loss. Due to natural aggregation promoting biocrust cover, the duplex (clay richer) soils are inherently more stable than the red-yellow (sandy loam) soils. In contrast, sandier soils are dependent on the biocrust for their stability [23]. The stability between soil types and treatments is a critical factor for water infiltration and nutrient cycling. When the landscape loses stability, soil loss is inevitable, compounding the factors influencing infiltration (surface cover and cohesion) and nutrient loss increase. While landscape function is a continuum along a gradient of gains or losses, after a certain point, the losses occur exponentially [9,25].

4.3. Biocrust Hotspots—The Engine Room of the Landscape

In these landscapes, biocrust cover occupying the interspaces provides an important source of nutrients, and when degraded or removed, results in the loss of the three functional roles it provides. In northern Australia, biocrusts are a considerable component of the rangelands that contribute significantly to the carbon and nitrogen content of the soils [13,26]. At the study site, wet season resting from grazing boosted biocrust hotspots in the interspaces across the duplex soils. This proved advantageous in also increasing nutrient cycling in rotational spelled paddocks to similar levels as the exclosures. LFA suggests the interspaces were biocrust hotspots that influenced nutrient cycling and infiltration. On a small scale, spatial heterogeneity of biocrusts may not appear to influence nutrient cycles [29] however as demonstrated in XLCs and R/Spell, (DC) had more biocrust and better functional indices. In the DC soils nutrient cycling was significantly higher in the XCLs (~35%) compared to HSR (about 4% difference, Table 1), similarly for R/Spell, with higher variability. In contrast, for the HSR in the RY soils the nutrient cycling index was considerably lower in the DC soils at around 19% and almost half that of XCL and R/Spell (34–37%), and still significantly lower than MSR (27%) (Table 1). Landscape function represents a sequence of processes operating to support and maintain the biogeochemical engine room of the landscape [9]. It is important to fully understand the components of the landscape that contribute to these processes. As a consequence of the natural gradation between soil types across the landscape there were no significant differences between landscape function indices (Figure 11). Yet, there were significant differences between stability, infiltration, and nutrient cycling due to the other variables assessed. We have focused on the role of the biocrusts in the interspaces between the plants. This is underpinned by the primary role of cyanobacteria (Figure 7 and Figure 9) that dominate these biocrusts to act as ecosystem engineers [27]. Cyanobacterial soil crusts are known to modulate the landscape, redistribute water resources, create habitats that allow for the introduction of other species, and increase biodiversity [28]. Other studies have shown the net positive effect of biocrusts on infiltration [29]. Cyanobacteria also contribute significant amounts of carbon and nitrogen to the soil [13,26,30], and are thus instrumental in building soil nutrients [31]. Through the cyanobacterial extra-cellular-polymeric matrix (ECM) that binds cyanobacteria together, biocrusts are integrated into the soil surface particles [32], with the ECM stickiness also trapping dust particles (Figure 7 and Figure 9). Cyanobacteria and its ECM influence the physicochemical and hydrological properties of the soil [29,33] and in northern Australia they play an important role in regulating its seasonal productivity [16,30].

4.4. Managing and Monitoring the Interspaces

The interspaces are the areas first impacted by drought where excessive trampling can occur as cattle seek out grasses. As the interspaces increase in size and lose biocrust cover, exposure to the elements (particularly from the overland flow of water) will result in soil loss. In this study, there was a strong link between these interspaces and the presence of biocrusts that influenced all three landscape function indices, nutrient cycling, stability, and infiltration. In these landscapes, biocrusts can provide resilience to the impacts of drought, but heavy stocking severely limits the contribution of biocrusts across all land types. Drought and grazing are known to reduce biocrust presence and diversity [19]. It follows that understanding the role of the interspaces and the common and widespread occurrence of biocrusts that landscape function can also be determined by monitoring the presence/absence and extent of biocrusts in these interspaces. During drought, the risks of landscape function declining by overstocking escalate. Resting during part or all of a wet season provides a period with limited soil surface disturbances when biocrusts are at the height of productivity [30], allowing them to rapidly recolonize the soil surfaces. In the interstitial spaces, biocrusts will in turn provide a nutrient-rich micro-climate conducive to native grass establishment and often inhibitive to weeds [31]. Monitoring interspaces can therefore be a key tool for understanding the level of landscape health or decline early in the drought cycle.

5. Concluding Remarks

Management at the paddock scale needs to incorporate ecosystem services provided by perennial plants, biocrusts, and leaf litter to better understand the influence they have on productive pastures, soil stability, infiltration, and nutrient cycling. Our results support the recommended practice of wet season (rotational) spelling in Northern Australia. Maintaining and monitoring biocrusts that occur in the interspaces can be an important management strategy combined with understanding the carrying capacity of paddocks. Other data from the present trial shows, that while pasture condition has declined the most in the HSR, it has also declined significantly in the other more ‘sustainable’ treatments, most likely due to the effects of drought (pers. comm. P. O’Reagain). Is the inevitable result of grazing a decline in land condition? We do not necessarily think this is the case; however, continuing to monitor the extent of recovery post-drought would be beneficial. As demonstrated with the DC soils, under good management, grazing can achieve similar outcomes to exclosures. Furthermore, recent research has highlighted the benefits of using biocrusts and cyanobacteria to facilitate landscape recovery post-disturbance [32,33,34,35]. Future studies could incorporate the application of biocrust inoculum to degraded areas to promote functional recovery.

Supplementary Materials

The following are available online at https://www.mdpi.com/article/10.3390/agronomy12010062/s1, Figure S1: LFA Manual.

Author Contributions

Conceptualization, W.J.W., S.S., B.A., P.O., and R.C.; Data curation, W.J.W., T.M.S., and C.D.; Formal analysis, W.J.W., and C.D.; Funding acquisition, W.J.W., S.S., and R.C.; Investigation, W.J.W., E.Z., B.A., T.M.S., S.W., M.D., G.P., P.O., and J.B.; Methodology, W.J.W., S.S., P.O., J.B., R.C., and C.D.; Project administration, N.R.; Supervision, S.S., E.Z., B.A., and N.R.; Writing—original draft, W.J.W. and C.D.; Writing—review and editing, S.S., E.Z., B.A., S.W., M.D., G.P., P.O., R.C., C.D., and N.R. All authors have read and agreed to the published version of the manuscript.

Funding

This project is funded by Meat & Livestock Australia as part of “Boosting natural regeneration of the nitrogen capital in grazing lands” (B.PAS. 0502) in collaboration with The University of Queensland, Queensland Department of Agriculture & Fisheries, Northern Territory Department of Primary Industries.

Acknowledgments

We would like to acknowledge the traditional guardians of the Gudjal Lands where Wambiana is located. We sincerely appreciate and thank Michael and Michelle Lyons for their cooperation, assistance, and hospitality as the owners of Wambiana Station, whose help and advice has been invaluable. We especially thank Laiza Sherar who volunteered her time and assisted in driving, field work and data collation.

Conflicts of Interest

There is no conflict of interest or ethical consideration for this research.

References

  1. O’Reagain, P.J.; Scanlan, J.C. Sustainable Management for Rangelands in a Variable Climate: Evidence and Insights from Northern Australia. Animal 2013, 7, 68–78. [Google Scholar] [CrossRef] [PubMed]
  2. Scanlan, J.C.; McIvor, J.G.; Bray, S.G.; Cowley, R.A.; Hunt, L.P.; Pahl, L.I.; MacLeod, N.D.; Whish, G.L. Resting Pastures to Improve Land Condition in Northern Australia: Guidelines Based on the Literature and Simulation Modelling. Rangel. J. 2014, 36, 429–443. [Google Scholar] [CrossRef]
  3. Tongway, D.J. Soil and Landscape Processes in the Restoration of Rangelands. Rangel. J. 1990, 12, 54–57. [Google Scholar] [CrossRef]
  4. Ash, A.J.; Corfield, J.P.; McIvor, J.G.; Ksiksi, T.S. Grazing Management in Tropical Savannas: Utilization and Rest Strategies to Manipulate Rangeland Condition. Rangel. Ecol. Manag. 2011, 64, 223–239. [Google Scholar] [CrossRef]
  5. Ash, A.; Thornton, P.; Stokes, C.r.s.; Togtohyn, C. Is Proactive Adaptation to Climate Change Necessary in Grazed Rangelands? Rangel. Ecol. Manag. 2012, 65, 563–568. [Google Scholar] [CrossRef] [Green Version]
  6. Godde, C.M.; Garnett, T.; Thornton, P.K.; Ash, A.J.; Herrero, M. Grazing Systems Expansion and Intensification: Drivers, Dynamics, and Trade-Offs. Glob. Food Secur. 2018, 16, 93–105. [Google Scholar] [CrossRef]
  7. Holt, J.A.; Coventry, R.J. Nutrient Cycling in Australian Savannas. J. Biogeogr. 1990, 17, 427–432. [Google Scholar] [CrossRef]
  8. Housman, D.C.; Yeager, C.M.; Darby, B.J.; Sanford, R.L.; Kuske, C.R.; Neher, D.A.; Belnap, J. Heterogeneity of Soil Nutrients and Subsurface Biota in a Dryland Ecosystem. Soil Biol. Biochem. 2007, 39, 2138–2149. [Google Scholar] [CrossRef]
  9. Mott, J.J.; Williams, J.; Andrew, M.H.; Gillison, A.N. Australian Savanna Ecosystems. In Ecology and Management of the World’s Savannas; Australian Academy of Sciences: Canberra, Australia, 1985; pp. 56–82. [Google Scholar]
  10. McKeon, G.M.; Day, K.A.; Howden, S.M.; Mott, J.J.; Orr, D.M.; Scattini, W.; Weston, E.J. Northern Australian Savannas: Management for Pastoral Production. J. Biogeogr. 1990, 355–372. [Google Scholar] [CrossRef]
  11. Hill, J.O.; Coates, D.B.; Whitbread, A.M.; Clem, R.L.; Robertson, M.J.; Pengelly, B.C.; Hill, J.O.; Coates, D.B.; Whitbread, A.M.; Clem, R.L.; et al. Seasonal Changes in Pasture Quality and Diet Selection and Their Relationship with Liveweight Gain of Steers Grazing Tropical Grass and Grass–Legume Pastures in Northern Australia. Anim. Prod. Sci. 2009, 49, 983–993. [Google Scholar] [CrossRef]
  12. Tongway, D.; Hindley, N. Landscape Function Analysis: A System for Monitoring Rangeland Function. Afr. J. Range Forage Sci. 2004, 21, 109–113. [Google Scholar] [CrossRef]
  13. Pointing, S.B.; Belnap, J. Microbial Colonization and Controls in Dryland Systems. Nat. Rev. Microbiol. 2012, 10, 551–562. [Google Scholar] [CrossRef]
  14. Eldridge, D.J.; Poore, A.G.B.; Ruiz-Colmenero, M.; Letnic, M.; Soliveres, S. Ecosystem Structure, Function, and Composition in Rangelands Are Negatively Affected by Livestock Grazing. Ecol. Appl. 2016, 26, 1273–1283. [Google Scholar] [CrossRef] [Green Version]
  15. Williams, W.J.; Büdel, B.; Reichenberger, H.; Rose, N. Cyanobacteria in the Australian Northern Savannah Detect the Difference between Intermittent Dry Season and Wet Season Rain. Biodivers. Conserv. 2014, 23, 1827–1844. [Google Scholar] [CrossRef]
  16. Williams, W.; Büdel, B.; Williams, S. Wet Season Cyanobacterial N Enrichment Highly Correlated with Species Richness and Nostoc in the Northern Australian Savannah. Biogeosciences 2018, 15, 2149–2159. [Google Scholar] [CrossRef] [Green Version]
  17. Barger, N.N.; Weber, B.; Garcia-Pichel, F.; Zaady, E.; Belnap, J. Patterns and Controls on Nitrogen Cycling of Biological Soil Crusts. In Biological Soil Crusts: An Organizing Principle in Drylands; Ecological Studies; Springer: Cham, Switzerland, 2016; pp. 257–285. ISBN 978-3-319-30212-6. [Google Scholar]
  18. Hunt, L.P.; McIvor, J.G.; Grice, A.C.; Bray, S.G. Principles and Guidelines for Managing Cattle Grazing in the Grazing Lands of Northern Australia: Stocking Rates, Pasture Resting, Prescribed Fire, Paddock Size and Water Points—A Review. Rangel. J. 2014, 36, 105–119. [Google Scholar] [CrossRef]
  19. Williams, W.J.; Eldridge, D.J.; Alchin, B.M. Grazing and Drought Reduce Cyanobacterial Soil Crusts in an Australian Acacia Woodland. J. Arid Environ. 2008, 72, 1064–1075. [Google Scholar] [CrossRef]
  20. O’Reagain, P.; Bushell, J.; Holloway, C.; Reid, A.; O’Reagain, P.; Bushell, J.; Holloway, C.; Reid, A. Managing for Rainfall Variability: Effect of Grazing Strategy on Cattle Production in a Dry Tropical Savanna. Anim. Prod. Sci. 2009, 49, 85–99. [Google Scholar] [CrossRef]
  21. Aspandiar, M.F.; Taylor, G.; Eggleton, R.A. Charters Towers Region, Queensland. In Regolith Landscape Evolution Across Australia: A Compilation of Regolith Landscape Case Studies with Regolith Landscape Evolution Models; Cooperative Research Centre for Landscape Environments and Mineral Exploration: Perth, Australia, 2003. [Google Scholar]
  22. Tongway, D.J.; Ludwig, J.A. Restoring Disturbed Landscapes: Putting Principles into Practice; Island Press: Washington, DC, USA, 2011; ISBN 1-59726-580-2. [Google Scholar]
  23. Tongway, D.; Hindley, N. Landscape Function Analysis: Procedures for Monitoring and Assessing Landscapes—with Special Reference to Minesites and Rangelands; CSIRO Sustainable Ecosystems: Canberra, Australia, 2004. [Google Scholar]
  24. Data Analysis Software | Statistical Software Package. Available online: https://www.minitab.com/content/www/websites/en-us/products/minitab.html (accessed on 3 November 2021).
  25. Williams, W.J.; Büdel, B. Species Diversity, Biomass and Long-Term Patterns of Biological Soil Crusts with Special Focus on Cyanobacteria of the Acacia Aneura Mulga Lands of Queensland, Australia. Algol. Stud. 2012, 140, 23–50. [Google Scholar] [CrossRef]
  26. Eldridge, D.J.; Zaady, E.; Shachak, M. Microphytic Crusts, Shrub Patches and Water Harvesting in the Negev Desert: The Shikim System. Landsc. Ecol. 2002, 17, 587–597. [Google Scholar] [CrossRef]
  27. Eldridge, D.J.; Leys, J.F. Exploring Some Relationships between Biological Soil Crusts, Soil Aggregation and Wind Erosion. J. Arid Environ. 2003, 53, 457–466. [Google Scholar] [CrossRef] [Green Version]
  28. Bowker, M.A.; Belnap, J.; Bala Chaudhary, V.; Johnson, N.C. Revisiting Classic Water Erosion Models in Drylands: The Strong Impact of Biological Soil Crusts. Soil Biol. Biochem. 2008, 40, 2309–2316. [Google Scholar] [CrossRef]
  29. Bowker, M.A.; Maestre, F.T.; Eldridge, D.; Belnap, J.; Castillo-Monroy, A.; Escolar, C.; Soliveres, S. Biological Soil Crusts (Biocrusts) as a Model System in Community, Landscape and Ecosystem Ecology. Biodivers. Conserv. 2014, 23, 1619–1637. [Google Scholar] [CrossRef]
  30. Büdel, B.; Williams, W.J.; Reichenberger, H. Annual Net Primary Productivity of a Cyanobacteria-Dominated Biological Soil Crust in the Gulf Savannah, Queensland, Australia. Biogeosciences 2018, 15, 491. [Google Scholar] [CrossRef] [Green Version]
  31. Slate, M.L.; Callaway, R.M.; Pearson, D.E. Life in Interstitial Space: Biocrusts Inhibit Exotic but Not Native Plant Establishment in Semi-Arid Grasslands. J. Ecol. 2019, 107, 1317–1327. [Google Scholar] [CrossRef]
  32. Chamizo, S.; Mugnai, G.; Rossi, F.; Certini, G.; De Philippis, R. Cyanobacteria Inoculation Improves Soil Stability and Fertility on Different Textured Soils: Gaining Insights for Applicability in Soil Restoration. Front. Environ. Sci. 2018, 6, 49. [Google Scholar] [CrossRef]
  33. Williams, W.; Chilton, A.M.; Schneemilch, M.; Williams, S.; Neilan, B.A.; Driscoll, C. Microbial Biobanking–Cyanobacteria-Richtopsoil Facilitates Mine Rehabilitation. Biogeosciences 2019, 16, 1–16. [Google Scholar] [CrossRef] [Green Version]
  34. Bowker, M.A. Biological Soil Crust Rehabilitation in Theory and Practice: An Underexploited Opportunity. Restor. Ecol. 2007, 15, 13–23. [Google Scholar] [CrossRef]
  35. Román, J.R.; Roncero-Ramos, B.; Chamizo, S.; Rodríguez-Caballero, E.; Cantón, Y. Restoring Soil Functions by Means of Cyanobacteria Inoculation: Importance of Soil Conditions and Species Selection. Land Degrad. Dev. 2018, 29, 3184–3193. [Google Scholar] [CrossRef]
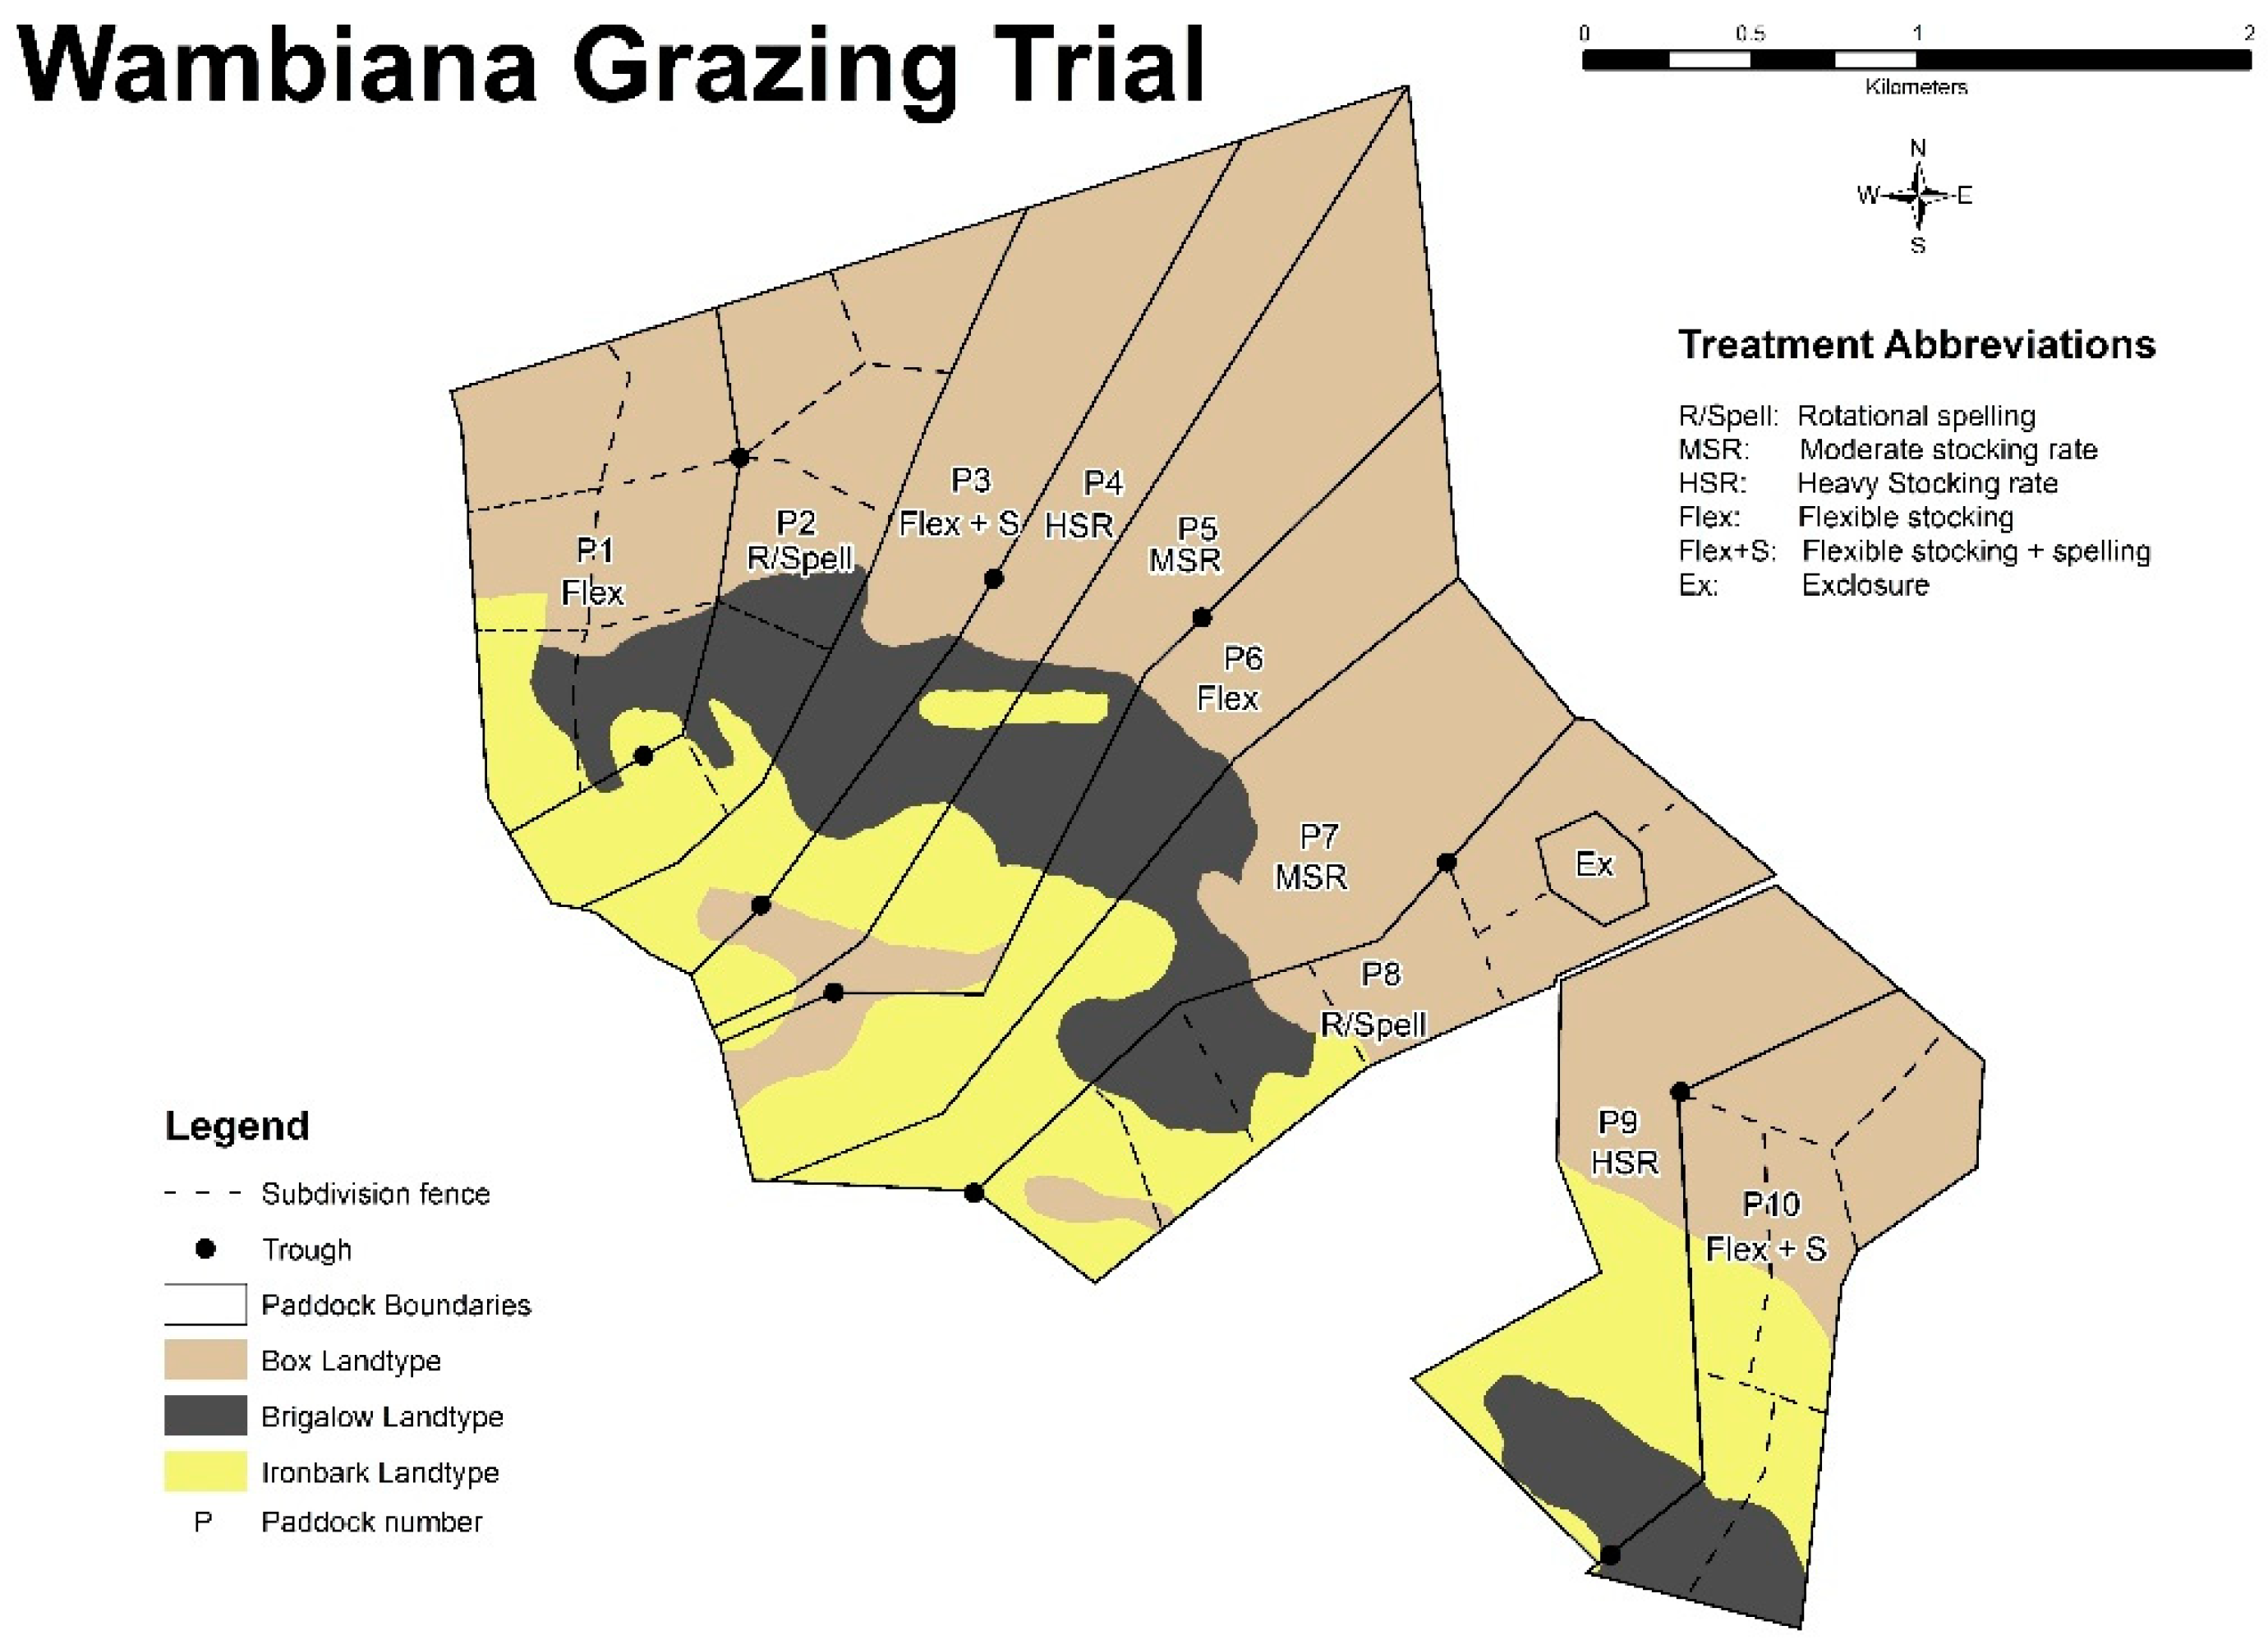
Figure 1. Wambiana Paddock plan of the landscape types and stocking strategies: heavy stocking (HSR), moderate stocking (MSR), and rotational spelling (R/Spell).
Agronomy 12 00062 g001
Figure 2. Stocking rates expressed as adult equivalents (AE) per 100 ha for rotational/spell (R/Spell), heavy stocking (HSR) and moderate stocking (MSR) against rainfall records at the Wambiana.
Agronomy 12 00062 g002
Figure 3. Box woodland transect on duplex soils (DC) with (a) heavy stocking (HSR) and (b) exclosure (XCL) no stock; Ironbark woodland on red-yellow earths (RY) with (c) HSR and (d) XCL.
Agronomy 12 00062 g003
Figure 4. LFA indices (stability, infiltration, and nutrient cycling) and the contribution of the measured attributes to each.
Agronomy 12 00062 g004
Figure 5. Examples of 1 m2 quadrats across different soils and contrasting treatments. (a) DC soil, HSR treatment; (b) DC soil, MSR treatment; (c) RY soil, HSR treatment; (d) RY soil, MSR treatment.
Agronomy 12 00062 g005
Figure 6. Duplex soils with comparisons of mean values ± SD for grass and shrub (Carissa sp.) and ground cover: biocrusts, bare soil (no visible biocrust), and litter cover at different stocking levels: high stocking rates (HSR), moderate stocking rates (MSR), rotational spelling at moderate stocking rates (R/Spell) and, no stock, exclosures (XCL).
Agronomy 12 00062 g006
Figure 7. Duplex soils, photos and SEM images: (a) Biocrust in good condition (XCL) with cyanobacteria, lichens, liverworts, and mosses; (b) darkened patches represent poor quality cyanobacterial biocrust; (c) R/Spell cyanobacterial filaments with fine soil particles SEM, 120× mag; (d) HSR biocrust in poor condition, cyanobacterial filaments with soil, 150× mag.
Agronomy 12 00062 g007
Figure 8. Red-yellow earths with comparisons of mean values ± SD for grass cover and ground cover: biocrusts, bare soil (no visible biocrust), litter, at different stocking levels: high stocking rates (HSR), moderate stocking rates (MSR), rotational spelling at moderate stocking rates (R/Spell) and, no stock, exclosures (XCL).
Agronomy 12 00062 g008
Figure 9. Red-yellow earths, photo and scanning electron microscope (SEM) images: (a) Red coloured biocrust in good condition (XCL) dominated by cyanobacteria; (b) degraded cyanobacterial biocrust seen with faint discolouration on surface; (c) R/Spell cyanobacterial filaments with soil particles SEM, 120× mag; (d) HSR biocrust in poor condition, cyanobacterial filaments with soil, 120× mag.
Agronomy 12 00062 g009
Figure 10. Overall results for LFA indices for heavy (HSR), moderate (MSR), rotational spelling (R/Spell) and exclosure (XCL) stock treatments at the paddock scale. Significant differences marked with ** (p < 0.05), and *** (p < 0.001), or NS for not significant.
Agronomy 12 00062 g010
Figure 11. At a paddock scale there was high variability with no significant differences (NS) found between soil types for LFA indices for heavy (HSR), moderate (MSR), and exclosure (XCL) treatments.
Agronomy 12 00062 g011
Table 1. LFA Indices across all treatments (mean % ± SE) DC—Duplex soil; RY—red-yellow soil; HSR—heavy stocking rate; MSR—moderate stocking rate; R/Spell—rotational spelling (paddock resting during wet season); MSR—moderate stocking rate; XCL—exclosure.
VariableSoilHSR MSR R/SPELLXCL
StabilityDC65.0 ± 3.3965.1 ± 1.6465.1 ± 1.2166.9 ± 1.24
RY53.8 ± 3.8859.8 ± 1.9462.1 ± 3.6668.5 ± 2.24
InfiltrationDC31.6 ± 0.7634.8 ± 0.9936.8 ± 0.8237.1 ± 1.17
RY28.2 ± 1.9332.3 ± 4.2538.3 ± 3.8940.6 ± 1.49
NutrientsDC31.8 ± 1.833.9 ± 3.3835.6 ± 0.9735.5 ± 1.86
RY19.4 ± 0.9427.5 ± 4.1133.8 ± 4.6736.7 ± 1.55
Publisher’s Note: MDPI stays neutral with regard to jurisdictional claims in published maps and institutional affiliations.