Abstract
Ribulose-1,5-bisphosphate carboxylase/oxygenase (Rubisco) is a critical protein for photosynthesis. With small subunits, RBCSs catalyze the fixation of CO2 onto ribulose-1,5-bisphosphate (RuBP). However, the gene characteristics of peanut RBCSs, and the relationship between their expression and peanut growth under nitrogen (N)-deficiency conditions are not yet known. This study targeted the impact of sufficient N (5 mmol/L NO3−) and deficient N (0.1 mmol/L NO3−) on peanut seedlings’ growth, physiology, and molecular aspects. Herein, eight RBCS protein encoding genes were identified in the peanut genome, and their characteristics were described. The leaf areas of Yu Hang Hua 1 (YH1) and An Hua 3 (AH3) were reduced significantly after 10 days while “Pu Ke Hua 18” (PK18) and “Luo Hua 4087” (LH4087) had higher N-deficiency adaptations in the initial N-deficiency stage. The Rubisco carboxylation activities of YH1 and PK18 were significantly increased after 5 days of N-deficiency stress while they decreased under 15 days of N-deficiency conditions. Furthermore, the qRT-PCR results showed that the expressions of AhRBCS 1/5 and AhRBCS2/6 had negative relationships with the morpho-physiological traits of peanut under low-N stress. This study provides the biological information of peanut RBCSs and lays a theoretical foundation for N utilization in crop plants.
1. Introduction
Ribulose-1,5-bisphosphate carboxylase/oxygenase (Rubisco), consisting of eight large subunits (RBCLs) and eight small subunits (RBCSs), is the key enzyme that catalyzes CO2 fixation onto ribulose-1,5-bisphosphate (RuBP) in photosynthetic plants [1]. Among these, RBCSs function as storage devices for CO2, regulating the function and activity of the Rubisco holoenzyme [2,3]. Previous studies documented that RBCSs were encoded by multigene families, ranging from 2 to 22 in various plants [4]. For instance, 7 RBCS-encoding genes were isolated from cassava [5], 5 from potato [6], and 20 from wheat [7]. Regarding RBCSs’ gene structure, the promoter region of the RBCS genes contain abundant I-boxes and G-boxes [8], which regulate photoinduction in plants under salt stress [9], drought [10], and nutrient deficiency [11].
Nitrogen (N) plays an important role in crop growth and development [12,13]. Since the first Green Revolution in the 1950s, the use of chemical fertilizer has been one of the factors driving the increase in crop production [14]. In plants, more than 75% of the N is allocated to chloroplasts [15].Of which, 50% of the nitrogen is used for the synthesis of Rubisco holoenzyme [16]. In addition to impaired chlorophyll synthesis, N deficiency can reduce the photosynthetic electron transfer rate and carbonylated function of Rubisco [17,18]. Short-term N-deficiency could improve the content of Rubisco in leaves, which was attributed to the preferential distribution of Rubisco for photosynthesis [16]. Long-term N-deficiency strongly deactivated Rubisco synthesis and activity in plants [19]. Therefore, it can be inferred that the gene expressions and activities of Rubisco are associated with the N concentration and stress duration.
Peanut (Arachis hypogea L.) is one of the most important oil and food crops. Peanut has high protein contents (24–36%), resulting in a high demand for N supplement [20]. N-deficiency significantly decreases the total N content and leaf area [21] and obstructs the accumulation of biomass and yield of peanut [22]. An N-efficient genotype was more adaptable than an N-sensitive genotype in terms of the plant morphology and enzyme activity in low-N environments [23,24]. However, studies on N-deficiency in peanuts genotypes have not been reported. In addition, the relationship between genotypes and RBCSs’ response to N-deficiency has not been reported in a peanut crop.
Therefore, the current study aimed to explore the characteristics of peanut RBCS genes and the morpho-physiological changes of peanut seedlings under N-deficiency. Furthermore, the relationship between the expressions of RBCS genes and peanut growth under N-deficiency was also investigated.
2. Materials and Methods
2.1. Identification of RBCS Gene Family and Multiple Sequence Alignment and Phylogenetic Analysis
The genomes of Arachis hypogea L., Zea mays L., Nicotiana tabacum L., and Glycine max L. were downloaded from Ensemble Plants database (https://plants.ensembl.org/index.html, accessed on 3 May 2021) and were used to create a local database for the HMMMER search in the Bio-Linux virtual program. Then, two RBCS hidden Markov models (HMMs), RbcS (PF12338) and RuBisCO_small (PF00101), extracted from the Pfam database (http://pfam.xfam.org, accessed on 3 May 2021), were searched for in the local database using an E-value cut-off < 1 × 10⁻²⁰ [25] to gain reliable RBCS domains. The false positive searching results were manually deleted by the Pfam server. The family genes containing RBCS domains were extracted by the HMMER search and the molecular weight (MW), amino acid number (aa), isoelectric point (pI), and the position on chromosomes were analyzed by online tools (https://www.ebi.ac.uk/Tools/seqstats/emboss_pepstats/, accessed on 5 May 2021) and the MapGene2Chrom web v2.0 (http://mg2c.iask.in/mg2c_v2.0, accessed on 5 May 2021) server.
All Arachis hypogea L. RBCS (AhRBCS) protein sequences were added to the DNA-MAN program to conduct multiple sequence alignment. For phylogenetic analysis, four species of RBSC protein sequences, Arachis hypogea L., Zea mays L., Nicotiana tabacum L., and Glycine max L. were used in MEGA-X with 1000 bootstrap replicates [25].
2.2. Gene Structure, Conserved Motif, and Cis-Acting Regulatory Element Analysis
With the online Gene Structure Display Server (GSDS: http://gsds.gao-lab.org, accessed on 7 May 2021), the AhRBCS family gene characteristics and secondary structures were identified. The Multiple Em for Motif Elicitation (MEME) V5.4.1 program (https://memesuite.org/meme/tools/meme, accessed on 7 May 2021) was employed to characterize the AhRBCS conserved motifs, with the number of motifs set to 10. In addition, 1.5 kb upstream of the promoter regions was selected from the Ensembl Plants database and submitted to PlantCARE (http://bioinformatics.psb.ugent.be/webtools/plantcare/html/, accessed on 7 May 2021) for AhRBCS cis-acting regulatory elements (CREs) analysis. Then, the distribution of CREs on AhRBCS was mapped online by GSDS.
2.3. Plant Materials and Treatments
Four different peanut varieties were used in the present study. Yu Hang Hua 1 (YH1) and An Hua 3 (AH3) are weak-growing peanut varieties (GWV) in the seedling stage, which were bred by Puyang Institute of Agricultural Sciences and Anyang Academy of Agricultural Sciences, respectively. Pu Ke Hua 18 (PK18) and Luo Hua 4087 (LH4087) are strong-growing peanut varieties (GSV), which were bred by Puyang Institute of Agricultural Sciences and Luohe Academy of Agricultural Sciences, respectively. Healthy mature seeds were disinfected with 3% (v/v) hydrogen peroxide for 10 min and rinsed more than 8 times by tap water until the hydrogen peroxide was completely removed. Seeds were soaked using tap water for 12 h. The roll-paper method [26] was used for seed germination. The seeds were rolled up with sterilized germinating paper and placed in saturated calcium sulfate solution for germination at room temperature (25 °C) and shaded for 5 days. The germs of the peanut seeds were placed downwards, and each roll contained 8 seeds.
Seedlings with identical growth conditions were wrapped with sponge strips and placed in culture solution. Seedlings were raised in a greenhouse with set conditions (14 h light/10 h dark photoperiod with 400 μmol∙m−2 s−1 light intensity at 28 °C) with two modified Hoagland nutrient solution treatments [22]. Controls were treated with a N-sufficiency content (containing 5 mmol/L NO3−) and N-deficient plants were treated with a low N content (containing 0.1 mmol/L NO3−). For all treatments, six seedlings in similar conditions were sampled after 5, 10, and 15 days, respectively.
2.4. Morphological Indexes and Photosynthesis Characteristics’ Measurement
Three to six similar growing peanut seedlings were sampled. Both the plant height and dry weight of seedlings were measured manually. Seedlings were scanned by an Epson Expression 12000XL Photo scanner (Epson America Inc., Los Alamitos, CA, USA). Then, the total stem length and leaf area were measured using a WinRHIZO Pro 2017 (Regent Instruments Inc., Quebec, QC, Canada).
A Dualex Scientific, Handy Plant Efficiency Analyzer (PEA) and LI-6800 photosynthesis-fluorescence meter were used to measure the nitrogen balance index (NBI), efficiency of light energy conversion PSII (Fv/Fm), performance index based on absorbed light energy (PIabs), transpiration rate (Tr), intercellular CO2 concentration (Ci), stomatal conductance (Gs), and net photosynthetic rate (Pn). Three to six seedlings with consistent growth were taken as living samples. Fully expanded leaves of the apical second lateral branch of the seedlings were used for measurement at 25 °C.
Peanut seedling leaves were soaked with 95% ethanol solution [27] for 24 h. Then, the optical density (OD) values at 665 (OD665nm) and 649 nm (OD649nm) were measured by a microplate reader (TECAN Spark 10M, Australia) and used to calculate the content of chlorophyll a (Ca) and chlorophyll b (Cb). The chlorophyll content was calculated by the following formulas [28]:
Ca = 13.95 × OD665nm − 6.88 × OD649nm
Cb = 24.96 × OD649nm − 7.32 × OD665nm
The values 13.95 and 6.88 are the absorption coefficients of chlorophyll a at the 665 and 649 nm wavelengths, respectively. Furthermore, 24.96 and 7.32 are the absorption coefficients of chlorophyll b at the 665 and 649 nm wavelengths, respectively. The chlorophyll content was the sum of the Ca and Cb.
2.5. Rubisco Enzyme Activity Assay
Rubisco catalyzes one molecule ofRuBP to combine with one molecule of CO2 to produce two molecules of 3-phosphoglyceric acid (PGA). Then, PGA produces glyceraldehyde-3-phosphate under the action of additional 3-phosphoglycerate kinase and glyceraldehyde-3-phosphate dehydrogenase, which is accompanied by the oxidation of NADPH to NAD+. NADH has a special absorption peak at 340 nm. Thus, the decreasing rate of the absorbance value can represent the Rubisco carboxylase activity. Based on this mechanism, Rubisco Assay Kit by Solarbio Life Sciences and Tecan Spark 10M were used to measure the carboxylation activity of Rubisco.
2.6. Quantitative Real-Time PCR (qRT-PCR)
To analyze the differential expression profiles of peanut RBCS family genes under N-deficiency, the total RNA of seedling leaves was extracted using the Cetyl Trimethyl Ammonium Bromide (CTAB) method [29]. In version 5.0 of Primer Program, reverse transcription primers were designed according to the peanut RBCS gene sequences, then a QuantScript Reverse Rranscription kit was used for the synthesis of cDNA. A SuperReal PreMix Plus (SYBR Green) kit was used in this experiment. The relative expressions of the peanut RBCS family genes were detected by qRT-PCR, which was run as follows: 95 °C for 15 min, followed by 42 cycles of 95 °C for 15 s, 60 °C for 15 s; and the melt curve stage was set as follows: 95 °C for 15 s, 60 °C for 1 min, 95 °C for 15 s. Each qRT-PCR reaction volume was 10 μL in total: 2 μL diluted cDNA, 1.8 μL RNA free water, 5 μL 2 × SuperReal Premix Plus, 0.2 μL 50 × ROX Reference Dye, 0.5 μL forward primer, and 0.5 μL reverse primer. The values of the relative expressions for RBCS family genes were calculated using the 2-ΔΔCt method. The student test was used to analyze the difference in the relative expression between the two treatments.
2.7. Statistical Analysis
All collected data was analyzed by LSD, SNK, and the t-test. The differences in the same variety under the two treatments were marked by * (p-value < 0.05) and ** (p-value < 0.01), n > 3. The correlation analysis was completed by a data processing system (DPS), n = 3. Figures were plotted using sigma plot software.
3. Results
3.1. Identification of RBCS Genes
The genome-wide identification of peanut RBCS genes was conducted using Rubisco_small and Rubisco_S Pfam with Hmmserach software. After the filtering of redundancy sequences, a total of eight RBCS genes were identified, and renamed from AhRBCS 1 to AhRBCS 8 according to their positions in the chromosomes (Table 1). The physicochemical property analysis showed that the molecular weight of AhRBCSs ranged from 17.595 to 25.538 kDa. The pI values were more than 8.6, indicating that all AhRBCS were basic proteins. An evolutionary tree was constructed using the RBCS amino acid sequences of Arachis hypogaea, Glycine max, Zea mays, and Nicotiana tabacum (Figure 1). All RBCSs were classified into four groups with seven subgroups (A1, A2, B1, B2, B3, C, D). Most AhRBCSs were assigned to group A while AhRBCS1 and AhRBCS5 were classified in subgroup B1.

Table 1.
Molecular characterization of the RBCS family in peanut seedlings.
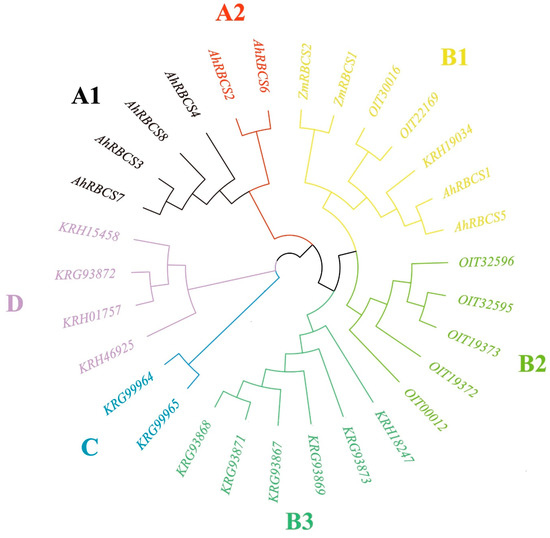
Figure 1.
Phylogenetic relationships of RBCS family proteins in diverse species. Four species were used in the unrooted tree: Ah Arachis hypogaea, OIT Glycine max, Zm Zea mays, KRH and KRG Nicotiana tabacum. Different groups are color-coded.
3.2. Sequence Characteristics of RBCS Family Genes
The alignment analysis shows that AhRBCS2 and AhRBCS6 showed similar protein sequences. The identity between AhRBCS1 and AhRBCS5 was 97.3%. Additionally, it was more than 70.1% among subgroups A1. These results indicated that AhRBCSs maintained high conservatism in the evolution process, and this is consistent with the evolutionary analysis (Figure 2a). The conservation motif analysis showed that a total of ten motifs were detected (Figure 2d). All AhRBCSs comprised motif 1, motif 2, and motif 4. It could be inferred that these motifs were associated with the functions of AhRBCSs. In addition, gene structure analysis showed that all AhRBCS genes have three exons and one intron (Figure 2e).
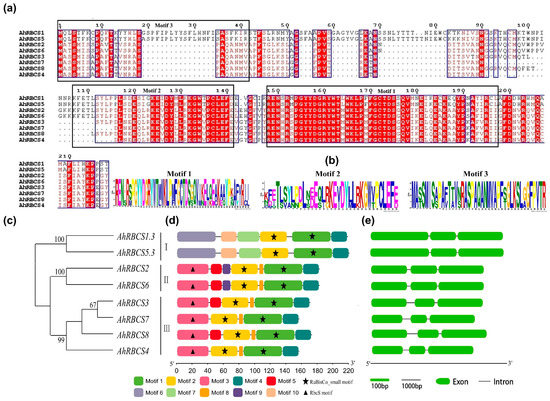
Figure 2.
Gene characteristics and conserved protein domains of the peanut RBCS family. (a) Multiple sequence alignment of RBCS family proteins by DNAMAN. The red fillers represent the same amino acid residues at the same location, and the black boxes represent conserved motifs; (b) Three motif sequences with the highest scores by MEME. The bigger the letter size, the more likely that the amino acid is at the location; (c) A branching phylogenetic tree of AhRBCS. Higher numbers represent a more reliable systematic relationship: 0–100; (d) Boxes with different colors represent different conserved motifs of RBCS family proteins; RuBisCo_small and RbcS_motif are marked with stars and triangles, respectively; (e) The structures of introns and exons of the RBCS family genes were mapped in GSDS 2.0.
To further understand the potential regulatory mechanisms of AhRBCS genes, a total of 326 cis-acting regulatory elements (CREs) 1500 bp upstream of the gene promoter regions were identified. Among these, light-responsive elements were highly enriched (140), followed by CAAT-boxes (115) and abscisic acid-responsive elements (ABRE,49) (Figure 3).
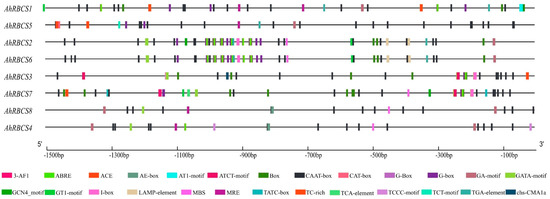
Figure 3.
Distribution of putative cis-acting elements in promoter regions of 1500 bp genomic sequences upstream of the start codon of peanut RBCS family genes. Different cis-acting element boxes are filled with different colors.
The TGA element and auxin-responsive element were only found in AhRBCS3, AhRBCS4, AhRBCS7, and AhRBCS8 (Figure 3). The MYB-binding sites were found in AhRBCS4, AhRBCS6, AhRBCS7, and AhRBCS8 (Figure 3). In addition, growth- and development-related elements were more sparsely distributed among the AhRBCS promoter regions. There was one CRE related to meristem expression (CAT-box) in AhRBCS5 and one cis-regulatory element (GCN4-motif) involved in endosperm expressions in AhRBCS2 and AhRBCS7, respectively.
3.3. Morphological Changes under N-deficiency
The peanut seedlings’ height was significantly increased after 5 days of N-deficient treatment, except YH1 (Figure 4a). Whereas the increasing rates were downregulated under prolonged stress conditions. For instance, the plant height of the LH4087 cultivar was increased by 1.53-, 1.30-, and 1.07-fold after 5, 10, and 15 days of treatment, respectively (Figure 4a). This indicated that short-term N-deficiency stimulates plant height while long-term N-deficiency can severely suppress plant height. The total stem length, leaf area, and plant dry weight presented similar trends, which were significantly inhibited, and the rates of decrease were up-regulated with the increase in time (Figure 4b–d). In addition, the N-deficiency increased the root-shoot ratio of AH3. For instance, the root-shoot ratio was significantly lower at the early stage compared with that of the control while it was higher after 15 days of treatment (Figure 4e).
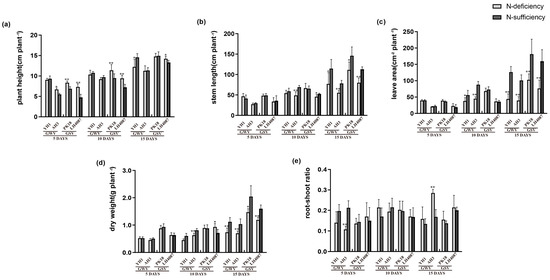
Figure 4.
Responses of different peanut cultivars to treatments of N-deficiency and N-sufficiency in different growth stages. (a) Plant height; (b) total stem length; (c) leaf area; (d) plant dry wight; (e) root-shoot ratio. * significant at p < 0.05 level and ** significant at p < 0.01 level.
3.4. Peanut Seedlings’ Leaf Gas Exchange Parameters under N-deficiency
The nitrogen balance index (NBI), PSII primary light energy conversion efficiency (Fv/Fm), performance index based on absorbed light energy (PIabs), chlorophyll content in peanut leaves (Chl), transpiration rate (Tr), and stomatal conductance (Gs) were extremely decreased by the N-deficient treatment (Figure 5). The intercellular CO2 concentration (Ci) of different genotypes had different responses to N-deficiency. For instance, Ci of YH1 decreased significantly by 0.66-and 0.68-fold under N-deficiency after 5 and 10 days, respectively. However, it changed by 1.28-fold after 15 days with the time of culture. In contrast, Ci of LH4087 remained insignificant in the initial stage of N-deficiency treatment but decreased significantly with the increase in the stress duration. The net photosynthetic rates (Pn) were reduced significantly by the N-deficiency in all cultivars. After 15 days of N-deficiency treatment, Pn of peanut seedlings of YH1, AH3, PK18, and LH4087 decreased to 0.11, 0.24, 0.52, and 0.36 times, respectively. Compared with other cultivars, PK18 and LH4087 remained at a higher level of 10.35 and 9.04 µmol m−2 s−1, respectively.
Figure 5.
Responses of leaf gas exchange parameters to N-deficiency and N-sufficiency in different periods. (a) NBI nitrogen balance index; (b) PIabs performance index based on absorbed light energy; (c) Fv/Fm PSII primary light energy conversion efficiency; (d) Chl chlorophyll content in seedling leaves; (e) Tr transpiration rate; (f) Ci intercellular CO2 concentration; (g) Gs stomatal conductance; (h) Pn net photosynthetic rate; and (i) Rubisco activity. * significant at p < 0.05 level and ** significant at p < 0.01 level.
3.5. Rubisco Carboxylation Activity Assay
N-deficiency significantly reduced the carboxylation activities. After 5 days, the Rubisco carboxylation activities of YH1 and PK18 were increased briefly under the N-deficiency treatment while they were decreased to 0.28- and 0.27-fold compared with the N-sufficiency treatment after 15 days, respectively. N-deficiency substantially decreased the Rubisco carboxylation activities in both AH3 and LH4087 cultivars.
3.6. Gene Expression of RBCS Response to N-deficiency
The gene expression of AhRBCSs showed differently responses to N-deficiency in different varieties. With N-deficiency, AhRBCS1/5 and AhRBCS2/6 changed from being significantly downregulated to being significantly upregulated. In contrast, AhRBCS3/4/7/8 changed from being significantly upregulated to downregulated with the increase in the N-deficiency duration for YH1 (Figure 6). For AH3, AhRBCS1/5 and AhRBCS 2/6 were significantly upregulated by more than 2.63-fold, of which AhRBCS2/6 was upregulated by 11.9-fold after 10 days of treatment (Figure 6). The expressions of AhRBCS1/5 were downregulated after 5 days by 0.22-fold while it was upregulated after 10 days by 5.19-fold, and no significant differences were noticed after 15 days for PK18 (Figure 6). The expressions of AhRBCS1/5 and AhRBCS2/6 in LH4087 were similar to YH1, showing significant upregulation ranging from 7.75- to 10.3-fold with the increase in the treatment time (Figure 6). Consistently, in all cultivars, the expressions of AhRBCS3/4/7/8 were significantly downregulated under N-deficiency.
Figure 6.
Heat map of RBCS family gene expression profiles responding to N-deficiency in different peanut varieties. Peanut seedlings cultured by N-sufficiency treatment were regarded as controls. * significant at p < 0.05 level.
3.7. Correlation Analysis
To understand the relationship between morphological and physiological changes, correlation analysis was performed by DPS software. The results show that the dry weight, stem length, and leaf area were positively correlated with the chlorophyll content, Tr, Pn, Ci, Gs, and carboxylation activity of Rubisco (Figure 7). The Rubisco activity was negatively correlated with the expressions of AhRBCS1/5 and AhRBCS2/6 (Figure 7). On the whole, no significant correlation between the expressions of AhRBCS3/4/7/8 and the carboxylation activity of Rubisco was noticed (Figure 7). However, the expressions of AhRBCS3/4/7/8 showed different correlations with the Rubisco carboxylation activity in different stages (Figures S1–S3). With the increase in the stress duration, the Rubisco carboxylation activity showed negative correlations with the expressions of AhRBCS1/5 and AhRBCS2/6, and positive correlations with AhRBCS3/4/7/8 (Figures S1–S3). For PK18, the expressions of AhRBCS3/4/7/8 were positively correlated with the carboxylation activity of Rubisco (Figure S4). Similar conditions were observed for AH3 and LH4087 but not to a significant level (Figure S4). In addition, the correlation between Rubisco activity and the expressions of AhRBCSs were different in different periods (Figure S4). For example, the Rubisco activity showed significantly negative correlations with the expressions of AhRBCS1/5 and AhRBCS2/6 at the beginning of the N-deficiency treatment (5 days), and positive correlations with AhRBCS3/4/7/8 after 15 days (Figure S4).
Figure 7.
Correlation analysis based on all data. The brightest blue and the brightest red represents the greatest negative correlation and the greatest positive correlation, respectively. Chl content chlorophyll content in seedling leaves; Fv/Fm PSII primary light energy conversion efficiency; PIabs performance index based on absorbed light energy; NBI nitrogen balance index; Tr transpiration rate; Pn net photosynthetic rate; Gs stomatal conductance; AhRBCS1/5 the expressions of AhRBCS1/5 in leaves; AhRBCS2/6 the expressions of AhRBCS2/6 in leaves; AhRBCS3/4/7/8 the expressions of AhRBCS3/4/7/8 in leaves. * significant at p < 0.05 level and ** signifcant at p < 0.01 level.
4. Discussion
4.1. RBCS Gene Characteristics in Peanut
The RBCS protein family is encoded by multiple genes, and their expressions determine the abundance of Rubisco [7]. In this study, eight RBCS proteins from Arachis hypogaea, thirteen from Nicotiana tabacum, seven from Glycine max, and two from Zea mays [30] were identified. These proteins were assigned to seven subgroups of A1, A2, B1, B2, B3, C, and D. AhRBCS1 and AhRBCS5 were assigned to subgroup B1, with two RBCS members of maize, two of tobacco, and one of soybean in the phylogenetic tree, respectively. The amino acid sequences of AhRBCS2 and AhRBCS6 were consistent, and the composition of cis-acting elements in the promoter region were similar. These results suggest that they have undergone genetic domestication throughout evolution [31]. In addition, many different fragments were found by comparing the amino acid sequences. It was speculated that these genetic changes were related to AhRBCS evolution, which enlarged the base of the RBCS gene family [7].
Previous studies have shown that the RBCS gene is transcribed when the leaves received light signals, and light intensity affected the expression abundances of the RBCS genes [32]. This suggested that RBCS genes were regulated by light inducibility [33]. Abundant light-responsive elements were arranged 1500 bp upstream of AhRBCS gene promoter regions, such as G-box, GATA-motif, and I-box. These elements were involved in regulating the synthesis of RBCSs [34], chlorophyll [35], ascorbic acid [36], and other substances in plants. The abundance of Rubisco was decreased when the leaves experienced dark conditions [37]. The biosynthesis of some apoproteins and cofactors involved in the reduction of nitric acid to nitrite was regulated by light induction [38]. Thus, it was speculated that the nitrogen use efficiency of peanut is related to the expressions of AhRBCS genes. In the present study, two, two, one, and two TGA elements were identified in the promoter region of AhRBCS3/4/7/8, respectively, but not detected in AhRBCS1/5 and AhRBCS2/6. The expression levels of the genes containing auxin-responsive element (TGA element) were significantly increased by auxin [39]. When plants were subjected to N-deficiency, the signal transduction levels related to auxin in plants were significantly changed [40]. In the current study, the expressions of AhRBCS3/4/7/8 containing the TGA element in the promoter region were significantly downregulated while AhRBCS 1/5 and AhRBCS 2/6 were significantly upregulated under N-deficiency. This indicated that the TGA element might be associated with the response to N levels.
4.2. The Morpho-Physiological Changes of Peanut under Low-N Stress
N is a major determinant of plant growth, and its deficiency restricts plant growth and causes serious physiological damage [41,42]. Previous studies have indicated that N-deficiency stress reduced biomass accumulation and the chlorophyll content, and affected the antioxidant characteristics, which were used to evaluate the tolerance of crops of N-deficiency stress [43,44]. Changes in peanut seedlings in response to N-deficiency strongly affected plant development later in the season [45]. In the present study, N-deficiency significantly decreased the total stem length, leaf area, and plant dry weight of peanut seedlings, which was similar to previous studies [22]. Combined with this study, the possible reason was that the N-deficiency affected the expressions of AhRBCS genes, inhibited Rubisco synthesis and photosynthesis, and thus limited the growth of peanut seedlings. In the current study, after 5 days of N-deficiency treatment, the peanut seedlings Pn of four cultivars were significantly decreased while there was no change in the total stem length, leaf area, and plant dry weight. After 10 days, the leaf area and plant dry weight of YH1 and AH3 decreased significantly but not for PK18 and LH4087. Although the biomass did not change significantly, physiological changes showed that the photosynthesis rates of PK18 and LH4087 were significantly inhibited by N-deficiency. A possible reason was that the application of N directly affected the root system, which in turn changed photosynthesis by the root responses [46]. To cope with N-deficiency stress, greater root activity and an increased number of roots are important for N-tolerant varieties, which maintained the nutrient supplement and photosynthetic area [47]. Therefore, in terms of morphological characteristics, PK18 and LH4087 showed greater tolerance of N-deficient stress conditions.
Photosynthesis was a pre-requisite for higher plant biomass formation [48], which was a coupling process of light and dark reactions [49]. Previous studies showed that chlorophyll synthesis was significantly inhibited, and the shoot growth was slow when plants were subjected to N-deficiency [50,51]. In the present study, after 5 days of N-deficiency treatment, the chlorophyll contents of YH1 and LH4087 were significantly decreased while NBI, PIabs, and Fv/Fm were unchanged for YH1, and they were significantly increased for LH4087. A possible reason was that photosynthesis used only 5% of the light energy absorbed [52]. This suggested that in the early stage of the N-deficiency treatment, the decrease in the chlorophyll content was not a key factor in the decreased photosynthetic rates. In addition, Gs, Tr, and Ci were significantly decreased while the Rubisco carboxylation activity of YH1 was significantly increased. This indicated that the decreased net photosynthetic rate was induced by stomatal closure at the initial stage of N-deficiency. After 10 days of N-deficiency, the chlorophyll content, NBI, PIabs, fv/fm, Gs, and Pn were significantly decreased for all peanut seedlings. Except for YH1 and LH4087, Ci of the other two varieties were not changed by the N-deficiency. Moreover, the Rubisco carboxylation activity of PK18 and LH4087 was significantly decreased under the N-deficiency treatment. These changes in physiological characteristics suggested that the participation of non-stomatal factors limit the net photosynthetic rate of peanut seedlings.
Rubisco is a key factor and has a potent role in the photosynthetic rate of plants and is globally accepted [53]. Therefore, the stimulation of Rubisco activity is one of the most important targets to improve plant photosynthesis under stressful conditions. Studies have shown that the activity of Rubisco was suppressed by Rubisco activase (RCA), which mediates the activation of Rubisco by removing the inhibitors in an ATP-dependent manner [54,55]. In the present study, the carboxylation activity of Rubisco was significantly declined under N-deficiency compared with a sufficient N supply, which could be caused by the damage to and decrease in the RCA content [56].
4.3. The Expressions of AhRBCSs
Studies have demonstrated that RBCSs were mainly expressed in leaves [57]. Therefore, in this study, we extracted the total RNA from peanut leaves for qRT-PCR to analyze the effects on AhRBCS family genes by N tolerance. It showed that the expression profiles of AhRBCS family genes were significantly changed by N-deficiency. Under N-deficiency, the significant decreases in the chlorophyll content, NBI, PIabs, Fv/Fm, Tr, Gs, and Pn were associated with the upregulation of AhRBCS1/5 and AhRBCS2/6 and the downregulation of AhRBCS 3/4/7/8, and the growth and development of seedlings were severely inhibited. Rubisco carboxylation activity was negatively correlated with the expressions of AhRBCS1/5 and AhRBCS2/6 and positively correlated with AhRBCS3/4/7/8. However, studies have shown that the abundance of Rubisco and photosynthesis of plants were not improved by overexpressions of the RBCS genes [58]. A possible reason was that the RBCL genes also played critical roles in the regulation of Rubisco activity [59]. In summary, we found that the expressions of AhRBCS1/5, and AhRBCS2/6 were upregulated while AhRBCS3/4/7/8 were downregulated under long-term N-deficiency.
5. Conclusions
In this study, eight members of AhRBCS family proteins and eight AhRBCS genes distributed on six chromosomes were identified in the peanut genome. The promoter regions of AhRBCS genes contained a large number of CREs related to the light response. Under N-deficiency stress conditions, carboxylation activity in peanut seedlings was significantly decreased compared with other counterparts. The decline in Rubisco activities further reduced the net photosynthetic rate of peanut seedlings. An increase in the photosynthetic area was an effective strategy used by peanuts to cope with N-deficiency. The growth of peanut seedlings was inhibited by N-deficiency. For different cultivars, the weak-growing varieties were more sensitive to N-deficiency compared with strong-growing varieties in the initial stage. In addition, the expressions of AhRBCS1/5 and AhRBCS2/6 were significantly upregulated while AhRBCS3/4/7/8 were significantly downregulated. This suggested that the simultaneous regulation of multiple genes’ expressions may maintain high levels of photosynthesis in peanuts under N-deficiency condition. Taken together, this study supplied the biological information of peanut RBCS family genes and provided the strategies for promoting the photosynthetic efficiency and carbon–nitrogen conversion under N-deficiency stress.
Supplementary Materials
The following supporting information can be downloaded at: https://www.mdpi.com/article/10.3390/agronomy12102316/s1, Figure S1: Correlation analysis based on data after 5 days of N- deficiency; Figure S2: Correlation analysis based on all data after 10 days of N-deficiency; Figure S3: Correlation analysis based on data after 15 days of N-deficiency; Figure S4: Correlation analysis based on expressions of AhRBCSs by N-deficiency.
Author Contributions
Conceptualization, X.K. and Z.Z.; methodology, X.K.; resources, L.L. and X.K.; project administration, P.J.; investigation, X.W., X.C., X.Z., L.Z., H.X. and P.J.; software, X.W. and X.K.; data curation, X.W., X.C. and X.Z.; writing—original draft, X.W.; writing—review and editing, X.K. and A.K.; funding acquisition, L.L. and P.J.; supervision, Z.Z. All authors have read and agreed to the published version of the manuscript.
Funding
This work was supported by the Leading Talent Project in Science and Technology Innovation of Central Plain of China (214200510021), the Key Science and Technology Special Project of Xinxiang City of China (ZD2020004), the Program for Innovative Research Team (in Science and Technology) at the University of Henan Province (21IRTSTHN023), and and the Key R&D and promotion projects of Henan Province (202102110181 and 212102110070).
Institutional Review Board Statement
Not applicable.
Informed Consent Statement
Not applicable.
Data Availability Statement
The original contributions presented in the study are included in the article/supplementary material, further inquiries can be directed to the corresponding author.
Conflicts of Interest
The authors declare no conflict of interest.
References
- Andersson, I. Catalysis and regulation in Rubisco. J. Exp. Bot. 2008, 59, 1555–1568. [Google Scholar] [CrossRef] [PubMed]
- Ogawa, S.; Suzuki, Y.; Yoshizawa, R.; Kanno, K.; Makino, A. Effect of individual suppression of RBCS multigene family on Rubisco contents in rice leaves. Plant Cell Environ. 2012, 35, 546–553. [Google Scholar] [CrossRef] [PubMed]
- Lun, M.V.; Hub, J.S.; Spoel, D.; Andersson, I. CO2 and O2 Distribution in Rubisco Suggests the Small Subunit Functions as a CO2 Reservoir. J. Am. Chem. Soc. 2014, 136, 3165–3171. [Google Scholar] [CrossRef] [PubMed]
- Mukherjee, S.; Stasolla, C.; Lé-Babel, A.B.; Ayele, B.T. Isolation and characterization of rubisco small subunit gene promoter from common wheat (Triticum aestivum L.). Plant Signal Behav. 2015, 10, e989033. [Google Scholar] [CrossRef] [PubMed]
- Tai, W.Y.; Mak, Y.M.; Ho, K.K. Rubisco small subunit gene family in cassava. DNA Seq. 2009, 10, 189–194. [Google Scholar]
- Fritz, C.C.; Wolter, F.P.; Schenkemeyer, V.; Herget, T.; Schreier, P.H. The gene family encoding the ribulose-(1,5)-bisphosphate carboxylase/oxygenase (Rubisco) small subunit of potato. Gene 1993, 137, 271–274. [Google Scholar] [CrossRef]
- Qin, L.; Xue, Y.; Fei, Y.; Zeng, L.; Yang, S.; Deng, X. Identification, evolution and expression analyses of Ribulose-1,5-bisphosphate carboxylase/oxygenase small subunit gene family in wheat (Triticum aestivum L.). Acta Physiol. Plant 2018, 40, 85. [Google Scholar] [CrossRef]
- Donald, R.; Cashmore, A.R. Mutation of either G box or I box sequences profoundly affects expression from the Arabidopsis rbcS-1A promoter. EMBO J. 1990, 9, 1717–1726. [Google Scholar] [CrossRef]
- Wang, D.; Wang, W.; Xu, N.; Sun, X. Changes in Growth, Carbon and Nitrogen Enzyme Activity and mRNA Accumulation in the Halophilic Microalga Dunaliella viridis in Response to NaCl Stress. J. Ocean Univ. China 2016, 15, 1094–1110. [Google Scholar] [CrossRef]
- Doron, L.; Xu, L.; Rachmilevitch, S.; Stern, D.B. Transgenic overexpression of rubisco subunits and the assembly factor RAF1 are beneficial to recovery from drought stress in maize. Environ. Exp. Bot. 2020, 177, 104126. [Google Scholar] [CrossRef]
- Hao, J.; Liu, L.; Yang, Y.; Zhou, R. The influence of HCO3−, K+ and HSO3− on RUBISCO large-subunit (rbcL) and small-subunit (rbcS) genes expression. Afr. J. Agric. Res. 2011, 6, 2280–2284. [Google Scholar]
- Tilman, D.; Cassman, K.G.; Matson, P.A.; Naylor, R.; Polasky, S. Agricultural sustainability and intensive production practices. Nature 2002, 418, 671–677. [Google Scholar] [CrossRef] [PubMed]
- Li, C.; Xu, Z.; Dong, Z.; Shi, S.; Zhang, J. Effects of Nntrogen Application Rate on the Yelds, Yutritive Value and Silage Fermentation Quality of Whole-crop Wheat. Asian-Austral. J. Anim. Sci. 2016, 29, 1129–1135. [Google Scholar] [CrossRef] [PubMed]
- Liu, H.; Lu, S. Effectiveness analysis of investment in chemical fertilizer to increase grain crops yield and countermeasures in Tianjin. J. Tianjin Agric. Coll. 1999, 6, 35–39. [Google Scholar]
- Amane, M.; Barry, O. Effects of Nitrogen Nutrition on Nitrogen Partitioning Between Chloroplasts and Mitochondria in Pea and Wheat. Plant Physiol. 1991, 96, 355–362. [Google Scholar]
- Mu, X.; Chen, Y. The physiological response of photosynthesis to nitrogen deficiency. Plant Physiol. Biochem. 2021, 158, 76–82. [Google Scholar] [CrossRef]
- Meng, L.I.; Qing, M.A.; Wang, H.; Wei, X.X.; Yong-Sheng, W.U. Characterization and evaluation of sensitivity to nitrogen input across maize inbreds based on the relative chlorophyll content. J. Plant Genet. Resour. 2015, 16, 1264–1271. [Google Scholar]
- Gao, J.; Feng, W.; Sun, J.; Tian, Z.; Dai, T. Enhanced Rubisco activation associated with maintenance of electron transport alleviates inhibition of photosynthesis under low nitrogen conditions in winter wheat seedlings. J. Exp. Bot. 2018, 69, 5477–5488. [Google Scholar] [CrossRef]
- Tantray, A.Y.; Bashir, S.S.; Ahmad, A. Low nitrogen stress regulates chlorophyll fluorescence in coordination with photosynthesis and Rubisco efficiency of rice. Physiol. Mol. Biol. Plants 2020, 26, 83–94. [Google Scholar] [CrossRef]
- Wang, L.; Liu, H.; Liu, L.; Wang, Q.; Li, Q.; Du, Y.; Zhang, J. Protein Contents in Different Peanut Varieties and Their Relationship to Gel Property. Int. J. Food Prop. 2014, 17, 1560–1576. [Google Scholar] [CrossRef]
- Wang, J.; Song, K.; Sun, L.; Qin, Q.; Sun, Y.; Pan, J.; Xue, Y. Morphological and Transcriptome Analysis of Wheat Seedlings Response to Low Nitrogen Stress. Plants 2019, 8, 98. [Google Scholar] [CrossRef] [PubMed]
- Li, L.; Li, Q.; Davis, K.E.; Patterson, C.; Zhang, B. Response of Root Growth and Development to Nitrogen and Potassium Deficiency as well as microRNA-Mediated Mechanism in Peanut (Arachis hypogaea L.). Front. Plant Sci. 2021, 12, 695234. [Google Scholar] [CrossRef] [PubMed]
- Chandna, R.; Kaur, G.; Iqbal, M.; Khan, I.; Ahmad, A. Differential response of wheat genotypes to applied nitrogen: Biochemical and molecular analysis. Arch. Agron. Soil Sci. 2012, 58, 915–929. [Google Scholar] [CrossRef]
- Iqbal, A.; Dong, Q.; Wang, X.; Gui, H.; Song, M. Variations in Nitrogen Metabolism are Closely Linked with Nitrogen Uptake and Utilization Efficiency in Cotton Genotypes under Various Nitrogen Supplies. Plants 2020, 9, 250. [Google Scholar] [CrossRef]
- Lozano, R.; Hamblin, M.T.; Prochnik, S.; Jannink, J.L. Identification and distribution of the NBS-LRR gene family in the Cassava genome. BMC Genom. 2015, 16, 360. [Google Scholar] [CrossRef]
- Fontana, J.E.; Wang, G.; Sun, R.; Xue, H.; Pan, X. Impact of potassium deficiency on cotton growth, development and potential microRNA-mediated mechanism. Plant Physiol. Biochem. 2020, 153, 72–80. [Google Scholar] [CrossRef]
- Chang, M.; Wei, X.; Wang, Q.; Hu, Y.; Li, C.; Tang, Y. University G. A Comparative Study on Different Extraction Methods for Plant Chlorophyll. Chin. Agric. Sci. Bull. 2016, 32, 177–180. [Google Scholar]
- Fargašová, A.; Molnárová, M. Assessment of Cr and Ni phytotoxicity from cutlery-washing waste-waters using biomass and chlorophyll production tests on mustard Sinapis alba L. seedlings. Environ. Sci. Pollut. Res. 2009, 17, 187–194. [Google Scholar] [CrossRef]
- Zhou, F. An improved CTAB Method for Extraction of Total RNA From Mature Leaves in Oil Sunflower. Heilongjiang Agric. Sci. 2013, 7, 14–16. [Google Scholar]
- Wang, B.; Yingjuan, S.; Wang, T. Molecular cloning of RBCS genes in Selaginella and the evolution of the rbcS gene family. Arch. Biol. Sci. 2015, 67, 373–383. [Google Scholar] [CrossRef]
- Brenchley, R.; Spannagl, M.; Pfeifer, M.; Barker, G.L.A.; D’Amore, R.; Allen, A.M.; Mckenzie, N.; Kramer, M.; Kerhornou, A.; Bolser, D. Analysis of the bread wheat genome using whole-genome shotgun sequencing. Nature 2012, 491, 705–710. [Google Scholar] [CrossRef] [PubMed]
- Sun, J.L.; Sui, X.L.; Huang, H.Y.; Wang, S.H.; Wei, Y.X.; Zhang, Z.X. Low Light Stress Down-Regulated Rubisco Gene Expression and Photosynthetic Capacity During Cucumber (Cucumis sativus L.) Leaf Development. J. Integr. Agric. 2014, 13, 997–1007. [Google Scholar] [CrossRef]
- Morelli, G.; Nagy, F.; Fraley, R.T.; Rogers, S.G.; Chua, N.H. A short conserved sequence is involved in the light-inducibility of a gene encoding ribulose 1,5-bisphosphate carboxylase small subunit of pea. Nature 1985, 315, 200–204. [Google Scholar] [CrossRef]
- Giuliano, G.; Pichersky, E.; Malik, V.S.; Timko, M.P.; Scolnik, P.A.; Cashmore, A.R. An evolutionarily conserved protein binding sequence upstream of a plant light-regulated gene. Proc. Natl. Acad. Sci. USA 1988, 85, 7089–7093. [Google Scholar] [CrossRef] [PubMed]
- Schindler, U.; Cashmore, A.R. Photoregulated gene expression may involve ubiquitous DNA binding proteins. EMBO J. 1990, 9, 3415–3427. [Google Scholar] [CrossRef] [PubMed]
- Fukunaga, K.; Fujikawa, Y.; Esaka, M. Light Regulation of Ascorbic Acid Biosynthesis in Rice via Light Responsive cis-Elements in Genes Encoding Ascorbic Acid Biosynthetic Enzymes. J. Agric. Chem. Soc. Jpn. 2010, 74, 888–891. [Google Scholar]
- Perdomo, J.A.; Buchner, P.; Carmo-Silva, E. The relative abundance of wheat Rubisco activase isoforms is post-transcriptionally regulated. Photosynth. Res. 2021, 148, 47–56. [Google Scholar] [CrossRef]
- Garai, S.; Joshi, N.C.; Tripathy, B.C. Phylogenetic analysis and photoregulation of siroheme biosynthesis genes: Uroporphyrinogen III methyltransferase and sirohydrochlorin ferrochelatase of Arabidopsis thaliana. Physiol. Mol. Biol. Plants 2016, 22, 351–359. [Google Scholar] [CrossRef]
- Xin, S.; Tao, C.; Li, H.; Fang, D.D. Cloning and Functional Analysis of the Promoter of An Ascorbate Oxidase Gene from Gossypium hirsutum. PLoS ONE 2016, 11, e161695. [Google Scholar] [CrossRef]
- Yu, H.; Yuan, Y.; Wang, S.; Wu, G.; Xu, H.; Wei, J.; Ju, L.; Huang, Y.; Chen, H. Interspecies Evolution and Networks Investigation of the Auxin Response Protein (AUX/IAA) Family Reveals the Adaptation Mechanisms of Halophytes Crops in Nitrogen Starvation Agroecological Environments. Agriculture 2021, 11, 780. [Google Scholar] [CrossRef]
- Lin, Y.L.; Chao, Y.Y.; Huang, W.D.; Kao, C.H. Effect of nitrogen deficiency on antioxidant status and Cd toxicity in rice seedlings. Plant Growth Regul. 2011, 64, 263–273. [Google Scholar] [CrossRef]
- Wei, S.; Wang, X.; Shi, D.; Li, Y.; Zhang, J.; Liu, P.; Zhao, B.; Dong, S. The mechanisms of low nitrogen induced weakened photosynthesis in summer maize (Zea mays L.) under field conditions. Plant Physiol. Biochem. 2016, 105, 118–128. [Google Scholar] [CrossRef] [PubMed]
- Jiang, Q.; Chen, Z.; Liu, C.; Ting, H.E.; Guo, G.; Gao, R.; Hongwei, X.U.; Yingbo, L.I.; Ruiju, L.U.; Huang, J. Screening and Identification Indices of Low-nitrogen Tolerance for Barley Landraces at Seedling Stage. Acta Agric. Boreali-Sin. 2019, 34, 148–155. [Google Scholar]
- Liu, C.; Gong, X.; Wang, H.; Dang, K.; Deng, X.; Feng, B. Low-nitrogen tolerance comprehensive evaluation and physiological response to nitrogen stress in broomcorn millet (Panicum miliaceum L.) seedling. Plant Physiol. Biochem. 2020, 151, 233–242. [Google Scholar] [CrossRef] [PubMed]
- Shen, T.; Xiong, Q.; Zhong, L.; Shi, X.; Chen, X. Analysis of main metabolisms during nitrogen deficiency and compensation in rice. Acta Physiol. Plant 2019, 41, 68. [Google Scholar] [CrossRef]
- Chen, Z.; Tao, X.; Khan, A.; Tan, D.K.Y.; Luo, H. Biomass Accumulation, Photosynthetic Traits and Root Development of Cotton as Affected by Irrigation and Nitrogen-Fertilization. Front. Plant Sci. 2018, 9, 173. [Google Scholar] [CrossRef]
- Ma, F.J.; Li, D.D.; Cai, J.; Jiang, D.; Dai, T.B. Responses of wheat seedlings root growth and leaf photosynthesis to drought stress. J. Appl. Ecol. 2012, 23, 724–730. [Google Scholar]
- Hussain, S.; Ulhassan, Z.; Brestic, M.; Zivcak, M.; Liu, W. Photosynthesis research under climate change. Photosynth. Res. 2021, 150, 5–19. [Google Scholar] [CrossRef]
- Levine, R.P. The mechanism of photosynthesis. Sci. Am. 1969, 221, 58–70. [Google Scholar] [CrossRef]
- Yuasa, K.; Shikata, T.; Kuwahara, Y.; Nishiyama, Y. Adverse effects of strong light and nitrogen deficiency on cell viability, photosynthesis, and motility of the red-tide dinoflagellate Karenia mikimotoi. Phycologia 2018, 57, 525–533. [Google Scholar] [CrossRef]
- Liu, X.; Wang, S.; Deng, X.; Zhang, Z.; Yin, L. Comprehensive evaluation of physiological traits under nitrogen stress and participation of linolenic acid in nitrogen-deficiency response in wheat seedlings. BMC Plant Biol. 2020, 20, 501. [Google Scholar] [CrossRef] [PubMed]
- Buschmann, C.; Langsdorf, G.; Lichtenthaler, H.K. Imaging of the Blue, Green, and Red Fluorescence Emission of Plants: An Overview. Photosynthetica 2000, 38, 483–491. [Google Scholar] [CrossRef]
- Hiroshi, F.; Akina, M.; Chiaki, U.; Jun, K.; Ryutaro, M.; Daisuke, S.; Tomoko, H.; Tetsushi, A. Expression level of Rubisco activase negatively correlates with Rubisco content in transgenic rice. Photosynth. Res. 2018, 137, 465–474. [Google Scholar]
- Bracher, A.; Whitney, S.M.; Hartl, F.U.; Hayer-Hartl, M. Biogenesis and Metabolic Maintenance of Rubisco. Annu. Rev. Plant Biol. 2017, 68, 29–60. [Google Scholar] [CrossRef] [PubMed]
- Bhat, J.Y.; Gabriel, T.P.; Ulrich, H.F.; Manajit, H.H. Rubisco Activases: AAA+ Chaperones Adapted to Enzyme Repair. Front. Mol. Biosci. 2017, 4, 20. [Google Scholar] [CrossRef]
- Mao, S.; Suzuki, Y.; Kondo, E.; Nishida, S.; Makino, A. Effects of Overproduction of Rubisco Activase on Rubisco Content in Transgenic Rice Grown at Different N Levels. Int. J. Mol. Sci. 2020, 21, 1626. [Google Scholar]
- Suzuki, Y.; Nakabayashi, K.; Yoshizawa, R.; Mae, T.; Makino, A. Differences in Expression of the RBCS Multigene Family and Rubisco Protein Content in Various Rice Plant Tissues at Different Growth Stages. Plant Cell Physiol. 2009, 50, 1851–1855. [Google Scholar] [CrossRef]
- Kudo, N.; Mano, K.; Suganami, M.; Kondo, E.; Suzuki, Y.; Makino, A. Effects of overexpression of the Rubisco small subunit gene under the control of the Rubisco activase promoter on Rubisco contents of rice leaves at different positions. Soil Sci. Plant Nutr. 2020, 66, 569–578. [Google Scholar] [CrossRef]
- Chen, Y.; Wang, B.; Chen, J.; Wang, X.; Wang, R.; Peng, S.; Chen, L.; Ma, L.; Luo, J. Identification of Rubisco rbcL and rbcS in Camellia oleifera and their potential as molecular markers for selection of high tea oil cultivars. Front. Plant Sci. 2015, 6, 189. [Google Scholar] [CrossRef]


Publisher’s Note: MDPI stays neutral with regard to jurisdictional claims in published maps and institutional affiliations. |
© 2022 by the authors. Licensee MDPI, Basel, Switzerland. This article is an open access article distributed under the terms and conditions of the Creative Commons Attribution (CC BY) license (https://creativecommons.org/licenses/by/4.0/).