Article

Integrative Transcriptome and Metabolome Analyses of the Interaction of Oat–Oat Stem Rust

Science Innovation Team of Oats, Agricultural College, Inner Mongolia Agricultural University, Hohhot 010010, China
*
Author to whom correspondence should be addressed.
Agronomy 2022, 12(10), 2353; https://doi.org/10.3390/agronomy12102353
Submission received: 1 August 2022 / Revised: 21 August 2022 / Accepted: 26 September 2022 / Published: 29 September 2022

Abstract

:
Stem rust, caused by Puccinia graminis f. sp. avenae (Pga) Eriks. and E. Henn., is a worldwide and harmful disease of oat (Avena sativa L.). Currently, no resistant varieties are used in production as the molecular resistance mechanism of oat to stem rust remains unclear. Here, oat plants were inoculated with Pga pathogens, and the metabolome and transcriptome of leaves were detected to investigate the molecular and physiological changes. Our results showed that Pga inoculation increased the activities of superoxide dismutase (SOD), peroxidase (POD), catalase (CAT), and phenylalnine ammonialyase (PAL), which triggered defense responses. The transcriptomic and metabolomic analyses were performed to detect the key genes and metabolites of oat interacting with Pga. We identified 1814 upregulated and 1955 downregulated genes in Pga infected leaves. These genes were mainly involved in the ‘phenylpropanoid biosynthesis’, ‘flavonoid biosynthesis’, and ‘photosynthesis-antenna proteins’. We also detected 162 differential metabolites between Pga-infected and non-infected leaves, including flavonoids and derivatives, amino acids, organic acids, and carbohydrates. The integrated analysis revealed four pathways, including the ‘citrate cycle’, ‘cysteine and methionine metabolism’, ‘tryptophan metabolism’, and ‘glyoxylate and dicarboxylate metabolism’. The networks for these pathways were subsequently constructed. Overall, the results suggested that oat plants fight against Pga by activating the metabolism of amino acids, organic acids, and flavonoids. This study provides valuable molecular information about the response of oat to Pga infection.

1. Introduction

Globally, oat (Avena sativa L.) is the sixth most produced cereal crop [1], and it has the characteristics of salt–alkali tolerance, drought tolerance, and cold tolerance [2]. Oat contains a variety of nutrient-rich and health-friendly substances, including β-glucans, vitamin E, and avenanthramides, and is one of the most important cereal and feed crops with a high nutritional value [3,4].
The fungal pathogen Puccinia graminis f. sp. avenae (Pga) causes oat stem rust, which can lead to total crop failure during severe outbreaks. It is an economically important disease in the USA and the prairie provinces of Canada, with yield losses of up to 35% [5]. Many measures, including agronomic measures, host resistance, and chemical pesticides, have been taken to reduce the losses caused by stem rust, but these are not always feasible. Therefore, it is urgent to study the resistance mechanism of oat stem rust and cultivate resistant varieties.
Plants are attacked by a variety of pathogens as they grow. During the long-term interaction and coevolution, plants have gradually formed a series of complex immune mechanisms to resist the invasion of pathogens. Understanding plant responses to pathogen infection is crucial to elucidate the mechanisms of plant–microbial interactions and to develop new therapeutic strategies [6]. Unfortunately, the pathogenesis and molecular mechanisms of oat stem rust are still unknown. In recent years, the combined analyses of the transcriptome and the metabolome have revealed plants’ responses to biological stresses [7,8], including plant–pathogen interactions, and have helped us to identify plant resistance genes and varieties [7]. The current studies on Pga infection of oat mainly focus on the isolation and identification of pathogens and the mining of resistance genes [9,10]. However, there are few studies on the changes in the gene and metabolite content during the interaction between oat and Pga.
In previous research, we studied the antioxidant resistance system of oat leaves at interval times under Pga infection, and the results showed that the response of each index to Pga was the most intense after the third day of inoculation. In this study, transcriptome and metabolome analyses were combined to identify the differentially expressed genes and metabolites to better understand the interaction of oat–oat stem rust.

2. Materials and Methods

2.1. Experimental Material and Culture Conditions

Oat cultivar Bayou 1 (high susceptibility) was used for inoculation with Pga race TKR. Twenty oat seeds were grown in a 12 cm diameter pot (12 cm × 15 cm) with the peat soil matrix, and seedlings were cultured in a greenhouse (20 ± 2 °C with a photoperiod of 16 h light/8 h dark) at the Oat Research Center of Inner Mongolia Agricultural University.
When the seedlings had grown to the two–leaf stage (one leaf and one sprout), they were randomly and equally divided into two groups: (1) P (Pga inoculation); (2) CK (no Pga inoculation). The method of inoculation was carried out as described by Li et al. [11]. First, the leaves were sprayed with a 0.05% Tween–20 solution to form a water film. Then, a flat toothpick was used to pick the fresh urediniospores and inoculate the seedlings. Finally, the inoculated plants were kept in a mist chamber at 18 to 20 °C for 16 h in darkness. Plants were transferred to a 16/8 h (light/dark) photoperiod and a climatic chamber at 24 °C with 70% humidity.
On the third day after inoculation, fresh leaf tissues were cut and were frozen in liquid nitrogen and stored at −80 °C for physiological analysis, total RNA extraction, and metabolomic analysis. Six replicates were used for the metabolomic profiling experiment, whereas three replicates were used for the physiological and RNA–seq analysis.

2.2. Physiological Parameters

The activities of superoxide dismutase (SOD), peroxide (POD), catalase (CAT), and phenylalnine ammonialyase (PAL) were measured using Assay Kit YX–C–A500, YX–C–A502, YX–C–A501, and YX–C–A604, respectively (Sino Best Biological Technology Co., Ltd., Beijing, China). The contents of H2O2 and O2 were measured using Assay Kit YX–C–A407 and YX–C–A400, respectively (Sino Best Biological Technology Co., Ltd., Beijing, China).

2.3. Metabolite Extraction

Samples (80 mg) were carefully transferred to a 1.5 mL Eppendorf tube. Two small steel balls were added to the tube. An amount of 20 μL of L–2–chlorophenylalanine (0.3 mg·mL−1) dissolved in methanol acted as an internal standard, a 1 mL mixture of methanol and water (7/3, in volume) was added to each sample, and samples were placed at −20 °C for 2 min. Next, samples were ground at 60 Hz for 2 min, and the whole samples were extracted via ultrasonication in an ice-water bath for 30 min, then placed in a refrigerator at −20 °C for 20 min. Samples were centrifuged for 10 min at 4 °C (13,000 rpm), then 150 μL supernatant was collected from each tube using a crystal syringe, filtered through a 0.22 μm microfilter, and transferred to LC vials. The vials were kept at 80 °C until liquid chromatography–mass spectrometry (LC–MS) analysis. Quality control (QC) was prepared by mixing all samples into one mixed sample.
LC–MS analyses were performed using a UHPLC system (Vanquish, Thermo Fisher Scientific, Waltham, MA, USA) with a UPLC BEH Amide column (2.1 mm × 100 mm, 1.7 µm) coupled to a Q Exactive HFX mass spectrometer (Orbitrap MS, Thermo Fisher Scientific). The mobile phase consisted of 25 mmol/L ammonium acetate and 25 ammonia hydroxide in water (pH = 9.75) (A) and acetonitrile (B). The analysis was carried out via gradient elution as follows: 0–0.5 min, 95% B; 0.5–7.0 min, 95–65% B; 7.0–8.0 min, 65–40% B; 8.0–9.0 min, 40% B; 9.0–9.1 min, 40–95% B; 9.1–12.0 min, 95% B. The column temperature was 30 °C. The auto-sampler temperature was 4 °C, and the injection volume was 2 µL. The QE HFX mass spectrometer was used for its ability to acquire MS spectra in the information-dependent acquisition mode within the control of the acquisition software (Xcalibur, Thermo Fisher Scientific). In this mode, the acquisition software continuously evaluates the full scan MS spectrum. The electrospray ionization (ESI) source conditions were set as follows: sheath gas flow rate 50 Arb, Aux gas flow rate 10 Arb, capillary temperature 320 °C, full MS resolution 60,000, MS/MS resolution 7500, collision energy 10/30/60 in NCE mode, and spray voltage 3.5 kV (positive) or −3.2 kV (negative).

2.4. Data Preprocessing and Statistical Analysis

The raw LC–MS data were processed with Progenesis QI V2.3 software (Nonlinear, Kinetics, Newcastle, UK) for baseline filtering, peak identification, integral, retention time correction, peak alignment, and normalization.
In order to observe the overall distribution among samples and the stability of the entire analysis process, a matrix was introduced in R and principal component analysis (PCA) was performed. Differentially accumulated metabolites (DAMs) between groups were discriminated by orthogonal partial least squares-discriminant analysis (OPLS–DA) and partial least squares–discriminant analysis (PLS–DA). To prevent overfitting, the quality of the model was evaluated using 7–fold cross–validation and 200 Response Permutation Testing (RPT).
Variable importance of projection (VIP) values were used to rank the overall contribution of each variable to the OPLS–DA model. The two-tailed Student’s t–test was used to observe whether there were significant differences in metabolites between groups. DAMs were screened with VIP ≥ 1.0 and p–values ≤ 0.05. The metabolic pathway enrichment analysis of DAMs was performed using the KEGG database, and the threshold for significant enrichment was p ≤ 0.05.
We performed a one-way ANOVA analysis using the SPSS software (IBM SPSS Statistics Version 19.0, IBM, Beijing, China) to associations of different indices between the treatments. p ≤ 0.05 was considered significant.

2.5. RNA Extraction, cDNA Library Construction, and Transcriptome Sequencing

Total RNA was extracted using a mirVana™ miRNA ISOlation Kit according to the manufacturer’s instructions. Sequencing libraries were created using a TruSeq Stranded mRNA LTSample Prep Kit following the manufacturer’s instructions. Samples (1 μL) were used to check the size and purity of the library with an Agilent 2100 Bioanalyzer (Agilent, Santa Clara, CA, USA). The transcriptome sequencing was conducted by OE Biotech Co., Ltd. (Shanghai, China). Trimmomatic was used to process raw data [12]. The reads containing ploy-N and the low-quality reads were removed to obtain the clean reads. Clean reads were then mapped to the reference genome using hisat2 [13]. Reference gene source: Avena sativa (oats); reference genome source: https://wheat.pw.usda.gov/GG3/graingenes_downloads/oat-ot3098-pepsico (accessed on 1 July 2021). All raw sequencing data in the current study were deposited into the NCBI database under the accession number ‘PRJNA810908’ (https://www.ncbi.nlm.nih.gov/object/PRJNA810908, accessed on 1 October 2021).

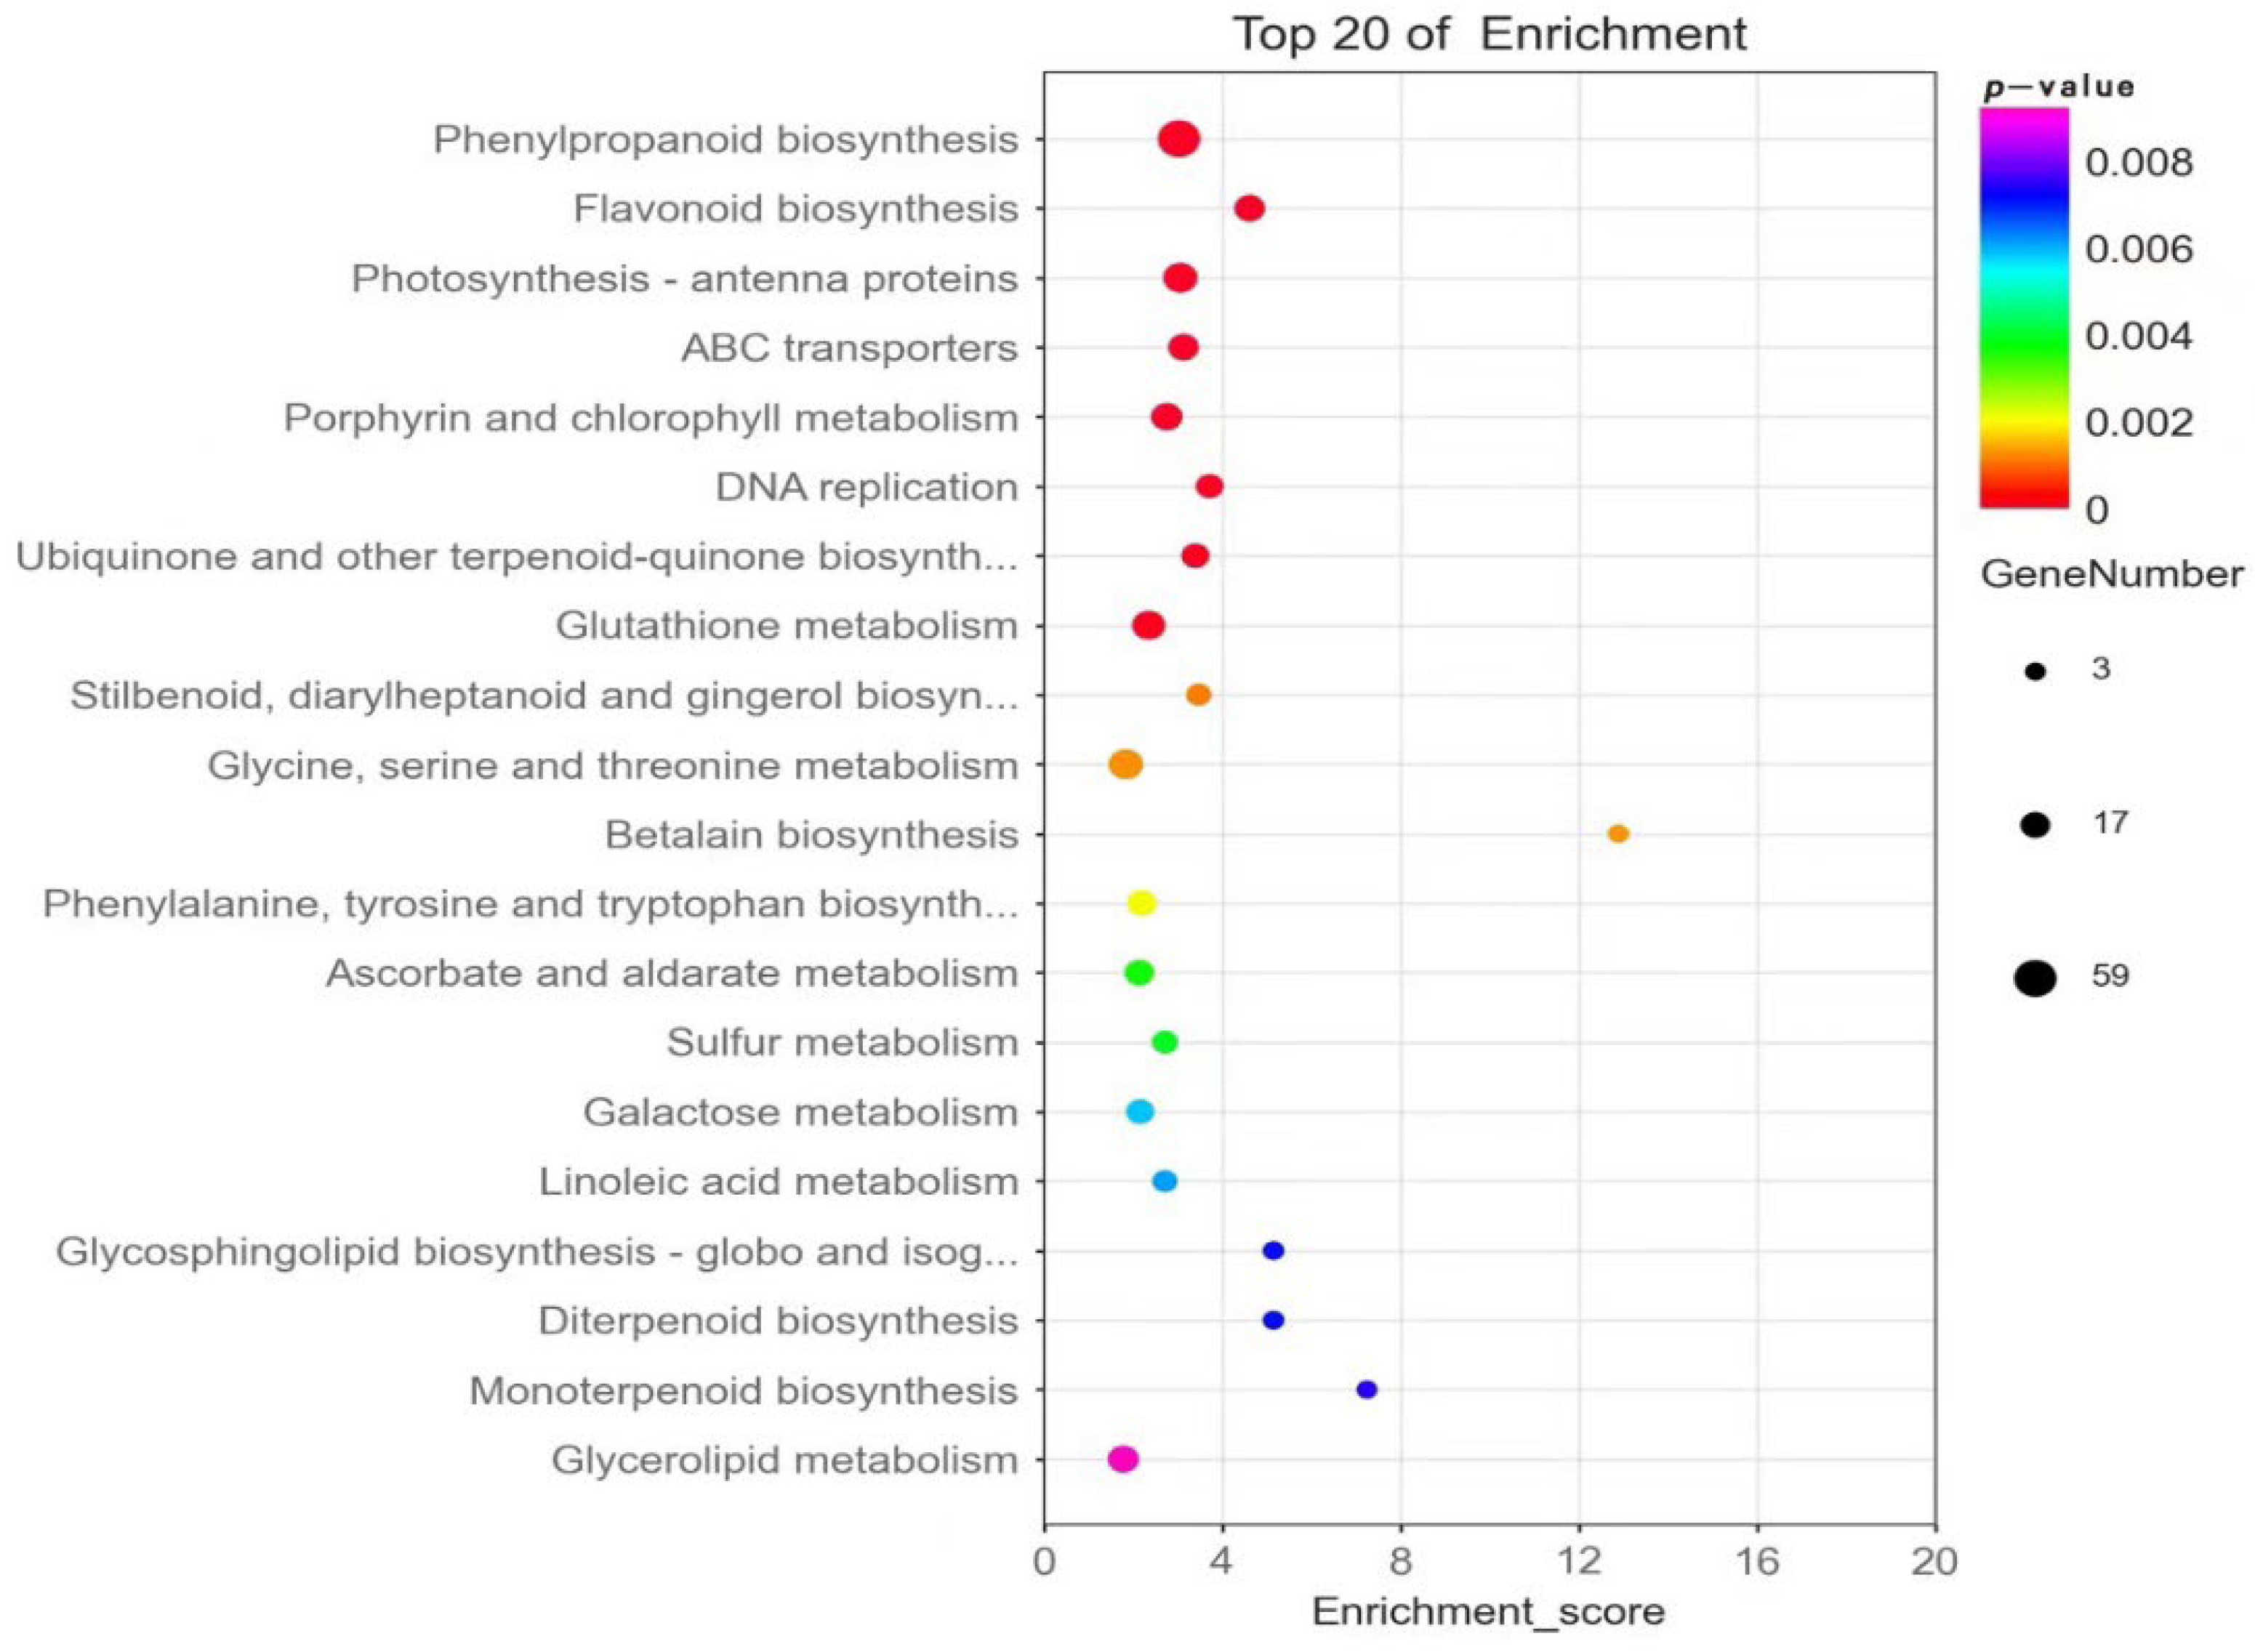
2.6. Gene Annotation, Differential Expression, and Enrichment Analyses

Gene function was annotated based on the following databases: Nr (http://www.ncbi.nlm.nih.gov/, accessed on 1 March 2022); COG (http://www.ncbi.nlm.nih.gov/COG/, accessed on 1 March 2022); Swiss–Prot (http://www.uniprot.org/, accessed on 1 March 2022); GO (http://www.geneontology.org/, accessed on 1 March 2022); KEGG (http://www.genome.jp/kegg/, accessed on 1 March 2022); and KOG (http://www.ncbi.nlm.nih.gov/KOG/, accessed on 1 March 2022).
The cufflinks were used to calculate the FPKM value of each gene, and the read counts of each gene were obtained via htseq–count. Differentially expressed genes (DEGs) were identified using the DESeq R package functions to estimate size factors and the nbinom test. A p–value ≤ 0.05 and |log2FC| ≥ 1 were the thresholds for significantly differential expression. Hierarchical cluster analysis of DEGs was performed to explore gene expression patterns. Based on the hypergeometric distribution, GO and KEGG pathway enrichment analyses of DEGs were performed using R (version 3.6.2).

2.7. Pearson Correlation Analysis and Co-Expression Analysis

The Pearson correlations between DEGs and DAMs were calculated using R’s cor function. Using a tool developed by OE Biotech Co., Ltd., DEGs and DAMs were simultaneously mapped to the KEGG pathway database to identify common pathways. Using the Cytoscape software, a co–expression network consisting of DEGs and DAMs was created.

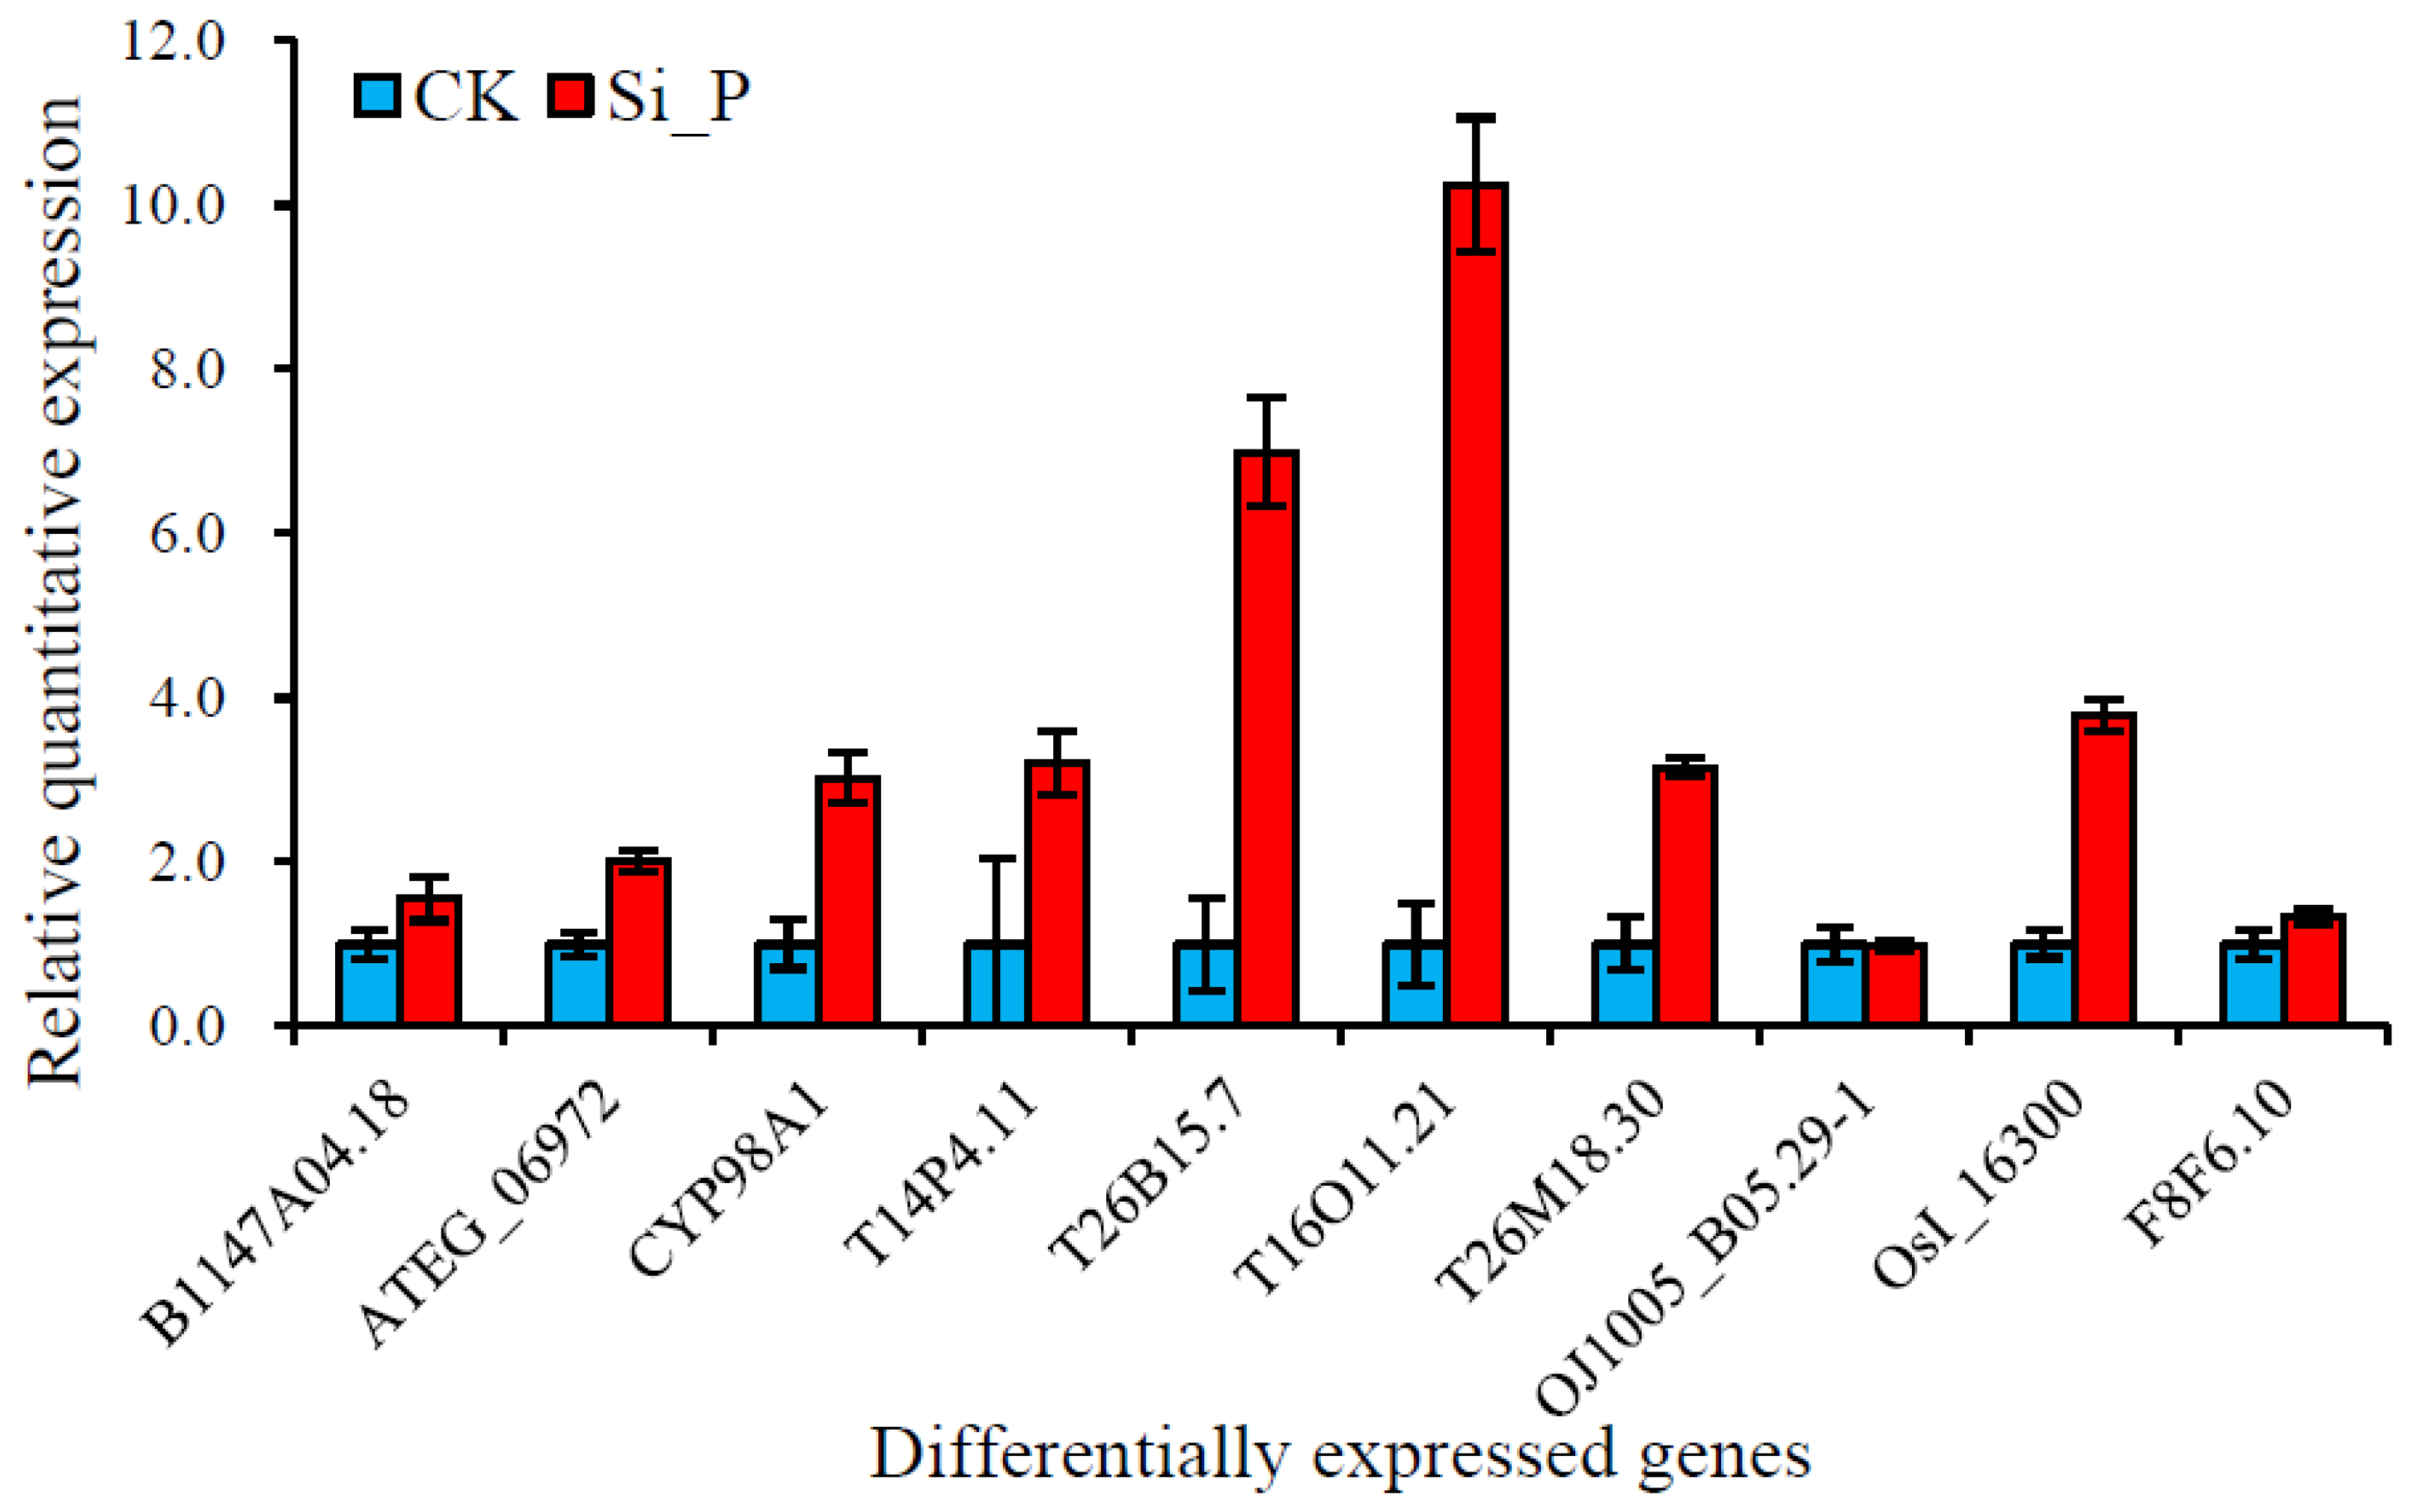
2.8. Real-Time Quantitative Reverse Transcription PCR Analysis

Ten genes were analyzed in this study, with actin serving as the reference gene. According to the manufacturer’s instructions, Ambion–1912 was used to extract total RNA from samples. In a 384–well optical plate (Roche, Basel, Switzerland), reactions were carried out at 94 °C for 30 s, followed by 45 cycles of 94 °C for 5 s and 60 °C for 30 s. For each sample, three reactions were carried out. TsingKe Biotech designed and synthesized the primers (Table S1). The mRNAs’ expression levels were normalized to the EF–1–alpha expression and calculated using the 2-ΔΔCt method.

3. Results

3.1. Phenotypes

Obviously, 3 days after inoculation, rust symptoms appeared as bands of pustules on inoculated leaves (Figure 1).

3.2. Physiological Changes

Under Pga infection conditions, the contents of H2O2 (Figure 2A) and O2 (Figure 2B) were increased by 333.04% and 235.67%, respectively; the activities of CAT (Figure 2C), SOD (Figure 2D), POD (Figure 2E), and PAL (Figure 2F) were increased by 104.89%, 50.73%, 11.40%, and 40.00%, respectively.

3.3. Metabolite Profile

A series of pairwise OPLS–DA were used to maximize the discrimination between experimental samples and to focus on metabolic changes, which contributed significantly to the final classifications. The OPLS–DA differences between the control and infected groups demonstrated that these samples had significant biochemical perturbation, indicating that the results are reliable (Figure 3A). Thus, a subsequent analysis was performed. Table S2 lists all significantly differentially expressed metabolites (p ≤ 0.05) with the variable significance in the projection (VIP ≥ 1.0) between the P and CK groups. There were 162 metabolites that had differential expressions, with 96 being upregulated and 66 being downregulated (Figure 3B).
The KEGG database was used to functionally annotate differentially accumulated metabolites (Table S3). The most enriched pathways were observed to include glutathione metabolism, cyanoamino acid metabolism, purine metabolism, aminoacyl–tRNA biosynthesis, valine, leucine and isoleucine biosynthesis, tropane, piperidine and pyridine alkaloid biosynthesis (Figure 4).

3.4. RNA Sequencing and Identification of Differentially Expressed Genes

The contigs were employed in transcriptome assembly, and the FPKM data summary is shown in Figure 5B. On the basis of this information, we could infer that the biological replicates were highly reliable. Heat map analysis showed that all of the significantly differentially expressed genes (p ≤ 0.05 and |log2FC| ≥ 1) between the P and CK groups are listed in Table S4 and Figure 5A. A total of 3769 DEGs (1814 upregulated and 1955 downregulated) were identified between the P and CK groups (Figure 5C). Finally, ten genes between the P and CK groups were randomly selected for quantitative RT–PCR analysis. This was performed to validate the gene expression profiles of the RNA–seq data. The results showed that the qRT-PCR data were in agreement with the RNA–seq profiles (Figure 6).
To classify the functions of the DEGs between the P and CK groups, a GO analysis was performed. The DEGs were significantly enriched in terms of response to reactive oxygen species and protein complex oligomerization within the biological process categories. The chloroplast thylakoid membrane, extracellular region, and thylakoid were significantly enriched within the cellular component category. The DEGs reveal significant enrichments in peroxidase activity within the molecular function category, and most of the differentially expressed DEGs were enriched in the cellular component category (Figure 7 and Table S5).
The KEGG enrichment results were analyzed with a scatter plot using KEGG function annotations. Phenylpropanoid biosynthesis, flavonoid biosynthesis, and photosynthetic antenna proteins were the top three significantly enriched KEGG pathways between the P and CK groups (Figure 8 and Table S6).

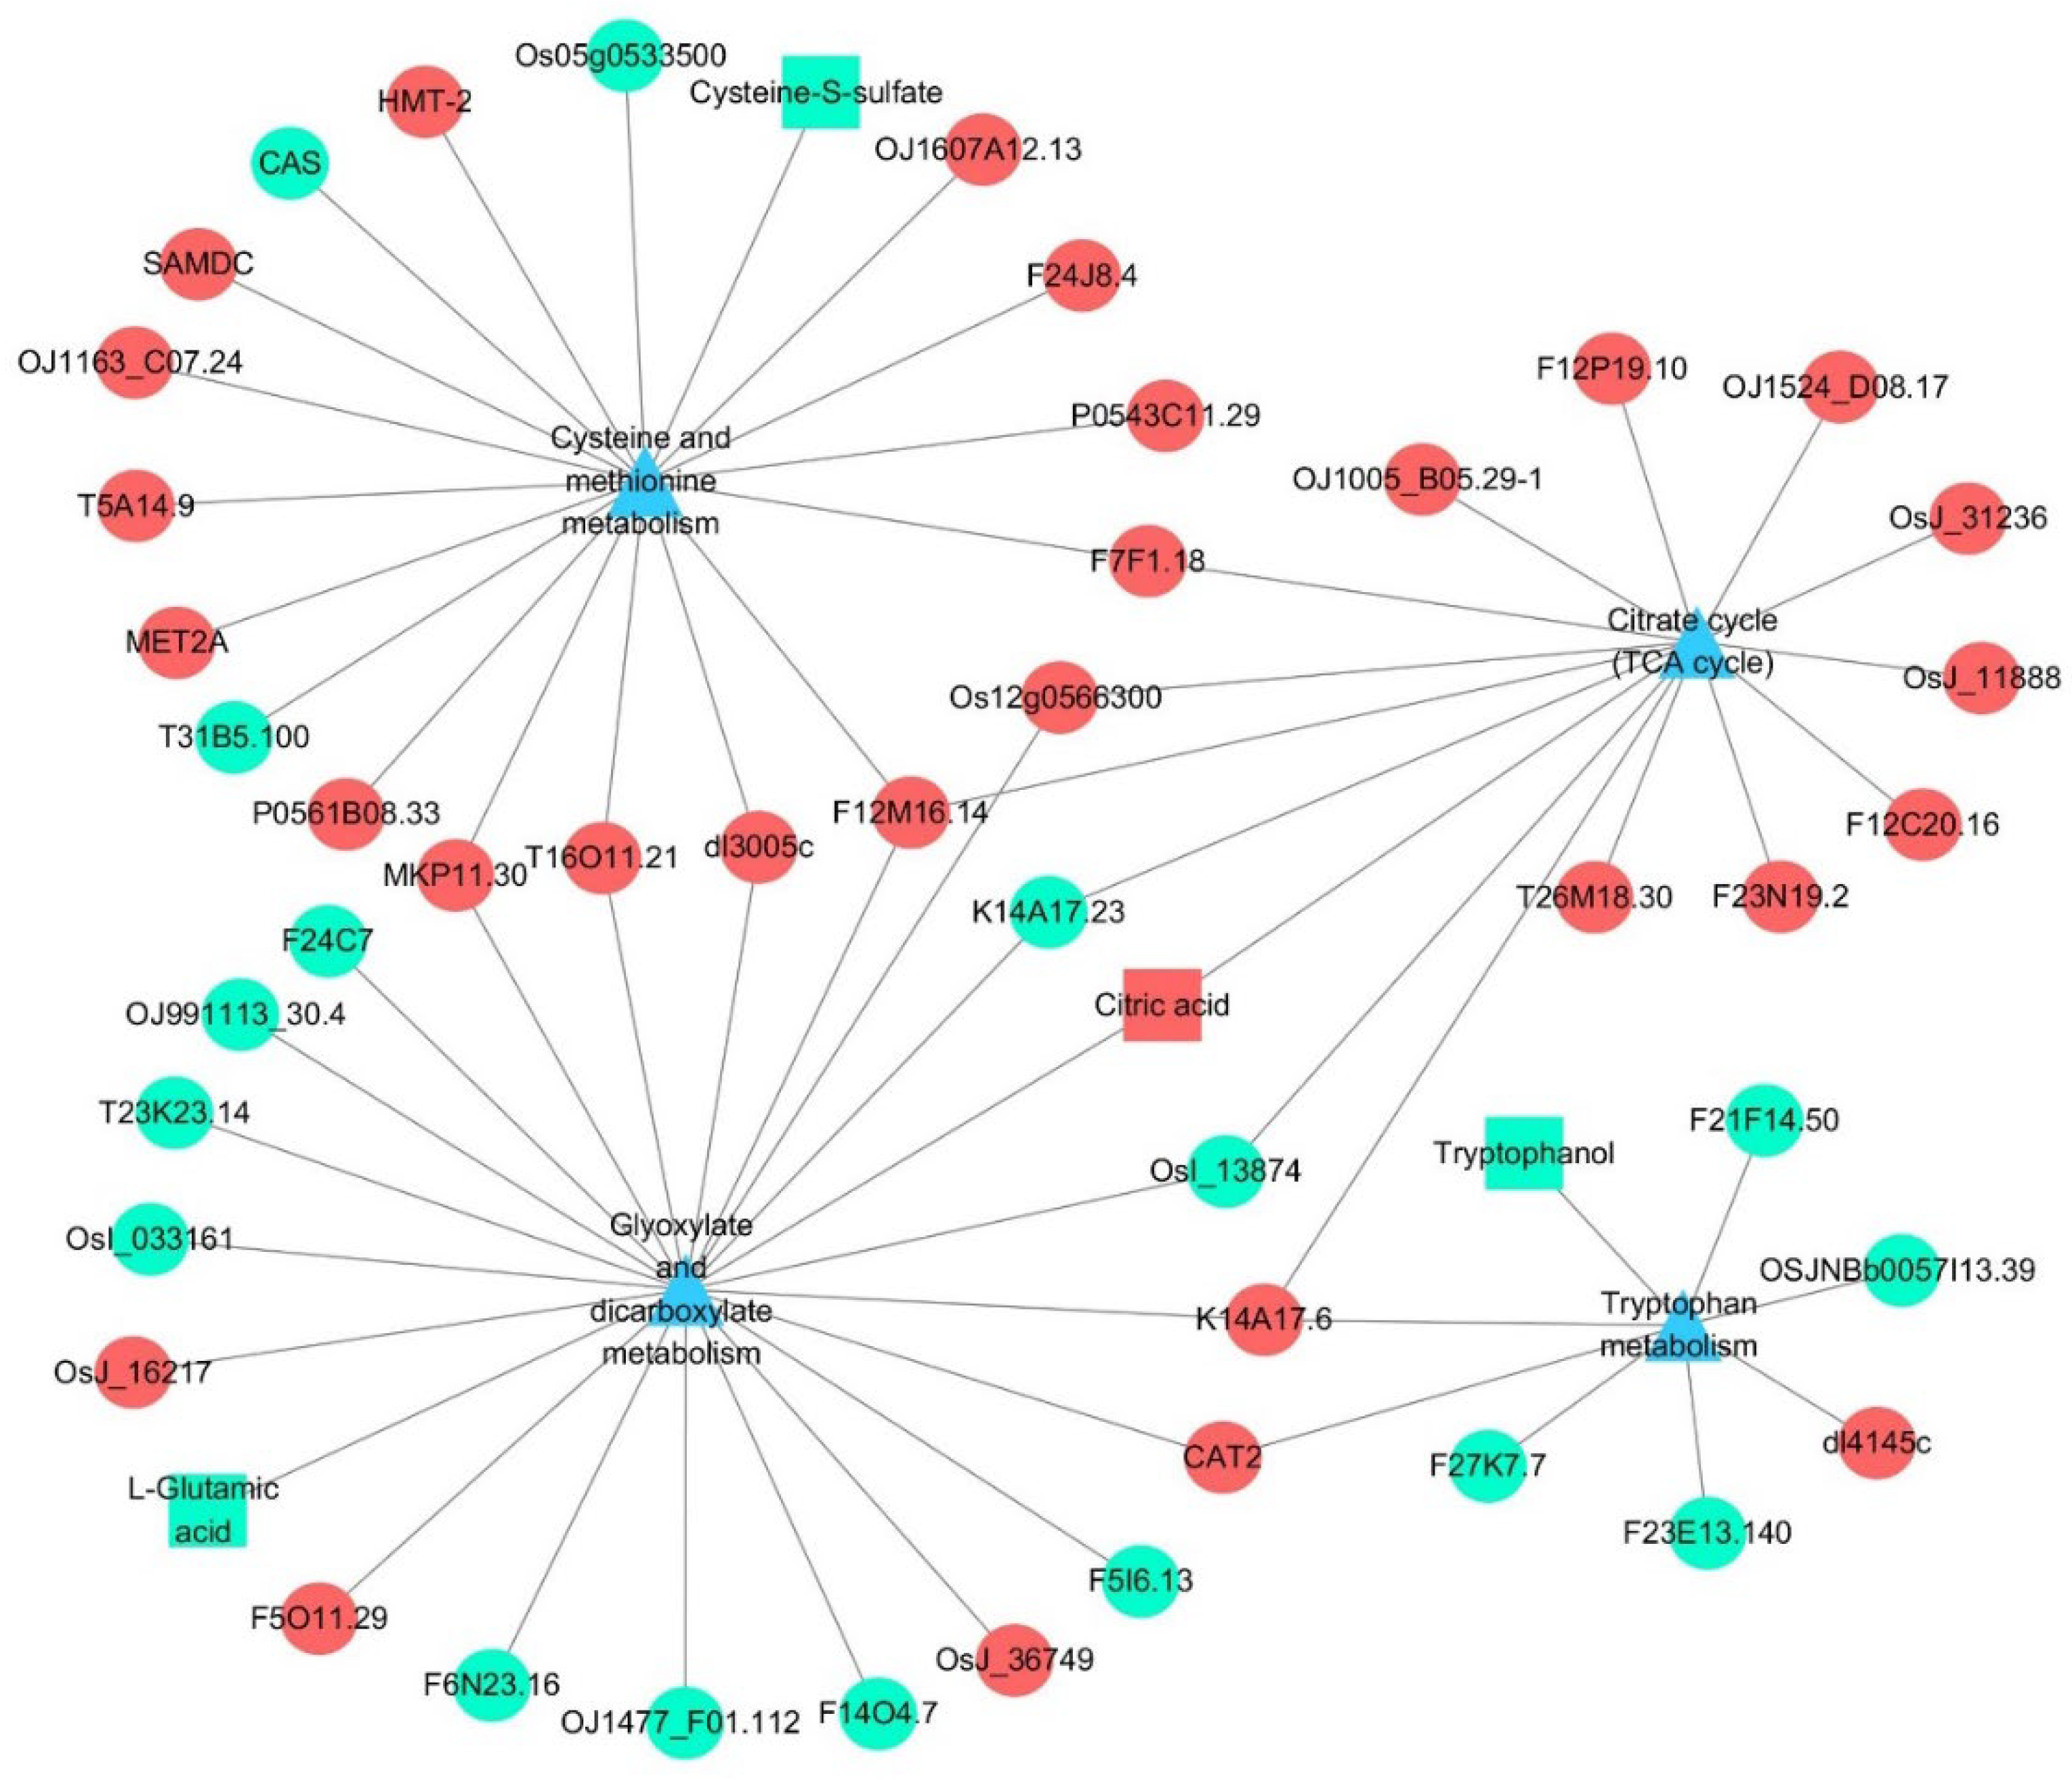
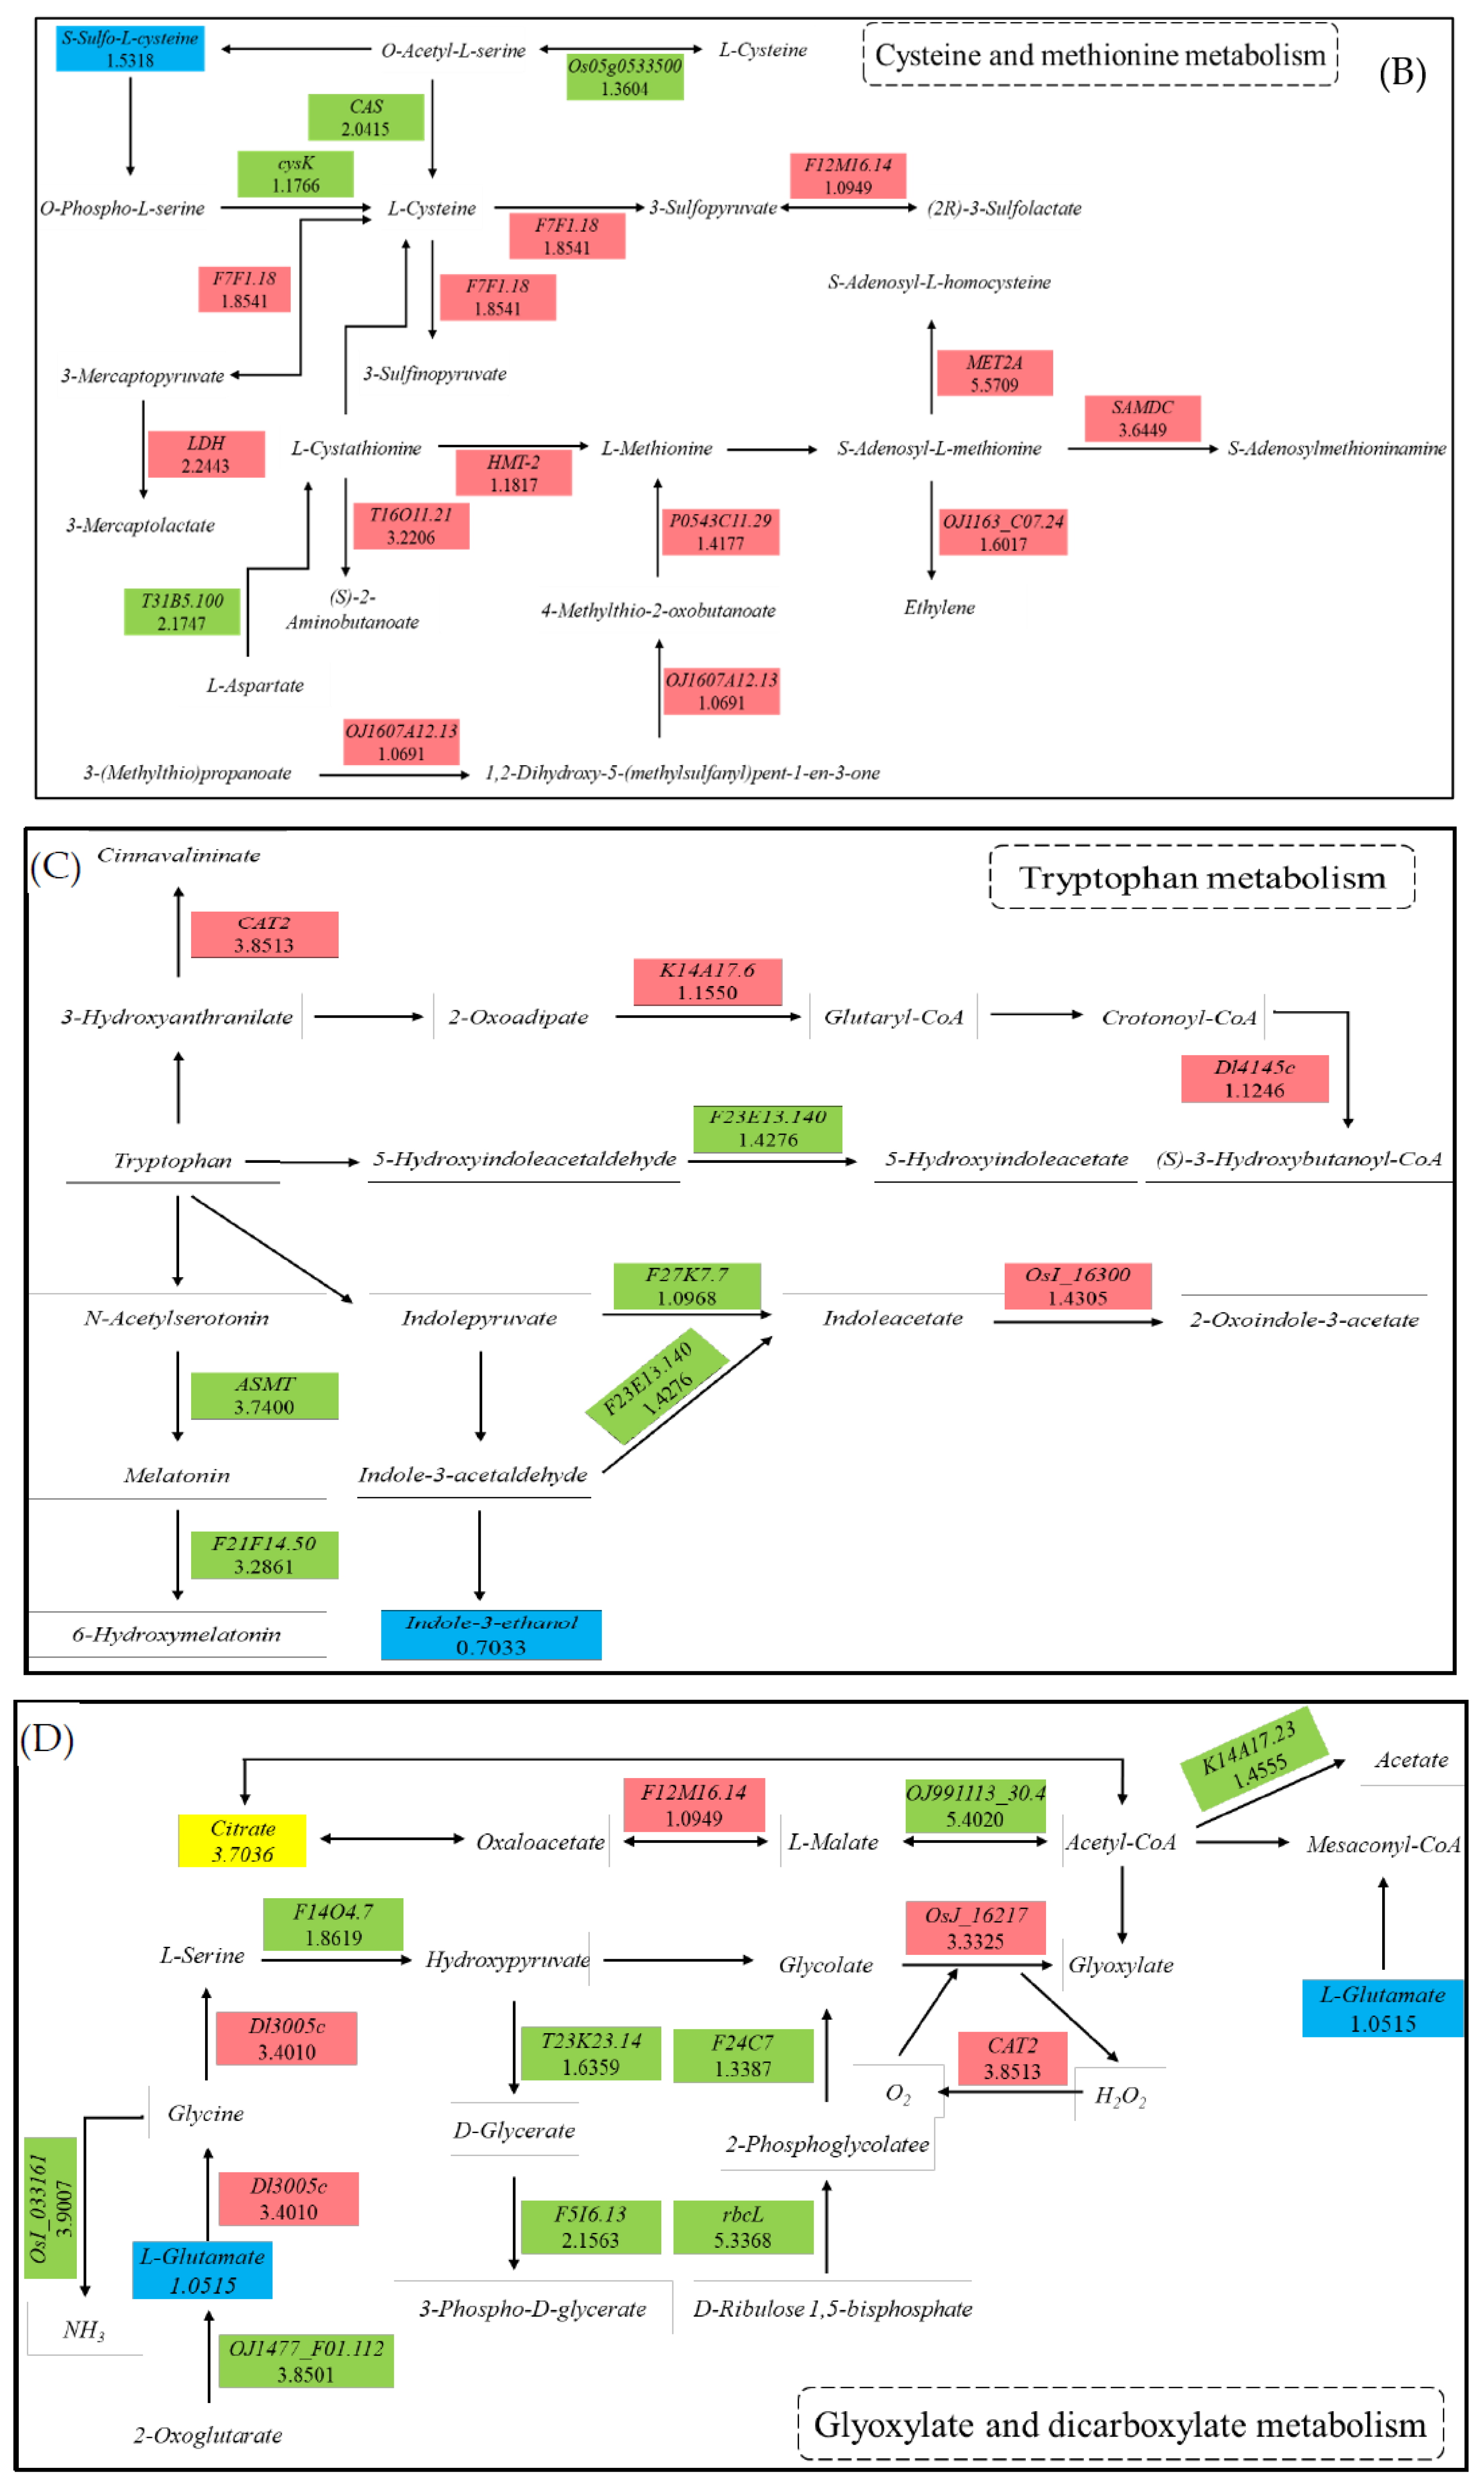
3.5. Integrated Analysis of the Transcriptome and Metabolome

Transcriptomic and metabolomic analyses were performed to elucidate the composition of the regulatory network in oat leaves under Pga infection. To better understand the relationship between genes and metabolites, the DEGs and DAMs were simultaneously mapped to the KEGG pathway diagram. According to the KEGG pathway enrichment analysis, the ‘amino acid metabolic’ and ‘organic acid metabolic’ pathways were the most significantly enriched. Therefore, the analysis focused on the metabolic pathways related to amino acids and organic acids (Table S7). In the ‘citrate cycle’, ‘cysteine and methionine metabolism’, ‘tryptophan metabolism’, and ‘glyoxylate and dicarboxylate metabolism’, a total of 46 DEGs (29 upregulated and 17 downregulated) and 4 DAMs (1 upregulated and 3 downregulated) were simultaneously mapped (Figure 9 and Figure 10).

4. Discussion

Oat stem rust was an epidemic and a devastating disease. In oat–Pga interaction, the genes and metabolic pathways linked to defense responses were rarely described. This study combined metabolomics and transcriptomics to investigate the resistance response of oat to Pga, which laid a foundation for the identification of candidate genes and metabolites involved in oat disease resistance pathways. We can learn more about oat defensive responses by using the causal relationships that we found between genes and metabolites. Many studies have established that comprehensive multiomics data analysis can generate functional insights into different biological processes [14].
A total of 3769 DEGs (1814 upregulated and 1955 downregulated) in oat leaves were detected under Pga infection. KEGG enrichment analysis revealed that ‘phenylpropanoid biosynthesis’, ‘flavonoid biosynthesis’, and ‘photosynthesis-antenna proteins’ were significantly enriched. Phenylpropanoids are crucial in plant responses to biotic and abiotic stress [15,16]. The ‘phenylpropanoid biosynthesis’ pathway begins with phenylalanine and can be converted into aromatic compounds, including flavonoids, coumarins, benzenes, hydroxycinnamates, and lignin, which are commonly involved in plant growth and disease resistance responses [17]. After pathogens damage the cell wall, the ‘phenylpropanoid biosynthesis’ pathway which provides the lignin–building monolignols is dramatically activated [18]. PAL participates in the plant defense process, and the gene encoding PAL was upregulated in response to different infections [19,20]. Here, we found that most of the genes involved in the phenylpropanoid biosynthesis pathway were upregulated in the defense against the Pga infection (Figure 11A), and the PAL activity in oat leaves was significantly increased (Figure 2F). This may be a part of a stem rust immune response mechanism in oat.
It has been extensively established that phenylpropanoid metabolism has protective properties against environmental stressors, and flavonoid biosynthesis is a significant downstream branch of this metabolism [21]. For instance, research on alfalfa has also shown that the fungal disease Fusarium oxysporum f. sp. Medicaginis was able to promote the expression of genes involved in the flavonoid biosynthesis pathway [22]. Our study found that some of the genes involved in the flavonoid biosynthesis pathway were differentially expressed, showing 15 upregulated and 14 downregulated DEGs (Figure 11B). Additionally, KEGG analysis demonstrated that Pga infection significantly enhanced flavonoid metabolism, including the three pathways of ‘flavonoid biosynthesis’, ‘flavone and flavonol biosynthesis’, and ‘isoflavonoid biosynthesis’. In conclusion, it can be hypothesized that the flavonoids’ metabolism may favorably influence the resistance of oat to stem rust. We will have a better knowledge of the oat–Pga interaction and be able to improve resistance breeding by identifying the processes and compounds associated with defense responses.
It has been reported that the ‘photosynthesis-antenna proteins’ pathway can regulate plant defense responses induced by pathogen infection [23]. In our study, six genes of the light-harvesting chlorophyll protein complex (LHC) involved in the ‘photosynthesis-antenna proteins’ pathway were downregulated (Figure 11C). Plants’ thylakoid membrane contains a variety of proteins and chlorophyll molecules called the LHC, which absorb light and transmit it to the photosynthetic reaction center (RC) [24]. The decreased accumulation of the LHC may result in a decline in the light absorption rate. Thus, systemic acquired resistance (SAR) will be created when oats are exposed to insufficient or no light after Pga infection.
In the process of pathogen infection and transmission, plants will mobilize a large number of defense factors, especially metabolites such as phytoalexins, reactive oxygen species, etc. [25]. A significant amount of energy is first needed in the plant for these processes. Consequently, when pathogenic bacteria infiltrate, plants’ energy metabolism will greatly increase [26]. Through LC–MS analysis, we discovered that a total of 162 metabolites were differentially expressed under Pga infection. Flavonoids and derivatives were the most common, followed by amino acids and carbohydrates.
As secondary metabolites produced by plants, flavonoids are widely distributed and have a variety of potential biological advantages, such as anticancer, anti-inflammatory, antioxidant, antifungal, antibacterial, and antiviral activity [27]. In the present study, flavonoids in oat leaves that responded to Pga infection were divided into three subgroups, which contained isoflavonoids, flavonoid glycosides, and 2–arylbenzofuran flavonoids, indicating that flavonoids might be positively related to the resistance of oat stem rust. The amino acid metabolism and redistribution are closely related to the activation of defensive secondary metabolism [28]. Rapid loss of plant amino acids was observed, most likely due to fungal assimilation [29]. In our study, the glutamate level in oat leaves was significantly decreased under Pga infection. During the course of Pga infection, glutamate storage in the non–infected region was affected from a distance. Glutamate depletion was related to an enhanced glutamate dehydrogenase (GDH) transcription level in the pathogen-infected region [30]. Our result suggested that glutamate could be transported to the invaded area to provide nitrogen. This strategy could delay cell death and thus interfere with fungal progress in plant tissue. Therefore, glutamate may play a crucial role in Pga-induced oat defense.
Gene–metabolite correlation networks can elucidate the functional relationships between genes and metabolites [31]. We found that DEGs and DAMs related to amino acid and organic acid metabolic pathways, such as the citrate cycle, cysteine and methionine metabolism, tryptophan metabolism, and glyoxylate and dicarboxylate metabolism, were significantly enriched in oat under Pga infection.
The citrate cycle (TCA) plays a key role in the production of ATP and the synthesis of the biomolecules required for viral replication [32]. For example, lipids are required for the eventual assembly and budding of enveloped viruses, while the TCA cycle provides the precursors for fatty acid synthesis [33]. In this study, the ‘citrate cycle’ pathway genes such as Os12g0566300 were found to be upregulated in the inoculated oat. In addition, we discovered that citrate was significantly accumulated, which may promote further propagation of Pga in oat leaves (Figure 10A). Tryptophan is an amino acid essential for the production of proteins and other compounds such as serotonin, vitamin nicotinic acid, and neurohormones in animals. In plants, it is a synthetic precursor of auxin, which protects plants from attack by bacteria, herbivores, and fungi [34,35]. In the model plant Arabidopsis thaliana, secondary metabolites derived from tryptophan (Trp) are one of the key components of the innate immune system [36]. In this study, we found four upregulated genes (CAT2, K14A17.6, Dl4145c, and OsI_16300) and four downregulated genes (F23E13.140, F27K7.7, ASMT, and F21F14.50) through co-expression analysis of Pga response in the ‘tryptophan metabolism’ pathway, as well as a decreased intermediate: Indole-3-ethanol (Figure 10C).

5. Conclusions

In conclusion, integrated analysis of transcriptomics and metabolomics showed that Pga inoculation altered various metabolic pathways, such as the ‘citrate cycle’, ‘cysteine and methionine metabolism’, ‘tryptophan metabolism’, ‘glyoxylate and dicarboxylate metabolism’, and ‘phenylpropanoid metabolism’. In addition, Pga inoculation significantly upregulated the expression of several flavonoid-related genes and metabolites. This study provides new insights into the interaction between oat and Pga and contributes to the design of control strategies for stem rust in oat. It is suggested to apply fertilizers with organic acids or flavonoids as the main components to control oat stem rust.

Supplementary Materials

The following supporting information can be downloaded at: https://www.mdpi.com/article/10.3390/agronomy12102353/s1, Table S1: Primers used in the study; Table S2: The significantly differentially expressed metabolites; Table S3: The KEGG database was used to functionally annotate differentially accumulated metabolites; Table S4: Heat map analysis showed that all of DEGs; Table S5: GO functional enrichment analysis of DEGs; Table S6: KEGG pathway enrichment analysis of DEGs; Table S7: The DEGs and DAMs were simultaneously mapped to the KEGG pathway diagram.

Author Contributions

Conceptualization: Y.L., P.L., J.M., B.Z. and J.L.; methodology: Y.L., P.L., J.M., B.Z. and J.L.; investigation: Y.L., P.L., J.M., B.Z. and J.L.; data curation: Y.L.; writing—original draft preparation: Y.L.; writing—review and editing: P.L., J.M. and B.Z.; supervision: J.L.; project administration: J.L.; funding acquisition: J.L. All authors have read and agreed to the published version of the manuscript.

Funding

This research was funded by the National Key R&D Program of China (2018YFE0107900) and the National Modern Agricultural Industry Technology System (CARS-07).

Institutional Review Board Statement

Not applicable.

Informed Consent Statement

Not applicable.

Data Availability Statement

Not applicable.

Acknowledgments

We thank all members of the National Outstanding Talents in Agricultural Research and Their Innovative Teams for their assistance during the laboratory work and data analysis. Transcriptome sequencing and metabolomic mass spectrometry was performed by the Shanghai OE Biotech Co., Ltd. (Shanghai, China) and the Shanghai Luming biological technology co., LTD (Shanghai, China).

Conflicts of Interest

The authors declare no conflict of interest.

References

  1. Bekele, W.A.; Wight, C.P.; Chao, S.; Howarth, C.J.; Tinker, N.A. Haplotype-based genotyping-by-sequencing in oat genome research. Plant Biotechnol. J. 2018, 16, 1452–1463. [Google Scholar] [CrossRef]
  2. Han, L.; Eneji, A.E.; Steinberger, Y.; Wang, W.; Yu, S.; Liu, H.; Liu, J. Comparative biomass production of six oat varieties in a saline soil ecology. Commun. Soil Sci. Plant Anal. 2014, 45, 2552–2564. [Google Scholar] [CrossRef]
  3. Gorash, A.; Armoniene, R.; Fetch, J.M.; Liatukas, Ž.; Danytė, V. Aspects in oat breeding: Nutrition quality, nakedness and disease resistance, challenges and perspectives. Ann. Appl. Biol. 2017, 171, 281–302. [Google Scholar] [CrossRef]
  4. Marshall, A.; Cowan, S.; Edwards, S.; Griffiths, I.; Howarth, C.; Langdon, T.; White, E. Crops that feed the world 9. Oats-a cereal crop for human and livestock feed with industrial applications. Food Secur. 2013, 5, 13–33. [Google Scholar] [CrossRef]
  5. Fetch, T.G., Jr. Physiologic specialization of Puccinia graminis on wheat, barley, and oat in Canada in 2000. Can. J. Plant Pathol. 2003, 25, 174–181. [Google Scholar] [CrossRef]
  6. Martinelli, F.; Uratsu, S.L.; Albrecht, U.; Reagan, R.L.; Phu, M.L.; Britton, M.; Buffalo, V.; Fass, J.; Leicht, E.; Zhao, W. Transcriptome Profiling of Citrus Fruit Response to Huanglongbing Disease. PLoS ONE 2012, 7, e38039. [Google Scholar] [CrossRef]
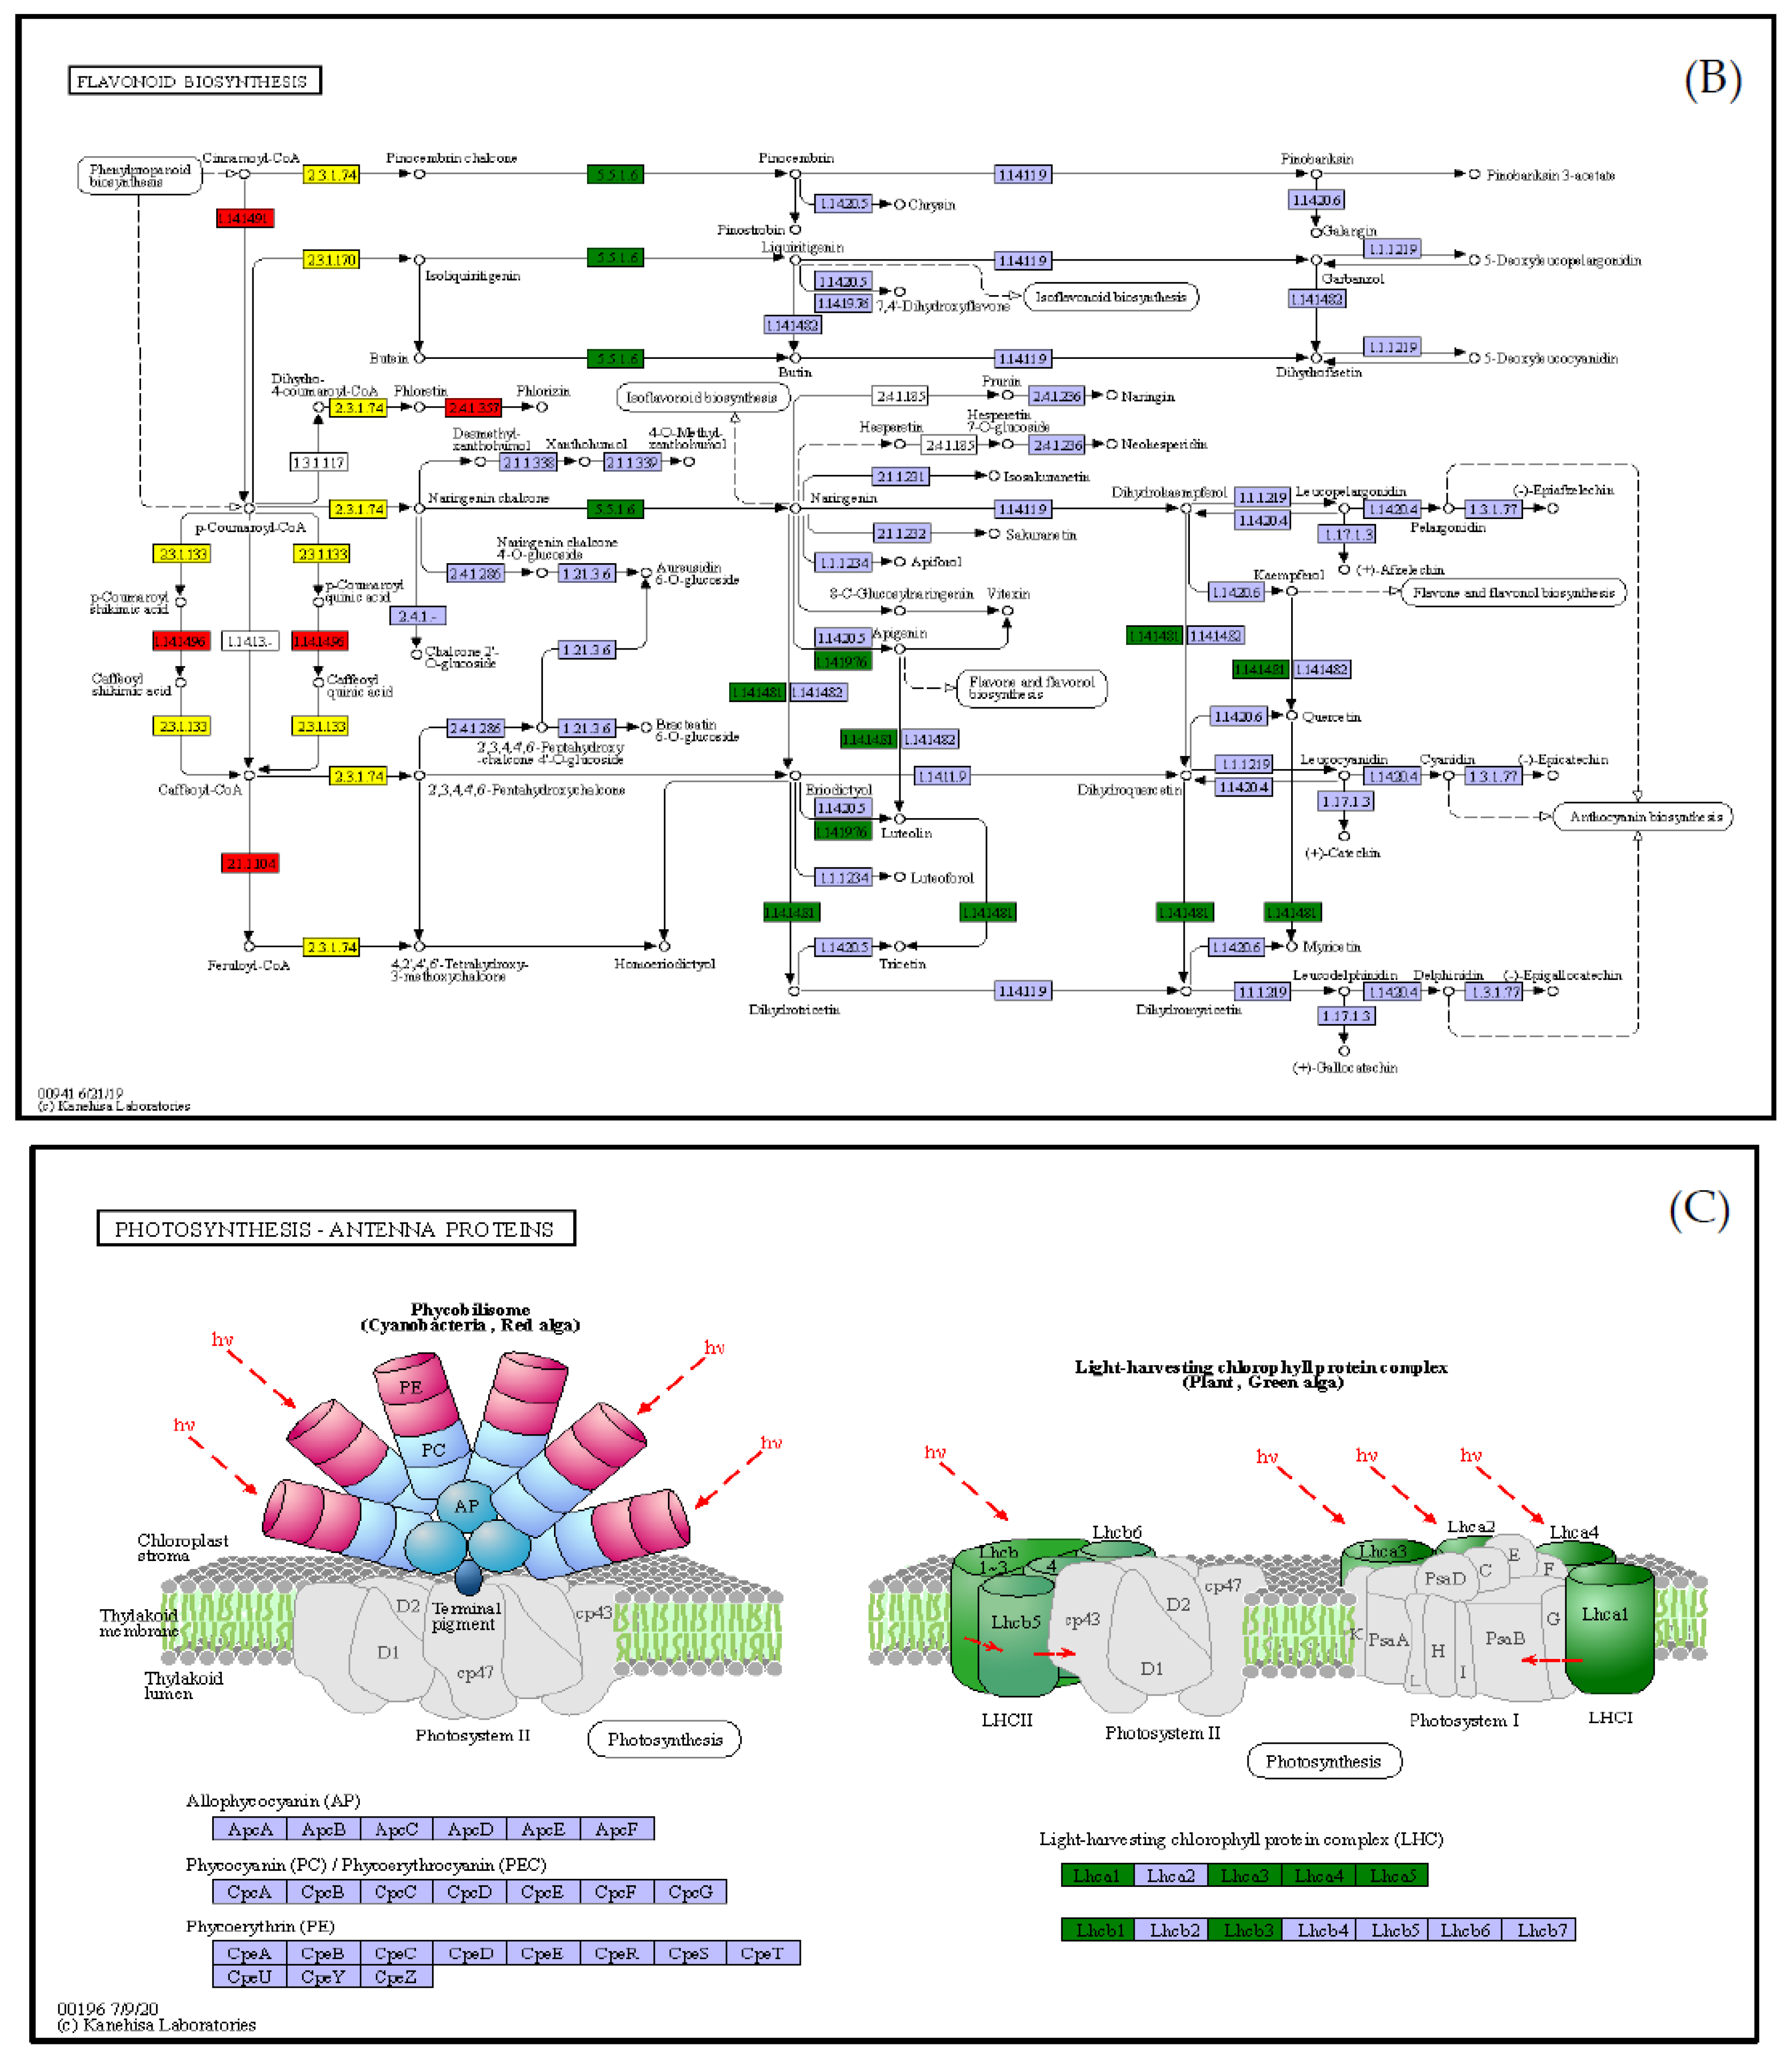
  7. Li, P.; Ruan, Z.; Fei, Z.; Yan, J.; Tnag, G. Integrated Transcriptome and Metabolome Analysis Revealed That Flavonoid Biosynthesis May Dominate the Resistance of Zanthoxylum bungeanum against Stem Canker. J. Agric. Food Chem. 2021, 69, 6360–6378. [Google Scholar] [CrossRef]
  8. Kushalappa, A.C.; Yogendra, K.N.; Karre, S. Plant innate immune response: Qualitative and quantitative resistance. Crit. Rev. Plant Sci. 2016, 35, 38–55. [Google Scholar] [CrossRef]
  9. Gnanesh, B.N.; Fetch, J.M.; Zegeye, T.; McCartney, C.A.; Fetch, T. Oat. In Alien Gene Transfer in Crop Plants; Pratap, A., Kumar, J., Eds.; Springer: New York, NY, USA, 2014; Volume 2, pp. 51–73. [Google Scholar]
  10. Gnocato, F.S.; Dracatos, P.M.; Karaoglu, H.; Zhang, P.; Berlin, A.; Park, R.F. Development, characterization and application of genomic SSR markers for the oat stem rust pathogen Puccinia graminis f. sp. avenae. Plant Pathol. 2018, 67, 457–466. [Google Scholar] [CrossRef]
  11. Li, T.Y.; Wu, L.X.; Wang, H.; Chen, S.; Cao, Y.Y. The race and virulence patterns of Puccinia graminis f. sp. avenae in China. Acta Triticeae Sin. 2014, 34, 552–556. [Google Scholar]
  12. Bolger, A.M.; Lohse, M.; Usadel, B. Trimmomatic: A flexible trimmer for Illumina sequence data. Bioinformatics 2014, 30, 2114–2120. [Google Scholar] [CrossRef] [Green Version]
  13. Kim, D.; Langmead, B.; Salzberg, S.L. HISAT: A fast spliced aligner with low memory requirements. Nat. Methods 2015, 12, 357–360. [Google Scholar] [CrossRef]
  14. Sade, D.; Shriki, O.; Cuadros-Inostroza, A.; Tohge, T.; Semel, Y.; Haviv, Y.; Willmitzer, L.; Fernie, A.R.; Czosnek, H.; Brotman, Y. Comparative metabolomics and transcriptomics of plant response to Tomato yellow leaf curl virus infection in resistant and susceptible tomato cultivars. Metabolomics 2015, 11, 81–97. [Google Scholar] [CrossRef]
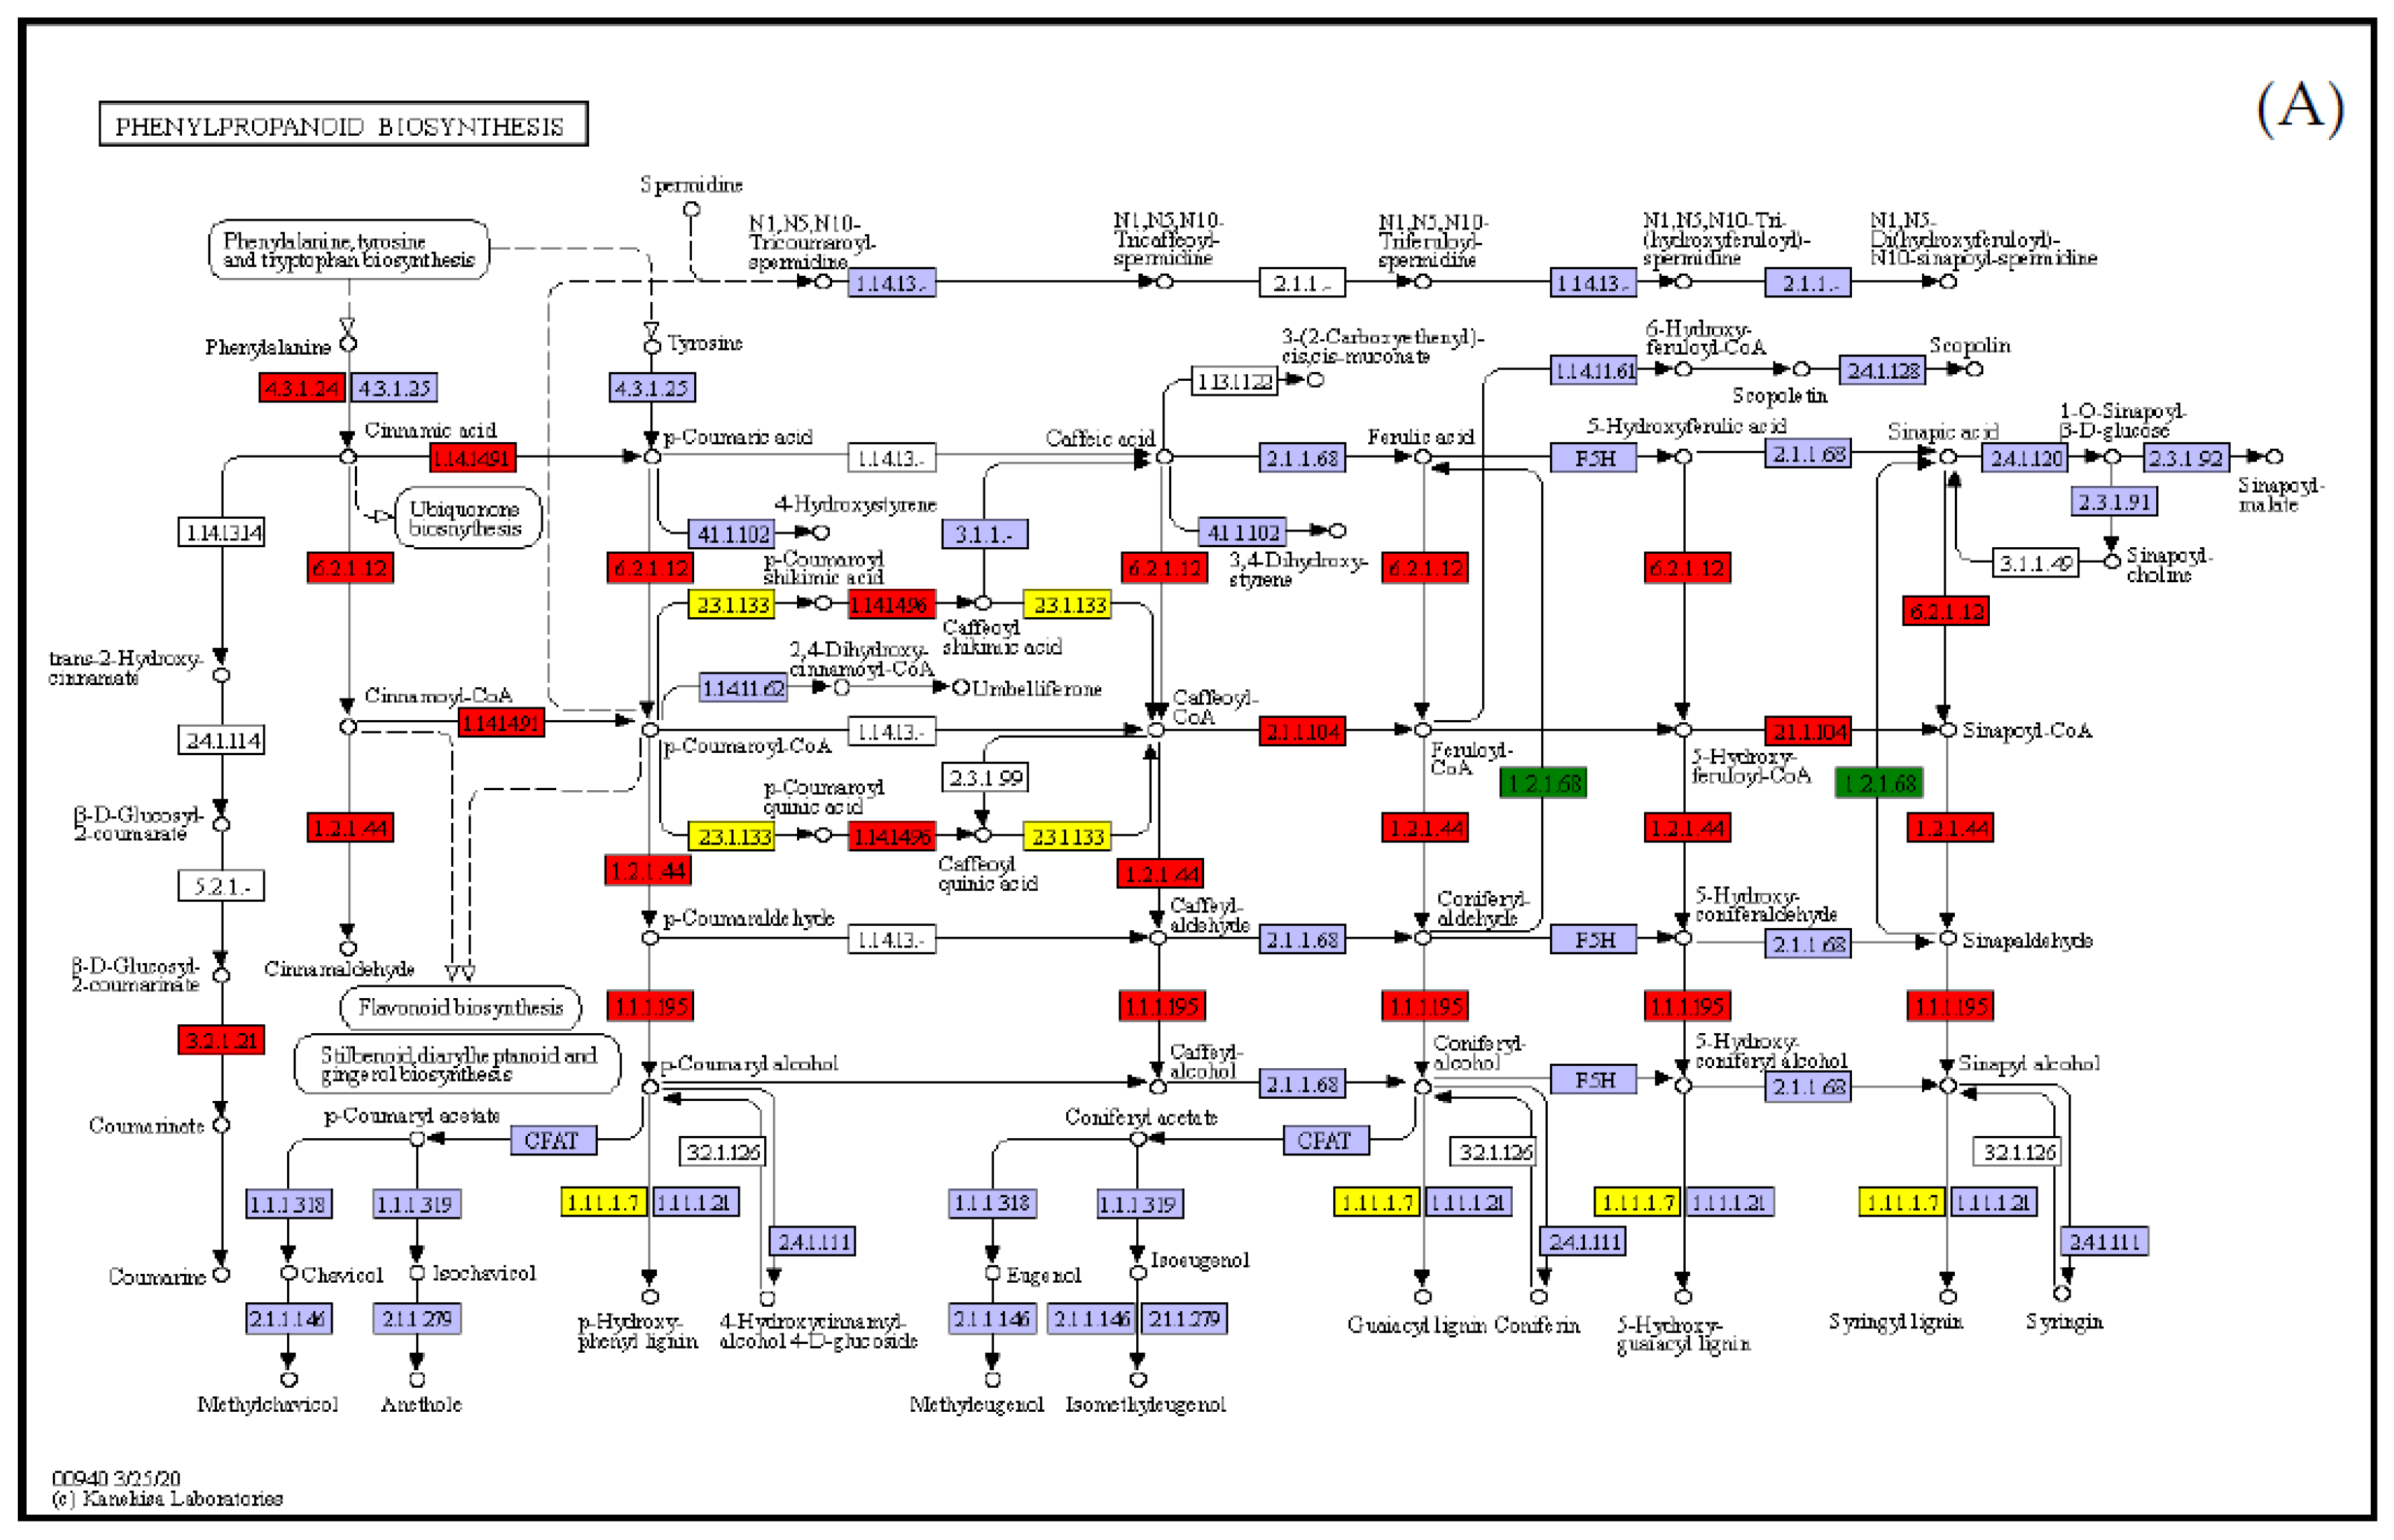
  15. Vogt, T. Phenylpropanoid biosynthesis. Mol. Plant 2015, 3, 2–20. [Google Scholar] [CrossRef]
  16. La Camera, S.; Gouzerh, G.; Dhondt, S.; Hoffmann, L.; Fritig, B.; Legrand, M.; Heitz, T. Metabolic reprogramming in plant innate immunity: The contributions of phenylpropanoid and oxylipin pathways. Immunol. Rev. 2004, 198, 267–284. [Google Scholar] [CrossRef]
  17. Bellincampi, D.; Cervone, F.; Lionetti, V. Plant cell wall dynamics and wall-related susceptibility in plant-pathogen interactions. Front. Plant Sci. 2014, 5, 228. [Google Scholar] [CrossRef]
  18. Jaeck, E.; Dumas, B.; Geoffroy, P.; Favet, N.; Inze, D.; Van Montagu, M.; Fritig, B.; Legrand, M. Regulation of enzymes involved in lignin biosynthesis: Induction of O-methyltransferase mRNAs during the hypersensitive reaction of tobacco to tobacco mosaic virus. Mol. Plant Microbe Interact. 1992, 5, 294–300. [Google Scholar] [CrossRef]
  19. Starr, J.L.; Yang, W.; Yan, Y.; Crutcher, F.; Kolomiets, M. Expression of phenylalanine ammonia lyase genes in maize lines differing in susceptibility to Meloidogyne incognita. J. Nematol. 2014, 46, 360–364. [Google Scholar]
  20. Kim, D.S.; Hwang, B.K. An important role of the pepper phenylalanine ammonia-lyase gene (PAL1) in salicylic acid-dependent signalling of the defence response to microbial pathogens. J. Exp. Bot. 2014, 65, 2295–2306. [Google Scholar] [CrossRef]
  21. Yadav, V.; Wang, Z.; Wei, C.; Amo, A.; Ahmed, B.; Yang, X.; Zhang, X. Phenylpropanoid pathway engineering: An emerging approach towards plant defense. Pathogens 2020, 9, 312. [Google Scholar] [CrossRef]
  22. Gill, U.S.; Uppalapati, S.R.; Gallego-Giraldo, L.; Ishiga, Y.; Dixon, R.A.; Mysore, K.S. Metabolic flux towards the (iso) flavonoid pathway in lignin modified alfalfa lines induces resistance against Fusarium oxysporum f. sp. medicaginis. Plant Cell Environ. 2018, 41, 1997–2007. [Google Scholar]
  23. Hua, J. Modulation of plant immunity by light, circadian rhythm, and temperature. Curr. Opin. Plant Biol. 2013, 16, 406–413. [Google Scholar] [CrossRef]
  24. Horton, P.; Ruban, A.; Walters, R. Regulation of light harvesting in green plants. Annu. Rev. Plant Physiol. Plant Mol. Biol. 1996, 47, 655–684. [Google Scholar] [CrossRef]
  25. Kumudini, B.S.; Jayamohan, N.; Patil, S.; Govardhana, M. Chapter 11—Primary Plant Metabolism During Plant-Pathogen Interactions and Its Role in Defense. In Plant Metabolites and Regulation Under Environmental Stress; Ahmad, P., Ed.; Academic Press: Cambridge, MA, USA, 2018; pp. 215–229. [Google Scholar]
  26. Melvin, D.B. Primary metabolism and plant defense-fuel for the fire. Mol. Plant Microbe Interact. 2009, 22, 487–497. [Google Scholar]
  27. Dong, N.Q.; Lin, H.X. Contribution of phenylpropanoid metabolism to plant development and plant-environment interactions. J. Integr. Plant Biol. 2020, 63, 180–209. [Google Scholar] [CrossRef]
  28. Li, L.; Li, T.; Jiang, Y.; Yang, Y.; Zhang, L.; Jiang, Z.; Wei, C.; Wan, X.; Yang, H. Alteration of local and systemic amino acids metabolism for the inducible defense in tea plant (Camellia sinensis) in response to leaf herbivory by Ectropis oblique. Arch. Biochem. Biophys. 2020, 683, 108301. [Google Scholar] [CrossRef]
  29. Wang, M.; Gu, Z.C.; Wang, R.R.; Guo, J.J.; Ling, N.; Firbank, L.G.; Guo, S.W. Plant Primary Metabolism Regulated by Nitrogen Contributes to Plant-Pathogen Interactions. Plant Cell Physiol. 2019, 60, 329–342. [Google Scholar] [CrossRef]
  30. Cebeci, O.; Kokturk, B.; Ergen, N.; Ozturk, L.; Cakmak, I.; Budak, H. Differential expression of wheat transcriptomes in response to varying cadmium concentrations. Biol. Plant. 2008, 52, 703–708. [Google Scholar] [CrossRef]
  31. Gai, Z.S.; Wang, Y.; Ding, Y.Q.; Qian, W.J.; Qiu, C.; Xie, H.; Sun, L.T.; Jiang, Z.W.; Ma, Q.P.; Wang, L.J.; et al. Exogenous abscisic acid induces the lipid and flavonoid metabolism of tea plants under drought stress. Sci. Rep. 2020, 10, 12275. [Google Scholar] [CrossRef]
  32. O’Neill, L.A.J.; Kishton, R.J.; Rathmell, J. A Guide to Immunometabolism for Immunologists. Nat. Rev. Immunol. 2016, 16, 553–565. [Google Scholar] [CrossRef]
  33. Williams, N.C.; O’Neill, L.A.J. A Role for the Krebs Cycle Intermediate Citrate in Metabolic Reprogramming in Innate Immunity and Inflammation. Front. Immunol. 2018, 9, 141. [Google Scholar] [CrossRef]
  34. Barth, C.; Jander, G. Arabidopsis myrosinases TGG1 and TGG2 have redundant function in glucosinolate breakdown and insect defense. Plant J. 2006, 46, 549–562. [Google Scholar] [CrossRef]
  35. Bednarek, P.; Osbourn, A. Plant-microbe interactions: Chemical diversity in plant defense. Science 2009, 324, 746–748. [Google Scholar] [CrossRef]
  36. Bednarek, P. Chemical warfare or modulators of defence responses-the function of secondary metabolites in plant immunity. Curr. Opin. Plant Biol. 2012, 15, 407–414. [Google Scholar] [CrossRef]
Figure 1. Phenotypes of oat leaves. Scale bar = 1 cm. CK, no Pga inoculation; P, Pga inoculation.
Agronomy 12 02353 g001
Figure 2. Effects of Pga inoculation on physiological changes of oat leaves. (A) H2O2 content. (B) O2 content. (C) CAT activity. (D) SOD activity. (E) POD activity. (F) PAL activity. Data are expressed as mean ± SE (n = 3). Data are means ± SD of three biological replicates (n = 3) and different letters indicate significant difference at p ≤ 0.05 by the one-way ANOVA test. CK, no Pga inoculation; P, Pga inoculation.
Agronomy 12 02353 g002
Figure 3. (A) Principal component analysis (PCA) of the variance-stabilized estimated raw counts of DAMs. (B) Volcano plot of DAMs between CK and P. The green dots represent downregulated DAMs, the red dots represent upregulated DAMs, and the gray dots represent insignificant DAMs. DAMs, differentially accumulated metabolites; FC, fold change; CK, no Pga inoculation; P, Pga inoculation.
Agronomy 12 02353 g003
Figure 4. KEGG pathway enrichment analysis of DAMs between CK and P. CK, no Pga inoculation; P, Pga inoculation. The larger the rich factor, the greater the degree of enrichment. The size of the point in the figure indicates the number of DAMs enriched into the pathway, and the color of the point indicates the magnitude of the p-value. Higher p-values correspond to lower levels of enrichment.
Agronomy 12 02353 g004
Figure 5. (A) Heatmap of DEGs in oat leaves infected by Pga. Red indicates upregulated DEGs and blue indicates downregulated DEGs. DEGs, differentially expressed genes; FC, fold change; CK, no Pga inoculation; P, Pga inoculation. (B) The boxplot figure of FPKM in different experimental conditions. The X-axis represents sample names and the Y-axis is log10 (FPKM) value of different genes. The box plots for each region correspond to five statistics (from top to bottom are maximum, third quartile, median, first quartile, and minimum, respectively). (C) Volcano plot of differentially expressed genes between CK and P. The green dots represent downregulated DEGs, the red dots represent upregulated DEGs, and the gray represents detected but not significantly differentially expressed genes.
Agronomy 12 02353 g005
Figure 6. Gene expression analysis of DEGs through qRT-PCR. CK, no Pga inoculation; P, Pga inoculation.
Agronomy 12 02353 g006
Figure 7. GO analysis of differentially expressed genes (DEGs) between CK and P. CK, no Pga inoculation; P, Pga inoculation.
Agronomy 12 02353 g007
Figure 8. KEGG pathway enrichment analysis of DEGs between CK and P. CK, no Pga inoculation; P, Pga inoculation. The X–axis represents the enrichment score. The size of the bubble indicates the number of DEGs enriched in the pathway, and the color of the bubble indicates the magnitude of the p–value. The smaller the p–value, the greater the significance.
Agronomy 12 02353 g008
Figure 9. Integrated analysis of regulated pathways identified by transcriptomic and metabolomic analyses. Triangles, squares, and circles represent pathways, differential metabolites, and DEGs, respectively. For DEGs and differential metabolites, red and green indicate the upregulated and downregulated factors, respectively.
Agronomy 12 02353 g009
Figure 10. Networks of the ‘citrate cycle’ (A), ‘cysteine and methionine metabolism’ (B), ‘tryptophan metabolism’ (C), and ‘glyoxylate and dicarboxylate metabolism’ (D). The substances on the line are genes, and the locations of the nodes indicate metabolites. Red and green indicate upregulated and downregulated genes, respectively; yellow and blue indicate upregulated and downregulated metabolites, respectively.
Agronomy 12 02353 g010aAgronomy 12 02353 g010b
Figure 11. The differentially expressed genes mapped to the KEGG pathway diagram. (A) Phenylpropanoid biosynthesis. (B) Flavonoid biosynthesis. (C) Photosynthesis-antenna proteins. The green color represents a significant downregulation of the gene or metabolite, the red color represents a significant upregulation of the gene or metabolite, and the yellow color represents a gene that is both upregulated and downregulated.
Agronomy 12 02353 g011aAgronomy 12 02353 g011b
Publisher’s Note: MDPI stays neutral with regard to jurisdictional claims in published maps and institutional affiliations.

