Article

The Phosphorus Availability in Mollisol Is Determined by Inorganic Phosphorus Fraction under Long-Term Different Phosphorus Fertilization Regimes

1
Institute of Agricultural Resources and Regional Planning, Chinese Academy of Agricultural Sciences, Beijing 100081, China
2
TERRA, Gembloux Agro-Bio Tech, University of Liege, 5030 Gembloux, Belgium
3
Institute of Plant Nutrition, Resources and Environment, Beijing Academy of Agriculture and Forestry Sciences, Beijing 100097, China
4
Agricultural Environment and Resources Center, Jilin Academy of Agricultural Sciences, Changchun 130033, China
5
College of Agronomy and Biotechnology, China Agricultural University, Beijing 100094, China
*
Authors to whom correspondence should be addressed.
Agronomy 2022, 12(10), 2364; https://doi.org/10.3390/agronomy12102364
Submission received: 7 September 2022 / Revised: 24 September 2022 / Accepted: 27 September 2022 / Published: 30 September 2022

Abstract

:
Understanding the effects of a fertilization regime on the long-term accumulation and transformation of soil phosphorus (P) is essential for promoting the development of sustainable management of soil P. Based on a 29-year field experiment in Mollisol, the compositions and changes of P forms using a modified Hedley sequential extraction method, solution 31P-NMR and P K-edge XANES and soil properties were investigated under continuous mono maize with and without manure (NPKM and NPK). Results showed a stronger positive related coefficient between soil total P and labile P, and mid-labile P fraction was found in NPKM than in NPK treatment. It indicated NPKM could improve the availability of soil accumulated P and reduce its transformation to stable P. Accumulated inorganic P (Pi) was dominated by aluminum phosphate (Al-P) and monobasic calcium phosphate monohydrate (MCP) for NPK treatment, Al-P, MCP, and tricalcium phosphate for NPKM treatment with XANES analysis, which contributed to the P availability in Mollisol. Moreover, the proportion of IHP with XANES and ratio of orthophosphate diesters to monoesters in NPK compared to NPKM indicated the higher Po lability with NPK treatment. Pi, especially NaHCO3-Pi and NaOH-Pi, were the potential sources of resin-Pi. Soil organic matter (SOM), organic-bound iron, and alumina oxide (Fep + Alp) showed significant influence on the transformation of P forms. Our research suggested that due to the rise in SOM and Fep + Alp, the fertilization regime significantly increased most highly active soil P fractions, especially in NPKM treatment. This work gives new insight into sustainable P management, which benefits the reduction in soil P accumulation.

1. Introduction

Phosphorus (P) fertilization is the key to meeting crops’ growth needs and productivity [1,2]. Mineral P fertilizer application has been widely used in agronomic practice to ensure the sustainable development of agriculture over the past decades [3]. However, due to the low P use efficiency in the current season, excessive mineral P fertilizer input to increase crop yield has caused environmental risks, i.e., less soil P retainment and water eutrophication [4]. Animal manure contains a high concentration of P [5]. A combination of mineral P fertilizer with manure (NPKM) has gradually become a popularized fertilization practice [6,7,8]. Specifically, higher content and proportion of plant-available P easily absorbed by crops are observed in NPKM treatment than that in NPK treatment [6,9]. Therefore, a thorough understanding of how the fertilization regime affects P availability by altering P transformation in the soil is essential to develop sustainable P management strategies.
Knowledge of existing soil P species is essential to the biogeochemical process of the P cycle and partly determinants the effectiveness of soil P on crop growth [10]. The modified Hedley sequential method is widely used to characterize different inorganic P (Pi) and organic P (Po) fractions based on their solubility [11,12]. Recently, advanced spectroscopy techniques, i.e., P K-edge XANES spectra and solution 31P-NMR spectroscopy, were utilized to identify the chemical forms and structures of specific Pi and Po fractions, respectively, on the molecular level [13,14]. Professional and correct interpretation of data in spectroscopy techniques can provide a comprehensive and reliable understanding of soil P chemical nature when combined with the modified Hedley sequential method [13,14,15,16,17]. Meanwhile, a growing body of literature has shown the feasibility and advances of their integrated utilization in soil P speciation studies [18,19,20,21,22]. However, so far, studies on the difference in soil P forms under different long-term fertilization regimes using these advanced analytical techniques are few.
P availability is determined by P-existing species present in the soil [23]. Solution Pi pool can be directly used by plants, while a large portion of P fractions interact with soil solid-phase. Structural equation modeling (SEM) enables quantitatively evaluating the importance of different P fractions transformations in regulating the availability of P in soil via a comparison between the observed covariance matrix and implicit covariance matrix in the current model [24,25]. At present, the quantitative analysis of the transformation of P fractions by SEM is mainly focused on unfertilized or forest soil, highlighting the importance of Po fraction in soil P dynamics [10,25,26]. With the continuous input of fertilizer P, more available P is accumulated in the form of Pi in the soil, influencing the transformation process of soil P [27,28]. So far, few pieces of research focus on direct and indirect quantitative effects of various P forms on P availability.
Changes in soil properties caused by fertilization affect soil P forms [29]. Many studies have shown a positive correlation between soil organic matter (SOM) and highly active Pi components [1,30,31]. SOM could interact with metal oxides in many ways (competitive adsorption sites, cationic bridges, etc.) to form organomineral complexes [31,32,33]. It can reduce the adsorption of metal oxides to P and increase the mineralization of Po and decomposition of Pi [34,35]. Furthermore, soil pH is an essential influence factor on P fractions [36]. The decrease in pH in calcareous soil can promote the conversion of stable crystalline Ca-P species to relatively soluble Ca-P and adsorbed P, and the increase in pH in neutral or acidic soils can reduce the adsorption of metal oxides to P [27,37]. Conversely, the opposite result about the positive correlation between soil pH and stable P is obtained in some calcareous soils [8,38]. Therefore, understanding how soil properties affect the transformations of soil P fractions under a fertilization regime is very important to evaluate the sustainability of the fertilization regime and the long-term P speciation.
In northeast China, Mollisol (USDA Soil Taxonomy), rich in soil organic matter and P, is the most important major-producing region and commercial grain base [39,40]. A long-term field trial in Mollisol provides important resources to investigate the influence of a fertilization regime on speciation and transformation of soil P, which cannot be achieved by a short-term experiment [8]. In this study, two long-term fertilization treatments were selected, one with chemical fertilization (NPK) and the other with manure plus NPK (NPKM). We hypothesized that the concentration of Fe and Al oxides with high activity increases soil P availability in Mollisol because of the formation of mineral-C associations. The overall goal of the study is to clarify the effects of different fertilization regimes on soil P availability and its driving factors. The specific research objectives were to (1) comprehensively evaluate the P fractions under different fertilization measures using multiple techniques (P K-edge XANES, solution 31P-NMR, and modified Hedley sequential extraction), (2) quantitatively analyze the contribution rate of P fractions to P availability in Mollisol via a structural equation model, and (3) identify the main influencing factors of P fractions by principal components analysis (PCA) and redundancy analysis (RDA).

2. Materials and Methods

2.1. Study Site and Soil Sampling

The long-term field trial, set up in 1989 in Gongzhuling, Jilin province, China (124°48′34″ E, 43°30′23″ N), belongs to the Chinese National Soil Fertility and Fertilizer Efficiency Monitoring Base of Mollisol. The monitoring base belongs to a temperate continental monsoon area with four distinct seasons, and the mean annual temperature and precipitation are 4–5 °C and 590.7 mm, respectively. The soil is classified as Mollisol in USDA Soil Taxonomy [40]. The average properties at the start of the field trial are shown in Table 1.
The following treatments were considered in this study: (1) unfertilized control plot (CK); (2) mineral N, P, K fertilizer (NPK) and NPK plus manure (NPKM). A total of 165 kg N ha−1 (urea), 36 kg P ha−1 (diammonium phosphate), and 68 kg K ha−1 (potassium sulfate) were applied in the NPK treatment, and 50 kg N ha−1, 36 kg P ha−1, and 68 kg K ha−1 of the above-mentioned chemical fertilizers were applied in the NPKM treatment. The organic fertilizers were pig manure (1990–2004) and cattle manure (2005–2018), with 115 kg N ha−1, 39 kg P ha−1, and 77 kg K ha−1. The cropping system was a continuous maize monoculture in this long-term field experiment. Details about the background information of the field trial and crop yields have been described by previous studies elsewhere [6,41]. Each treatment plot covered 400 m2 (57.18 × 7 m) in a randomized block design; three replications were considered for each treatment. In each replicate, five to seven topsoil samples (0–20 cm) were randomly sampled at “S” shaped distribution points after crop harvest in 1990, 1995, 2000, 2005, 2010, and 2018. The field-moist samples were gently broken apart, mixed thoroughly, air-dried, sieved to 2 mm, and stored for further analysis. Soil sample collected in the CK treatment in 1990 was treated as reference soil.
Vitriol acid–potassium dichromate oxidation was used to measure SOM content [42]. Soil pH was determined from a 1:2.5 soil to distilled water (w/v) [43]. Crystalline iron and aluminum oxide (Fed and Ald, respectively), amorphous Al and Fe oxide (Alo and Feo, respectively), organic-bound iron and alumina oxide (Alp and Fep, respectively) were extracted using Na2S2O4-Na3C6H5O7-NaHCO3 (DCB) [44], 0.2 M ammonium oxalate (pH 3.0) [45], and 0.1 M sodium pyrophosphate diphosphate (pH 10) [46], respectively. Then, those extracted Fe and Al oxides were determined by using inductively coupled plasma optical emission spectroscopy (ICP-OES) [43]. Mehlich-3 extracting solution (0.2 M CH3COOH + 0.25 M NH4NO3 + 0.015 M NH4F + 0.13 M HNO3 + 0.001 M EDTA) was used to determine Ca (M3-Ca), Mg (M3-Mg), Fe (M3-Fe), and Al (M3-Al). All elements in the Mehlich-3 solutions were measured with ICP-OES [47].

2.2. Modified Hedley Sequential Fractionation

The modified Hedley sequential extraction method was chosen to distinguish different P fractions in collected soil. Briefly, 1.00 g soil sample was sequentially fractionated with the following extractants: (1) 2 resin strips + 30 mL deionized water to extract resin-P; (2) 0.5 M 30 mL NaHCO3 (pH 8.5) solution to extract total and inorganic P on NaHCO3 extract (NaHCO3-Pt and NaHCO3-Pi); (3) 0.1 M 30 mL NaOH to extract NaOH-Pt and NaOH-Pi; (4) 1 M 30 mL HCl to extract dil.HCl-Pi; (5) 10 mL concentrated HCl to extract conc.HCl-Pt and conc.HCl-Pi; (6) concentrated H2SO4-H2O2 to digest and extract the residual P at 360 °C [11]. All extract solutions were shaken and centrifuged. Each filtered supernatant was divided into two parts. One was directly used to determine the Pi fraction with colorimetric, and the other was digested with ammonium persulfate before being analyzed with molybdate colorimetry. The content of Po (NaHCO3-Po, NaOH-Po, and conc.HCl-Po) was determined by the difference between Pt and Pi in each extract, respectively [11]. Resin-P represented a soil soluble Pi pool, and NaHCO3-Pi was thought to be released by ligand exchange with the bicarbonate ion [48,49]. NaHCO3-Po could be utilized after being mineralized [50]. NaOH-Pi fractions were considered to consist of Alo/Feo and some Fed/Ald [11]. The dil.HCl-Pi was associated with calcium (Ca); it could be utilized by plants after weathering and release of primary mineral Ca-P [26,48]. Generally, labile P was thought to be the sum of resin-P, NaHCO3-Pi, and NaHCO3-Po; NaOH-Pi, NaOH-Po, and dil.HCl-Pi index mid-labile P, conc.HCl-Pi, conc.HCl-Po and residual P indicate a stable P pool which is in low availability [11,12,51,52].

2.3. Synchrotron-Based P K-Edge XANES Spectroscopy

Reference P standard and soil samples were analyzed using P K-edge XANES spectroscopy at the 4B7A soft X-ray beamline of the Beijing Synchrotron Radiation Facility, Beijing, China. The electron energy of the storage ring operated at 2.2 GeV, and the maximum beam current was 250 mA. After being air-dried, finely ground, and sieved (0.5 mm particle size), the soil samples were thinly spread over a P-free and double-sided carbon tape and then placed on a sample holder to collect XANES data [53]. P standard samples were measured under total electron mode without self-absorption effects, P reference spectra were collected in partial fluorescence yield mode; in the meantime, multiple spectra for each sample were collected and averaged [27,54]. The spectra of P standards included iron phosphate dihydrate [Fe-P, FePO4·2H2O], aluminum phosphate [Al-P, AlPO4], dibasic calcium phosphate [DCP, CaHPO4·2H2O], monobasic calcium phosphate monohydrate [MCP, Ca(H2PO4)2·H2O], tricalcium phosphate [TCP, Ca3(PO4)2·xH2O], hydroxyapatite [HAP, Ca5(PO4)3OH], and inositol hexakisphosphate (IHP). The characteristic features of P K-edge XANES reference spectra of the calibrated P standards samples are shown in Figure 1A. The characteristic post-white linke peak b and an oxygen resonance peak e were at 2152 eV and 2169 eV, respectively [18]. Specifically, the pre-edge peak a (2148.0 eV) was the characteristic feature of Fe-associated P (Fe-P), the shoulder peak c (around 2155 eV) and peak d (approximately 2162.5 eV) were for Ca-associated P (Ca-P) [17,55]. All the XANES data, such as spectra averaging, background correction, and normalization, were analyzed with ATHENA (Version 0.9.26, Amazon Web Services, Inc., Seattle, WA, USA) [56]. The beamline energy was calibrated to 2149 eV (E0) using the first derivative peak of the AlPO4 standard [22]. The improvement of the signal-to-noise ratio of spectra was realized through multiple scans for each sample. Linear combination fitting (LCF) of the sample spectra was conducted using the spectral region between −10 eV to 15 eV relative to E0 to identify the P species and estimate their proportions. The sum weights of all the P standards were forced to 1. The goodness-of-fit was assessed by the R-value and chi-squared values, and the P standards yielding the best fit were regarded as the most possible P speciation in the investigated soil samples.

2.4. Solution 31P-NMR Spectroscopy

Solution 31P-NMR was performed to classify the P composition of soil and manure samples based on the method described by Liu et al. [8,13]. Briefly, 3.00 g samples were extracted with 30 mL 0.25 M NaOH + 0.05 M Na2-EDTA solution (16 h) at 20 °C, and centrifuged (5000 rpm, 30 min). After freeze-drying (−80 °C), the subsample was successively re-dissolved into 0.65 mL following solutions, D2O, deionized water, and the extracting solution (0.25 M NaOH + 0.05 M Na2EDTA), and 0.4 mL 10 M NaOH. Then, the solution was centrifuged and transferred into a 10-mm probe for NMR analysis. Solution 31P-NMR spectra were obtained through a Bruker Avance 500 MHz spectrometer. NMR parameters were 90° pulse, 5 s relaxation delay, 0.68 s acquisition time, 20 °C, 2200–3500 scans, 12-Hz spinning, and no proton decoupling as described previously [8]. Along with the peak of orthophosphate standardized at 6 ppm, the signals and chemical shifts (ppm) were used to identify the P compounds according to the publications [57] and by spiking samples with reference standards (α- and β-glycerophosphate, myo-IHP, adenosine 5′ monophosphate, and choline phosphate) [13]. Generally, the degradations, including mononucleotides, α- and β-glycerophosphate, were considered diesters rather than monoesters [58,59]. Signal areas were integrated with MestReNova (Version 11.0, Mestrelab Research, Spain).

2.5. Statistical Analysis

The mean and standard error of soil P parameters and soil properties were reported. Analysis of variance (ANOVA) was used to analyze the normality and homogeneity of measured variables. Redundancy analysis (RDA) to identify the dominant soil properties that could explain the changes in soil P fractions was performed using the vegan package (Version 2.5-7) in R software (Version 1.3.1073, RStudio, Boston, MA, USA). Structural equation modeling (SEM) was applied to explore the transformations of different P fractions, the lavaan package, along with the lavaan.survey package in R software (Version 1.3.1073, RStudio, Boston, MA, USA) was used to analyze SEM. A chi-square test (χ2) was carried out to investigate the overall goodness of fit and adequacy of the model. The p value > 0.05 indicated no statistical difference was found between covariance matrices produced by model fits and observed covariance matrices [60]. In addition to the chi-square test, the comparative fit index (CFI) and standardized root mean square residual (SRMR) were used to validate the goodness of fit. The model fit index of CFI value > 0.95 and the SRMR value < 0.08 suggest a good fit [61].

3. Results

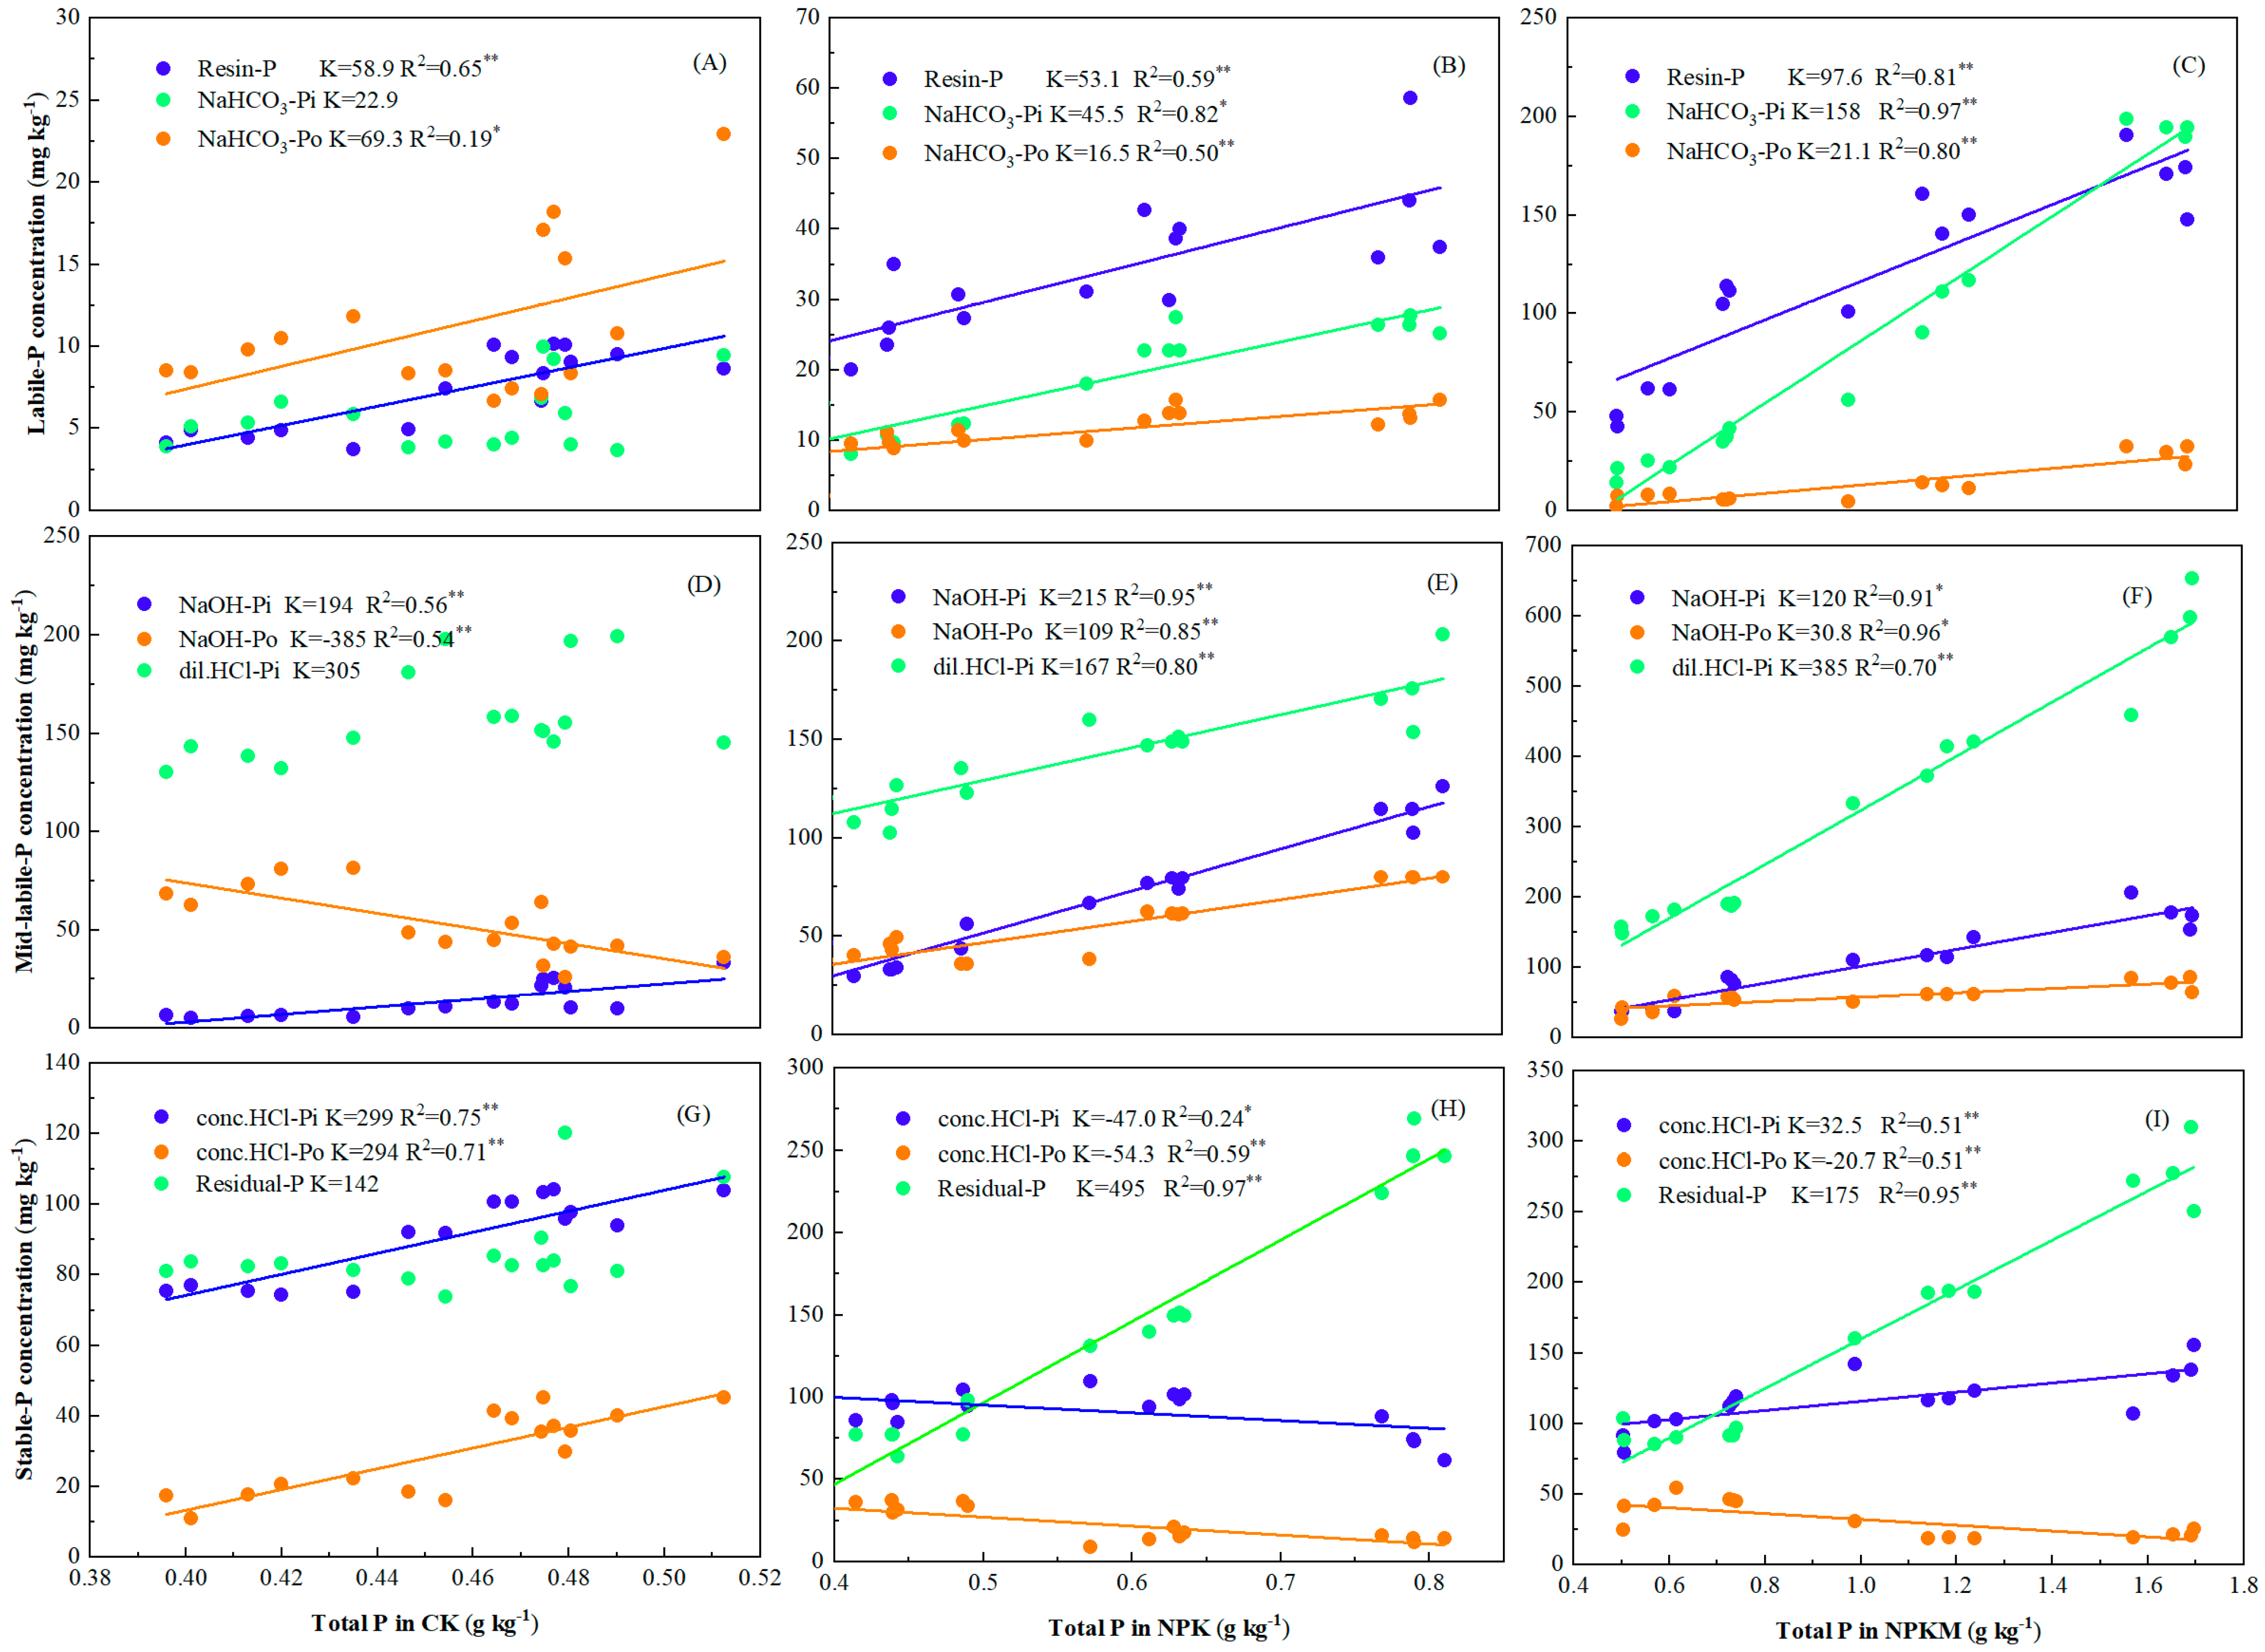
3.1. Soil Total P and Its Relationship with P Fraction Using Modified Hedley Sequential Method

Soil total P exhibited a linear decrease in CK treatment over time (K = −0.0024, R2 = 0.78 *). Labile P and stable P, especially the P fraction of resin-P, NaHCO3-Po, NaOH-Pi, conc.HCl-Pi and conc.HCl-Po were the main depleted P pool, which showed a significantly positive relationship with total P in CK treatment (Figure 2 and Figure A1A,D,G). Under P fertilization, soil total P significantly increased over time and positively related to labile P, mid-labile P, and stable P fractions (Figure 2A,C,D). Higher correlation coefficients between total P and labile P and mid-labile P were exhibited in NPKM treatment (K = 277, R2 = 0.96 **; K = 536, R2 = 0.99 **, respectively) than that in NPK treatment (K = 115, R2 = 0.96 **; K = 491, R2 = 0.99 **, respectively). Regardless of the P fertilization regime, the accumulated P in the soil was mainly transferred into the Pi fraction, accounting for 79.3–92.6%. Specifically, the transformation ratio of resin-P, NaHCO3-Pi, and dil.HCl-Pi was higher; 0.84, 2.47, and 1.31 times in NPKM treatment than in NPK treatment (Figure A1).
The SEM revealed the P transformations in Mollisol (Figure 3). This model reasonably fit our causal hypothesis (χ2 = 7.27, P = 0.51, CFI = 1.00, RMSEA = 0.00, SRMR = 0.03), and could explain 96% of the variance. According to the result of SEM, Pi fractions showed the main influence on the resin-Pi. NaHCO3-Pi and NaOH-Pi directly affected resin-Pi fraction with path coefficients of 0.72 and 0.35, respectively. Dil.HCl-Pi and stable P showed an indirect effect on resin-Pi by altering the concentration of NaOH-Pi or NaHCO3-P.

3.2. P Fraction Using P Kedge-XANES

The characteristic features of P K-edge XANES spectra for P standard and soil samples are shown in Figure 1. The soil samples’ P speciation varied significantly in both P fertilization regimes. The XANES spectra LCF results showed that Ca-P, Fe-P, Al-P, and IHP fractions contributed 55–59, 21–29, 19–21% to soil total P for NPK and 71–77, 19–24, 7–15% to total P for NPKM treatments, respectively, in Mollisol (Table 2). The P speciation dominated as MCP (39.4%), Al-P (24.7%), IHP (18.8%), and TCP (14.0%) for NPK treatment, and TCP (43.0%), MCP (33.8%), and Al-P (24.2%) for NPKM treatment in 2018, respectively. A decreasing trend of HAP was detected in both treatments, with lower proportions in the NPKM than in the NPK in each cultivation year (Table 2).

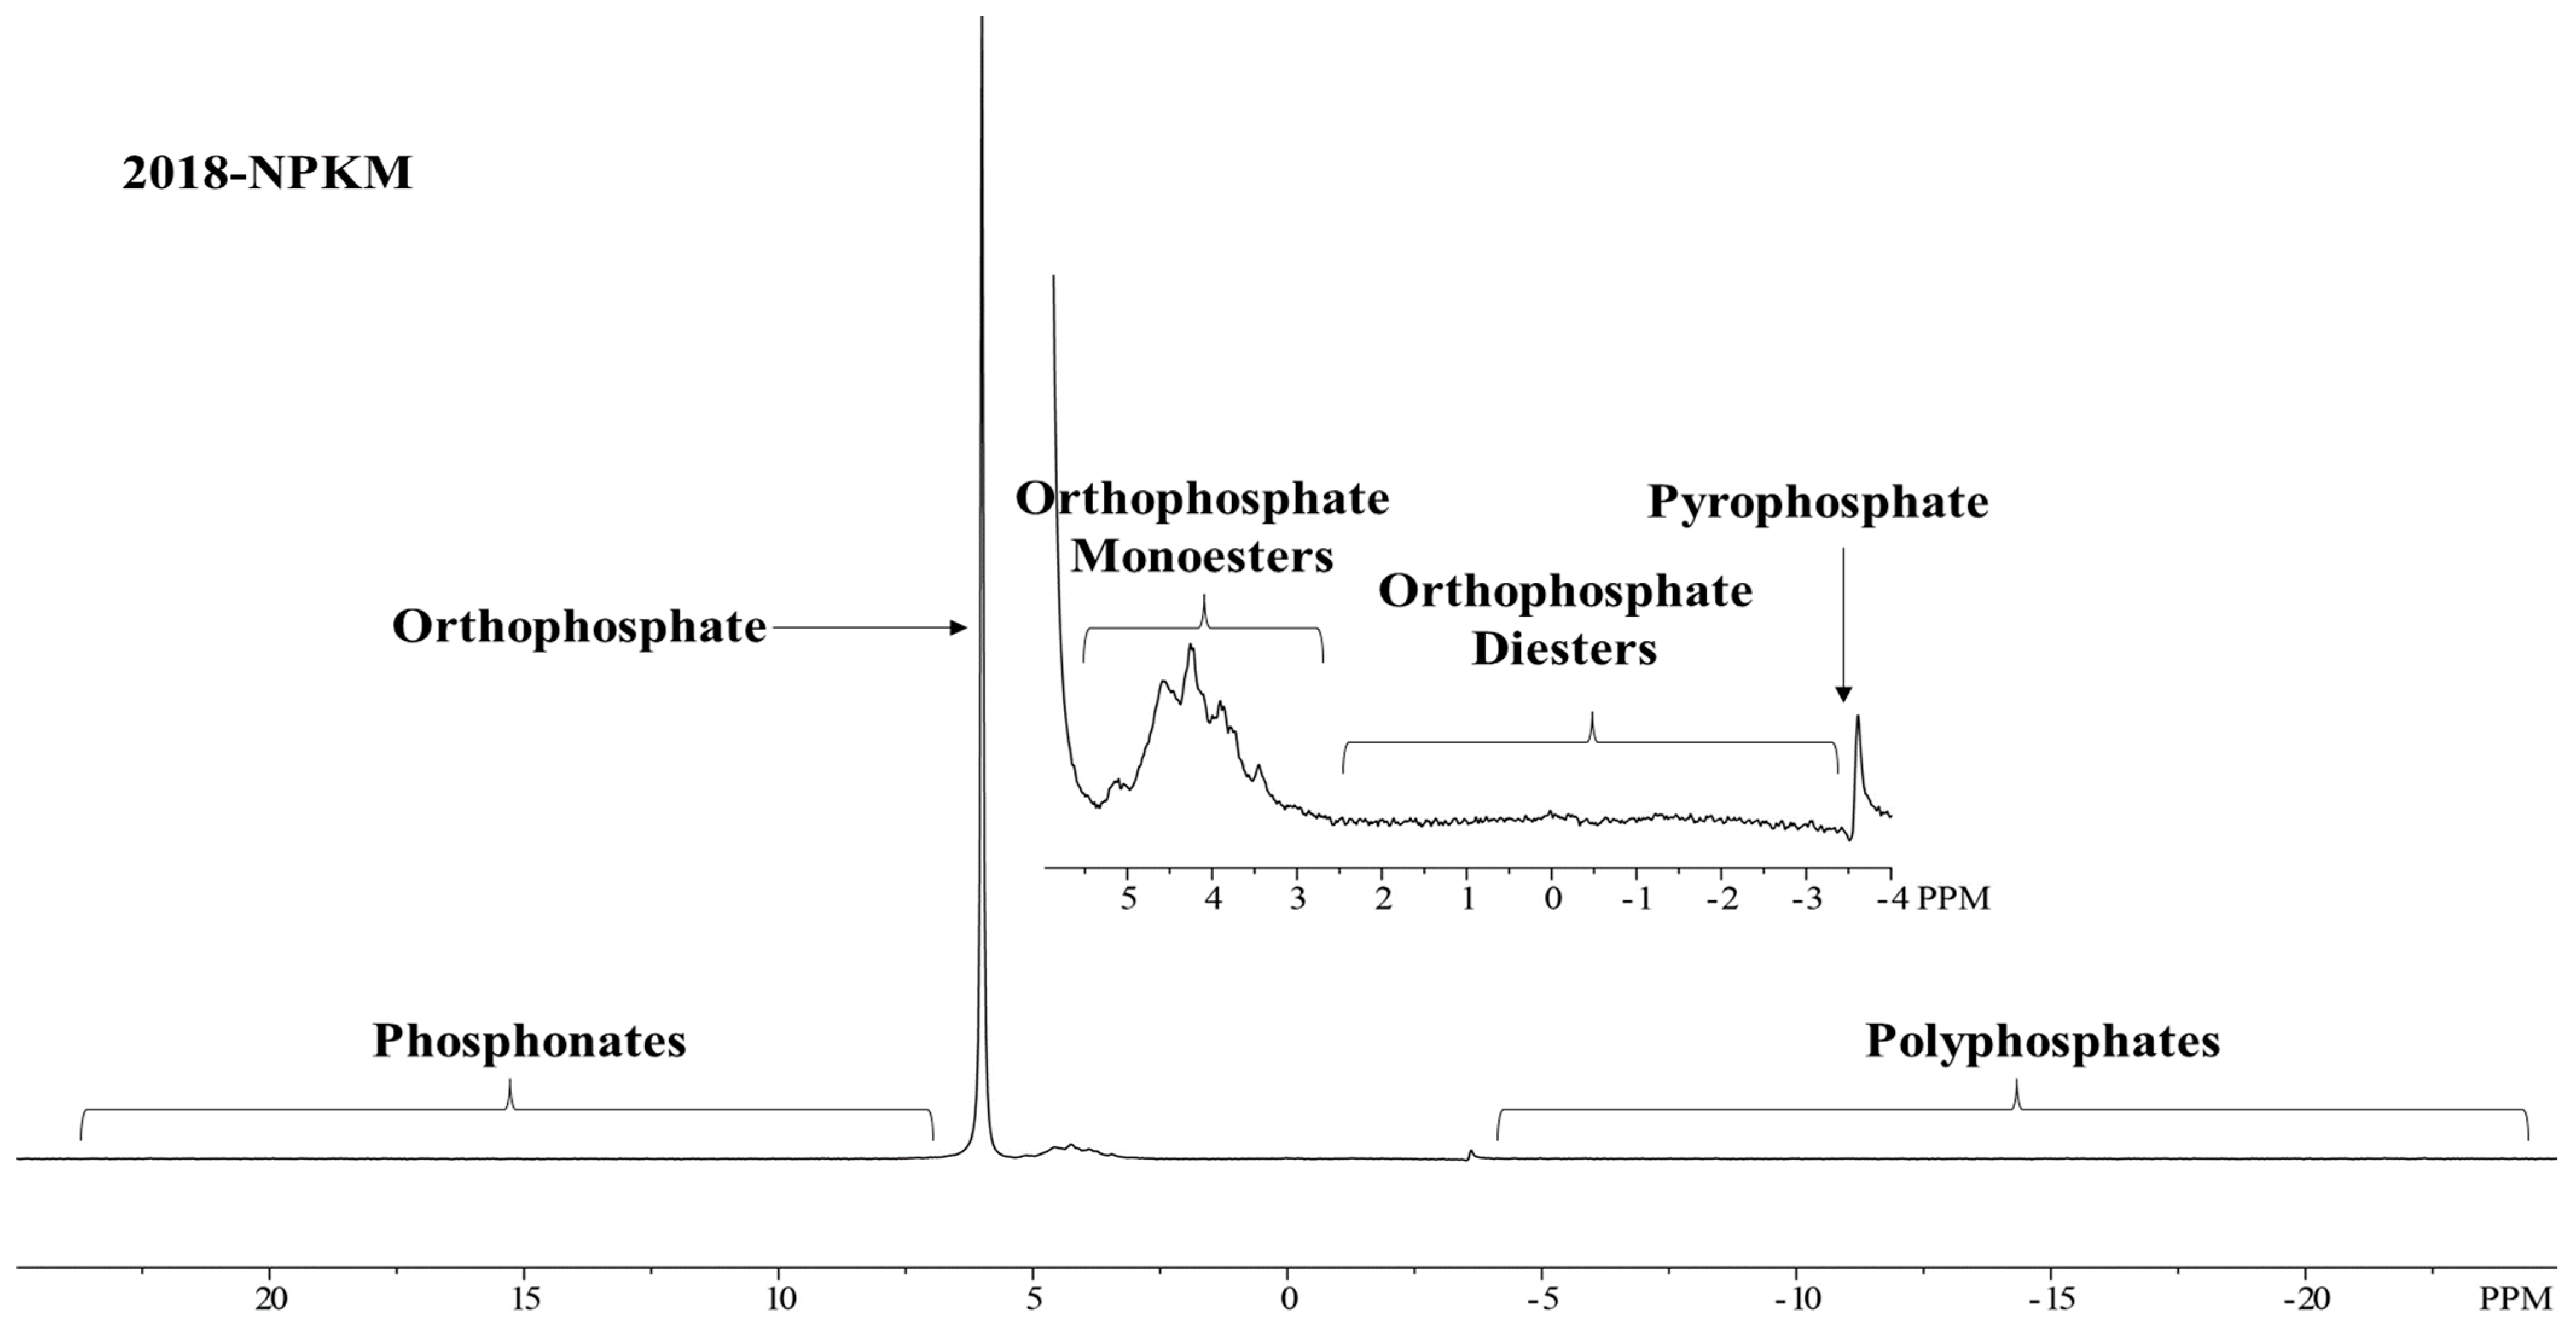
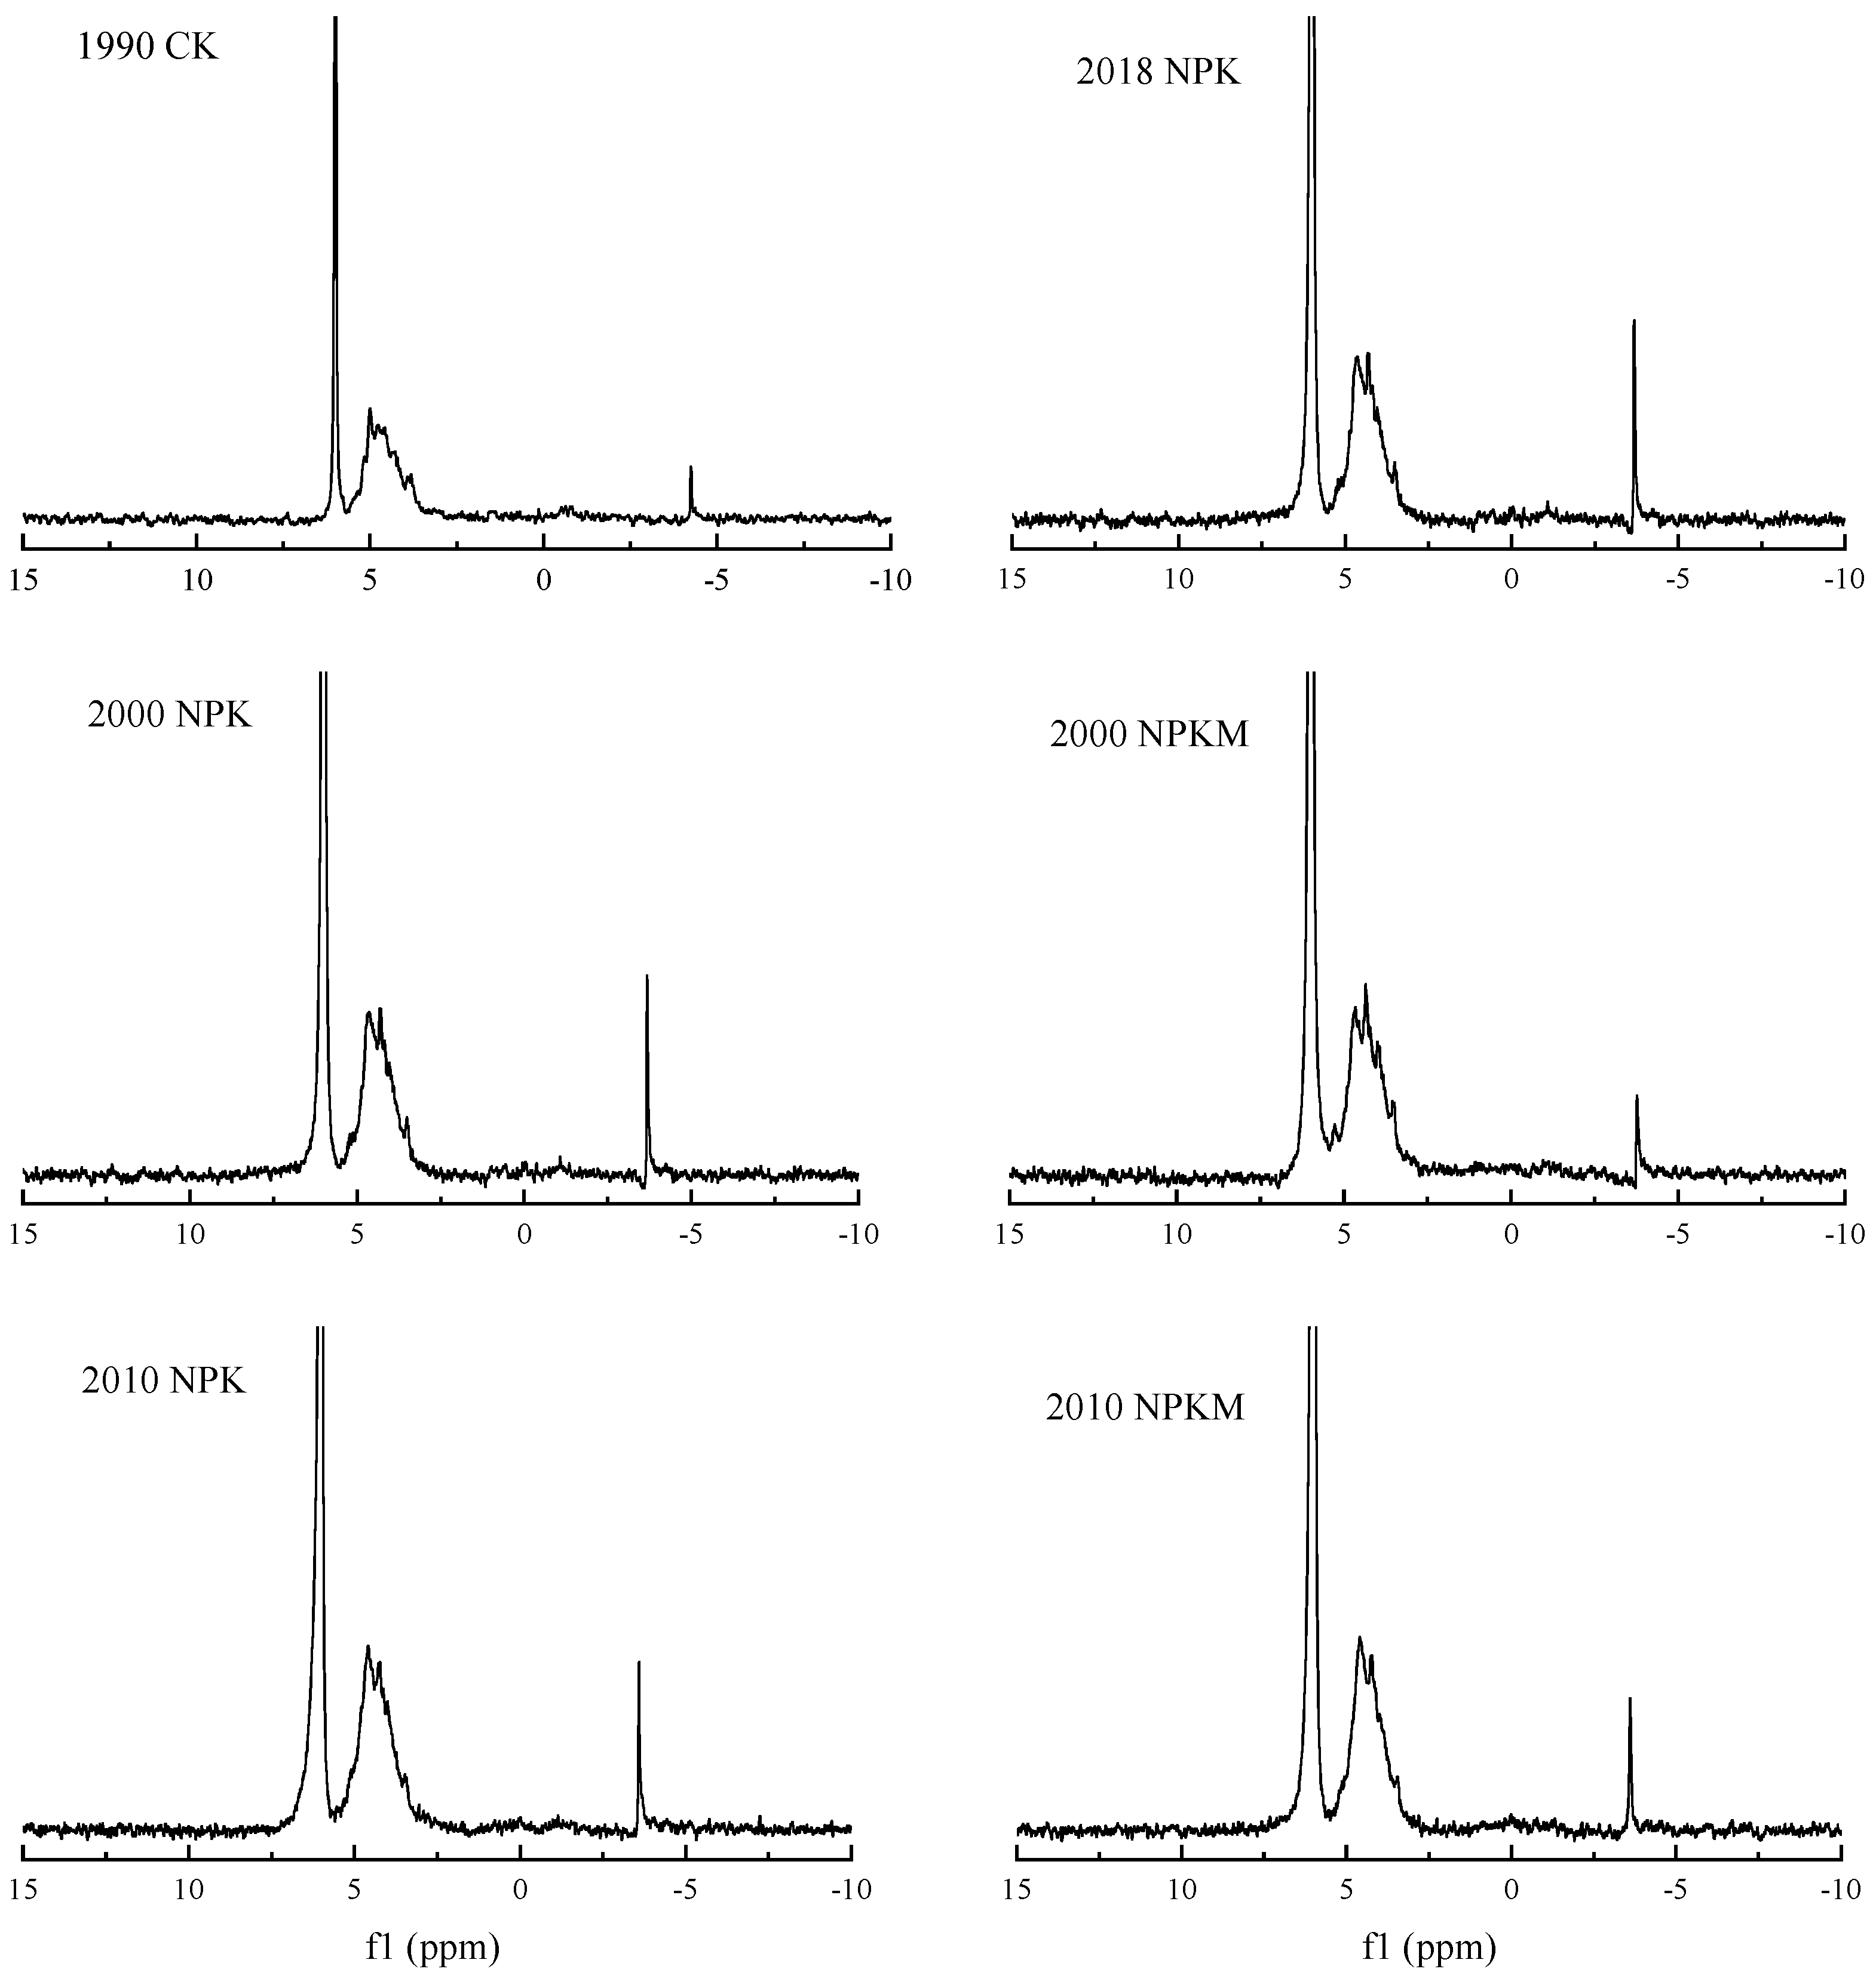
3.3. Soil P Fraction Using 31P-NMR

The 31P-NMR fraction extracted by NaOH-EDTA and the chemical shifts associated with P fractions of studied soil samples is shown in Figure 4. The recovery rate of the NaOH-EDTA extraction for 31P-NMR was 26.7–62.7% of the total P in this experiment (Table 3). The application of P fertilizer significantly improved the proportion of soil Pi fractions, especially in orthophosphate, with the proportion 28.6–47.3% higher in NPKM treatment than in NPK treatment (Table A1). Orthophosphate monoesters, accounting for 20.0–49.2%, were dominated by the stereoisomers of IHP (e.g., myo-IHP, scyllo-IHP, and neo-IHP), α and β -glycerophosphate, mononucleotides, choline phosphate, and glucose 6-phosphate in both P fertilization regimes. By correcting the degradation products, the proportion of orthophosphate monoester and orthophosphate diester was 19.0–53.3% for NPK and 1.55–8.25% for NPKM, respectively. A decreasing trend in the proportion of orthophosphate monoester and orthophosphate diester was exhibited in both P fertilization treatments from 1990 to 2018.

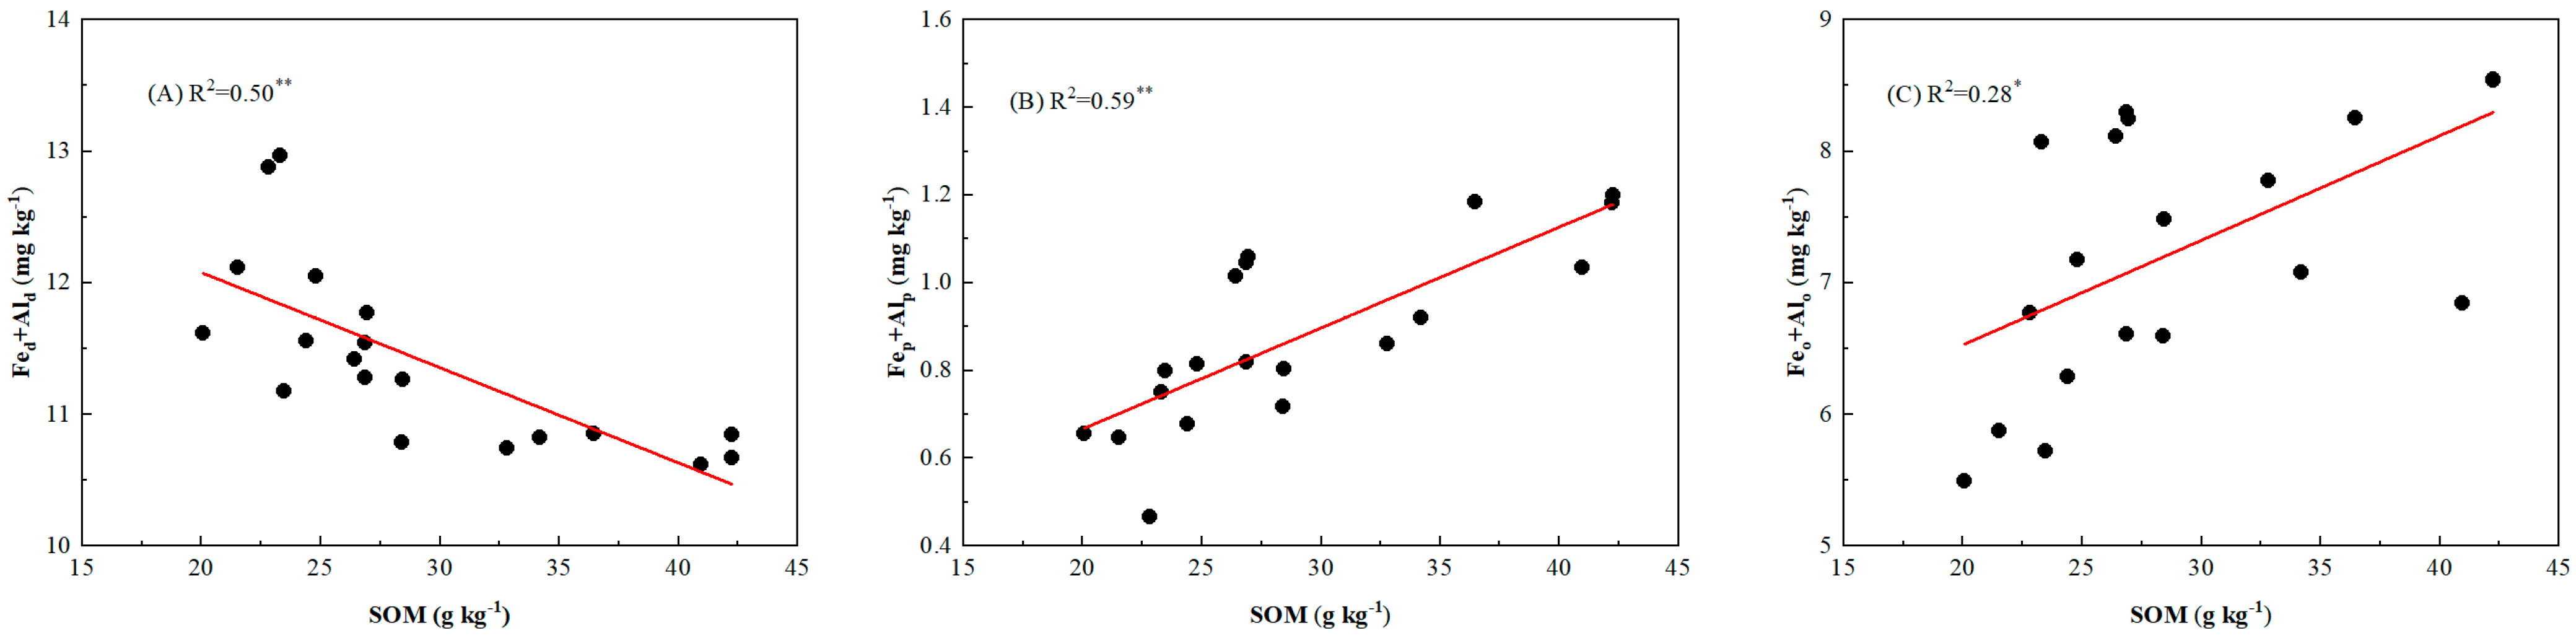
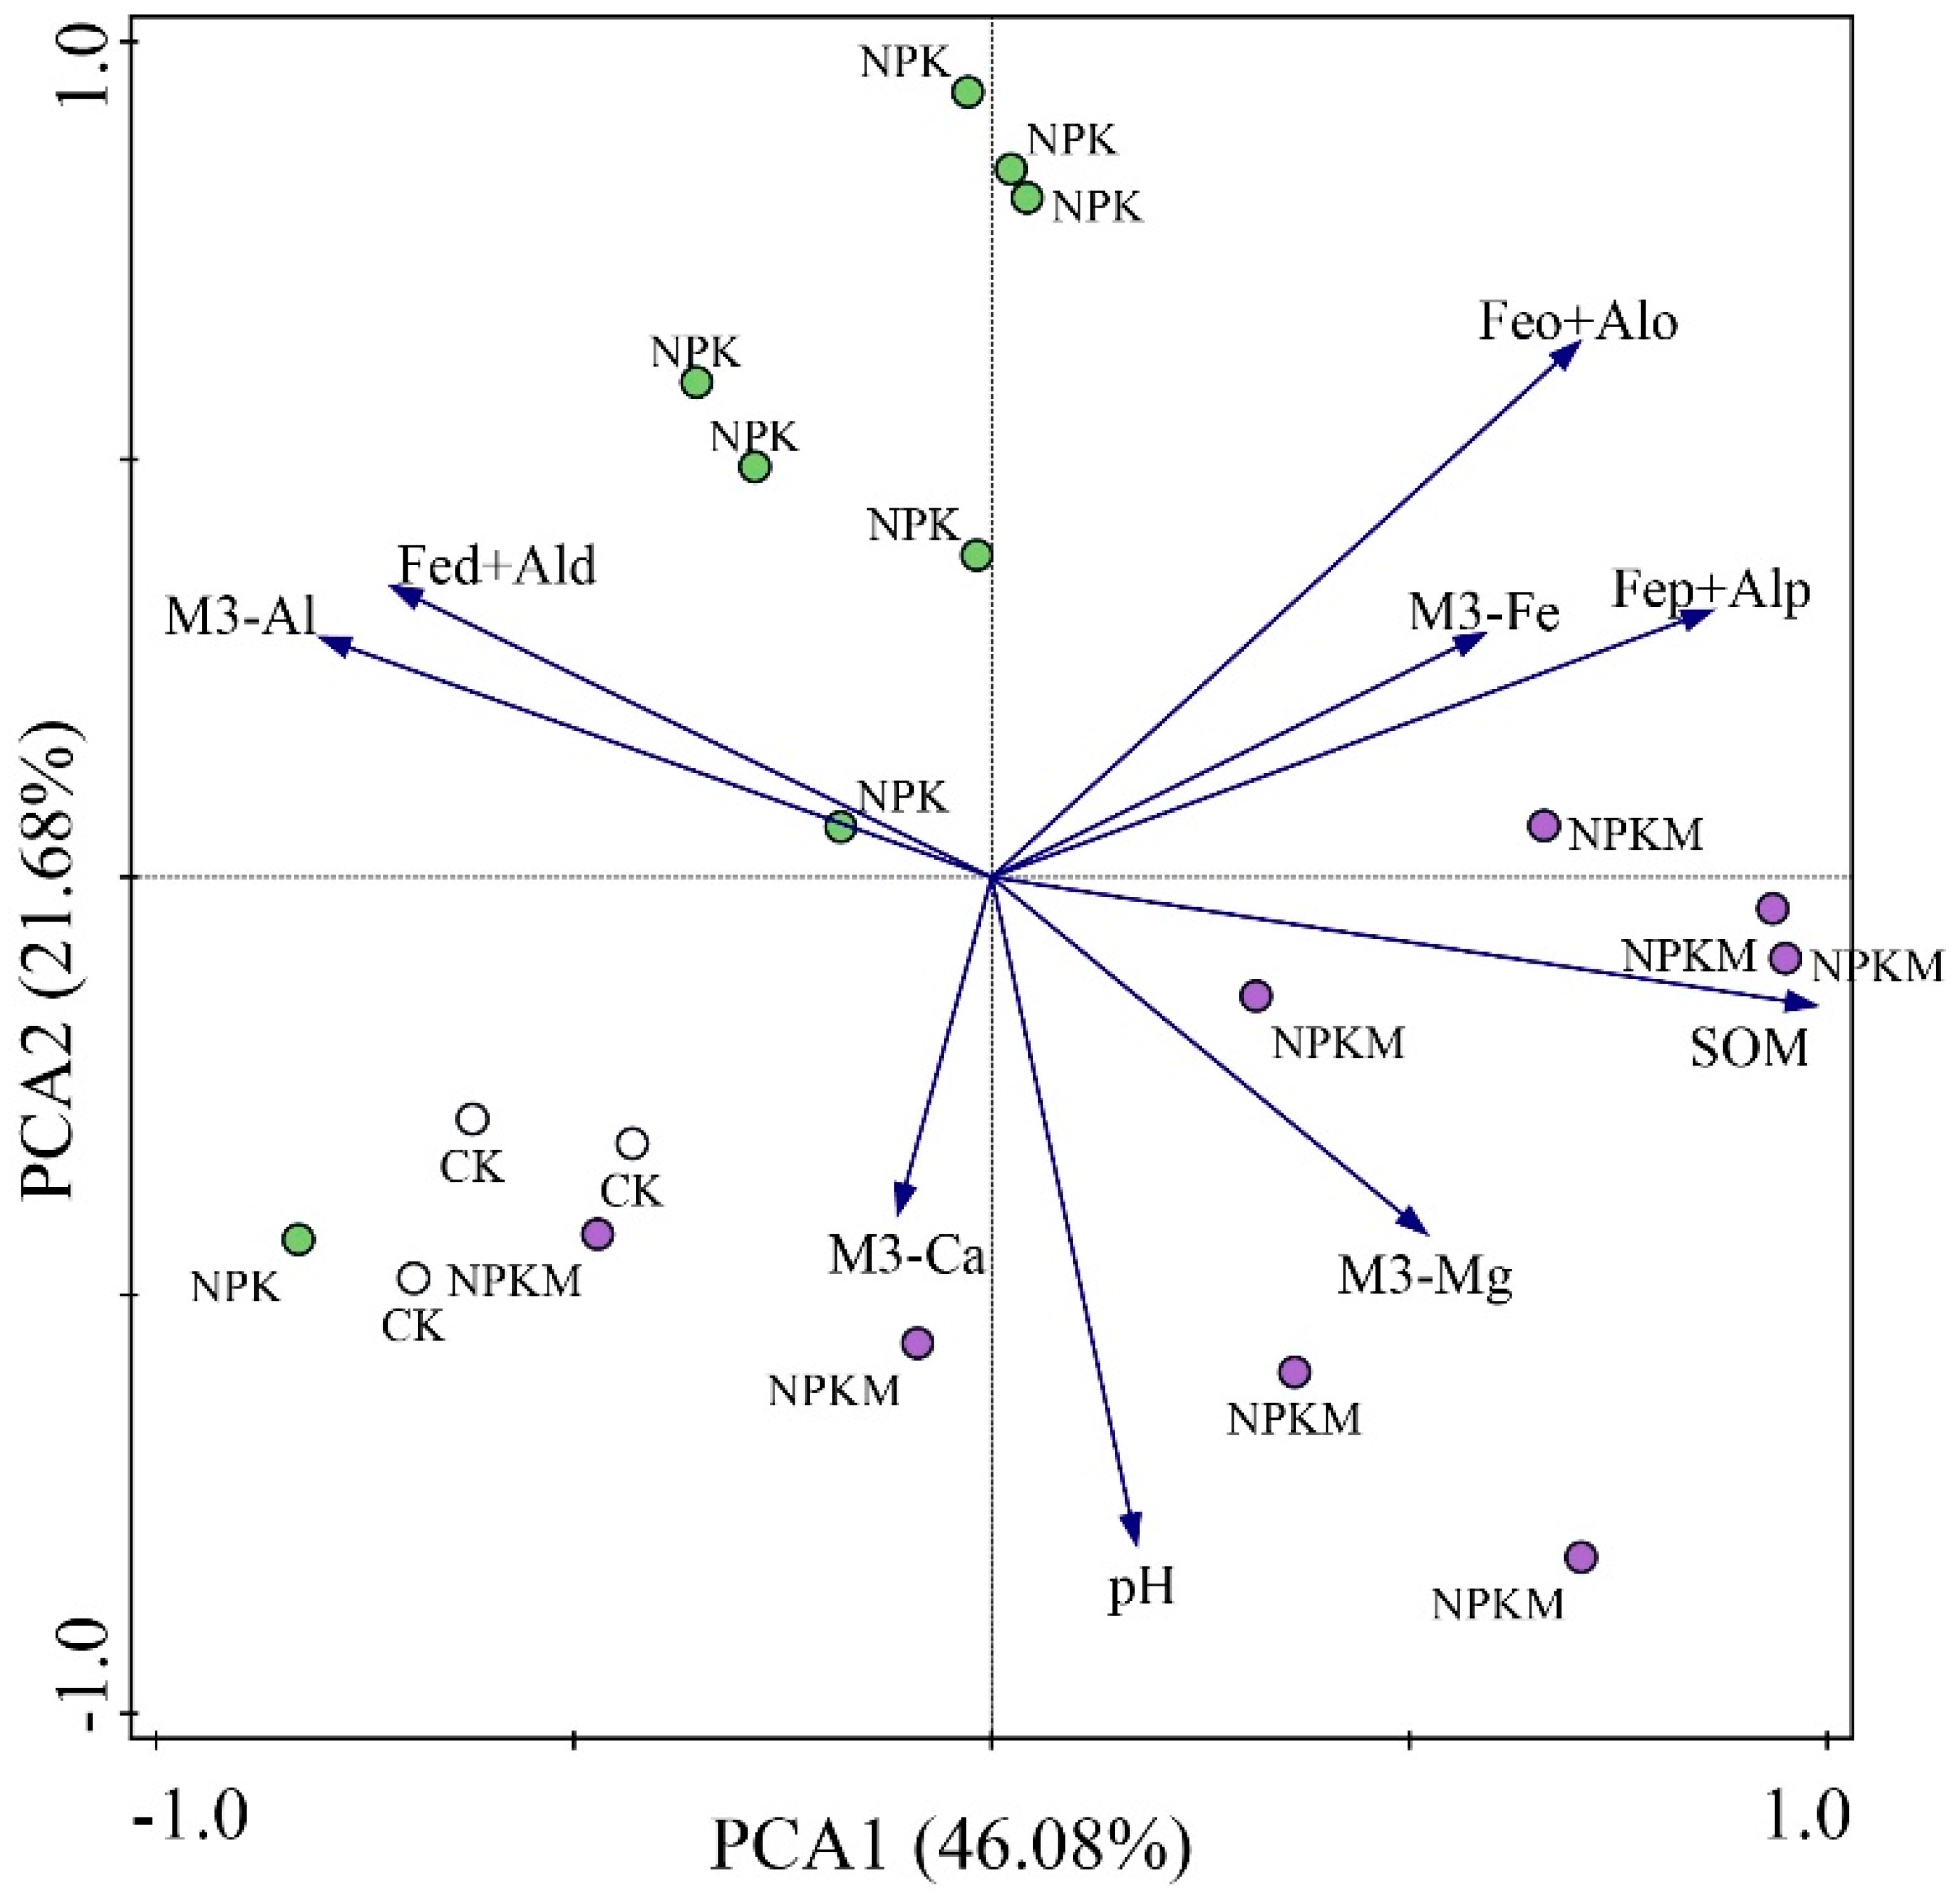
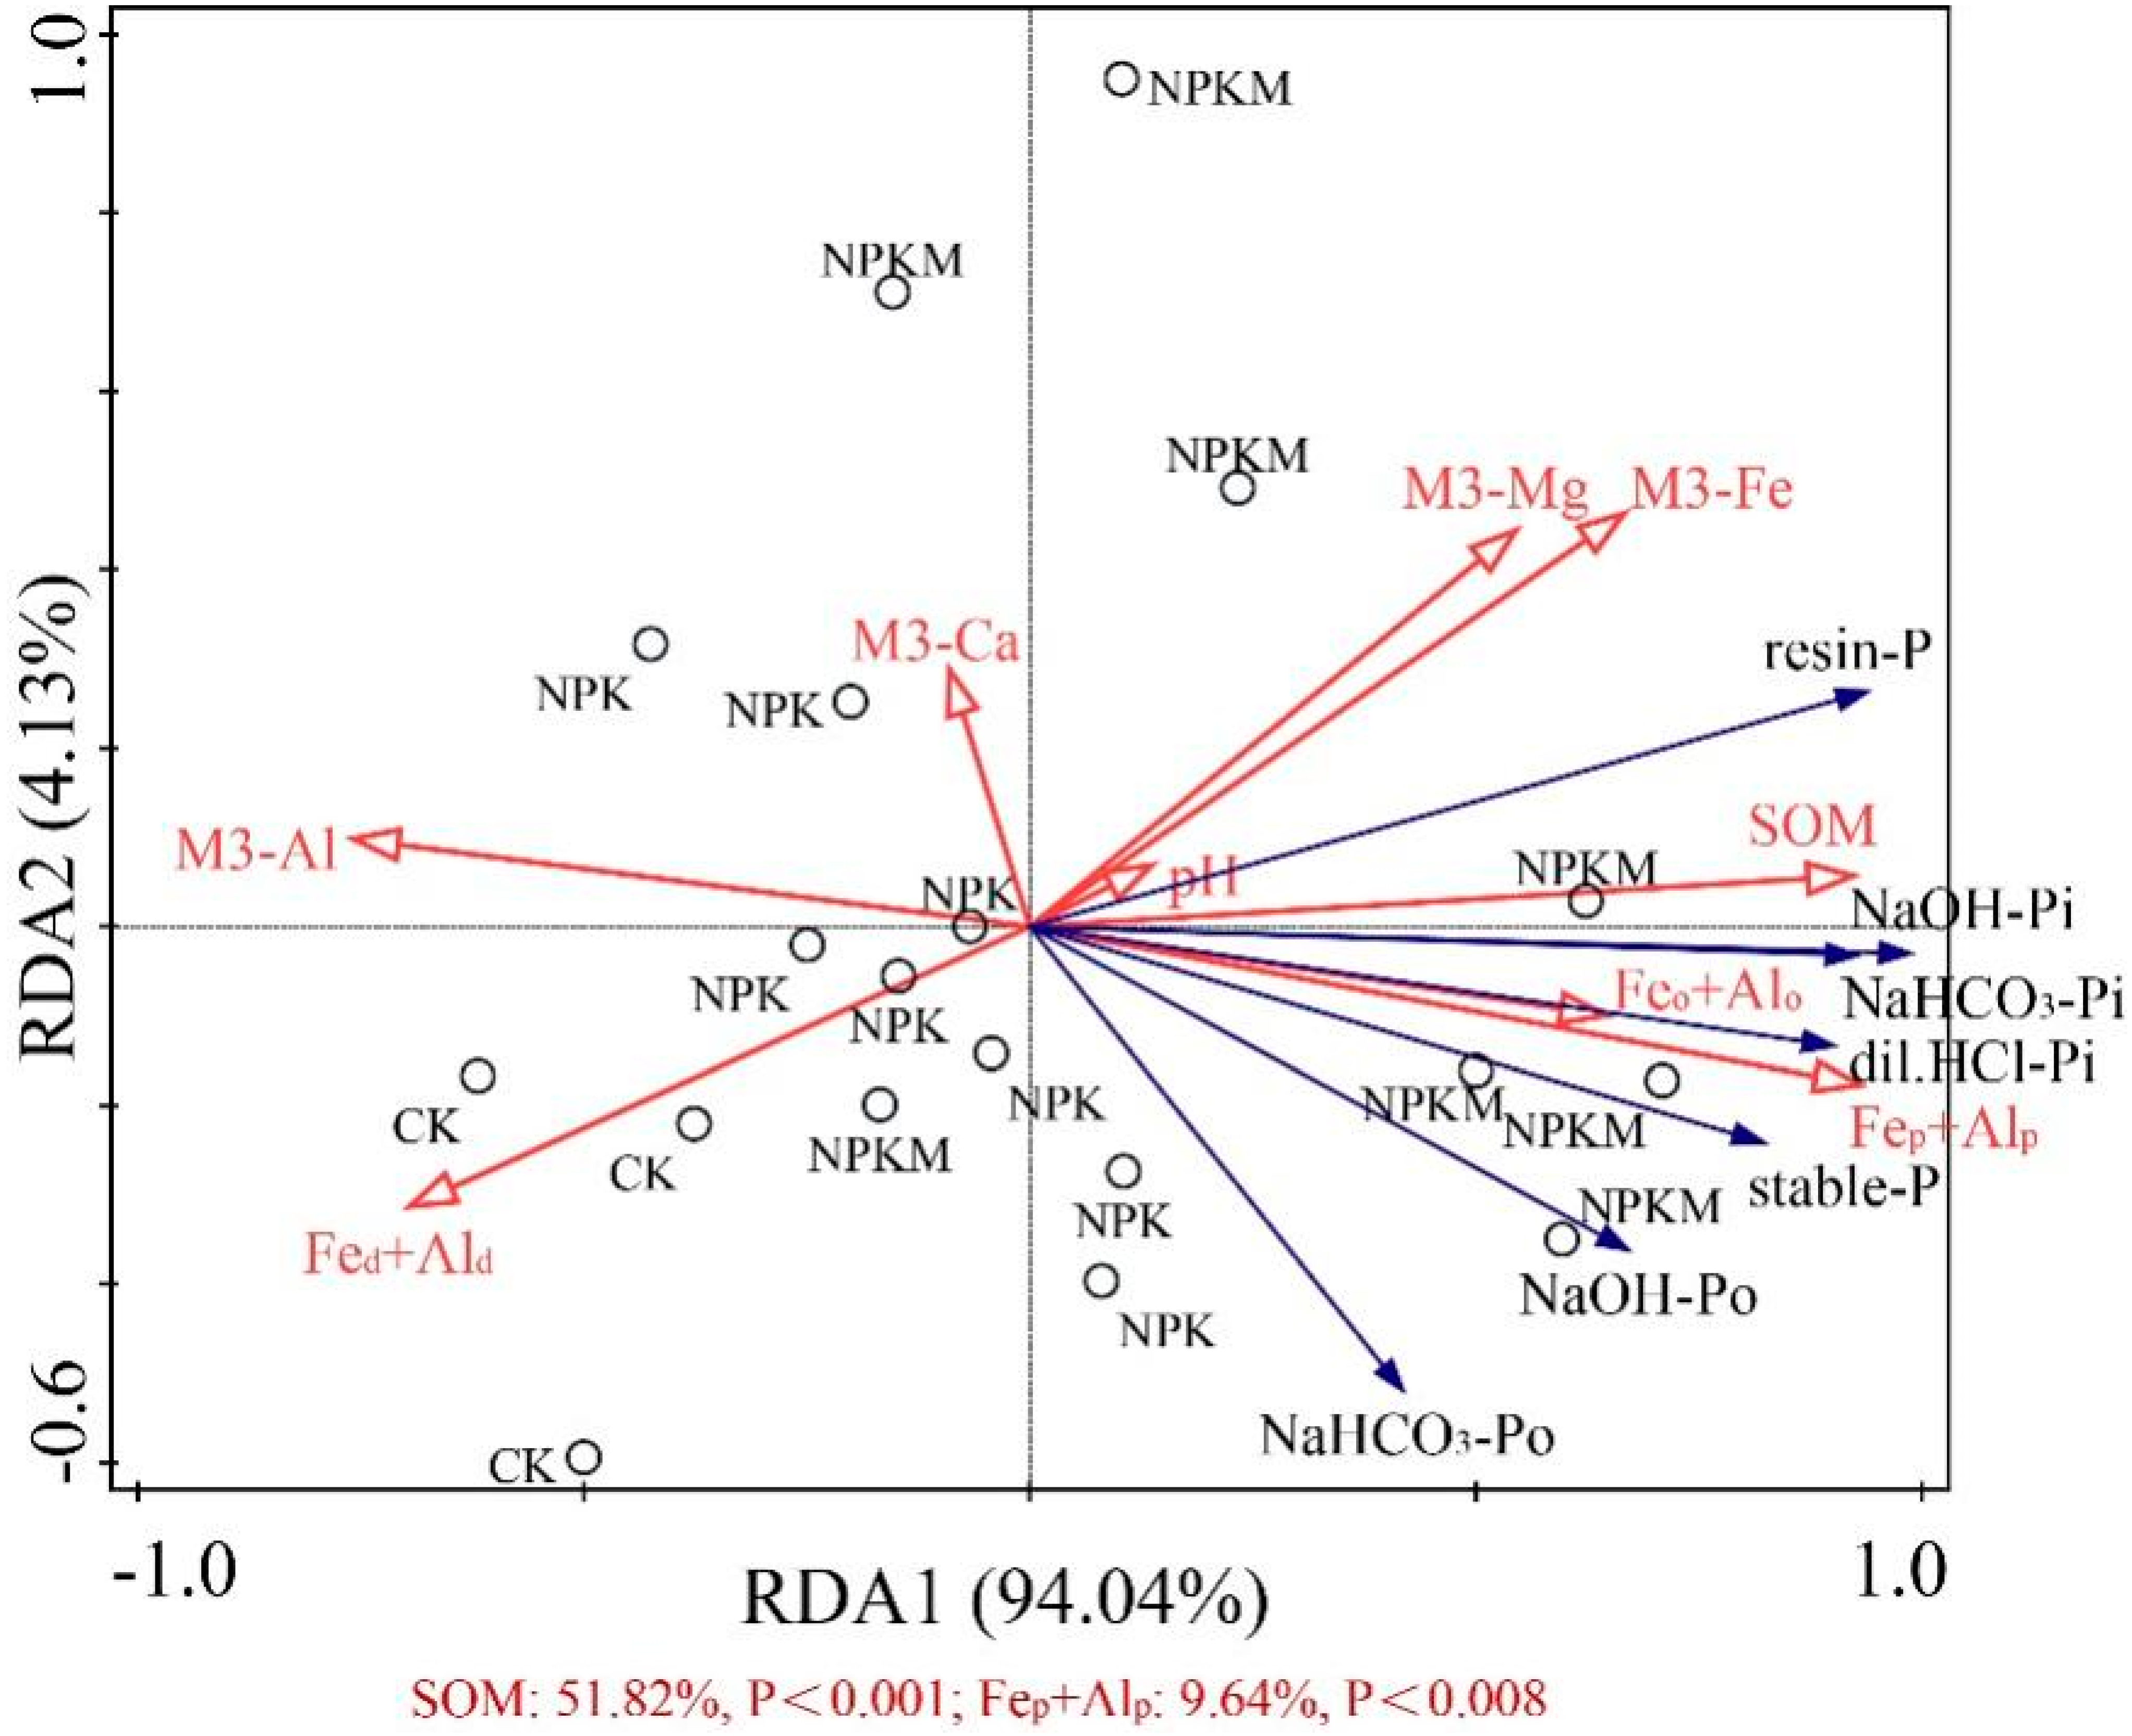
3.4. Soil Properties and Its Relationship with P Fraction

Regardless of the duration, when compared to CK in 1990, a lower pH value was observed in NPK treatment, while NPKM treatment could maintain soil pH and reduce acidification (Table 4). Compared to CK treatment, the content of SOM, Fep + Alp, and Feo + Alo showed a significant increasing trend, whereas Fed + Ald decreased in both fertilizer treatments, especially in NPKM treatment. In comparison with NPK treatment, the content of SOM, M3-Mg, Fep + Alp, and Feo + Alo was significantly increased, and the content of M3-Ca and M3-Al was decreased in NPKM treatment in 2018, respectively. Compared with NPK treatment, increased content of M3-Mg and M3-Ca but decreased content of M3-Al and M3-Fe in NPKM treatment indicated that plants showed different utilization choices of nutrient elements after different fertilization treatments.
The most closely correlated soil properties were SOM and different Fe-Al oxides for P fractions (Table A2). Moreover, the PCA indicated that the above-mentioned soil properties exhibited the most importance in the variance between both treatments (Figure A3). The redundancy analysis (RDA) test indicated that soil properties could explain 98.2% of soil P fraction variation across the P fertilization regime (Figure 5). Soil SOM and Fep + Alp explaining 51.8%, and 9.64%, respectively, were the major factors (P < 0.01) (Figure 5) and exhibited positive correlation with each P fraction (R2 = 0.46–0.93 *) (Table A2).

4. Discussion

4.1. Effect of Fertilization on the P Fractions with Multiple Techniques

Regardless of the fertilization regime, the stronger related coefficient in each Pi fraction than that in the Po fraction relative to total P indicated that P accumulated in the soil was mainly transformed into the Pi fraction (Figure A1). Moreover, the related coefficient between resin-P, NaHCO3-Pi, dil.HCl-Pi, and total P increased in soils treated with P fertilizer when compared with that in CK treatment, which indicated large of the increased accumulated P was plant-available, especially in the manure-amended treatment.
The distribution and transformation process of soil P species under different fertilization regimes could be comprehensively evaluated by the combined application of the Hedley sequential method and techniques of P-XANES and 31P-NMR [13,62]. Results showed that fertilization significantly increased the Pi accumulation in soil; specifically, the proportion of orthophosphate dominated by Al-P and Ca-P increased (Table 2). In addition to the direct input of inorganic phosphate fertilizer, a large number of inorganic P pools in manure was another main reason for the increase in soil Pi content [63]. The added organic fertilizer was pig and cattle manure in this studied soil, which contained 48.6% and 91.6% orthophosphate, respectively (Table A1). P-XANES results showed that long-term P fertilizers application resulted in a dominance of Ca-P, especially in the NPKM (Table 2). The formation of the Ca phosphates was the result of enrichment with Ca and P via manure, and many studies suggested that manure was rich in considerable amounts of Ca-P [17,64,65]. Furthermore, the proportion of HAP decreased or even could not be detected in NPKM treatment over the cultivation (Table 2). Similar results were obtained in gray desert soil and alkaline soil; TCP rather than HAP was the main accumulated Pi fraction in soil under long-term P fertilization, especially in the soil treated with organic fertilizer [8,15,27]. The possible reason was that presence of organic acids in manure could inhibit the crystallization and formation of HAP through stabilizing amorphous calcium phosphate (ACP) and delaying its subsequent transformation to thermodynamically more stable phases [63,66]. In addition, Mg showed an inhibitory effect on the Ca-P crystallization [67]. In this study, the content of M3-Mg in the soil increased significantly in NPKM treatment, which may be another reason for the less stable Ca-P [27]. Lower pH value was the main factor controlling for the decrease in HAP in NPK treatment compared to NPKM treatment (Table 4). The solubility of HAP showed a negative correlation with soil pH [68]. Once the highly active orthophosphate was released into the soil by HAP, Fe/Al-P could be formatted due to the high affinity of orthophosphate to Fe and Al (Hydr) oxides and might subsequently be retained in the soil as reserves. NaOH-Pi was dominated by Al-P (21.1% for NPK and 19.0% for NPKM) under P fertilization (Table 2). A similar result had been reported in previous studies that Al-P specie was considered as an effective source of Pi-solubilized with higher content than that of Fe-P-solubilized in Mollisol [29,41,69].
The soil Po content accounted for 20.6–62.1% with the 31P-NMR method (Table 3). Similar results were observed in the same area by Liu et al. [41]. However, the proportion of IHP determined by 31P-NMR was lower than that by P-XANES spectral analysis (Table 2 and Table 3). The possible reason was that the recovery rate of 31P-NMR was 20–60%, while the XANES spectrum detected the entire soil sample; meanwhile, it is difficult to detect various Po species by XANES [57,70]. These results indicated that a good consistency would be shown between 31P-NMR and P-XANES in the determination of samples containing a high concentration of IHP [8,19,70]. The 31P-NMR results showed that a lower proportion of Po in NPKM treatment was detected in 2018 than in 2000 (Table 3). The main reason was that the organic fertilizer was changed from pig manure (1990–2005) to cattle manure (2005–2018), reducing the input of phosphate and the accumulation of Po in soil.

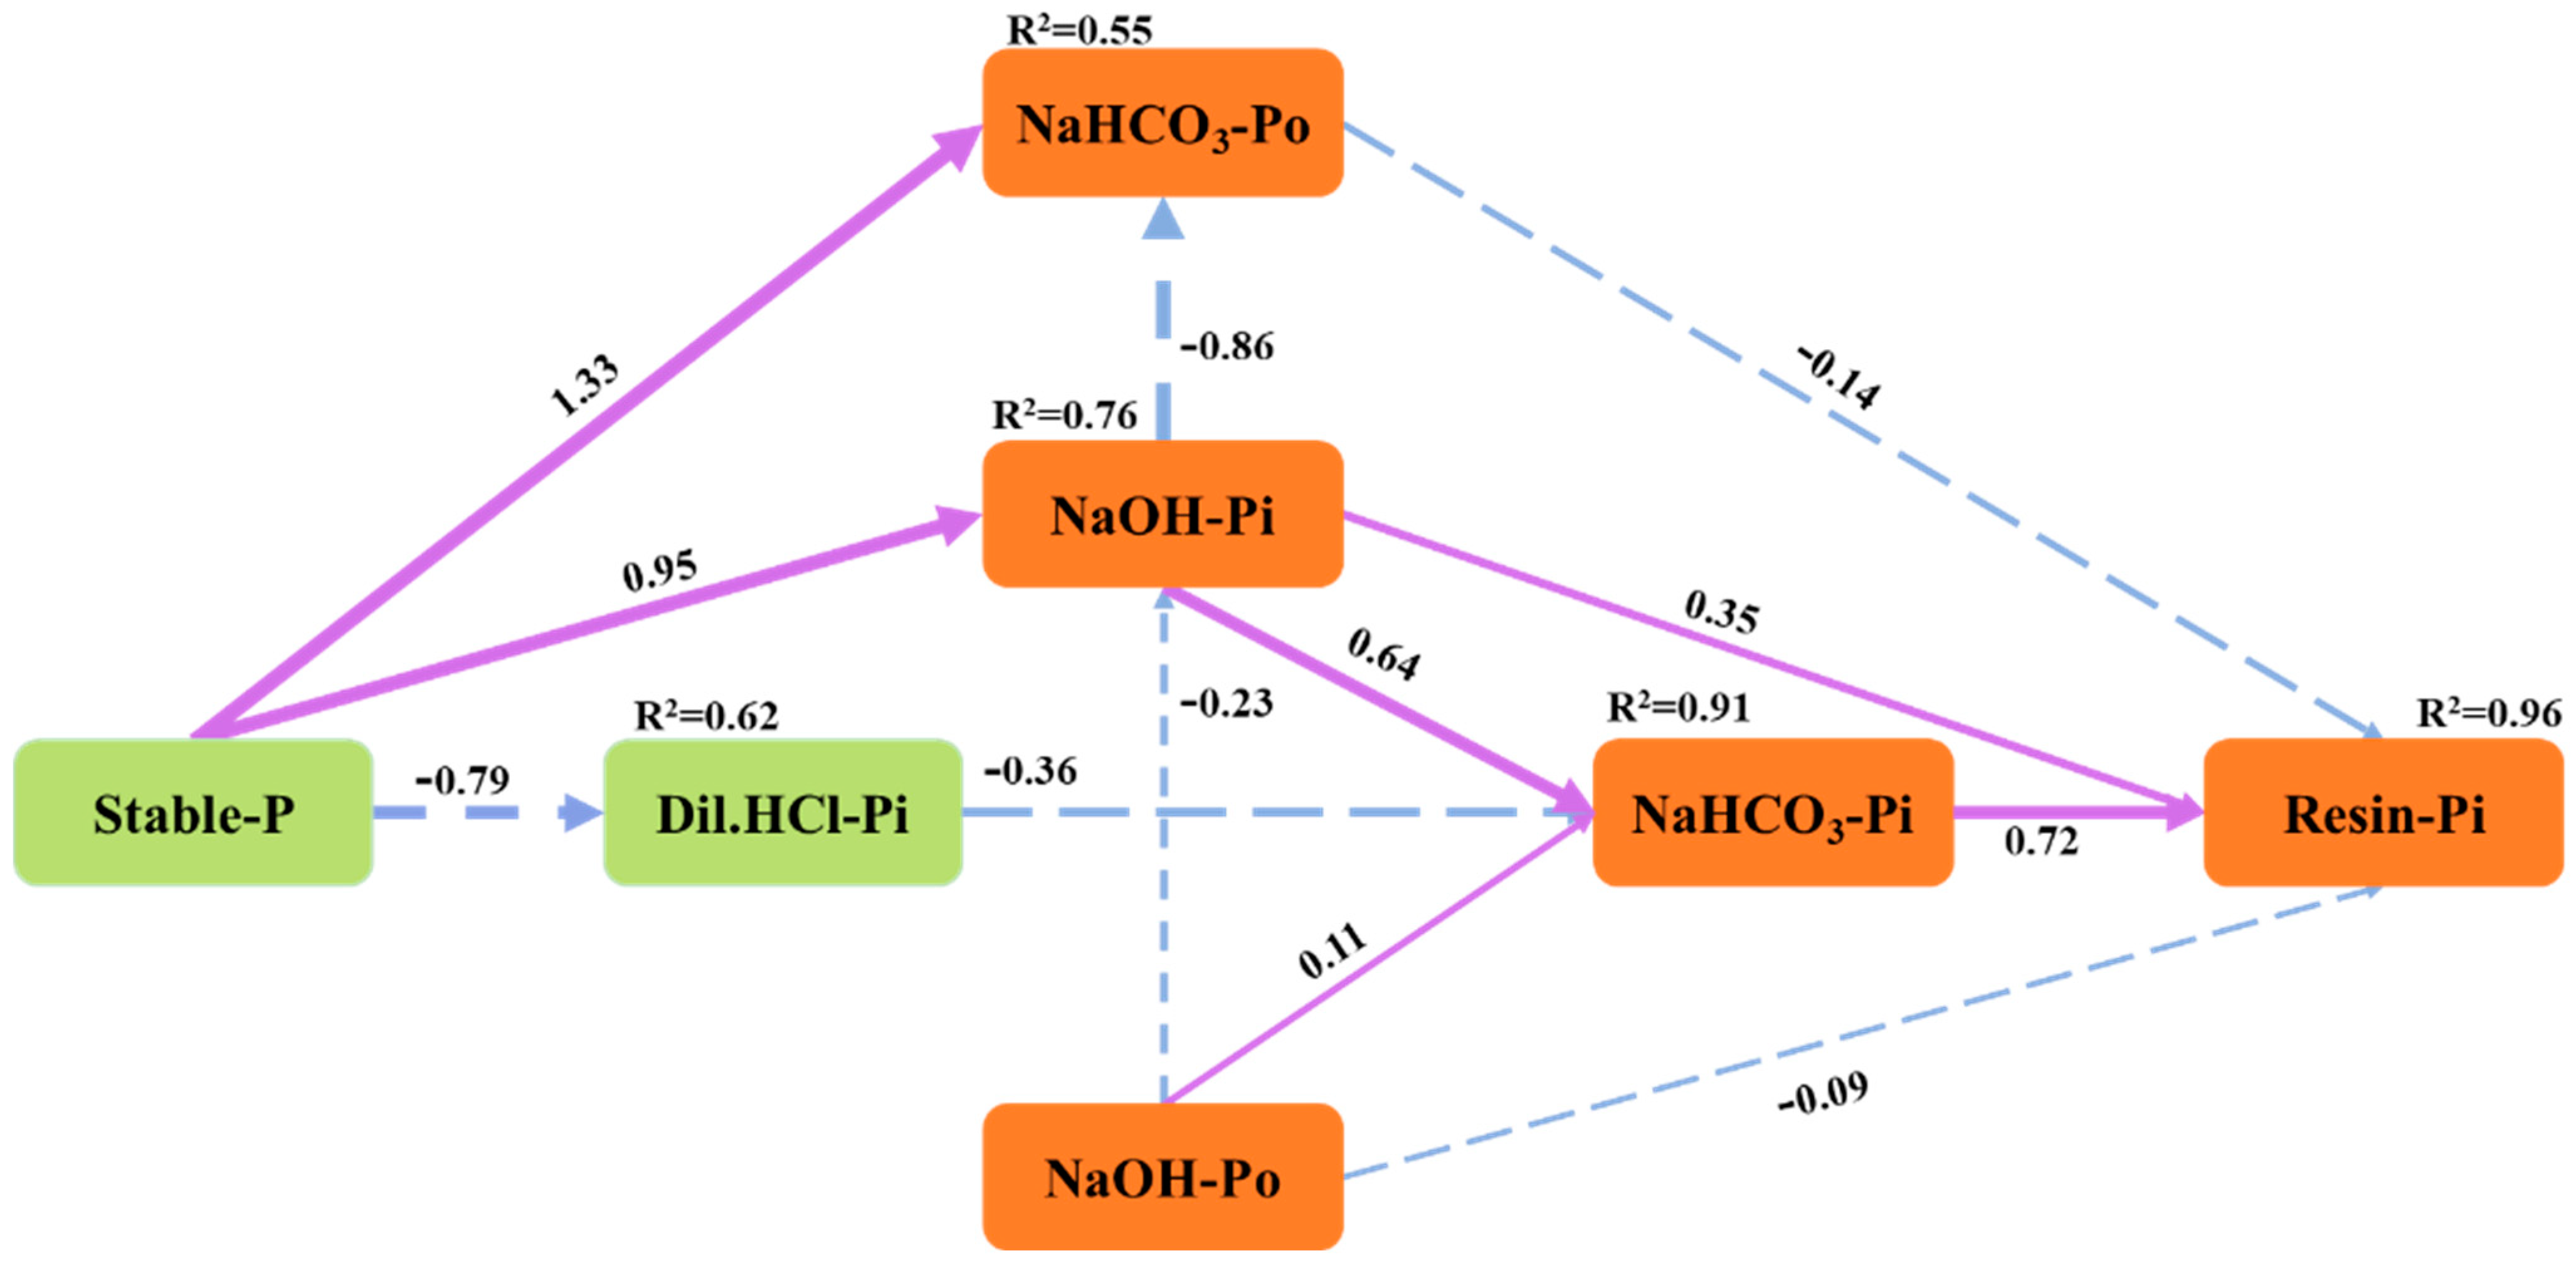
4.2. Transformation of Soil P Fractions

The transformation of solid-phase P speciation critically determines the bioavailability of soil P [48,71]. Our model revealed that soluble Pi (resin-Pi) was mainly affected by highly active Pi fractions (such as NaHCO3-Pi, NaOH-Pi), and stable P showed an indirect effect on resin-Pi through a transformation in Mollisol. Similar results had been verified on some unfertilized soils around the world by Hou et al. [25,26] and Tiessen et al. [26]. In fact, previous studies had confirmed that the Pi fraction was important to soil P dynamics and was considered the primary source of available P in fertilized soil [1,8,72]. In our study, the Pi fraction in fertilizer-treated soil accounted for 83.8–92.2% of Pt, and more than 60% of soil P was converted into a labile and mid-labile Pi fraction and accumulated in the soil (Figure 2 and Figure A1).
NaHCO3-Pi showed a greater direct effect on resin-Pi than other P fractions. As a short-term and plant-available P fraction, NaHCO3-Pi showed a strong correlation with resin-P and could quickly supplement the available P sources for plants when resin-Pi was depleted in soil [11]. NaOH-Pi was mainly related to Feo and Alo in soil, and it took a longer time to transform into plant-available P fractions by desorption or dissolution in comparison with NaHCO3-Pi [11]. NaOH-Pi showed a direct positive influence on resin-Pi (Figure 3), which is opposite to the results obtained in unfertilized soil by Hou et al. [25] and Tiessen et al. [26]. The reason is that the increased negatively charged functional groups in SOM could interact with Fe and Al (hydr) oxides, promoting the desorption of P on the surface of Fe and Al (hydr) oxides [34,73,74]. Hence, when resin-Pi in soil solution was exhausted, it could be immediately replenished by NaHCO3-Pi and NaOH-Pi. The possible reason for NaHCO3-Po and NaOH-Po showing negative and little total influence on resin-Pi in comparison to Pi was that mineralization limited the transformation of these Po fractions to resin-Pi [75].

4.3. Effects of Soil Property on Soil P Fractions

Fertilization affects soil P status through changing soil properties such as SOM, mineral composition, pH, and so on [24,32,76]. SOM and Fep + Alp were the main factors regulating the changes of P fractions (Figure 5). Fe/Al oxide exhibited great absorbability to phosphate because of the large amount of positive charge [77]. In this research, the change in the content of Fe/Al oxides and their correlation with SOM suggested that SOM could promote the transformation of Fe/Al oxides from crystalline to poorly crystalline (Table 4 and Figure A2) [20,77]. The transformation progresses decreased the P maximum buffering capacity and promoted the P desorption in the soil and improved the level of high active P fractions (Table A2) [32,34,73,78]. The possible reason was that the high content of SOM in the soil could interact with soil Fe and Al oxides in many ways (competitive adsorption sites, changing surface charge, cationic bridge, etc.) and increase the surface sites and charges, decomposition product from SOM competed with phosphate in the soil solution for adsorption sites, weakening the adsorption of soil to P [78,79]. Moreover, phosphate could form chemisorbed inner-sphere and outer-sphere complexes on the surface of Fe/Al oxides through ligand exchange reaction and electrostatic interaction and change the P adsorption by Fe and Al minerals [80,81,82]. In addition, our results indicated that the transformation ratio of NaOH-Po in NPK was higher than that in NPKM treatment (Figure A1). It was partly due to the influence of soil pH value. The adsorption capacity of Fe and Al (hydr) oxides to Po showed a negative relationship with soil pH [74].

5. Conclusions

A stronger positive related coefficient between soil total P and labile P and mid-labile fractions was found in the NPKM treatment compared to NPK treatment, which highlighted the positive effect of manure amendment on the soil P availability in this experimental field. This increment might be caused by the sufficient input of P fertilizer and higher SOM and Fep + Alp content in NPKM treatment, which resulted in the accumulation of labile P and mid-labile P pool, especially the proportion of Al-P, MCP, and TCP. A combination of modified Hedley extraction, P-XANES, and P-31NMR comprehensively indicated the soil P dynamics under P fertilization. Specifically, the available P pool was contributed by Al-P and MCP in NPK treatment and Al-P, MCP, and TCP in the NPKM treatment with P K-edge XANES. Meanwhile, a higher related coefficient with Hedley extraction proportion of IHP measured with P K-edge XANES and the ratio of orthophosphate diesters to monoesters was found in NPK treatment than in NPKM treatment indicated that mineral P fertilizer could facilitate the accumulation of soil Po, which showed higher soil Po lability. The structural equation model revealed that resin-P was positively and directly decided by NaHCO3-Pi and NaOH-Pi, and indirectivity affected by dil.HCl-Pi and stable P. This research revealed the changes and transformations in various soil P fractions under fertilization regimes and their chemical-associated mechanism in Mollisol. Meanwhile, these results give insight into the knowledge of optimizing fertilization regimes by the combination of chemical fertilizer with manure. However, the appropriate application amount of manure must be considered carefully to lower accumulation and subsequent loss of soil P, which could pose an adverse risk to the water environment.

Author Contributions

Conceptualization, S.Z. and J.L.; methodology, Q.W.; software, N.Z.; validation, N.Z., Y.C. and Q.W.; formal analysis, Y.J.; investigation, Z.Q.; resources, P.Z. and C.P.; data curation, Q.W.; writing—original draft preparation, Q.W.; writing—review and editing, G.C.; visualization, Q.W.; supervision, J.L.; project administration, S.Z.; funding acquisition, S.Z. and Y.C. All authors have read and agreed to the published version of the manuscript.

Funding

This research was supported by the National Natural Science Foundation of China (41977103 and 41471249) and the Reform and Development Fund of Beijing Academy of Agriculture and Forestry Sciences, China (YZS201905).

Data Availability Statement

The data sets generated and/or analyzed during the current study are available from the corresponding author upon reasonable request.

Acknowledgments

We thank all the staff for their valuable work at Jilin Academy of Agricultural Sciences associated with the long-term Monitoring Network of Soil Fertility and Fertilizer Effects in China and Agro-Environmental NMR Microstructure Lab, Institute of Environment and Sustainable Development in Agriculture, Chinese Academy of Agricultural Sciences. This research was supported by the National Natural Science Foundation of China (41977103 and 41471249) and the Reform and Development Fund of the Beijing Academy of Agriculture and Forestry Sciences, China (YZS201905).

Conflicts of Interest

The authors declare no conflict of interest.

Appendix A

Figure A1. The correlation between total P and each P fraction in CK (A,D,G), NPK (B,E,H) and NPKM (C,F,I) treatments under long-term experiment. Fitted curves were: y = Kx + b. CK, no fertilizer input; NPK treatment, applying N, P, K fertilizer; NPKM treatment, applying NPK and manure (pig manure from 1990 to 2004, and cattle manure from 2005 to 2018). Total P, the sum content of each P fraction extracted by the Hedley sequential method. * and ** mean the relationship between total P and P fraction in p < 0.05, p < 0.01 level, respectively.
Agronomy 12 02364 g0a1
Figure A2. The relationship between SOM and Fed + Ald (A), Fep + Alp (B), and Feo + Alo (C) under long-term field trial. Fitted curves were: y = Kx + b. SOM, soil organic matter; Fed and Ald, crystalline iron and aluminum oxide; Alo and Feo, amorphous Al and Fe oxide; Alp and Fep, organic-bound iron and alumina oxide. * and ** mean the relationship between total P and P fraction in p < 0.05, p < 0.01 level, respectively.
Agronomy 12 02364 g0a2
Figure A3. Correlation between soil properties under long-term different fertilization regimes with principal components analysis (PCA). The sum of the first two principal components (PC) of the soil properties accounted for 67.8% of the variance. CK, no fertilizer input; NPK treatment, applying N, P, K fertilizer; NPKM treatment, applying NPK and manure (pig manure from 1990 to 2004, and cattle manure from 2005 to 2018). Loadings for PC1 were dominated by SOM (0.47), M3-Fe (0.33), M3-Mg (0.27), M3-Al (−0.39), Fed + Ald (−0.38), Fep + Alp (0.44), whereas, loadings for PC2 were dominated by pH (−0.63), Feo + Alo (0.38) and M3-Ca (−0.39). SOM, soil organic matter; Fed and Ald, crystalline iron and aluminum oxide; Alo and Feo, amorphous Al and Fe oxide; Alp and Fep, organic-bound iron and alumina oxide. M3-Ca, M3-Mg, M3-Fe, and M3-Al were Ca, Mg, Fe, and Al extracted by Mehlich-3 extraction.
Agronomy 12 02364 g0a3
Table A1. The proportion of P fraction determined by integration of P-NMR signals of the studied soil under long-term field trial in Mollisol.
YearTreatmentOrthoPyroPolyPhosscyllo-IHPmyo-IHPneo-IHPα-Glycb
1990CK33.31.812.831.700.943.401.231.33
2000NPK47.20.920.013.730.764.661.033.31
NPKM63.01.260.410.090.445.690.151.02
2010NPK44.42.411.190.700.663.450.190.56
NPKM65.41.540.770.550.431.830.930.20
2018NPK60.12.730.081.050.492.461.370.61
NPKM77.31.250.820.080.361.390.080.10
Pig manure44.50.410.417.19 14.8
Cow manure87.60.090.322.51 0.41
YearTreatmentβ-GlycNuclPcholG6PMono1Mono2Mono3OrthDi
1990CK1.561.390.92 0.1043.602.952.81
2000NPK1.552.130.711.841.1323.805.551.26
NPKM1.200.910.350.250.7819.883.531.06
2010NPK1.750.740.980.451.8833.545.042.08
NPKM0.990.600.260.230.8021.453.110.95
2018NPK0.800.700.490.120.2927.510.360.86
NPKM0.490.440.210.220.7315.260.720.51
Pig manure 12.2 2.538.906.392.38
Cow manure1.890.30 3.581.630.191.53
Orthophosphate, Ortho; pyrophosphate, Pyro; polyphosphate, Poly; phosphonates, Phos; myo-inositol hexakisphosphate, myo-IHP; scyllo-inositol hexakisphosphate, Scyllo-IHP; neo-inositol hexakisphosphate, neo-IHP; α and β glycerophosphate, (α-glyc and β-glyc, respectively); mononucleotides, Nucl; choline phosphate, Pchol; glucose 6-phosphate, G6P; orthophosphate monoesters, regions 1, 2, and 3 (Mono1, Mono2, and Mono3, respectively); and orthophosphate diesters (OthDi). CK, no fertilizer input; NPK treatment, applying N, P, K fertilizer; NPKM treatment, applying NPK and manure (pig manure from 1990 to 2004, and cattle manure from 2005 to 2018).
Table A2. Correlation between soil properties and P fraction.
Resin-PNaHCO3-PiNaHCO3-PoNaOH-PiNaOH-Podil.HCl-PiStable P
SOM0.930 **0.883 **0.462 *0.825 **0.507 *0.916 **0.801 **
pH0.3530.3570.214−0.003−0.1900.4040.117
Fed + Ald−0.703 **−0.559 *−0.180−0.559 *−0.410−0.564 *−0.530 *
Fep + Alp0.790 **0.788 **0.537 *0.944 **0.824 **0.755 **0.854 **
Feo + Alo0.522 *0.542 *0.3850.721 **0.627 **0.514 *0.641 **
M3-Ca−0.039−0.188−0.262−0.105−0.199−0.083−0.069
M3-Mg0.645 **0.563 *0.1370.418−0.0370.553 *0.249
M3-Al−0.772 **−0.748 **−0.458 *−0.686 **−0.483 *−0.826 **−0.754 **
M3-Fe0.548 *0.3410.0630.616 **0.4290.2840.465 *
SOM, soil organic matter; Fed + Ald were the sum of free iron (Fe) and aluminum (Al) oxide; Feo + Alo were the sum of amorphous Fe and Al oxides; Fep + Alp were the sum of humus complex Fe and Al oxides; M3-Ca, M3-Mg, M3-Fe, and M3-Al were Ca, Mg, Fe, and Al extracted by Mehlich-3 extraction. * and ** mean the relationship between soil properties and P fraction in p < 0.05, p < 0.01 level, respectively.

References

  1. Qin, X.; Guo, S.; Zhai, L.; Pan, J.; Khoshnevisan, B.; Wu, S.; Wang, H.; Yang, B.; Ji, J.; Liu, H. How long-term excessive manure application affects soil phosphorous species and risk of phosphorous loss in fluvo-aquic soil. Environ. Pollut. 2020, 266 Pt 2, 115304. [Google Scholar] [CrossRef] [PubMed]
  2. Medinski, T.; Freese, D.; Reitz, T. Changes in soil phosphorus balance and phosphorus-use efficiency under long-term fertilization conducted on agriculturally used Chernozem in Germany. Can. J. Soil Sci. 2018, 98, 650–662. [Google Scholar] [CrossRef]
  3. Zhang, F. Scientific understanding of the role of chemical fertilizer. China Agric. Technol. Ext. 2017, 33, 16–19. (In Chinese) [Google Scholar] [CrossRef]
  4. MacDonald, J.; Chantigny, M.; Royer, I.; Angers, D.; Rochette, P.; Gasser, M. Soil soluble carbon dynamics of manured and unmanured grasslands following chemical kill and ploughing. Geoderma 2011, 164, 64–72. [Google Scholar] [CrossRef]
  5. Cade-Menun, B. Characterizing phosphorus in animal waste with solution 31P NMR spectroscopy. In Environmental Chemistry of Animal Manure; Nova Science Publishers: New York, NY, USA, 2011; pp. 275–299. [Google Scholar]
  6. Wang, Q.; Zhan, X.; Zhang, S.; Peng, C.; Gao, H.; Zhang, X.; Zhu, P.; Colinet, G. Increment of soil phosphorus pool and activation coefficient through long-term combination of NPK fertilizers with manures in black soil. J. Plant Nutr. Fertil. 2018, 24, 1679–1688. (In Chinese) [Google Scholar] [CrossRef]
  7. Wang, Q.; Qin, Z.; Zhang, W.; Chen, Y.; Zhu, P.; Peng, C.; Wang, L.; Zhang, S.; Colinet, G. Effect of long-term fertilization on phosphorus fractions in different soil layers and their quantitative relationships with soil properties. J. Integr. Agr. 2022, 21, 2–15. [Google Scholar] [CrossRef]
  8. Liu, J.; Han, C.; Zhao, Y.; Yang, J.; Cade-Menun, B.; Hu, Y.; Li, J.; Liu, H.; Sui, P.; Chen, Y.; et al. The chemical nature of soil phosphorus in response to long-term fertilization practices: Implications for sustainable phosphorus management. J. Clean. Prod. 2020, 272, 123093. [Google Scholar] [CrossRef]
  9. Wu, Q.; Zhang, S.; Zhu, P.; Huang, S.; Wang, B.; Zhao, L.; Xu, M. Characterizing differences in the phosphorus activation coefficient of three typical cropland soils and the influencing factors under long-term fertilization. PLoS ONE 2017, 12, e0176437. [Google Scholar] [CrossRef]
  10. Yang, L.; Yang, Z.; Zhong, X.; Xu, C.; Lin, Y.; Fan, Y.; Wang, M.; Chen, G.; Yang, Y. Decreases in soil P availability are associated with soil organic P declines following forest conversion in subtropical China. Catena 2021, 205, 105459. [Google Scholar] [CrossRef]
  11. Tiessen, H.; Moir, J.O. Characterization of Available P by Sequential Extraction. In Soil Sampling and Methods of Analysis, 2nd ed.; Carter, M.R., Gregorich, E.G., Eds.; CRC Press: Boca Raton, FL, USA, 2007; pp. 293–306. [Google Scholar] [CrossRef]
  12. Hedley, M.; Stewart, J.; Chauhan, B. Changes in inorganic and organic soil phosphorus fractions induced by cultivation practices and by laboratory incubations. Soil Sci. Soc. Am. J. 1982, 46, 970–976. [Google Scholar] [CrossRef]
  13. Liu, J.; Sui, P.; Cade-Menun, B.; Hu, Y.; Yang, J.; Huang, S.; Ma, Y. Molecular-level understanding of phosphorus transformation with long-term phosphorus addition and depletion in an alkaline soil. Geoderma 2019, 353, 116–124. [Google Scholar] [CrossRef]
  14. Liu, J.; Yang, J.; Cade-Menun, B.; Liang, X.; Hu, Y.; Liu, C.; Zhao, Y.; Li, L.; Shi, J. Complementary Phosphorus Speciation in Agricultural Soils by Sequential Fractionation, Solution 31P Nuclear Magnetic Resonance, and Phosphorus K-edge X-ray Absorption Near-Edge Structure Spectroscopy. J. Environ. Qual. 2013, 42, 1763–1770. [Google Scholar] [CrossRef] [PubMed]
  15. Liu, J.; Hu, Y.; Yang, J.; Abdi, D.; Cade-Menun, B. Investigation of soil legacy phosphorus transformation in long-term agricultural fields using sequential fractionation, P K-edge XANES and solution P NMR spectroscopy. Environ. Sci. Technol. 2015, 49, 168–176. [Google Scholar] [CrossRef] [PubMed]
  16. Vogel, C.; Rivard, C.; Tanabe, I.; Adam, C. Microspectroscopy—Promising techniques to characterize phosphorus in soil. Commun. Soil Sci. Plant Anal. 2016, 47, 2088–2102. [Google Scholar] [CrossRef]
  17. Toor, G.; Hunger, S.; Peak, J.; Sims, J.; Sparks, D. Advances in the Characterization of phosphorus in organic wastes: Environmental and agronomic applications. Adv. Agron. 2006, 89, 1–72. [Google Scholar] [CrossRef]
  18. Liu, J.; Yang, J.; Hu, Y.; Li, J.; Zhang, X.; Ma, Y. Molecular speciation of phosphorus in an organically bound phosphorus fertilizer with high phytoavailability characterized by multiple spectroscopy. Spectrosc. Spect. Anal. 2018, 38, 958–962. [Google Scholar] [CrossRef]
  19. Weyers, E.; Strawn, D.; Peak, D.; Moore, A.; Baker, L.; Cade-Menum, B. Phosphorus speciation in dairy manure-amended calcareous soils. Soil Sci. Soc. Am. J. 2016, 80, 1531–1542. [Google Scholar] [CrossRef]
  20. Abdala, D.; da Silva, I.; Vergütz, L.; Sparks, D. Long-term manure application effects on phosphorus speciation, kinetics and distribution in highly weathered agricultural soils. Chemosphere 2015, 119, 504–514. [Google Scholar] [CrossRef]
  21. Kizewski, F.; Liu, Y.; Morris, A.; Hesterberg, D. Spectroscopic approaches for phosphorus speciation in soils and other environmental systems. J. Environ. Qual. 2011, 40, 751–766. [Google Scholar] [CrossRef]
  22. Beauchemin, S.; Hesterberg, D.; Chou, J.; Beauchemin, M.; Simard, R.; Sayers, D. Speciation of phosphorus in phosphorus-enriched agricultural soils using X-ray absorption near-edge structure spectroscopy and chemical fractionation. J. Environ. Qual. 2003, 32, 1809–1819. [Google Scholar] [CrossRef]
  23. Liang, X.; Jin, Y.; He, M.; Liu, Y.; Hua, G.; Wang, S.; Tian, G. Composition of phosphorus species and phosphatase activities in a paddy soil treated with manure at varying rates. Agric. Ecosyst. Environ. 2017, 237, 173–180. [Google Scholar] [CrossRef]
  24. Hou, E.; Wen, D.; Kuang, Y.; Cong, J.; Chen, C.; He, X.; Heenan, M.; Lu, H.; Zhang, Y. Soil pH predominantly controls the forms of organic phosphorus in topsoils under natural broadleaved forests along a 2500 km latitudinal gradient. Geoderma 2018, 315, 65–74. [Google Scholar] [CrossRef]
  25. Hou, E.; Chen, C.; Kuang, Y.; Zhang, Y.; Heenan, M.; Wen, D. A structural equation model analysis of phosphorus transformations in global unfertilized and uncultivated soils. Glob. Biogeochem. Cycles 2016, 30, 1300–1309. [Google Scholar] [CrossRef]
  26. Tiessen, H.; Stewart, J.; Cole, C. Pathways of phosphorus transformations in soils of differing pedogenesis. Soil Sci. Soc. Am. J. 1984, 48, 853–858. [Google Scholar] [CrossRef]
  27. Yan, Z.; Chen, S.; Dari, B.; Sihi, D.; Chen, Q. Phosphorus transformation response to soil properties changes induced by manure application in a calcareous soil. Geoderma 2018, 322, 163–171. [Google Scholar] [CrossRef]
  28. MacDonald, G.; Bennett, E.; Taranu, Z. The influence of time, soil characteristics, and land-use history on soil phosphorus legacies: A global meta-analysis. Glob. Chang. Biol. 2012, 18, 1904–1917. [Google Scholar] [CrossRef]
  29. Yang, X.; Chen, X.; Yang, X. Phosphorus release kinetics and solubility capacity of phosphorus fractionation induced by organic acids from a black soil in northeast China. Can. J. Soil Sci. 2019, 99, 92–99. [Google Scholar] [CrossRef]
  30. van der Bom, F.; McLaren, T.; Doolette, A.; Magid, J.; Frossard, E.; Oberson, A.; Jensen, L. Influence of long-term phosphorus fertilisation history on the availability and chemical nature of soil phosphorus. Geoderma 2019, 355, 113909. [Google Scholar] [CrossRef]
  31. Poblete-Grant, P.; Suazo-Hernández, J.; Condron, L.; Rumpel, C.; Demanet, R.; Malone, S.; de La Luz Mora, M. Soil available P, soil organic carbon and aggregation as affected by long-term poultry manure application to Andisols under pastures in Southern Chile. Geoderma Reg. 2020, 21, e00271. [Google Scholar] [CrossRef]
  32. Redel, Y.; Cartes, P.; Demanet, R.; Velásquez, G.; Poblete-Grant, P.; Bol, R.; Mora, M. Assessment of phosphorus status influenced by Al and Fe compounds in volcanic grassland soils. J. Soil Sci. Plant Nutr. 2016, 16, 490–506. [Google Scholar] [CrossRef]
  33. Guppy, C.; Menzies, N.; Moody, P.; Blamey, F. Competitive sorption reactions between phosphorus and organic matter in soil: A review. Soil Res. 2005, 43, 189–202. [Google Scholar] [CrossRef]
  34. Wang, Q.; Zhan, X.; Zhang, S.; Peng, C.; Gao, H.; Zhang, X.; Zhu, P.; Colinet, G. Phosphorus adsorption and desorption characteristics and its response to soil properties of black soil under long-term different fertilization. Sci. Agric. Sin. 2019, 52, 3866–3877. (In Chinese) [Google Scholar] [CrossRef]
  35. Wang, H.; Zhu, J.; Fu, Q.; Xiong, J.; Hong, C.; Hu, H.; Violante, A. Adsorption of phosphate onto ferrihydrite and ferrihydrite-humic acid complexes. Pedosphere 2015, 25, 405–414. [Google Scholar] [CrossRef]
  36. Chang, C.; Sommerfeldt, T.; Entz, T. Soil chemistry after eleven annual applications of cattle feedlot manure. J. Environ. Qual. 1991, 20, 475–480. [Google Scholar] [CrossRef]
  37. Nobile, M.; Bravin, M.; Becquer, T.; Paillat, J. Phosphorus sorption and availability in an andosol after a decade of organic or mineral fertilizer applications: Importance of pH and organic carbon modifications in soil as compared to phosphorus accumulation. Chemosphere 2020, 239, 124709. [Google Scholar] [CrossRef] [PubMed]
  38. Kar, G.; Schoenau, J.; Hilger, D.; Peak, D. Direct chemical speciation of soil phosphorus in a Saskatchewan Chernozem after long- and short-term manure amendments. Can. J. Soil Sci. 2017, 97, 626–636. [Google Scholar] [CrossRef]
  39. Yao, Q.; Liu, J.; Yu, Z.; Li, Y.; Jin, J.; Liu, X.; Wang, G. Three years of biochar amendment alters soil physiochemical properties and fungal community composition in a black soil of northeast China. Soil Biol. Biochem. 2017, 110, 56–67. [Google Scholar] [CrossRef]
  40. Soil Survey Staff. Keys to Soil Taxonomy, 12th ed.; USDA, US Government Printing Office: Washington, DC, USA, 2014; pp. 211–212.
  41. Liu, J.; Yang, J.; Cade-Menun, B.; Hu, Y.; Li, J.; Peng, C.; Ma, Y. Molecular speciation and transformation of soil legacy phosphorus with and without long-term phosphorus fertilization: Insights from bulk and microprobe spectroscopy. Sci. Rep. 2017, 7, 15354. [Google Scholar] [CrossRef]
  42. Skjemstad, J.; Baldock, J. Total and organic carbon. In Soil Sampling and Methods of Analysis; Carter, M.R., Gregorich, E.G., Eds.; CRC: Boca Raton, FL, USA, 2007; pp. 225–237. [Google Scholar]
  43. Lu, R. Soil and Agro-Chemistry Analytical Method; China Agricultural Science and Technology Press: Beijing, China, 1999. (In Chinese) [Google Scholar]
  44. Mehra, O.; Jackson, M. Iron oxide removal from soils and clays by a dithionite-citrate system buffered with sodium bicarbonate. Clay. Clay Miner. 2013, 7, 317–327. [Google Scholar] [CrossRef]
  45. Mckeague, J.; Brydon, J.; Miles, N. Differentiation of forms of extractable Iron and Aluminum in soils. Soil. Sci. Soc. Am. J. 1971, 35, 33–38. [Google Scholar] [CrossRef]
  46. Loveland, P.; Digby, P. The extraction of Fe and Al by 0.1 M pyrophosphate solutions: A comparison of some techniques. Eur. J. Soil. Sci. 1984, 35, 243–250. [Google Scholar] [CrossRef]
  47. Mehlich, A. Mehlich 3 soil test extractant: A modification of Mehlich 2 extractant. Commun. Soil. Sci. Plan. 2008, 15, 1409–1416. [Google Scholar] [CrossRef]
  48. Yang, X.; Post, W. Phosphorus transformations as a function of pedogenesis: A synthesis of soil phosphorus data using Hedley fractionation method. Biogeosciences 2011, 8, 2907–2916. [Google Scholar] [CrossRef]
  49. Cross, A.; Schlesinger, W. A literature review and evaluation of the Hedley fractionation: Applications to the biogeochemical cycle of soil phosphorus in natural ecosystems. Geoderma 1995, 64, 197–214. [Google Scholar] [CrossRef]
  50. Bowman, R.; Cole, C. Transformations of organic phosphorus substances in soils as evaluated by NaHCO3 extraction. Soil Sci. 1978, 125, 49–54. [Google Scholar] [CrossRef]
  51. Condron, L.; Newman, S. Revisiting the fundamentals of phosphorus fractionation of sediments and soils. J. Soils Sediments 2011, 11, 830–840. [Google Scholar] [CrossRef]
  52. Hedley, M.; Nye, P.; White, R. Plant-Induced Changes in the Rhizosphere of Rape (Brassica napus Var. Emerald) Seedlings. N. Phytol. 1983, 95, 69–82. [Google Scholar] [CrossRef]
  53. Schmieder, F.; Bergström, L.; Riddle, M.; Gustafsson, J.; Klysubun, W.; Zehetner, F.; Condrond, L.; Kirchmanna, H. Phosphorus speciation in a long-term manure-amended soil profile–evidence from wet chemical extraction,31P-NMR and P K-edge XANES spectroscopy. Geoderma 2018, 322, 19–27. [Google Scholar] [CrossRef]
  54. Li, F.; Liang, X.; Zhang, H.; Tian, G. The influence of no-till coupled with straw return on soil phosphorus speciation in a two-year rice-fallow practice. Soil Tillage Res. 2019, 195, 104389. [Google Scholar] [CrossRef]
  55. Zuo, M.; Renman, G.; Gustafsson, J.; Renman, A. Phosphorus removal performance and speciation in virgin and modified argon oxygen decarburisation slag designed for wastewater treatment. Water Res. 2015, 87, 271–281. [Google Scholar] [CrossRef]
  56. Ravel, B.; Newville, M. ATHENA, ARTEMIS, HEPHAESTUS: Data analysis for X-ray absorption spectroscopy using IFEFFIT. J. Synchrotron Radiat. 2005, 12, 537–541. [Google Scholar] [CrossRef] [PubMed]
  57. Cade-Menun, B. Improved peak identification in 31P-NMR spectra of environmental samples with a standardized method and peak library. Geoderma 2015, 257–258, 102–114. [Google Scholar] [CrossRef]
  58. Schneider, K.; Cade-Menun, B.; Lynch, D.; Voroney, R. Soil Phosphorus Forms from Organic and Conventional Forage Fields. Soil Biol. Biochem. 2016, 80, 328–340. [Google Scholar] [CrossRef]
  59. Young, E.; Ross, D.; Cade-Menun, B.; Liu, C. Phosphorus Speciation in Riparian Soils: A Phosphorus-31 Nuclear Magnetic Resonance Spectroscopy and Enzyme Hydrolysis Study. Soil Sci. Soc. Am. J. 2013, 77, 1636–1647. [Google Scholar] [CrossRef]
  60. Grace, J.; Anderson, T.; Olff, H.; Scheiner, S. On the specification of structural equation models for ecological systems. Ecol. Monogr. 2010, 80, 67–87. [Google Scholar] [CrossRef]
  61. Rosseel, Y. Iavaan: An R package for structural equation modeling and more Version 0.5-12 (BETA). J. Stat. Softw. 2010, 48, 1–36. [Google Scholar]
  62. Koch, M.; Kruse, J.; Eichler-Lobermann, B.; Zimmer, D.; Willbold, S.; Leinweber, P.; Siebers, N. Phosphorus stocks and speciation in soil profiles of a longterm fertilizer experiment: Evidence from sequential fractionation, P K-edge XANES, and 31P NMR spectroscopy. Geoderma 2018, 316, 115–126. [Google Scholar] [CrossRef]
  63. Sato, S.; Solomon, D.; Hyland, C.; Ketterings, Q.; Lehmann, J. Phosphorus speciation in manure and manure-amended soils using XANES spectroscopy. Environ. Sci. Technol. 2005, 39, 7485–7491. [Google Scholar] [CrossRef]
  64. Güngör, K.; Jürgensen, A.; Karthikeyan, K. Determination of phosphorus speciation in dairy manure using XRD and XANES spectroscopy. J. Environ. Qual. 2007, 36, 1856–1863. [Google Scholar] [CrossRef]
  65. Sharpley, A.; Moyer, B. Phosphorus forms in manure and compost and their release during simulated rainfall. J. Environ. Qual. 2000, 29, 1462–1469. [Google Scholar] [CrossRef]
  66. Ge, X.; Wang, L.; Zhang, W.; Putnis, C. Molecular understanding of humic acid-limited phosphate precipitation and transformation. Environ. Sci. Technol. 2020, 54, 207–215. [Google Scholar] [CrossRef] [PubMed]
  67. Nair, V.; Graetz, D.; Dooley, D. Phosphorus release characteristics of manure and manure-impacted soils. J. Food Agric. Environ. 2003, 1, 217–223. [Google Scholar] [CrossRef]
  68. Shen, J.; Yuan, L.; Zhang, J.; Li, H.; Bai, Z.; Chen, X.; Zhang, W.; Zhang, F. Phosphorus dynamics: From soil to plant. Plant Physiol. 2011, 156, 997–1005. [Google Scholar] [CrossRef] [PubMed]
  69. Shen, H.; Yan, X.; Zhao, M.; Zheng, S.; Wang, X. Exudation of organic acids in common bean as related to mobilization of aluminum- and iron-bound phosphates. Environ. Exp. Bot. 2002, 48, 1–9. [Google Scholar] [CrossRef]
  70. Prietzel, J.; Dumig, A.; Wu, Y.; Zhou, J.; Klysubun, W. Synchrotron-based P K-edge XANES spectroscopy reveals rapid changes of phosphorus speciation in the topsoil of two glacier foreland chronosequences. Geochim. Cosmochim. Acta 2013, 108, 154–171. [Google Scholar] [CrossRef]
  71. Fan, Y.; Zhong, X.; Lin, F.; Liu, C.; Yang, L.; Wang, M.; Chen, G.; Chen, Y.; Yang, Y. Responses of soil phosphorus fractions after nitrogen addition in a subtropical forest ecosystem: Insights from decreased Fe and Al oxides and increased plant roots. Geoderma 2019, 337, 246–255. [Google Scholar] [CrossRef]
  72. Chen, S.; Zhang, S.; Yan, Z.; Peng, Y.; Chen, Q. Differences in main processes to transform phosphorus influenced by ammonium nitrogen in flooded intensive agricultural and steppe soils. Chemosphere 2019, 226, 192–200. [Google Scholar] [CrossRef]
  73. Fink, J.; Inda, A.; Tiecher, T.; Barrón, V. Iron oxides and organic matter on soil phosphorus availability. Cienc. Agrotec. 2016, 40, 369–379. [Google Scholar] [CrossRef]
  74. Hinsinger, P. Bioavailability of soil inorganic P in the rhizosphere as affected by root-induced chemical changes: A review. Plant Soil 2001, 237, 173–195. [Google Scholar] [CrossRef]
  75. Bünemann, E.; Smernik, R.; Marschner, P.; McNeill, A. Microbial synthesis of organic and condensed forms of phosphorus in acid and calcareous soils. Soil Biol. Biochem. 2008, 40, 932–946. [Google Scholar] [CrossRef]
  76. Spohn, M. Increasing the organic carbon stocks in mineral soils sequesters large amounts of phosphorus. Glob. Chang. Biol. 2020, 26, 4169–4177. [Google Scholar] [CrossRef] [PubMed]
  77. Guo, X.; Wu, H.; Luo, M.; He, G. The morphological change of Fe/Al-oxide minerals in red soils in the process of acidification and its environmental significance. Acta Petrol. Mineral. 2007, 26, 515–521. (In Chinese) [Google Scholar] [CrossRef]
  78. Wang, Q.; Chen, Y.; Zhang, N.; Qin, Z.; Jin, Y.; Zhu, P.; Peng, C.; Colinet, G.; Zhang, S. Phosphorus adsorption and desorption characteristics as affected by long-term phosphorus application in black soil. J. Plant Nutr. Fertil. 2022, 28, 1–13. (In Chinese) [Google Scholar] [CrossRef]
  79. Kang Kang, J.; Hesterberg, D.; Osmond, D. Soil organic matter effects on phosphorus sorption: A path analysis. Soil Sci. Soc. Am. J. 2009, 73, 360–366. [Google Scholar] [CrossRef]
  80. Ma, J.; Ma, Y.; Wei, R.; Chen, Y.; Weng, L.; Ouyang, X.; Li, Y. Phosphorus transport in different soil types and the contribution of control factors to phosphorus retardation. Chemosphere 2021, 276, 130012. [Google Scholar] [CrossRef] [PubMed]
  81. Chitrakar, R.; Tezuka, S.; Sonoda, A.; Sakane, K.; Ooi, K.; Hirotsu, T. Phosphate adsorption on synthetic goethite and akaganeite. J. Colloid Interface Sci. 2006, 298, 602–608. [Google Scholar] [CrossRef] [PubMed]
  82. Luengo, C.; Brigante, M.; Antelo, J.; Avena, M. Kinetics of phosphate adsorption on goethite: Comparing batch adsorption and A TR-IR measurements. J. Colloid Interface Sci. 2006, 300, 511–518. [Google Scholar] [CrossRef]
Figure 1. (A) The P K-edge XANES reference spectra of P standards; (B) The P K-edge XANES reference spectra of soil samples from long-term different P fertilization regimes. The red lines represent the LCF for the studied soil sample spectra (B). The dashed lines indicate spectral features for different P compounds. a Fe-P (2148.0 eV), b absorption edge (white line) (2153 eV), c,d Ca-P (2155.0–2162.5 eV) e oxygen oscillation (2169.0 eV). Al-P, aluminum phosphate (AlPO4), Fe-P, iron phosphate dihydrate [FePO4·2H2O], DCP, dibasic calcium phosphate (CaHPO4·2H2O), MCP, monobasic calcium phosphate monohydrate [Ca(H2PO4)2·H2O], TCP, tricalcium phosphate [Ca3(PO4)2·xH2O], HAP, hydroxyapatite, IHP, inositol hexaphosphate.
Agronomy 12 02364 g001
Figure 2. Total P content (A) and its relationship with P fraction in CK (B), NPK (C), and NPKM (D) treatments under long-term field trial in Mollisol. Fitted curves were: y = Kx + b. CK, no fertilizer input; NPK treatment, applying N, P, K fertilizer; NPKM treatment, applying NPK and manure (pig manure from 1990 to 2004, and cattle manure from 2005 to 2018). Total P, the sum content of each P fraction extracted by the Hedley sequential method. LP (labile P), the sum content of resin-P, NaHCO3-Pi, and NaHCO3-Po, MLP (Mid-labile P), the sum content of NaOH-Pi, NaOH-Po, and dil.HCl-Pi, SP (stable P), the sum content of conc.HCl-Pi, conc.HCl-Po and residual P. * and ** mean the relationship between total P and P fraction in p < 0.05, p < 0.01 level, respectively.
Agronomy 12 02364 g002
Figure 3. Structural equation model (SEM) exhibiting the transformation among different soil P fractions following fertilization regimes. The standardized path coefficients are marked on the arrows. Arrow width represents the strength of the path coefficient. The overall fit of the model: χ2 = 7.27, P = 0.51, CFI = 1.00 RMSEA = 0.00 SRMR = 0.03. Sum of conc.HCl-Pi, conc.HCl-Po and residual P indicate a stable P pool.
Agronomy 12 02364 g003
Figure 4. Solution 31P NMR spectra in the studied soil under long-term field trial in Mollisol. The inserted spectra were used to show more information about the region from 6 ppm to −4 ppm. CK, no fertilizer input; NPK treatment, applying N, P, K fertilizer; NPKM treatment, applying NPK and manure (pig manure from 1990 to 2004, and cattle manure from 2005 to 2018).
Agronomy 12 02364 g004aAgronomy 12 02364 g004b
Figure 5. Correlation between soil properties and P fraction contents under long-term different fertilization regimes with redundancy analysis (RDA) triplots. SOM, soil organic matter; Fed + Ald were the sum of free iron (Fe) and aluminum (Al) oxide; Feo + Alo were the sum of amorphous Fe and Al oxides; Fep + Alp were the sum of humus complex Fe and Al oxides. M3-Mg, M3-Fe, and M3-Al were Mg, Fe and Al extracted by Mehlich-3 extraction. Stable P, sum P pool of conc.HCl-Pi, conc.HCl-Po, and residual P.
Agronomy 12 02364 g005
Table 1. Physical and chemical properties of studied soil in the experiment in 1989.
Soil DepthpHBulk DensitySoil Organic MatterTotal NTotal PTotal KOlsen-PAvailable K
cm g cm−3g kg−1g kg−1g kg−1g kg−1mg kg−1mg kg−1
0–207.61.19201.340.6116.3611.8190
Table 2. The linear fitting of P fractions with P K-edge XANES in the studied soil under long-term field trial in Mollisol.
Linear Combination Fitting Goodness of Fit
HAPAl-PIHPMCPTCPFe-PCa-P
Proportion (%) R Factor
1990CK42.1 ± 0.2 a 10.3 ± 1.4 c 42.4 ± 1.342.10.0125
2000NPK21.5 ± 2.2 b21.1 ± 0.7 bc19.9 ± 0.9 a36.6 ± 0.2 b 58.10.0143
NPKM17.9 ± 1.1 bc23.6 ± 2.0 bc14.8 ± 1.4 b27.7 ± 1.4 d25.8 ± 1.0 b 71.40.0055
2010NPK18.7 ± 0.5 bc28.9 ± 1.1 a20.8 ± 1.8 a35.9 ± 0.3 b 54.60.007
NPKM15.9 ± 0.1 c19.0 ± 0.4 c10.8 ± 0.6 c33.4 ± 0.1 c25.7 ± 0.2 b 75.00.0061
2018NPK5.4 ± 0.8 d24.7 ± 0.5 ab18.8 ± 0.2 a39.4 ± 0.1 a14.0 ± 1.1 c 58.80.0073
NPKM 24.2 ± 0.7 ab7.2 ± 0.6 c33.8 ± 0.6 c43.0 ± 0.6 a 76.80.0038
CK, no fertilizer input; NPK treatment, applying N, P, K fertilizer; NPKM treatment, applying NPK and manure (pig manure from 1990 to 2004, and cattle manure from 2005 to 2018). Al-P, aluminum phosphate (AlPO4), Fe-P, iron phosphate dihydrate [FePO4·2H2O], MCP, monobasic calcium phosphate monohydrate [Ca(H2PO4)2·H2O], TCP, tricalcium phosphate [Ca3(PO4)2·xH2O], HAP, hydroxyapatite, IHP, inositol hexaphosphate. Data are mean ± SE (n = 3). The lowercase letter indicates the significant difference in soil properties in the same column (p < 0.05).
Table 3. The proportion of P fraction with NaOH-EDTA extractions of the studied soil under long-term field trial in Mollisol.
YearTreatmentNaOH-EDTA Extraction
Recovery (%)PiPoTotal IHPMonoDiD:McMonocDicD:cM
1990CK40.137.962.15.5757.62.810.0553.37.090.13
2000NPK33.748.151.96.4446.91.260.0339.98.250.21
NPKM27.664.735.36.2834.21.060.0331.04.170.13
2010NPK46.948.052.04.2949.22.080.0446.25.130.11
NPKM26.767.732.33.1930.80.950.0329.02.730.09
2018NPK62.762.937.14.3135.20.860.0233.12.960.09
NPKM54.579.420.61.8320.00.510.0319.01.550.08
CK, no fertilizer input; NPK treatment, applying N, P, K fertilizer; NPKM treatment, applying NPK and manure (pig manure from 1990 to 2004, and cattle manure from 2005 to 2018). Pi, inorganic P; Po, organic P; total IHP, the total of inositol hexakisphosphate; Mono, orthophosphate monoester; Di, orthophosphate diesters; D:M, the ratio of orthophosphate diesters to orthophosphate monoester; C denotes a correction for degradation products.
Table 4. Soil properties of collected samples in Mollisol.
pHSOMM3-CaM3-MgM3-AlM3-FeFed + AldFep + AlpFeo + Alo
g kg−1g kg−1g kg−1g kg−1g kg−1g·kg−1g kg−1g kg−1
1990CK7.40 ± 0.3 a21.5 ± 0.2 d4.55 ± 0.04 b0.35 ± 0.00 e1.20 ± 0.01 b0.22 ± 0.01 b12.12 ± 0.04 a0.65 ± 0.01 e5.88 ± 0.04 g
2000NPK6.03 ± 0.1 c28.5 ± 1.8 c3.82 ± 0.05 d0.41 ± 0.01 d1.30 ± 0.02 a0.25 ± 0.00 a11.26 ± 0.09 c0.80 ± 0.03 d7.49 ± 0.02 d
NPKM7.10 ± 0.1 a32.8 ± 2 b4.62 ± 0.04 a0.45 ± 0.01 c1.15 ± 0.02 b0.26 ± 0.01 a11.28 ± 0.08 c0.82 ± 0.02 cd6.61 ± 0.01 f
2010NPK6.73 ± 0.1 b26.9 ± 0.4 c3.83 ± 0.04 d0.41 ± 0.01 d1.35 ± 0.02 a0.25 ± 0.01 a11.58 ± 0.10 b1.04 ± 0.02 b8.22 ± 0.06 b
NPKM7.21 ± 0.02 a41.0 ± 2 a4.57 ± 0.18 b0.54 ± 0.00 a1.04 ± 0.02 c0.24 ± 0.01 a10.74 ± 0.05 d0.86 ± 0.02 c7.78 ± 0.03 c
2018NPK6.11 ± 0.2 c26.7 ± 0.1 c4.17 ± 0.01 c0.28 ± 0.01 f1.18 ± 0.03 b0.25 ± 0.00 a10.62 ± 0.09 d1.04 ± 0.02 b6.84 ± 0.01 e
NPKM7.36 ± 0.04 a40.3 ± 1.9 a3.89 ± 0.01 d0.47 ± 0.00 b1.04 ± 0.03 c0.24 ± 0.01 a10.78 ± 0.11 d1.19 ± 0.01 a8.45 ± 0.10 a
CK, no fertilizer input; NPK treatment, applying N, P, K fertilizer; NPKM treatment, applying NPK and manure (pig manure from 1990 to 2004, and cattle manure from 2005 to 2018). SOM, soil organic matter; M3-Ca, M3-Mg, M3-Fe, and M3-Al were Ca, Mg, Fed + Ald were the sum of free iron (Fe) and aluminum (Al) oxide; Feo + Alo were the sum of amorphous Fe and Al oxides; Fep + Alp were the sum of humus complex Fe and Al oxides. Data are mean ± SE (n = 3). The lowercase letter indicates the significant difference in soil properties in the same column (p < 0.05).
Publisher’s Note: MDPI stays neutral with regard to jurisdictional claims in published maps and institutional affiliations.

