Article

Effects of 10 Years of the Return of Corn Straw on Soil Aggregates and the Distribution of Organic Carbon in a Mollisol

1
Northeast Institute of Geography and Agroecology, Chinese Academy of Sciences, Harbin 150081, China
2
University of Chinese Academy of Sciences, Beijing 150049, China
3
Department of Agronomy, Iowa State University, Ames, IA 50011, USA
*
Author to whom correspondence should be addressed.
These authors contributed equally to this work.
Agronomy 2022, 12(10), 2374; https://doi.org/10.3390/agronomy12102374
Submission received: 20 July 2022 / Revised: 26 September 2022 / Accepted: 28 September 2022 / Published: 30 September 2022

Abstract

:
The return of straw is a widely used agricultural practice for increasing the soil organic carbon (SOC) content and improving soil structure in Mollisols, owing to the decline caused by continuous high-intensity tillage. We conducted a field experiment where corn straw was continuously returned for 10 years to investigate effects of the straw on the size distribution and stability of soil aggregates and on SOC density fractions. The treatments were no straw return (CK) and four rates of straw return: 6000 kg hm−2 (S1), 9000 kg hm−2 (S2), 12,000 kg hm−2 (S3), and 15,000 kg hm2 (S4). SOC contents after straw return for bulk soil, a free light fraction (F-LF), an occluded light fraction (O-LF), and a heavy fraction (HF) were significantly higher by 27.0, 644.3, 720.0, and 69.2%, respectively, in S4 than CK. The contents of F-LF, O-LF, and HF in aggregates >2.00 mm were significantly higher by 194.2, 162.1, and 35.8%, respectively, in S4 than CK. Structural equation modeling indicated that SOC contents and aggregates >0.25 mm were directly correlated with the amount of straw returned. We conclude that returning 15,000 kg m−2 of straw would be an effective agronomic practice to restore Mollisol fertility.

1. Introduction

Northeastern China is the Chinese granary, with an average corn production of 41.0% and corn commercialization of >80.0%, playing an important role in and greatly contributing to food security in China [1]. The fertility of the Mollisol soil, however, has been decreasing after years of high-intensity planting and cultivation. Xu et al. [2] reported that Mollisol regions around the world are losing soil organic carbon (SOC). For example, the SOC contents in northeastern China decreased by 46.0% after 150 years of cultivation, and the SOC contents in North America decreased by >50% during the last 100 years, which led to yield reductions of >16.5% by 2020 [2]. The loss of SOC contributes to global warming and decreases crop growth and yield [2,3], which affects food security. SOC is key to soil fertility and plays an important role in regulating the physical and chemical properties of soil [4]. The accumulation of SOC is therefore very important for sustainable crop production [5] and increasing the sequestration of SOC is critical for food security and decreasing the loss of carbon (C).
The return of straw in agroecosystems is considered an essential and effective management practice for increasing SOC storage and improving soil quality and health [6]. An estimated 3.8 billion tons of crop residues are produced globally each year [7] and sequestering 0.6–1.2 Pg C by returning these crop residues to the soil is possible [8]. Similarly, China produces approximately 1 billion tons of air-dried straw each year, representing a large potential resource for straw biomass [9]. Straw return can offset anthropogenic CO2 emissions and increase the sequestration of SOC as a win–win strategy [10,11]. The mineralization of straw organic matter can provide nutrients to the soil, such as nitrogen, phosphorus, and potassium, which are required for crop growth [12,13,14]. Previous studies, however, have reported that the return of straw has a negative effect on soil structure [15,16]. The inconsistency of published results on the effect of straw return on soil structure is likely due to differences in agricultural management, climatic conditions, and soil pH [17]. Changes in SOC contents due to practices of soil management are often difficult to detect because of high background values of SOC during short periods [18]. Selecting reliable and sensitive indicators to assess changes in soil quality is therefore needed [19].
Unstable pools of soil C with relatively rapid turnover are sensitive to land-use changes and soil management and they have been suggested as early sensitive indicators of changes in SOC content [20,21]. To better understand the mechanisms of SOC sequestration, a more fundamental study of SOC pools, especially their unstable fractions, is necessary to quantify the effects of tillage practices [22]. The physical fractionation of SOC is an effective tool for assessing changes in C pools [23,24]. This method allows the separation of SOC fractions from different positions in the soil using density fractionation. Three SOC fractions are often used: the free light fraction (F-LF), the occluded light fraction (O-LF), and the heavy fraction (HF). F-LF usually decomposes rapidly, and O-LF has a higher degree of decomposition and a slower rate of turnover [25]. HF is primarily composed of highly decomposed substances, which decompose very slowly [23]. Changes to these three fractions, particularly F-LF and O-LF, are more sensitive to the type of soil management than is total SOC content [26]. We therefore used the density fractionation of SOC to assess changes in soil quality.
The distribution and stability of aggregates are important indicators of soil quality [27]. The formation of aggregates and accumulation of SOC usually occur concurrently and are closely related [28]. Water-stable aggregates (WSAs) are generally separated by wet sieving into four fractions, which is a common indicator of soil stability. The distribution of WSAs affects the porosity and nutrient content of soil [29]. SOC can bind fine particles by chemical and physical processes and is an important binding agent for aggregation [27,30], which protects SOC against structural biodegradation. The distribution of SOC in aggregates, however, is not uniform, and aggregates of different sizes can have different SOC contents [31]. Straw return can improve soil nutrients and the sequestration of C by the accumulation of SOC, particularly in the topsoil [32]. Sun et al. [33] found that straw return increased aggregates >0.25 and 0.25–0.053 mm and the SOC content in aggregates >0.25 mm. The return of wheat straw to an organically barren area in China increased SOC content and the stability of aggregates [34]. Previous studies have focused on the effects of land use, including the effects of conservation tillage, on the distributions of SOC and aggregates [1,22,35]. Our study was designed to identify the effects of long-term straw return on the distribution of aggregates, SOC content, and changes in various SOC physical fractions in different size fractions of aggregates.
We hypothesized that (1) long-term straw return would increase SOC content, including the light and heavy C fractions, (2) long-term straw return would increase all SOC fractions of macroaggregates (>0.25 mm), and (3) the amount of straw returned would directly affect the SOC contents of bulk soil, SOC physical fractions, and aggregates.

2. Materials and Methods

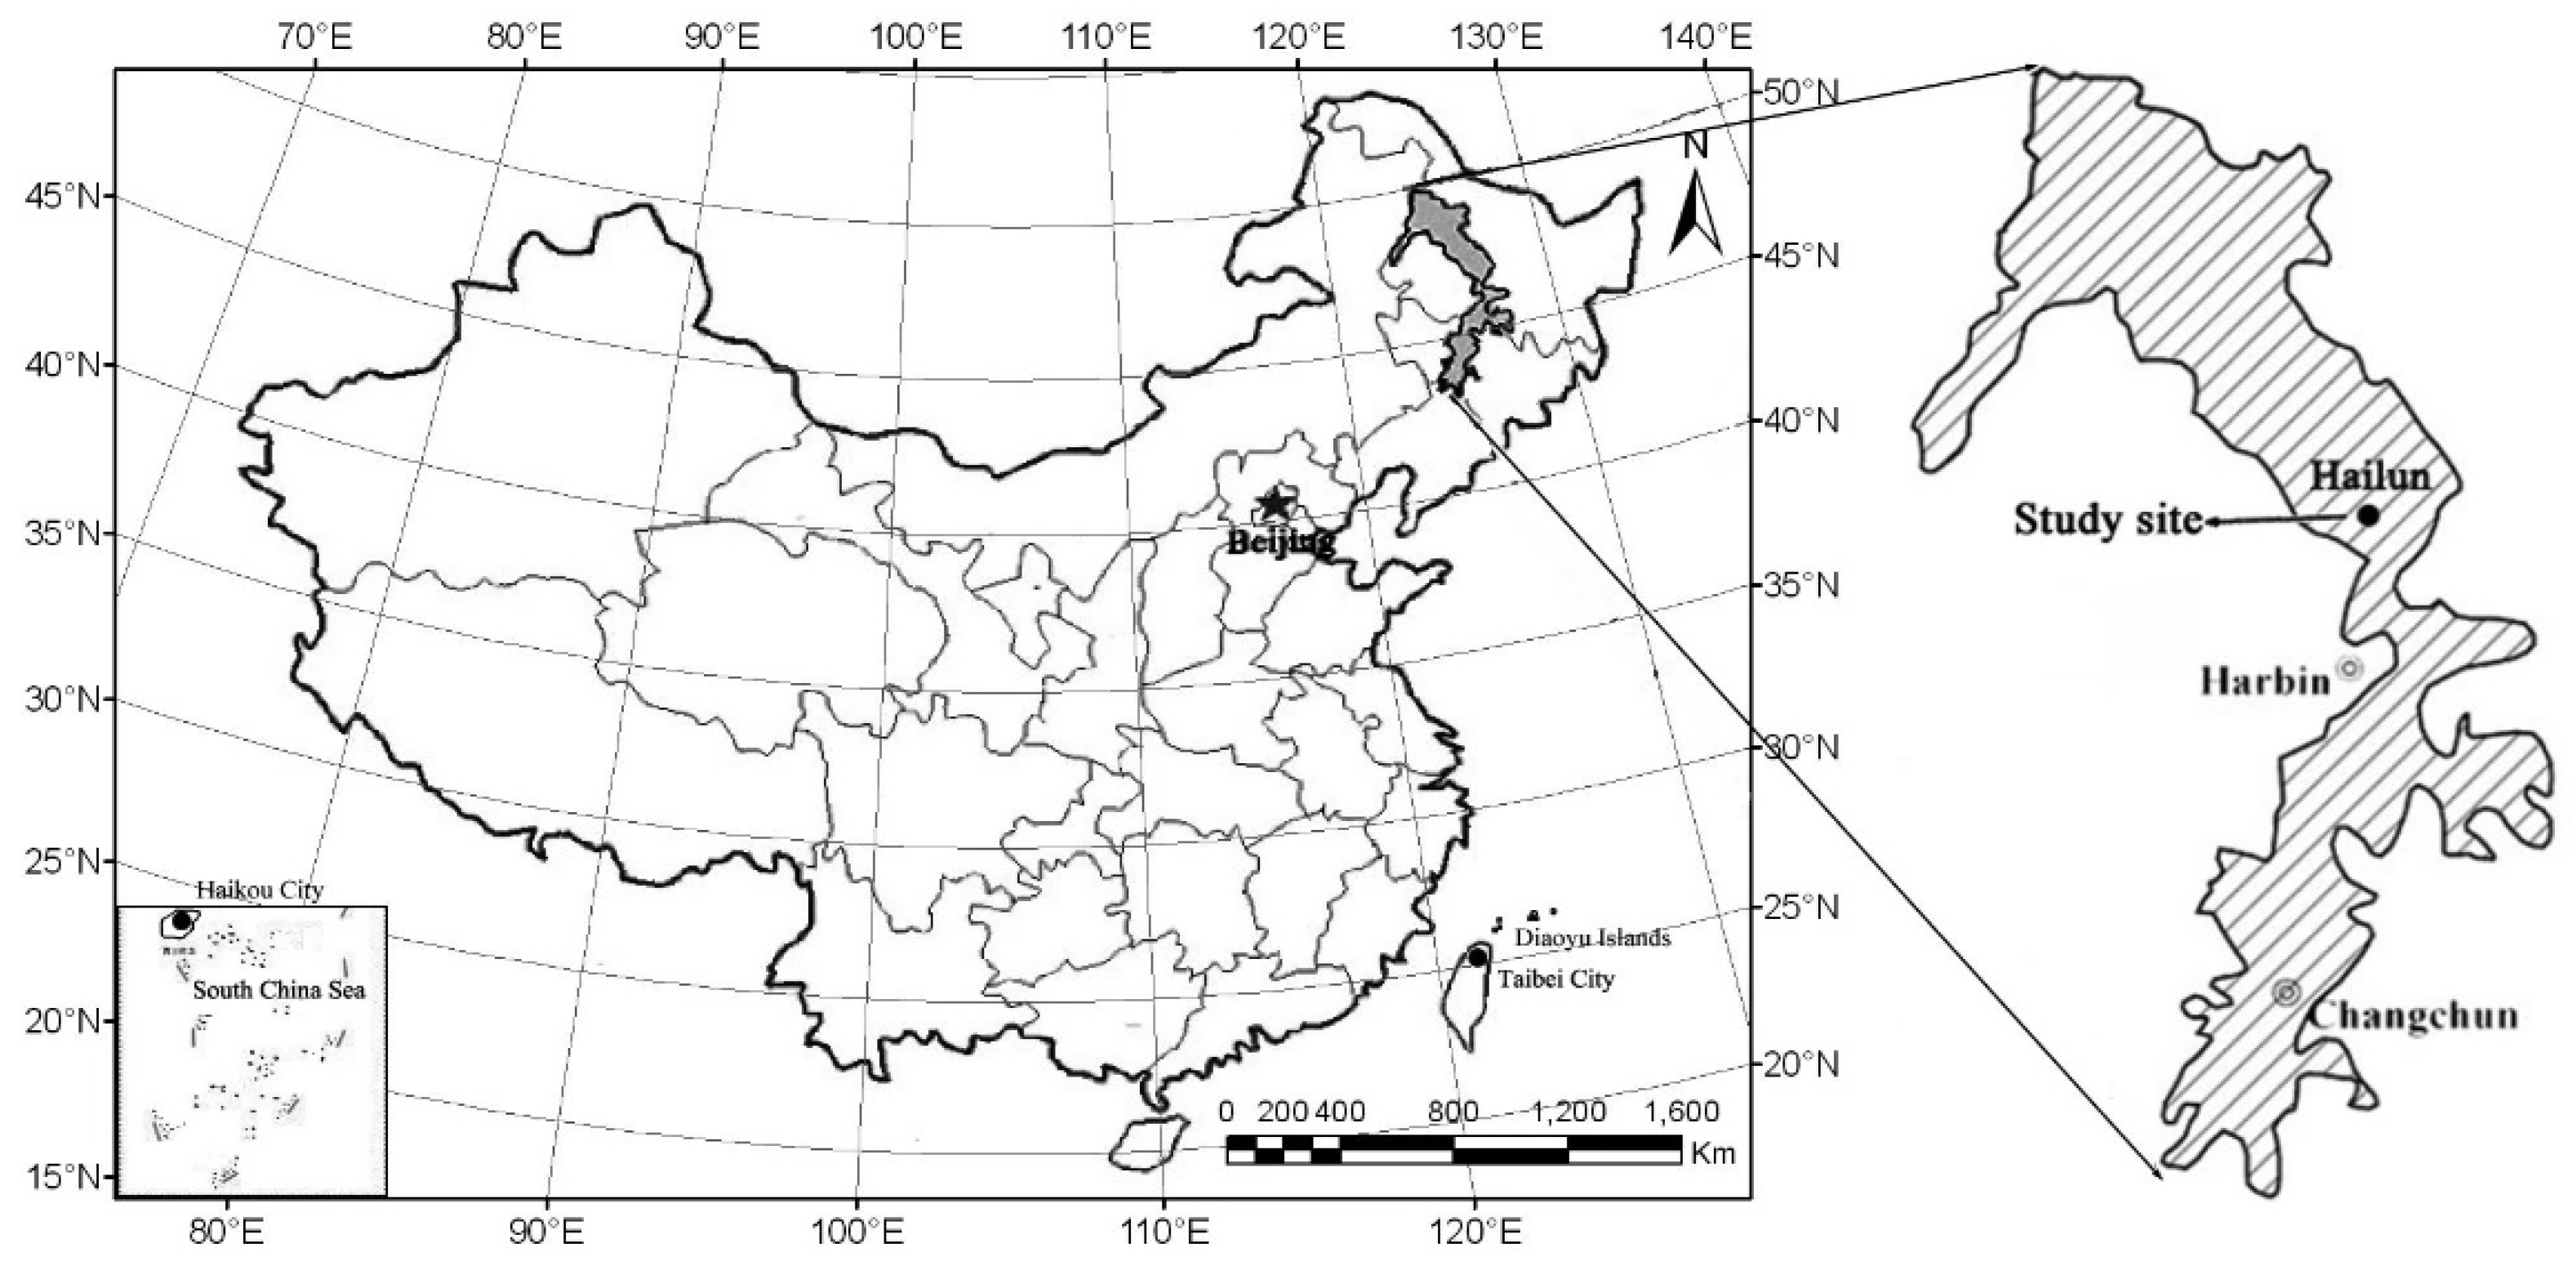
2.1. Study Description

This study was conducted at the National Observation Station of Hailun Agro-ecology System at the Northeast Institute of Geography and Agroecology, Chinese Academy of Sciences (47°26′ N, 126°38′ E; 234 m a.s.l.) (Figure 1). The site is in a moderate temperate zone with a semi-humid continental monsoon climate [36]. The mean annual precipitation, mean annual temperature, and annual effective accumulated temperature are 550 mm, 1.5 °C (the highest mean monthly temperature is 21 °C and the lowest is −23 °C), 2400–2500 °C, respectively. The soil at the site is a Mollisol of the USDA Soil Taxonomy System [37]. The site is on a flat plain with uniform soil fertility that was a native grassland until the land was first cultivated about 120 years ago.

2.2. Experimental Design

The experiment was established in 2011 with a system of continuous maize cropping. The experimental design was a completely randomized block with three replicates of five treatments: no straw returned (CK), 6000 kg hm−2 of straw returned (S1), 9000 kg hm−2 of straw returned (S2), 12,000 kg hm−2 of straw returned (S3), and 15,000 kg hm−2 of straw returned (S4). Each treatment plot was 39 m2 (10 × 3.9 m). The maize variety used for the study was Dermea No. 3. All surface residue of corn straw was removed in the CK plots after harvest. The corn straw in the other treatment plots was cut by machine into segments <5 cm long and evenly distributed in the 0–20 cm layer by artificial methods in autumn after harvest. The rates of fertilization were 150 kg N hm−2 as urea, 70 kg P2O5 hm−2 as diammonium phosphate, and 50 kg K2O hm−2 as potassium sulphate. Sixty percent of the nitrogen and all the phosphorus and potassium were applied as a base fertilizer at sowing. Forty percent of the nitrogen was applied as a topdressing when the maize was jointing during the V3 to V7 growth stages, before the V8 growth stage. The practices of field management adopted during the experiment were the same as those used by the local farmers.

2.3. Soils Sampling

Six soil samples were randomly collected from each treatment plot after harvest to a depth of 20 cm in early October 2019. The treatment samples were uniformly mixed as a composite sample and transported to the laboratory for analysis. Stones, plant residues, and other objects were removed from the samples, which were subsequently air-dried at room temperature. The samples were passed through a 0.25 mm sieve for determining SOC content and aggregates.

2.4. Separation of Aggregates by Size

The wet-sieving method was used to separate the aggregates by size as described by Six et al. and Puget et al. [38,39]. The aggregates were separated into four size classes and the content of SOC in each class was measured. The four aggregate classes were (1) large macroaggregates (>2.00 mm, Lma), (2) small macroaggregates (2.00–0.25 mm, Sma), (3) microaggregates (0.25–0.053 mm, Mi), and (4) silt plus clay (<0.053 mm, SC). A 100-g subsample of the air-dried soil was placed in the top sieve of a set of three sieves (2.00, 0.25, and 0.053 mm), with a receptacle at the bottom of the 0.053-mm sieve. The set of three sieves was soaked in a basin of deionized water for 5 min at room temperature and was then vertically oscillated 50 times at short distances of 3 cm for 2 min each time. The aggregates remaining on each sieve were carefully washed into separate beakers with known weights and oven-dried at 60 °C to a constant weight. The weights of the dried aggregates were recorded, and the samples were analyzed for SOC content.
Mean weight diameter (MWD), geometric mean diameter (GMD), and the WSAs were the parameters used for evaluating aggregate stability. MWD, GMD, and WSA>0.25mm were calculated as [40,41];
MWD = i = 1 n + 1 r i 2 + r i 2 xm i
where ri is the mean diameter of WSAs for each size classes, mi is the weight percentage of the aggregates in fraction i, and n is the number of sieves;
GMD = ( exp [ i = 1 n ( w i × ln ( x i ) ) ]
where xi is the mean diameter of aggregate fraction i (mm), and wi is the mass proportion of aggregate fraction;
WSA > 0.25 mm = W w W d × 100
where W w is the weight of wet sieved soil >0.25 mm, and W d is the weight of dry-sieved soil >0.25 mm.

2.5. Density Fractionation in SOC

The density fractionation in SOC was based on the method described by Roscoe and Buurman [26], where SOC was separated into F-LF, O-LF, and HF by flotation in a solution of NaI (1.7 g cm−3) before and after aggregate disruption. In this study, we separated bulk soil and each aggregate size class. Ten grams of bulk soil was placed in a centrifuge tube with 50 mL of the NaI solution, gently shaken by hand, and left standing at room temperature for 12 h. The sample was centrifuged for 15 min at 2000× g and the supernatant was filtered through a membrane filter. Another 50 mL of the NaI solution were added to the centrifuge tube, and the contents of the tube were shanked by hand, centrifuged, and filtered. This process was repeated twice as descried above, and the fraction recovered on the filter was washed with 100 mL of 0.01 M CaCl2 followed by 200 mL of distilled water. The three subfractions were placed in a beaker, oven-dried at 50 °C, and weighed. This fraction was the F-LF fraction. The sediment in the centrifuge tubes was poured into the NaI solution (the solution previously filtered) and gently shaken by hand. The sediment was ultrasonicated for 15 min, centrifuged, and filtered. The centrifugation and filtration were repeated twice as previously described. The fractions were placed in a beaker, dried as previously described, and weighed. This fraction was the O-LF fraction. The HF (sediment) was washed 10 times with 95% ethanol until the clay fraction remained in suspension. The organic-C contents in the SOC density fractions was measured using an elemental analyzer (EA3000, Euro Vector, Italy). The same method was used to classify the SOC density fractions in the different size classes of aggregates.

2.6. Statistical Analysis

Statistical analyses were conducted using Excel 2013 (Microsoft, Redmond, WA, USA) and SPSS 17.0 (IBM, Armonk, NY, USA). Significant differences among treatments were identified using a one-way analysis of variance (ANOVA) in combination with an LSD test (p ≤ 0.05, p ≤ 0.01) for all data. Figures for the distribution of the aggregate sizes, aggregate stability, and the density fractions of SOC were created using Origin 2019b (IBM, Armonk, NY, USA).
Structural equation modeling (SEM) was used to evaluate the direct and indirect relationships among the amount of straw return, SOC indicators (SOC content, LF, and HF), and aggregate indicators (MWD, GMD, and WSA>0.25mm). The analysis was conducted using SPSS AMOS 23.0 (IBM, Armonk, NY, USA). Several tests were performed to assess model fit, a comparative fit index (CFI), and goodness-of-fit (GFI). The fitness of the model was quantified using the root mean square error of approximation (RMSEA). A model was considered as successfully fitted when 0.05 < p ≤ 1.00 and 0 ≤ RMSEA ≤ 0.5. Only models with good fits were used.

3. Results

3.1. SOC Content in Bulk Soil and Density Fractions

The effects of returning straw for 10 years on SOC content in the bulk soil and density fractions are presented in Table 1. The SOC content in the bulk soil was significantly higher by 27.0% in S4 than CK. The SOC content did not differ significantly between CK and the other three return treatments. The SOC content in the bulk soil, F-LF, O-LF, and HF increased as the amount of straw returned to the soil increased compared with CK. The SOC content of F-LF was not significantly higher in S1 or S2 than CK (p > 0.05) but was significantly higher in S3 and S4 by 514.07 and 644.31% (p < 0.05), respectively. The SOC content of O-LF and HF were significantly higher by 260.00–720.00% and 21.47–69.15% (p < 0.05), respectively, in all return treatments than CK. The SOC content in all treatments was in the order HF > F-LF > O-LF. The SOC content in all density fractions was significantly higher in S4 than CK (p < 0.05).

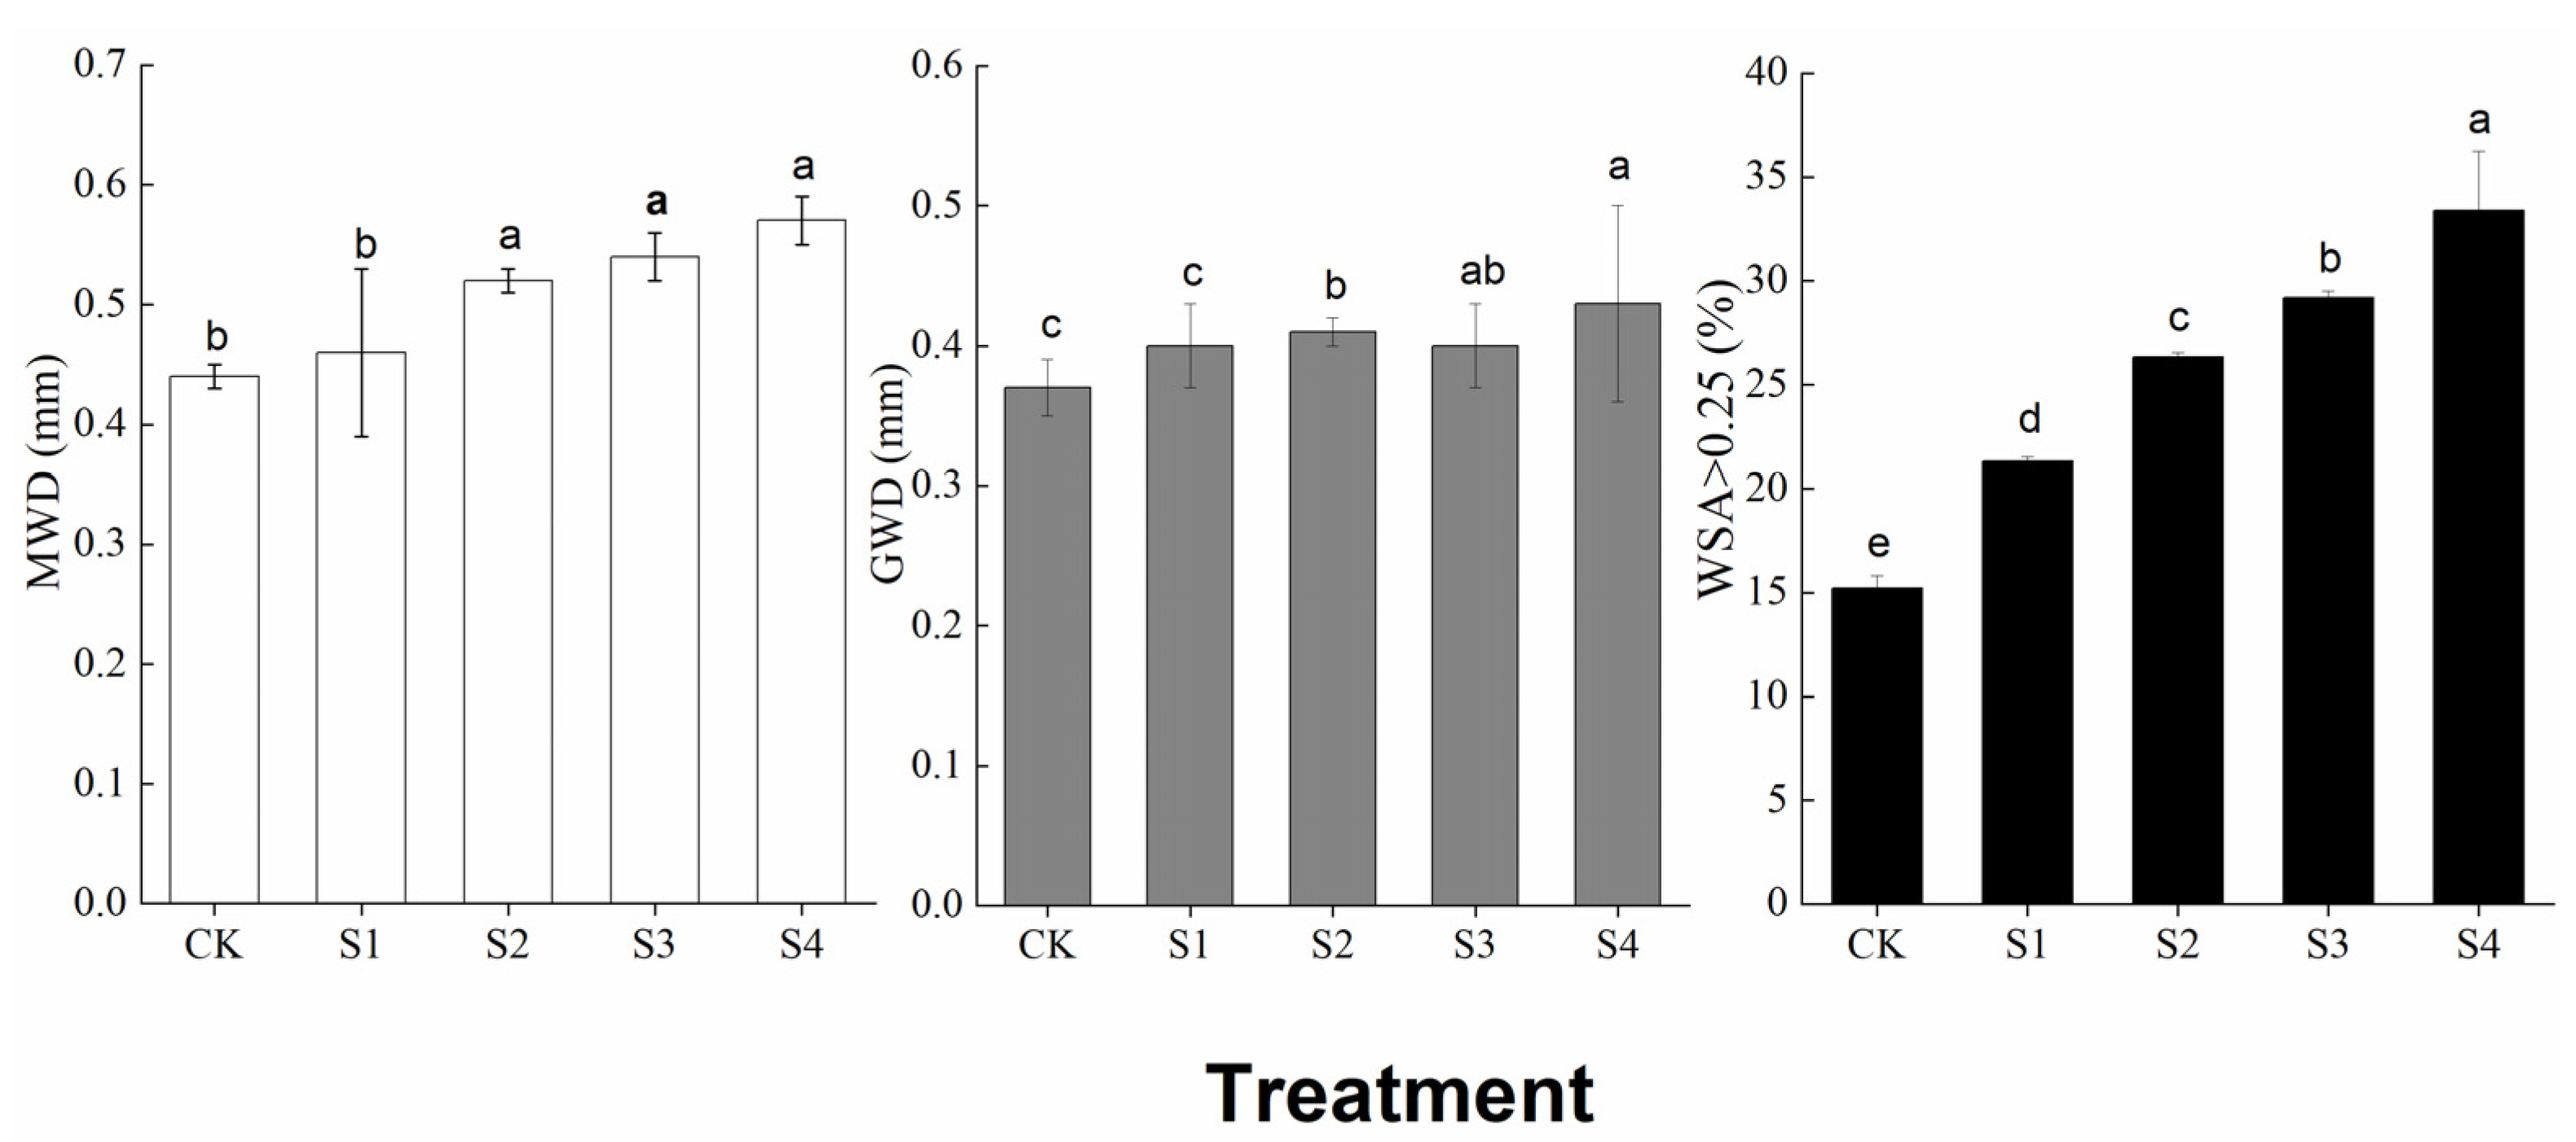
3.2. Aggregate Distribution and Stability

The effects of straw return on the aggregate size classes are shown in Figure 2. Lma and Sma in bulk soil were significantly higher by 188.76–588.76% and 31.16–90.50%, respectively, in S1, S2, S3, and S4 than CK (p < 0.05). Mi content was significantly lower in S1, S2, S3, and S4 than CK by 17.04–45.89% (p < 0.05). SC content was significantly lower by 8.73% in S2 than CK. S1, S3 and S4 did not differ significantly in the other three return treatments (p > 0.05) (Figure 2).
MWD was significantly higher by 18.19-29.55% in S2, S3, and S4 than CK (p < 0.05) but did not differ significantly between S1, S2, S3, and S4 (p > 0.05) (Figure 3). GMD was significantly higher by 10.81–16.21% in S2, S3, and S4 than CK (p < 0.05). WSA>0.25mm was significantly higher by 40.39–119.67% (p < 0.05) in the return treatments than CK. MWD, GMD, and WSA>0.25mm were generally significantly affected in S4, indicating that a large amount of straw return was necessary for the stability of the aggregates and for improving the soil structure.

3.3. SOC Content in the Aggregate Size Classes

The SOC content in Lma and Sma tended to increase with the amount of straw returned (Table 2). The SOC content in Lma was significantly higher by 16.20% in S4 than CK (p < 0.05) but did not differ significantly between the other treatments (p > 0.05). Straw return, however, did not significantly affect the SOC content of Sma, Mi, or SC (p > 0.05).

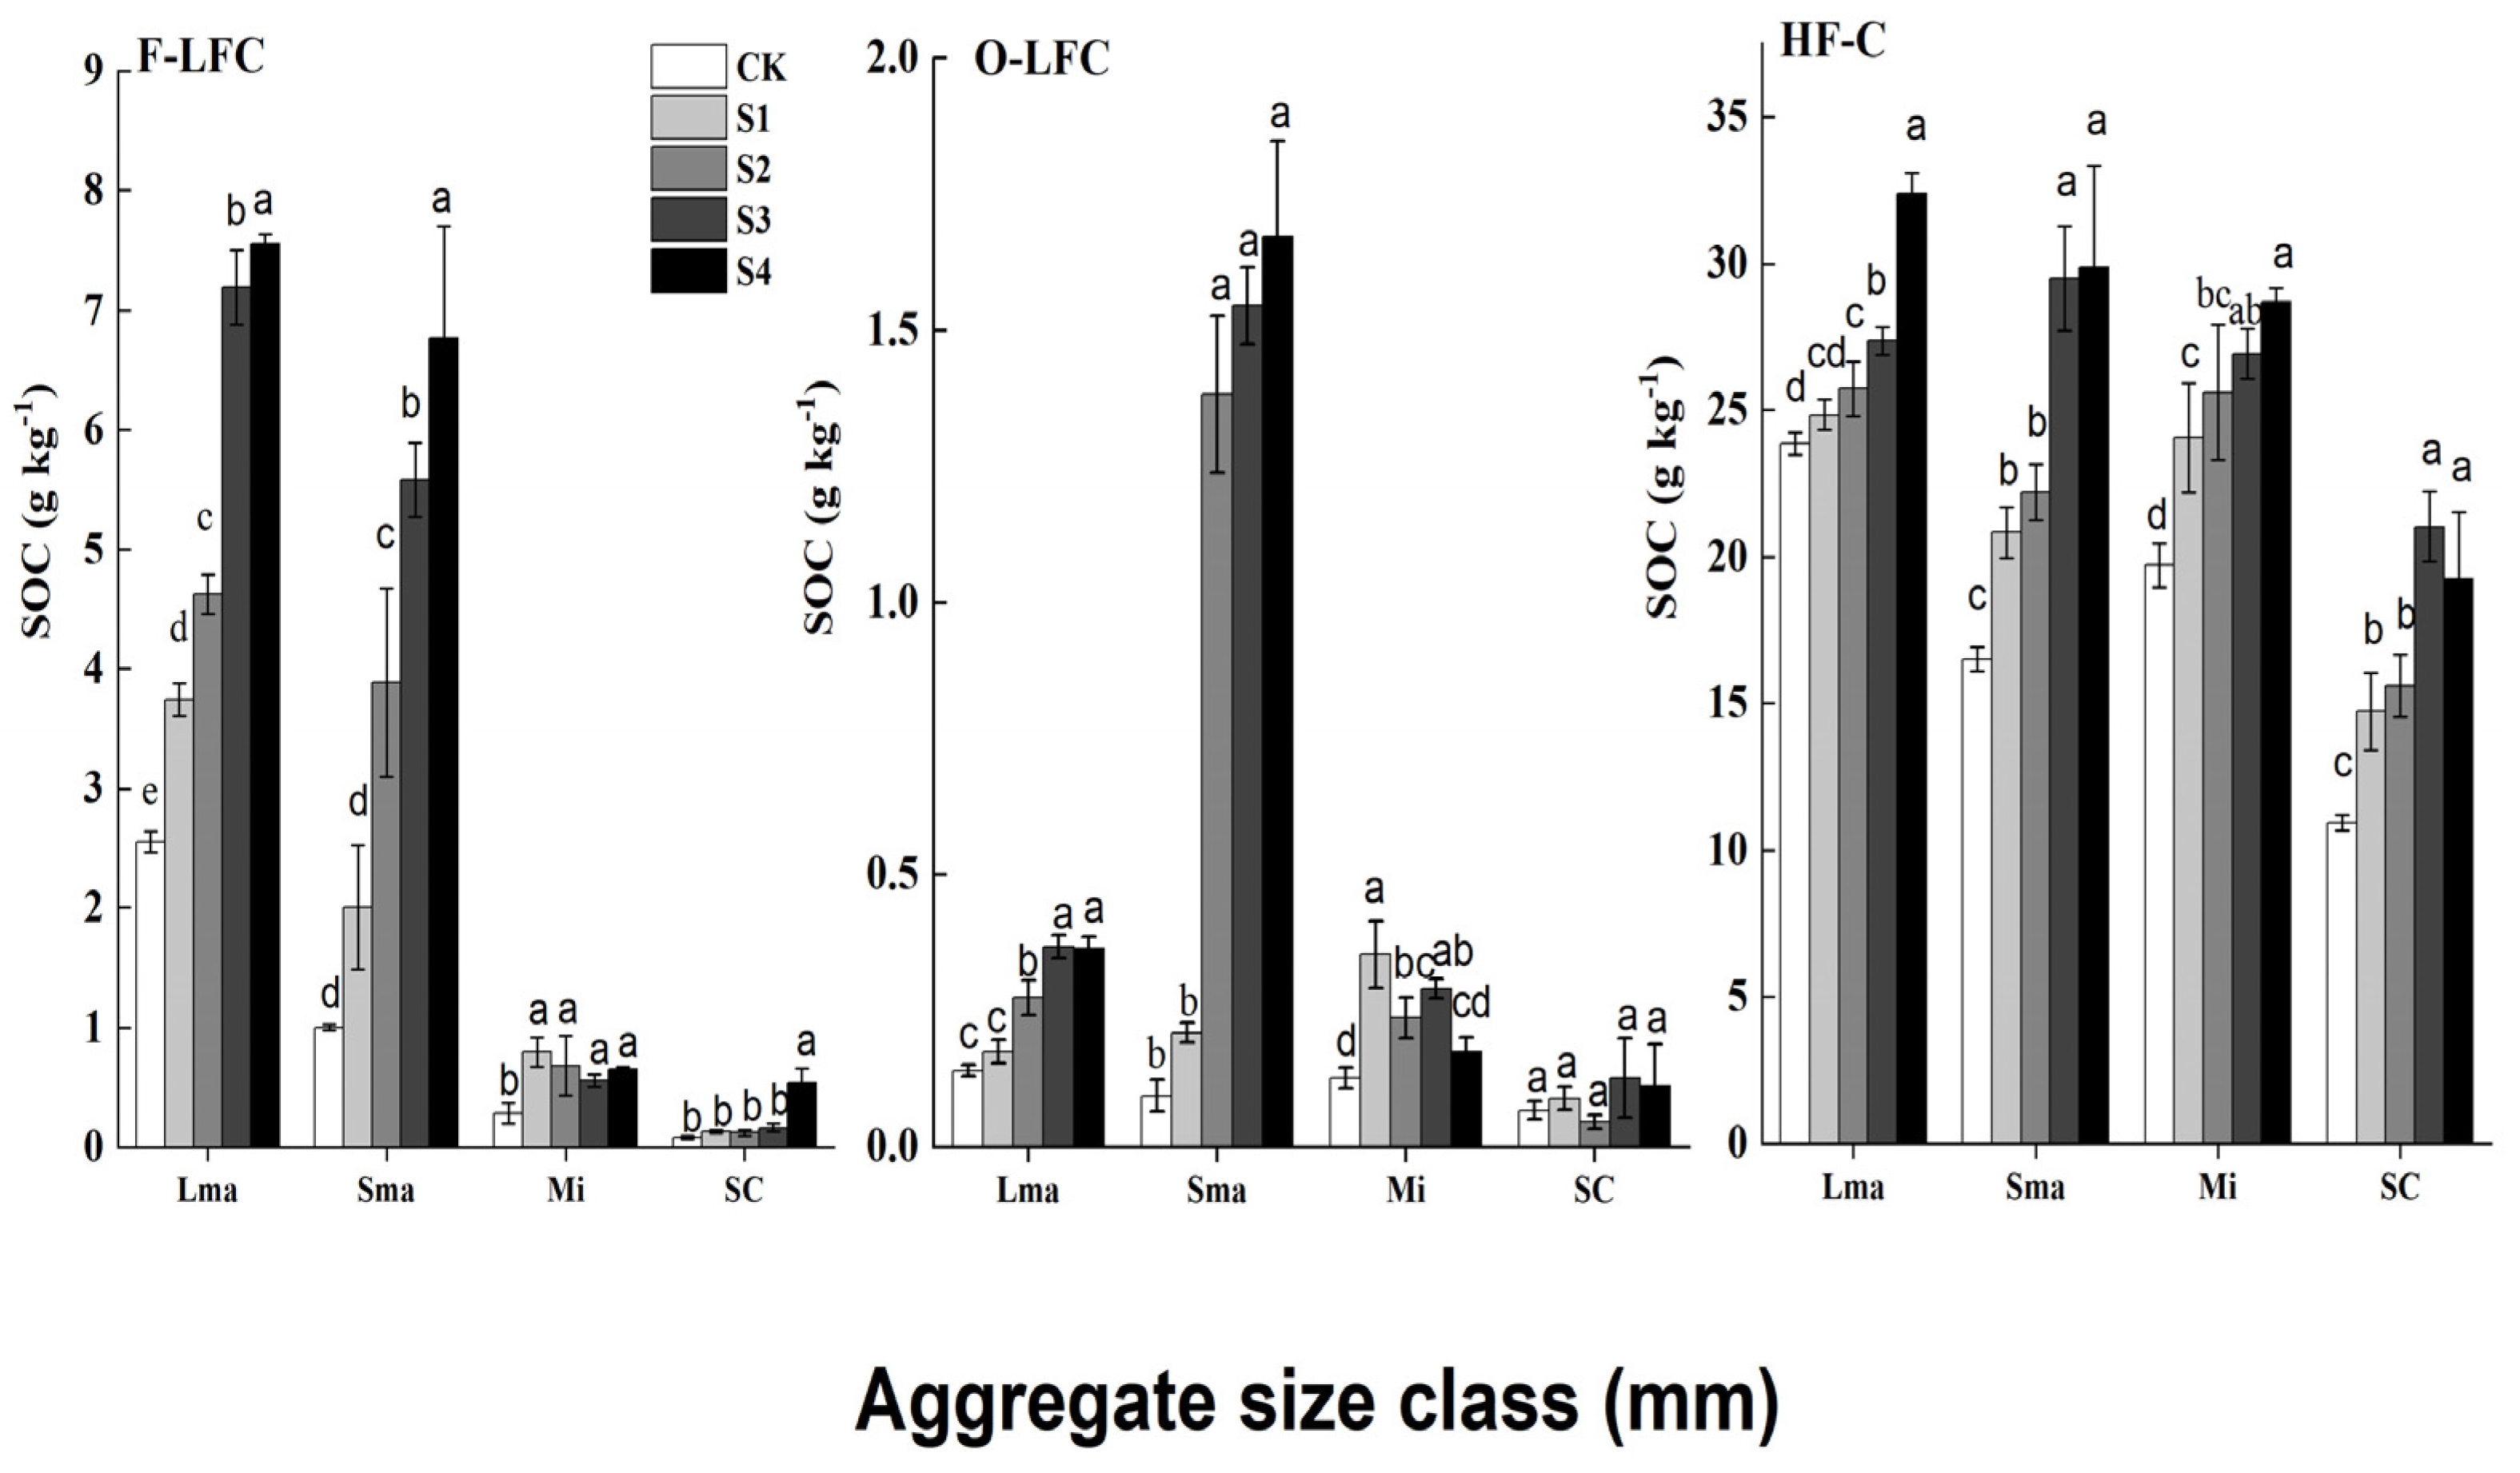
3.4. Density Fractions of SOC in the Aggregate Size Classes

The influence of straw return on the density fractions of SOC in the aggregate size classes is shown in Figure 4. The SOC content of F-LF in aggregates >2.00 mm was significantly higher by 181.97 and 196.24% in S3 and S4 than CK (p < 0.05), respectively. The SOC content of F-LF in aggregates 2.00–0.25 mm in size was significantly higher by 289.38–578.16% in S2, S3, and S4 than CK (p < 0.05). The SOC content of F-LF in aggregates 0.25–0.053 mm in size was significantly higher by 98.92–185.97% in the return treatments than CK (p < 0.05). The SOC content of F-LF in aggregates <0.053 mm was significantly higher in S4 (0.536 g kg−1) than CK (0.077 g kg−1) and differed significantly from the other three return treatments (p < 0.05). The SOC content of O-LF in aggregates >2.00 and 0.25–2.00 mm in size was significantly higher by 95.71–162.14% and 1370.21–1677.66% (p < 0.05), respectively, in S2, S3, and S4 than CK but did not differ significantly between S1 and the other return treatments (p > 0.05). The SOC content in the 0.25–0.053 mm aggregates was significantly higher by 180.16% in S1 than CK, and the SOC content of O-LF was in the order S1 >S3 > S2 > S4 > CK. The SOC content of HF in aggregates >2.00 mm was significantly higher by 7.87–35.78% in S2, S3, and S4 than CK, and the SOC content of HF was highest in S4. The SOC content of HF in the 2.00–0.25 mm aggregates was significantly higher by 26.13–80.83% in the return treatments than CK (p < 0.05) and was higher in S3 and S4 than S1 and S2. The SOC content of HF in the 0.25–0.053 mm aggregates was highest in S4 and differed significantly from the contents in S2, S1, and CK (p < 0.05). The SOC content of HF in aggregates <0.053 mm was significantly higher by 92.55 and 76.33% in S3 and S4, respectively, than CK (Figure 4).

3.5. Relationships among Straw Return, SOC Indicators, and Aggregate Indicators

SEM with straw return indicated that RMSEA (0.000), GFI (0.985), and CFI (1.000) provided successful fits for the SOC and aggregate indicators (Figure 5). The amount of straw returned had the largest effect on SOC content, light fraction C (LFC), and WSA>0.25mm (p < 0.001). Straw return significantly affected heavy fraction C (HFC) (p < 0.01). GMD was significantly affected by straw return (p < 0.05) (Figure 5).

4. Discussion

4.1. Effects on SOC Content after 10 Years of Returning Corn Straw

The return of corn straw has increased SOC content in China by 13.97 ± 1.38% based on a meta-analysis of 422 sites where straw was returned [1]. Our results were similar (Table 1). The light fractions (LFs) (F-LF and O-LF), which are C pools sensitive to changes in practices of soil management, increased significantly in the return treatments by 107.78–644.31% and 26.00–720.00%, respectively, compared with CK. The LFs, which have high C:N ratios, decompose quickly due to the C pool between fresh organic matter and humus with a short turnover cycle of 1–15 years [25]. Their components generally include mycelia, spores, and microbial, animal, and plant residues, which are sources of C easily used by microorganisms [42]. The continuous return of straw in our study significantly increased the SOC content in LF. HF is mainly composed of humus bonded to clay minerals and has a more stable structure than LF [43]. HF has a longer turnover time because it is not easily decomposed by microorganisms [24], and short-term tillage will not strongly affect this fraction [44,45,46]. HF accounts for the majority of SOC, and the SOC content of HF in our study increased significantly with the amount of straw returned (Table 1). This finding indicated that the continuous return of straw increased the amounts of both labile C and stable C. This result was supported by SEM (Figure 5), indicated by the positive and direct effect of straw return on SOC content (p < 0.001), LFC (p < 0.001), and HFC (p < 0.01), consistent with our first hypothesis. A meta-analysis of 420 studies of straw return [47] documented that the long-term return of straw improved the contents of SOC, total nitrogen, and other nutrients, indicating that long-term straw return could comprehensively improve SOC and nutrient contents.
The response of SOC content to inputs of exogenous C depends on the initial SOC content [48]. Soils with higher initial SOC contents always have lower rates of C sequestration than those with lower initial SOC contents [49]. Mollisols generally have low rates of C sequestration because of their high initial C contents. Hao et al. [6] identified a significant linear correlation between the accumulation of SOC and C input in a Mollisol in China after 15 years of straw return, and C sequestration did not saturate. Mollisols have a higher potential for sequestering C because of their high clay contents, which plays an important role in the chemical stabilization of SOC by a mechanism of clay minerals. This mechanism consists of intermolecular interactions between SOC and inorganic soil components, which include ligand exchange, polyvalent cation bridges, and interactions of metal ions with organic substances [50]. The SOC contents of the bulk soil, LF, and HF in our study increased significantly in the treatment with 15 000 kg hm−2 of straw return, indicating the potential for increased C sequestration, even with straw return for ten years. The conclusion of our study is therefore consistent with the findings by Hao et al. [6]. More time is needed to determine when the storage of C in Mollisols will saturate at our study site.

4.2. Effects of Straw Return on Aggregate Distribution and Stability

The high return of straw biomass is a major factor affecting the formation and turnover of aggregates [17] because organic particles from added straw can bind with soil minerals to form microaggregates, which later develop into macroaggregates [51]. Our study found that continuous straw return increased the content of Lma and Sma and decreased the content of Mi (Figure 2), consistent with previous studies. Wang et al. [52] reported that a high amount of straw return (13,500 kg hm−2) significantly increased WSAs >5.00, 1.00–2.00, and 0.50–1.00 mm in arid land on the Loess Plateau of China. Wang et al. [29] found that returning 15,000 kg hm−2 of straw increased WSAs, consistent with our results. The decomposed straw residues can release polysaccharides and organic matter acids during decomposition, which causes the residues and soil particles to bind together to form large aggregates [53,54]. This mechanism can account for the increase in aggregates >2.00 and 2.00–0.25 mm in our study (Figure 2). Six et al. [27] reported that the number of hyphae was larger in aggregates >0.25 mm than the other aggregates. Hyphae can bind Mi into Lma by wrapping or secreting metabolic substances (Figure 6), which may account for the reduction in Mi and increase in Lma with straw return (Figure 2). Straw return did not significantly affect aggregates <0.053 mm, but Huang et al. [31] found that aggregates <0.053 mm were significantly reduced by the return of five types of straw (wheat, rice, maize, rape, and broad bean), likely due to a shorter experimental period, because the formation of large aggregates from Mi requires more time.
The large amount of straw returned in our study significantly increased aggregates >2.00 and 2.00–0.25 mm (p < 0.05) (Figure 2). Six et al. [28] reported that the stability of large WSAs (>0.25 mm) strongly influenced soil structure and was important for the retention of nutrients. Water-stable macroaggregates also improve soil structure for retaining nutrients, increasing the water-holding capacity and permeability and decreasing the erodibility of soil [28,55]. In addition to WSAs, MWD and GMD are important indicators of aggregate stability. These three indicators increased in our study with the increase in aggregates >0.25 mm after straw return. Straw return significantly increased GMD (p < 0.05) and WSA>0.25mm (p < 0.001). This finding is an indication that straw return could improve both the quantity and quality of large aggregates. The increase in the amount of macroaggregates enhances the ability of soil to resist erosion and the potential loss of SOC, which provides a viable way to prevent the degradation of fertility after straw return in Mollisols.

4.3. Effects of Straw Return on the SOC Density Fractions in the Aggregate Sizes

Previous evidence suggests that returning straw can increase SOC content in aggregates, especially those >0.25 mm [56,57,58,59]. The return of a large amount of straw in our study (S4) significantly increased the SOC content in aggregates >2.00 mm (Table 2), consistent with a previous study [52]. To further investigate the effect of straw return on the SOC density fractions in the aggregate size classes, we classified the SOC physical fractionation for each aggregate size class. Straw return significantly increased the SOC contents of F-LF, O-LF, and HF in aggregates >0.25 mm, and the SOC content was highest in S4. Studies have found that SOC is usually first incorporated into macroaggregates then into microaggregates [60,61]. Macroaggregates also contain more mycorrhizal fungi than do microaggregates, and the growth and metabolism of mycorrhizal fungi can also increase the SOC content in large aggregates (Figure 6), which may have contributed to the higher SOC content of Lma than Sma in L-LF (Figure 4).
LF can generally indicate changes in practices of soil management in the short term [25,45]. As a sensitive indicator of changes in SOC content, this C pool has a rapid turnover, which can more intuitively represent the effects of changes in soil conditions [62,63]. Zhao et al. [17] reported that maize straw, with a lower C:N ratio (40.36:1) than wheat straw (86.02:1), could rapidly decompose and is considered a higher quality straw. Smamhadthai et al. [64] reported that higher quality straw residue promoted HF, and our results consistently supported that finding (Table 1 and Figure 4). Previous studies have found that unstable residues (low C:N ratios) have a stronger but transient effect on aggregate stability [65]. The input of straw can affect the distribution of SOC and increase its content in aggregates, especially in Lma. HF is a more stable component with higher contents of SOC and longer turnover times than LF, which is less sensitive to changes in soil conditions [24]. We found that continuous straw return significantly increased the SOC content in each size fraction of aggregates when the amount of straw returned was 15,000 kg hm−2 (Figure 4). This result suggests that LF is gradually converted to HF and that unstable SOC fractions are converted to stable fractions after 10 years of straw return, which would improve soil structure and fertility. Ten years of straw return significantly increased in LF and increased the accumulation of SOC in HF.

4.4. Relationship between the Aggregates and SOC with Straw Return

Golchin et al. [18] suggested that fresh plant material entering the soil promotes the formation of aggregates because it is a source of C for microbial activity, which stimulates the production of soil-cementing substances. Fragments of plant material or particulate organic matter (POM) are gradually encapsulated by clay particles and microbial products during the decomposition of plant residues to form a stable core of microaggregates. Microbial mucus and metabolites further impregnate the mineral shell around the decomposing organic core to form very stable microaggregates [28]. The SOC available in the organic core is later depleted, leading to the cessation of microbial activity and the production of cement, which causes the microaggregates to lose stability and thus break down, forming a complex of silt-sized particles of organic minerals. Finally, these complexes are formed into large aggregates by the entanglement and gathering of fungal mycorrhizae. The studies cited above provide supporting evidence for the distribution of aggregates after 10 years of straw return in our study (Figure 2). Plant residues, after incorporation into mineral soil, are also partly present directly in soil as unprotected free LFC and partly protected by aggregates and transformed into closed LFC or POC [48].
SOC and unstable C play important roles in the stabilization of aggregates. Unstable C components are important cementing agents that can form macroaggregates from microaggregates [66]. Bronick and Lal [67] reported that unstable C associated with tillage was responsible for the destruction of aggregates. If straw is not applied, the stability of aggregates is reduced and deteriorates with the reduction of unstable C during long-term tillage, which will lead to the loss of SOC. Alternatively, straw return can increase the number of large aggregates, creating physical protection from decomposition and the loss of unstable C and SOC [68,69]. The SOC contents of aggregates >0.25 mm in F-LF and O-LF in our study increased significantly after straw return (Figure 4), indicating that inputs of external C can improved the quantity and stability of large aggregates, which protect SOC after continuous straw return.

5. Conclusions

Mollisol fertility and quality improved significantly after 10 years of continuous straw return. The SOC contents were significantly higher in the bulk soil, F-LF, O-LF, and HF compared with CK. The quantity of aggregates >0.25 mm was significantly higher, and the quantity of aggregates 0.25-0.053 mm was significantly lower, after straw return compared with CK. GMD, MWD, and WAS0.25 mm were significantly higher than CK, and the SOC contents of F-LF, O-LF, and HF in aggregates >0.25 mm were significantly higher. S4 influenced the above results the most. Ten years of straw return strongly affected fertility in the Mollisol, and we suggest that the amount of straw returned in S4 (15,000 kg hm−2) was highly effective. We only studied the topsoil layer, so the effect of continuous straw return on soil deeper than 20 cm remains unknown but has the potential to have a positive effect. Our study focused on the physical properties of the soil, but the chemical properties of organic matter are equally important. Our future research will therefore explore the effect of returning straw on the chemical composition of SOC.

Author Contributions

X.H. and W.Z. conceived and designed the experiments. J.G. and C.Q. performed the experiments and analyzed the data. X.L., J.Y., X.C. and D.K.-M. revised the manuscript. All authors have read and agreed to the published version of the manuscript.

Funding

The study was funded by Strategic Priority Research Program of the Chinese Academy of Sciences, Grant NO. XDA28070100 and China Agriculture Research System of MOF and MARA (CARS04).

Institutional Review Board Statement

Not applicable.

Informed Consent Statement

Not applicable.

Data Availability Statement

The data presented during this study are available on reasonable request from the corresponding author.

Conflicts of Interest

The authors declare no conflict of interest.

References

  1. Wang, Y.; Wu, P.; Mei, F.; Ling, Y.; Qiao, Y.; Liu, C.; Leghari, S.J.; Guan, X.; Wang, T. Does continuous straw returning keep China farmland soil organic carbon continued increase? A meta-analysis. J. Environ. Manag. 2021, 288, 112391. [Google Scholar] [CrossRef] [PubMed]
  2. Xu, X.; Pei, J.; Xu, Y.; Wang, J. Soil organic carbon depletion in global Mollisols regions and restoration by management practices: A review. J. Soils Sediment. 2020, 20, 1173–1181. [Google Scholar] [CrossRef]
  3. Knorr, W.; Prentice, I.C.; House, J.I.; Holland, E.A. Long-term sensitivity of soil carbon turnover to warming. Nature 2005, 433, 298–301. [Google Scholar] [CrossRef] [PubMed]
  4. Zech, W.; Senesi, N.; Guggenberger, G.; Kaiser, K.; Lehmann, J.; Miano, T.M.; Miltner, A.; Schroth, G. Factors controlling humification and mineralization of soil organic matter in the tropics. Geoderma 1997, 79, 117–161. [Google Scholar] [CrossRef]
  5. Duan, Y.; Chen, L.; Li, Y.; Wang, Q.; Zhang, C.; Ma, D.; Li, J.; Zhang, J. N, P and straw return influence the accrual of organic carbon fractions and microbial traits in a Mollisol. Geoderma 2021, 403, 115373. [Google Scholar] [CrossRef]
  6. Hao, X.; Han, X.; Wang, S.; Li, L.-J. Dynamics and composition of soil organic carbon in response to 15 years of straw return in a Mollisol. Soil Tillage Res. 2022, 215, 105221. [Google Scholar] [CrossRef]
  7. Thangarajan, R.; Bolan, N.S.; Tian, G.; Naidu, R.; Kunhikrishnan, A. Role of organic amendment application on greenhouse gas emission from soil. Sci. Total Environ. 2013, 465, 72–96. [Google Scholar] [CrossRef]
  8. Lal, R. Soil quality impacts of residue removal for bioethanol production. Soil Tillage Res. 2009, 102, 233–241. [Google Scholar] [CrossRef]
  9. Niu, X.; Ju, X. Organic fertilizer resources and utilization in China. J. Plant Nutr. Fert. 2017, 23, 1462–1479. [Google Scholar]
  10. Chabbi, A.; Lehmann, J.; Ciais, P.; Loescher, H.W.; Cotrufo, M.F.; Don, A.; SanClements, M.; Schipper, L.; Six, J.; Smith, P.; et al. Aligning agriculture and climate policy. Nat. Clim. Chang. 2017, 7, 307–309. [Google Scholar] [CrossRef]
  11. Oliveira, M.; Barre, P.; Trindade, H.; Virto, I. Different efficiencies of grain legumes in crop rotations to improve soil aggregation and organic carbon in the short-term in a sandy Cambisol. Soil Tillage Res. 2019, 186, 23–35. [Google Scholar] [CrossRef]
  12. Ma, E.; Zhang, G.; Ma, J.; Xu, H.; Cai, Z.; Yagi, K. Effects of rice straw returning methods on N2O emission during wheat-growing season. Nutr. Cycling Agroecosyst. 2010, 88, 463–469. [Google Scholar] [CrossRef]
  13. Bai, Y.-l.; Wang, L.; Lu, Y.-l.; Yang, L.-p.; Zhou, L.-p.; Ni, L.; Cheng, M.-f. Effects of long-term full straw return on yield and potassium response in wheat-maize rotation. J. Integr. Agric. 2015, 14, 2467–2476. [Google Scholar] [CrossRef]
  14. Ahmed, W.; Qaswar, M.; Jing, H.; Wenjun, D.; Geng, S.; Kailou, L.; Ying, M.; Ao, T.; Mei, S.; Chao, L.; et al. Tillage practices improve rice yield and soil phosphorus fractions in two typical paddy soils. J. Soils Sediments 2020, 20, 850–861. [Google Scholar] [CrossRef]
  15. Bossuyt, H.; Denef, K.; Six, J.; Frey, S.D.; Merckx, R.; Paustian, K. Influence of microbial populations and residue quality on aggregate stability. Appl. Soil Ecol. 2001, 16, 195–208. [Google Scholar] [CrossRef]
  16. Soon, Y.K.; Lupwayi, N.Z. Straw management in a cold semi-arid region: Impact on soil quality and crop productivity. Field Crops Res. 2012, 139, 39–46. [Google Scholar] [CrossRef]
  17. Zhao, H.; Shar, A.G.; Li, S.; Chen, Y.; Shi, J.; Zhang, X.; Tian, X. Effect of straw return mode on soil aggregation and aggregate carbon content in an annual maize-wheat double cropping system. Soil Tillage Res. 2018, 175, 178–186. [Google Scholar] [CrossRef]
  18. Golchin, A.; Oades, J.M.; Skjemstad, J.O.; Clarke, P. Soil-Structure and Carbon Cycling. Aust. J. Soil Res. 1994, 32, 1043–1068. [Google Scholar] [CrossRef]
  19. Ndzelu, B.S.; Dou, S.; Zhang, X. Corn straw return can increase labile soil organic carbon fractions and improve water-stable aggregates in Haplic Cambisol. J. Arid Land 2020, 12, 1018–1030. [Google Scholar] [CrossRef]
  20. Haynes, R.J. Labile organic matter as an indicator of organic matter quality in arable and pastoral soils in New Zealand. Soil Biol. Biochem. 2000, 32, 211–219. [Google Scholar] [CrossRef]
  21. Ghani, A.; Dexter, M.; Perrott, K.W. Hot-water extractable carbon in soils: A sensitive measurement for determining impacts of fertilisation, grazing and cultivation. Soil Biol. Biochem. 2003, 35, 1231–1243. [Google Scholar] [CrossRef]
  22. Chen, H.Q.; Hou, R.X.; Gong, Y.S.; Li, H.W.; Fan, M.S.; Kuzyakov, Y. Effects of 11 years of conservation tillage on soil organic matter fractions in wheat monoculture in Loess Plateau of China. Soil Tillage Res. 2009, 106, 85–94. [Google Scholar] [CrossRef]
  23. Golchin, A.; Clarke, P.; Baldock, J.A.; Higashi, T.; Skjemstad, J.O.; Oades, J.M. The effects of vegetation and burning on the chemical composition of soil organic matter in a volcanic ash soil as shown by C-13 NMR spectroscopy. 1. Whole soil and humic acid fraction. Geoderma 1997, 76, 155–174. [Google Scholar] [CrossRef]
  24. Christensen, B.T. Physical fractionation of soil and structural and functional complexity in organic matter turnover. Eur. J. Soil Sci. 2001, 52, 345–353. [Google Scholar] [CrossRef]
  25. Gregorich, E.G.; Beare, M.H.; McKim, U.F.; Skjemstad, J.O. Chemical and biological characteristics of physically uncomplexed organic matter. Soil Sci. Soc. Am. J. 2006, 70, 975–985. [Google Scholar] [CrossRef]
  26. Roscoe, R.; Buurman, P. Tillage effects on soil organic matter in density fractions of a Cerrado Oxisol. Soil Tillage Res. 2003, 70, 107–119. [Google Scholar] [CrossRef]
  27. Six, J.; Elliott, E.T.; Paustian, K. Soil macroaggregate turnover and microaggregate formation: A mechanism for C sequestration under no-tillage agriculture. Soil Biol. Biochem. 2000, 32, 2099–2103. [Google Scholar] [CrossRef]
  28. Six, J.; Bossuyt, H.; Degryze, S.; Denef, K. A history of research on the link between (micro)aggregates, soil biota, and soil organic matter dynamics. Soil Tillage Res. 2004, 79, 7–31. [Google Scholar] [CrossRef]
  29. Wang, Y.; Zhang, J.H.; Zhang, Z.H. Influences of intensive tillage on water-stable aggregate distribution on a steep hillslope. Soil Tillage Res. 2015, 151, 82–92. [Google Scholar] [CrossRef]
  30. Wang, X.; Cammeraat, E.L.H.; Cerli, C.; Kalbitz, K. Soil aggregation and the stabilization of organic carbon as affected by erosion and deposition. Soil Biol. Biochem. 2014, 72, 55–65. [Google Scholar] [CrossRef]
  31. Huang, R.; Lan, M.; Liu, J.; Gao, M. Soil aggregate and organic carbon distribution at dry land soil and paddy soil: The role of different straws returning. Sci. Total Environ. 2017, 24, 27942–27952. [Google Scholar] [CrossRef]
  32. Naser, H.M.; Nagata, O.; Tamura, S.; Hatano, R. Methane emissions from five paddy fields with different amounts of rice straw application in central Hokkaido, Japan. Soil Sci. Plant Nutr. 2007, 53, 95–101. [Google Scholar] [CrossRef]
  33. Sun, H.; Ji, Q.; Wang, Y.; Wang, X. The Distribution of Water-stable Aggregate-associated Organic Carbon and Its Oxidation Stability Under Different Straw Returning Modes. J. Agr. Environ. Sci. 2012, 31, 369–376. [Google Scholar]
  34. Zhang, M.; Cheng, G.; Feng, H.; Sun, B.; Zhao, Y.; Chen, H.; Chen, J.; Dyck, M.; Wang, X.; Zhang, J.; et al. Effects of straw and biochar amendments on aggregate stability, soil organic carbon, and enzyme activities in the Loess Plateau, China. Environ. Sci. Pollut. Res. 2017, 4, 10108–10120. [Google Scholar] [CrossRef]
  35. Tian, P.; Lian, H.; Wang, Z.; Jiang, Y.; Li, C.; Sui, P.; Qi, H. Effects of Deep and Shallow Tillage with Straw Incorporation on Soil Organic Carbon, Total Nitrogen and Enzyme Activities in Northeast China. Sustainability 2020, 12, 8679. [Google Scholar] [CrossRef]
  36. Zhou, M.; Xiao, Y.; Li, Y.; Zhang, X.; Wang, G.; Jin, J.; Ding, G.; Liu, X. Soil quality index evaluation model in responses to six-year fertilization practices in Mollisols. Arch. Agron. Soil Sci. 2022, 68, 180–194. [Google Scholar] [CrossRef]
  37. Staff, S.S. Keys to Soil Taxonomy; United States Department of Agriculture, Natural Resources Conservation Service: Washington, DC, USA, 2010.
  38. Six, J.; Elliott, E.T.; Paustian, K.; Doran, J.W. Aggregation and soil organic matter accumulation in cultivated and native grassland soils. Soil Sci. Soc. Am. J. 1998, 62, 1367–1377. [Google Scholar] [CrossRef]
  39. Puget, P.; Angers, D.A.; Chenu, C. Nature of carbohydrates associated with water-stable aggregates of two cultivated soils. Soil Biol. Biochem. 1999, 31, 55–63. [Google Scholar] [CrossRef]
  40. Kemper, W.D.; Rosenau, R.C. Aggregate stability and size distribution. In Methods of Soil Analysis. Part 1. Physical and Mineralogical Methods; Klute, A., Ed.; ASA-SSSA: Madison, WI, USA, 1986; pp. 425–440. [Google Scholar]
  41. Wang, X.; Jia, Z.; Liang, L.; Han, Q.; Ding, R.; Yang, B.; Cui, R. Effects of organic manure application on dry land soil organic matter andwater stable aggregates. Chin. J. Appl. Ecol. 2012, 23, 159–165. [Google Scholar]
  42. Spycher, G.; Sollins, P.; Rose, S. Carbon and nitrogen in the light fraction of a forest Soil-vertical-distribution and seasnal patterns. Soil Sci. 1983, 135, 79–87. [Google Scholar] [CrossRef]
  43. John, B.; Yamashita, T.; Ludwig, B.; Flessa, H. Storage of organic carbon in aggregate and density fractions of silty soils under different types of land use. Geoderma 2005, 128, 63–79. [Google Scholar] [CrossRef]
  44. Quiroga, A.R.; Buschiazzo, D.E.; Peinemann, N. Soil organic matter particle size fractions in soils of the semiarid Argentinian pampas. Soil Sci. 1996, 161, 104–108. [Google Scholar] [CrossRef]
  45. Bhattacharyya, R.; Kundu, S.; Srivastva, A.K.; Gupta, H.S.; Prakash, V.; Bhatt, J.C. Long term fertilization effects on soil organic carbon pools in a sandy loam soil of the Indian sub-Himalayas. Plant Soil 2011, 341, 109–124. [Google Scholar] [CrossRef]
  46. Mitchell, E.; Scheer, C.; Rowlings, D.; Conant, R.T.; Cotrufo, M.F.; Grace, P. Amount and incorporation of plant residue inputs modify residue stabilisation dynamics in soil organic matter fractions. Agric. Ecosyst. Environ. 2018, 256, 82–91. [Google Scholar] [CrossRef]
  47. Huang, T.; Yang, N.; Lu, C.; Qin, X.; Siddique, K.H.M. Soil organic carbon, total nitrogen, available nutrients, and yield under different straw returning methods. Soil Tillage Res. 2021, 214, 105171. [Google Scholar] [CrossRef]
  48. Six, J.; Conant, R.T.; Paul, E.A.; Paustian, K. Stabilization mechanisms of soil organic matter: Implications for C-saturation of soils. Plant Soil 2002, 241, 155–176. [Google Scholar] [CrossRef]
  49. Stewart, C.E.; Paustian, K.; Conant, R.T.; Plante, A.F.; Six, J. Soil carbon saturation: Concept, evidence and evaluation. Biogeochemistry 2007, 86, 19–31. [Google Scholar] [CrossRef]
  50. Lützow, M.V.; Kögel-Knabner, I.; Matzner, E.; Guggenberger, G.; Marschner, B.; Flessa, H. Stabilization of organic matter in temperate soils: Mechanisms and their relevance under different soil conditions—A review. Eur. J. Soil Sci. 2006, 57, 426–445. [Google Scholar] [CrossRef]
  51. Liu, C.; Lu, M.; Cui, J.; Li, B.; Fang, C. Effects of straw carbon input on carbon dynamics in agricultural soils: A meta-analysis. Glob. Chang. Biol. 2014, 20, 1366–1381. [Google Scholar] [CrossRef]
  52. Wang, X.; Jia, Z.; Liang, L.; Yang, B.; Ding, R.; Nie, J.; Wang, J. Maize straw effects on soil aggregation and other properties in arid land. Soil Tillage Res. 2015, 153, 131–136. [Google Scholar] [CrossRef]
  53. Monreal, C.M.; Schnitzer, M.; Schulten, H.R.; Campbell, C.A.; Anderson, D.W. Soil Organic Structures in Macro and Microaggregates of a Cultivated Brown Chernozem. Soil Biol. Biochem. 1995, 27, 845–853. [Google Scholar] [CrossRef]
  54. Jastrow, J.D. Soil aggregate formation and the accrual of particulate and mineral-associated organic matter. Soil Biol. Biochem. 1996, 28, 665–676. [Google Scholar] [CrossRef]
  55. Yin, Y.; Liang, C.-H.; Pei, Z.-J. Effect of greenhouse soil management on soil aggregation and organic matter in northeast China. Catena 2015, 133, 412–419. [Google Scholar] [CrossRef]
  56. Manna, M.C.; Swarup, A.; Wanjari, R.H.; Mishra, B.; Shahi, D.K. Long-term fertilization, manure and liming effects on soil organic matter and crop yields. Soil Tillage Res. 2007, 94, 397–409. [Google Scholar] [CrossRef]
  57. Purakayastha, T.J.; Rudrappa, L.; Singh, D.; Swarup, A.; Bhadraray, S. Long-term impact of fertilizers on soil organic carbon pools and sequestration rates in maize-wheat-cowpea cropping system. Geoderma 2008, 144, 370–378. [Google Scholar] [CrossRef]
  58. Banger, K.; Toor, G.S.; Biswas, A.; Sidhu, S.S.; Sudhir, K. Soil organic carbon fractions after 16-years of applications of fertilizers and organic manure in a Typic Rhodalfs in semi-arid tropics. Nutr. Cycl. Agroecosyst. 2010, 86, 391–399. [Google Scholar] [CrossRef]
  59. Thorburn, P.J.; Meier, E.A.; Collins, K.; Robertson, F.A. Changes in soil carbon sequestration, fractionation and soil fertility in response to sugarcane residue retention are site-specific. Soil Tillage Res. 2012, 120, 99–111. [Google Scholar] [CrossRef]
  60. Oades, J.M. Soil Organic-Matter and Structural Stability-Mechanisms and Implications for Management. Plant Soil. 1984, 76, 319–337. [Google Scholar] [CrossRef]
  61. Angers, D.A.; Recous, S.; Aita, C. Fate of carbon and nitrogen in water-stable aggregates during decomposition of (CN)-C-13-N-15-labelled wheat straw in situ. Eur. J. Soil Sci. 1997, 48, 295–300. [Google Scholar] [CrossRef]
  62. Sheng, H.; Zhou, P.; Zhang, Y.; Kuzyakov, Y.; Zhou, Q.; Ge, T.; Wang, C. Loss of labile organic carbon from subsoil due to land-use changes in subtropical China. Soil Biol. Biochem. 2015, 88, 148–157. [Google Scholar] [CrossRef]
  63. Duval, M.E.; Galantini, J.A.; Martinez, J.M.; Limbozzi, F. Labile soil organic carbon for assessing soil quality: Influence of management practices and edaphic conditions. Catena 2018, 171, 316–326. [Google Scholar] [CrossRef]
  64. Samahadthai, P.; Vityakon, P.; Saenjan, P. Effects of different quality plant residues on soil carbon accumulation and aggregate formation in a tropiacl sandy soil in northeast thailand as revealed by a 10-year field experiment. Land Degrad. Dev. 2010, 21, 463–473. [Google Scholar] [CrossRef]
  65. Martin, J.P.; Waksman, S.A. Influence of microorganisms on soil aggregation and erosion. Soil Sci. 1940, 50, 29–47. [Google Scholar] [CrossRef]
  66. Tisdall, J.M.; Oades, J.M. Organic-matter and water-stable aggregates in soils. Eur. J. Soil Sci. 1982, 33, 141–163. [Google Scholar] [CrossRef]
  67. Bronick, C.J.; Lal, R. Soil structure and management: A review. Geoderma 2005, 124, 3–22. [Google Scholar] [CrossRef]
  68. Cambardella, C.A.; Elliott, E.T. Carbon and Nitrogen Distribution in Aggregates from Culltivated and Native Grassland Soils. Soil Sci. Soc. Am. J. 1993, 57, 1071–1076. [Google Scholar] [CrossRef]
  69. Li, X.-G.; Wang, Z.-F.; Ma, Q.-F.; Li, F.-M. Crop cultivation and intensive grazing affect organic C pools and aggregate stability in and grassland soil. Soil Tillage Res. 2007, 95, 172–181. [Google Scholar] [CrossRef]
Figure 1. The study area with different scales in a map of China.
Agronomy 12 02374 g001
Figure 2. Effects of straw return on the size classes of soil aggregates. Different letters within a size fraction denote significant differences between treatments (p < 0.05). CK, S1, S2, S3, and S4 represent rates of return of corn straw of 0, 6000, 9000, 12,000, and 15,000 kg hm−2, respectively. >2.00 mm, large macroaggregates; 2.00–0.25 mm, small macroaggregates; 0.25–0.053 mm, microaggregates; <0.053 mm, silt plus clay.
Agronomy 12 02374 g002
Figure 3. Effects of straw return on MWD, GMD, and WSA>0.25mm. MWD, mean weight diameter; GMD, geometric mean diameter; WSA>0.25mm, water-stable aggregates >0.25 mm. Different letters denote significant differences between treatments (p < 0.05). CK, S1, S2, S3 and S4 represent rates of return of corn straw of 0, 6000, 9000, 12,000, and 15,000 kg hm−2, respectively.
Agronomy 12 02374 g003
Figure 4. Effects of straw return on the density fractions of soil organic carbon in the aggregate size classes. >2.00 mm, large macroaggregates; 2.00–0.25 mm, small macroaggregates; 0.25–0.053 mm, microaggregates; <0.053 mm, silt plus clay. F-LFC, free light fraction carbon; O-LFC, occluded light fraction carbon; HF-C, heavy fraction carbon. Different letters within a size fraction denote significant differences between treatments (p < 0.05). CK, S1, S2, S3, and S4 represent rates of return of corn straw of 0, 6000, 9000, 12,000, and 15,000 kg hm−2, respectively.
Agronomy 12 02374 g004
Figure 5. Structural equation model of the relationships among straw return, soil organic carbon indicators, and aggregate indicators. Red lines indicate positive relationships, dashed black lines indicate negative relationships, and black lines indicate non-significant relationships. Numbers associated with the lines are correlation coefficients. Arrow width indicates the strength of significant standardized path coefficients. R2 above each response variable in the model denotes the proportion of variance explained. *, p < 0.05; **, p < 0.01; ***, p < 0.001; SOC, soil organic carbon; LFC, light fraction carbon; HFC, heavy fraction carbon; MWD, mean weight diameter; GMD, geometric mean diameter; WSA>0.25mm, >0.25mm water-stable aggregates; GFI, goodness-of-fit; CFI, comparative fit index; RMSEA, root mean square error of approximation.
Agronomy 12 02374 g005
Figure 6. Graphical sketch of the effects of straw return for macroaggregates and microaggregates on the physical fractions of soil organic carbon (light and heavy fractions) and their transformation and microbial mechanisms. SOC, soil organic carbon; LF, light fraction; HF, heavy fraction; POM, particulate organic matter.
Agronomy 12 02374 g006
Table 1. Effects of straw return on the content of soil organic carbon (SOC) in bulk soil and the density fractions.
TreatmentBulk Soil (g kg−1)Density Fraction (g kg−1)
F-LFO-LFHF
CK21.89 ± 0.69 b0.33 ± 0.01 c0.08 ± 0.009 c16.42 ± 0.666 d
S122.76 ± 0.71 b0.69 ± 0.05 c0.29 ± 0.070 b19.95 ± 0.356 c
S224.75 ± 0.84 b1.30 ± 0.39 bc0.29 ± 0.106 ab21.92 ± 1.277 b
S324.82 ± 0.69 b2.05 ± 0.09 ab0.48 ± 0.018 b22.34 ± 0.520 b
S427.80 ± 0.64 a2.49 ± 1.25 a0.66 ± 0.183 a27.79 ± 1.423 a
CK, S1, S2, S3, and S4 represent rates of return of corn straw of 0, 6000, 9000, 12,000, and 15,000 kg hm−2, respectively. Data (means ± SDs, n = 3) followed by different letters denote significant differences between CK and the return treatments followed by an LSD test (Tukey’s test, p ≤ 0.05).
Table 2. Content of soil organic carbon in the size classes of soil aggregates.
TreatmentsLmaSmaMiSC
CK23.33 ± 2.34 b23.68 ± 0.64 a26.96 ± 1.65 a13.97 ± 0.78 a
S124.83 ± 2.09 ab24.46 ± 0.52 a29.07 ± 1.23 a14.24 ± 0.52 a
S225.44 ± 0.55 ab25.49 ± 0.56 a27.80 ± 0.45 a14.15 ± 0.18 a
S326.86 ± 0.47 ab26.79 ± 0.81 a29.34 ± 0.67 a14.55 ± 0.40 a
S427.11 ± 1.31 a25.98 ± 0.73 a27.41 ± 1.80 a14.44 ± 1.30 a
CK, S1, S2, S3, and S4 represent rates of return of corn straw of 0, 6000, 9000, 12,000, and 15.000 kg hm−2, respectively. Data (means ± SDs, n = 3) followed by different letters denote significant differences between the return treatments followed by an LSD test (Tukey’s test, p ≤ 0.05). The wet-sieving method was used to separate the aggregates as described by Six et al. and Puget et al. Lma, large macroaggregates (>2.00 mm); Sma, small macroaggregates (2.00–0.025 mm); Mi, microaggregates (0.25-0.053 mm); SC, silt plus clay (aggregates < 0.053 mm).
Publisher’s Note: MDPI stays neutral with regard to jurisdictional claims in published maps and institutional affiliations.

