Article

The Fate and Balance of Nitrogen on a Sloped Peanut Field on Red Soil

1
Jiangxi Academy of Water Science and Engineering, Nanchang 330029, China
2
College of National Territorial Resources and Environment, Jiangxi Agricultural University, Nanchang 330029, China
3
Jiangxi Provincial Key Laboratory of Soil Erosion and Prevention, Nanchang 330029, China
4
School of Soil and Water Conservation, Beijing Forestry University, Beijing 100083, China
*
Author to whom correspondence should be addressed.
Agronomy 2022, 12(10), 2388; https://doi.org/10.3390/agronomy12102388
Submission received: 31 August 2022 / Revised: 26 September 2022 / Accepted: 29 September 2022 / Published: 2 October 2022
(This article belongs to the Section Soil and Plant Nutrition)

Abstract

:
To comprehensively evaluate the fate of nitrogen (N) through erosion and leakage, and to reveal the constitution of the whereabouts for fertilizer N on a sloping red soil cultivated with peanut, two treatments with three repetitions of conventional fertilization and no fertilization were set up according to the N-balance method. Lysimetric devices were adopted to observe the output of N in terms of loss, plant use, and residual N under natural rainfall in 2017 and 2018 in De’an, Poyang Lake Basin, China. The results showed that (1) leaching water was the main pathway of N output from runoff (including erosion and leakage), and the TN (total N) concentration of each surface runoff exceeded surface water Class V standard value of 2.0 mg L−1. (2) The fertilizer N use rate, the residual rate, and the apparent loss rate were 25.19–27.87%, 9.92–14.79%, and 60.02–62.21%, respectively. The apparent fertilizer N loss rate caused by soil erosion and leakage was 0.11–5.90% and 4.27–16.27%, respectively. (3) N losses from surface runoff and leakage were higher in the wet year (2017), whereas the amount of residual N in the soil profile was higher in the dry year (2018). This study provides a scientific basis for the adjustment of crop N fertilization in the study area.

1. Introduction

In southern China, red soil covers a total area of 2.18 million km2, accounting for 36% of the country’s cultivated area and producing more than half of the country’s agricultural products, including oil and grain [1]. Because of rough terrain in this region, the sloped field is an important cultivated land type [2], supporting oil-crop planting such as peanut. According to statistics, both yield (4.6197 million ha) and planting area (17.332 million tons) of peanut in China ranked first in the world in 2018 [3,4]. The red soil sloped farmland in this region has favorable hydrothermal conditions, but poor soil corrosion resistance and frequent agricultural disturbance [5]. Therefore, the fertilizer N of sloped farmland does not only easily enter the atmosphere in gaseous form, but easily enters the water course with surface runoff, sediment and soil leakage [5]. This may reduce fertilizer N use efficiency for crops, and increase the risk of water pollution. To reduce the impact of fertilizer N loss on the environment and ensure the sustainable development of peanut oil crops, it is necessary for us to study the use, residue and loss of fertilizer N in sloped peanut farmland with red soil.
N is one of the most essential nutrients for vegetation growth. According to previous studies, the main items of N input in the soil-peanut-planting system are soil, fertilizer N, biological N fixation, N deposition, and seed N. [5,6]. Fertilizer N is a very important source of N input in this system, and the application of fertilizer N in farmland can effectively improve crop yield from a regional to global scale [7]. However, a lot of application of fertilizer N easily causes the increase of N surplus in farmland, destroys the original N balance in nature, and can result in a series of environmental issues such as surface water eutrophication and groundwater pollution [8,9,10]. Therefore, the global N overload problem has been regarded as a chemical time bomb by the scientific committee on environmental issues, part of the international scientific union. In addition, the N uptake of crops is limited, and the heavy application of fertilizer N will reduce its use efficiency. The soil N balance is an important basis for exploring the fate of N and the rational application of fertilizer [11,12]. Therefore, comprehensively analyzing the condition of soil N balance and use rate of fertilizer N in this region is necessary for us to promote the sustainable development of agriculture in artificial ecosystems.
The fertilizer N, whose apparent loss was 52% in China, for example, is one of the significant items of N input for farmland, and can be removed from the soil through erosion (surface runoff and eroded sediment), leakage, NXO emission, NH3 emission and other pathways [13]. Numerous quantitative studies on farmland N loss have been carried out, providing significant references for reducing farmland N losses, decreasing environmental damage, and optimizing field management measures [12,14,15]. For example, Zheng et al. [2] found that hedgerow indirectly reduced apparent N losses by reducing soil erosion in sloped field; this effect was positively correlated with the hedgerow’s planting years and reached a maximum in the fourth year after planting. Hartmann et al. [12] reported that fertilizer N management based on crop N requirement can effectively reduce soil N residues and losses; in the rotation system of summer corn and winter wheat, the amount of soil N mineralization could meet the needs of summer corn growth, but the N in summer farmland was very easily lost, so it was necessary to reduce the amount of N application in this period. However, the opportunities for N loss are diverse and the processes are complex, and the factors, such as climate conditions, soil properties and farming management, have important effects on it, which makes the N loss show obvious spatial–temporal heterogeneity. Previous studies have mainly focused on N losses from flat farmland cultivated with grain crops such as rice, maize, wheat, and potatoes [16,17,18,19], whereas studies of N losses on sloped fields cultivated with oil crops are scarce, especially taking into consideration the influences of erosion and leakage [20,21]. As a result, the research on N loss in sloping farmland is not systematic enough, and it is difficult to guide and optimize N application management.
In this study, the sloped filed of red soil growing peanut was the object of study in Poyang Lake. According to N-balance method, we investigated its fate of N and the apparent N balance under the influence of erosion (including surface runoff and erosive sediment) and leakage. The use rate and losses of fertilizer N in this region were calculated using the subtraction method. The main objectives of this study were to: (1) determine the distribution of N losses through soil erosion and leakage water, and provide scientific guidance for the prevention and control of N loss; (2) reveal the constitution of the whereabouts for fertilizer N and the balance status of N input and output; (3) determine the rationality of current N fertilization in this area and provide a reference for optimizing the N management.

2. Materials and Methods

2.1. Study Site

The experiment was carried in the Jiangxi Ecological Park of Soil and Water Conservation (29°16′ N to 29°17′ N, 115°42′ E to 115°43′ E) in De’an, Jiangxi Province, southern China. The study site was 15 km away from Poyang Lake, the largest freshwater lake in China. The climate is subtropical monsoon, with a mean annual precipitation of 1436.8 mm (2001–2018), concentrated in April to August and accounting for 62.93% of the annual precipitation. Mean annual temperature is 16.7 °C, with a mean annual evaporation of 1558 mm. The mean annual frost-free period lasts for 249 d, and the area receives 1650–2100 h of sunshine per year. The landform is shallow hillock, with an elevation of 30–100 m and a slope of 5–25°. The zonal vegetation is subtropical evergreen broad-leaved forest on quaternary red clay-developed red soil. Due to the close proximity to Poyang Lake, the distribution of sloping farmland is concentrated; during the spring–summer period, peanut is the main crop.

2.2. Research Method

2.2.1. Test Device

The test device was a lysimeter used to observe water and soil erosion (Figure 1), with a length of 3 m, a width of 0.75 m and a height of 0.6 m. In the bottom of the soil tank, we drilled holes with a distance of 15 × 15 cm (aperture 10 mm), and laid a layer of geotextile to prevent the sand from blocking the holes. A 10 cm layer of fine sand (passed through a 5 mm sieve) was placed on the geotextile to ensure water infiltration during the test. The test soil was silty loam texture according to the U.S. system. Prior to use, the soil, which was obtained from a traditional sloped peanut field (0–40 cm) in study site, was passed through a 10 mm sieve and mixed thoroughly. Based on the thickness of the cultivated soil layer in the study site, the soil tank was filled with red soil four times, creating a 10 cm layer each time. The bulk density of the filled soil was controlled at 1.15 g cm−3 in the 0–20 cm layer and 1.32 g cm−3 in the 21–40 cm layer, according to the field measurement. The basic physical and chemical properties of the test soil are shown below: pH: 5.0; content of organic matter, TN and total phosphorus were 7.64 g kg−1, 0.52 g kg−1 and 0.18 g kg−1, respectively; content of alkaline hydrolysis N and available phosphorus were 33.32 mg kg−1 and 0.34 mg kg−1, respectively; content of clay, silt and sand were 28.39%, 50.32% and 21.29%, respectively. After filling, we placed the soil tank in the field, and settled the soil for approximately 2 weeks.

2.2.2. Experimental Design

The field experiment consisted of two treatments, namely conventional fertilization (CF) and no fertilization (NF). Each treatment was performed in three replications, and a total of six lysimeters were randomly arranged. The slope of each lysimeter was adjusted to 8°, representing the slope of most farmland sites in the Poyang watershed. The peanut was pure hybrid 1016, planed in shallow ditches in accordance with the local planting habits. Each lysimeter had 8000 holes ha−1 and three grains per hole (each hole with two seedlings). In 2017, sowing was performed on 17 May and harvesting on 19 August; in 2018, sowing was performed on May 4 and harvesting on August 16. The base fertilizer application rate was 103.2 kg N ha−1, 117 kg P2O5 ha−1, and 100 kg K2O ha−1 in 2017, with a topdressing rate of 68.8 kg N ha−1. In 2018, base fertilization consisted of 150 kg N ha−1, 117 kg P2O5 ha−1, and 100 kg K2O ha−1; because of sufficient peanut growth, no topdressing was applied.
Meteorology, runoff, and sediment yield: During the experiment, rainfall, runoff, and sediment yield were observed at each rainfall event, according to the standard of the Ministry of Water Resources of the People’s Republic of China, namely the “Soil and Water Conservation Test Specification” (SL 419-2007) [23]. Rainfall data were obtained using a siphon self-recording rainfall meter set in the test area, and the temperature data were recorded by a thermometer in the shutter box; water levels were recorded by the water gauge installed in the runoff tank, surface runoff and leakage amount were calculated by multiplying the water level by the tank’s bottom area; runoff sediment concentration was measured by drying 800 mL of solution from three evenly mixed samples in the upper, middle, and lower parts of the runoff tank, and erosion sediment yield was calculated by multiplying the runoff sediment concentration by the runoff amount.
Determination of the N content in samples: After the end of each rainfall event, the water remained for 4 h in the runoff tank, and 500 mL samples were taken in bottles. Each bottle was spiked with two drops of concentrated sulfuric acid, brought to the laboratory, stored at 4 °C, and analyzed within 48 h. We removed all the sediment from bottom of the runoff tank and weighed it. After that, we collected 500 g sediment, air-dried and then passed it through 100-mesh sieves in reserve. After the experiment, soil samples were collected according to the “S” shape stratification (0–5, 6–10, 11–20, 21–30, 31–40 cm), and the concentrations of TN were detected [24]. In the analysis and detection, the water samples were shaken to test the TN content (including suspended and dissolved particles). The remaining water samples were filtered through a 0.45-μm filter membrane, and the contents of dissolved TN (DTN), NH4+-N, and NO3-N were determined. Both TN and DTN were determined by alkaline potassium persulfate digestion-UV spectrophotometry, NH4+-N was analyzed via sodium salicylate spectrophotometry, and NO3-N was determined by the hydrazine sulfate reduction method [25].
Determination of TN content in plant: At the mature stage, six peanut plants were randomly selected from each plot. After air-drying at room temperature, the samples were oven-dried to constant weight at 70 °C, crushed through a 60-mesh sieve, and stored in a sealed plastic bag for the determination of the TN content. Plant TN was digested with concentrated sulfuric acid and hydrogen peroxide, and N was determined by distillation [26].

2.2.3. Data Processing

Evaluating the N balance is a powerful tool when investigating the N cycle and N fate in ecosystems; it is one of the common methods for studying soil N use and its loss. To simplify the calculation, it was assumed that atmospheric dry deposition and biological N fixation were equivalent to the background loss of soil N (other apparent loss) without fertilization. The amount of N mineralization (Nmin), neglecting the activation effect of fertilizer N, was estimated by the amount of Nmin in the N-free zone. Based on the above assumptions, the N balance in the soil-peanut-planting system could be simplified as follows: input (fertilizer N, soil initial inorganic N (Nini), Nmin, precipitation N, seed N) and output (crop absorption N, soil residual inorganic N and apparent N loss). The apparent loss under the experimental conditions included N leaching, N loss by surface runoff and sediment (N erosion), and other losses such as gas, according to the reference for the calculation of N-balance indices [11]. The equations are as follows:
P dl = P lc P ln
where Pdl (kg ha−1) is the amount of N loss by different ways (erosion, leakage, etc.), Plc (kg ha−1) is the amount of CF N loss, Pln (kg ha−1) is the amount of NF N loss.
R dl = P dl × 100 % ÷ P f
where Rdl ( % ) is the rate of N loss by different ways, Pf (kg ha−1) is the amount of fertilizer N.
P ini ( P res ) = H × D × P sb ( P sa ) ÷ 10
where Pini (kg ha−1) is the amount of Nini, Pres (kg ha−1) is the amount of soil residual N, H (m) is the thickness of soil, D (t m−3) is soil bulk density, Psb (kg ha−1) is the amount of soil inorganic N before experimenting, Psa (kg ha−1) is the amount of soil inorganic N after experimenting.
P min = P cn + P resn + P ln P inin P pn P sn
where Pmin (kg ha−1) is the amount of Nmin, Pcn (kg ha−1) is the amount of NF crop absorption N, Presn (kg ha−1) is the amount of NF soil residual N, Pln (kg ha−1) is the amount of NF apparent N loss, Pinin (kg ha−1) is the amount of NF’s Nini loss, Ppn (kg ha−1a) is the amount of NF precipitation N from atmosphere, Psn (kg ha−1) is the amount of NF seed N.
P al = P i + P c P res
where Pal (kg ha−1) is the amount of apparent N loss, Pi (kg ha−1) is the amount of N input, Pc (kg ha−1) is the amount of crop absorption N, Pres (kg ha−1) is the amount of soil residual N.
R au = ( P cc + P cn ) × 100 % ÷ P f
where Rau ( % ) is the rate of N use, Pcc (kg ha−1) is the amount of CF crop absorption N.
R ares = ( P resc P resn ) × 100 % ÷ P f
where Rares ( % ) is the rate of soil residual N, Presc (kg ha−1) is the amount of CF soil residual N.
The experimental data were analyzed with R version 4.1.1 [27], and the confidence interval was 95%. For each treatment, one-way ANOVA with Tukey’s HSD comparison was applied to determine the differences in runoff, sediment yield, and N losses between CF and NF with the “agricolae” package [28]. The differences of each observation index between 2017 and 2018 were also examined using this method. Excel 2013 and Origin Pro 2017 were used to process data and draw charts.

3. Results

3.1. Characteristics of Rainfall, Runoff, and Sediment Yield

In 2017, the average temperature during the peanut-growing season was 27.9 °C, with a rainfall amount of 976.2 mm, accounting for 54.8% of the annual rainfall (1781.4 mm). In 2018, the average temperature was 28.6 °C, with 408.7 mm of rainfall, accounting for 35.3% of the annual rainfall (1157.8 mm). According to the long-term observation data of local rainfall, 2017 was a wet year, whereas 2018 was a dry year.
As seen in Table 1, the surface runoff amount of each treatment (CF and NF) in 2017 was 635.75–729.50 mm, with a sediment yield of 6109.17–7587.82 kg ha−1. The surface runoff amount (58.45–69.72 mm) and sediment yield (1228.54–1323.62 kg ha−1) of each treatment in 2018 were significantly lower than those in 2017. In addition, the leakage amount of each treatment was greater than the surface runoff amount, accounting for 61.16–73.08% of the total runoff amount, which was the main output pathway of rainfall-runoff.

3.2. Characteristics of N Output by Erosion and Leakage

3.2.1. N Loss by Leaching Water

The TN leakage losses in CF in 2017 and 2018 were 54.86 and 11.18 kg ha−1, respectively, which were higher than those of NF in the corresponding planting year. In 2017 and 2018, the leakage output of DTN (including NH4+-N, NO3-N and dissolved organic N) in each treatment accounted for 89.73–90.58% and 90.16–92.26% of the TN output from leakage. The main form was NO3-N, accounting for 37.80–50.33% of TN in 2017 and 70.57–75.31% in 2018, whereas NH4+-N only accounted for 3.61–5.10% in 2017 and 5.37–6.07% in 2018 (Table 2).
In 2017, the output of exogenous N (i.e., fertilizer N) with leaching water in the peanut-growing season was 27.98 kg ha−1, accounting for 16.27% of its input (172 kg ha−1). In 2018, the export of exogenous N with leaching water was 6.40 kg ha−1, accounting for 4.27% of its input (150 kg ha−1). Exogenous N leaching was dominated by inorganic N, especially NO3-N, and the NO3-N leaching amount accounted for 62.37–67.03% of the total leaching amount (Table 3).

3.2.2. N Loss by Soil and Water Loss

N loss by Surface Runoff

In the treatments CF and NF, during the growing season in 2017, TN output values by surface runoff were 20.07 and 11.27 kg ha−1, respectively. The DTN (including NH4+-N, NO3-N and dissolved organic N) output values were 17.39 and 8.86 kg ha−1, accounting for 86.65% and 78.62% of TN output by surface runoff, respectively. In 2018, the N loss by surface runoff was relatively small, and there was no significant difference between CF and NF. At the same time, NH4+-N and NO3-N were the main forms of dissolved N lost via surface runoff during the monitoring period. In 2017 and 2018, NH4+-N and NO3-N accounted for 27.42–39.71% and 12.96–20.88% of TN loss in surface runoff, respectively (Table 4).
The TN output of exogenous N (Table 5) in 2017 was 8.80 kg ha−1, accounting for 5.12% of its input (172 kg ha−1). The output of exogenous N with surface runoff in 2018 was 0.14 kg ha−1, accounting for 0.09% of its input (150 kg ha−1). The surface runoff output of inorganic N accounted for 64.55–78.57% of TN loss in 2017 and 2018, respectively.

N Loss by Erosion Sediment

Based on Table 6, in 2017 and 2018, TN output by erosion sediment of CF was higher than that of NF, although this difference was not significant (p > 0.05). In 2017, the TN export in the eroded sediment under CF and NF was 5.22 and 0.80 kg ha−1, respectively; in 2018, these values were 0.80 and 0.77 kg ha−1. The output of exogenous N in 2017 and 2018 was 1.35 and 0.03 kg ha−1, respectively, accounting for 0.78% and 0.02% of the fertilizer input in the corresponding years. The loss of exogenous N with erosion sediment was relatively small.

3.3. Direction of Fertilizer N

3.3.1. Apparent N Balance

As seen in Table 7, the N supply of the soil itself (the sum of Nmin Nini) in 2017 and 2018 was 88.44 and 128.43 kg ha−1, respectively. However, the N uptake of crops of CF in the corresponding planting years was 107.90 kg ha−1, 107.16 kg ha−1. Fertilizer N is the most important source of the all N input, accounting for 50.86–60.73%. The apparent N losses of CF in 2017 and 2018 were 149.02 and 96.20 kg ha−1, respectively, which were significantly higher than those of NF. The amount of N surface runoff loss, N sediment loss, N leaching loss in 2017 were all significantly higher than those in 2018. The same pattern was observed for NF.

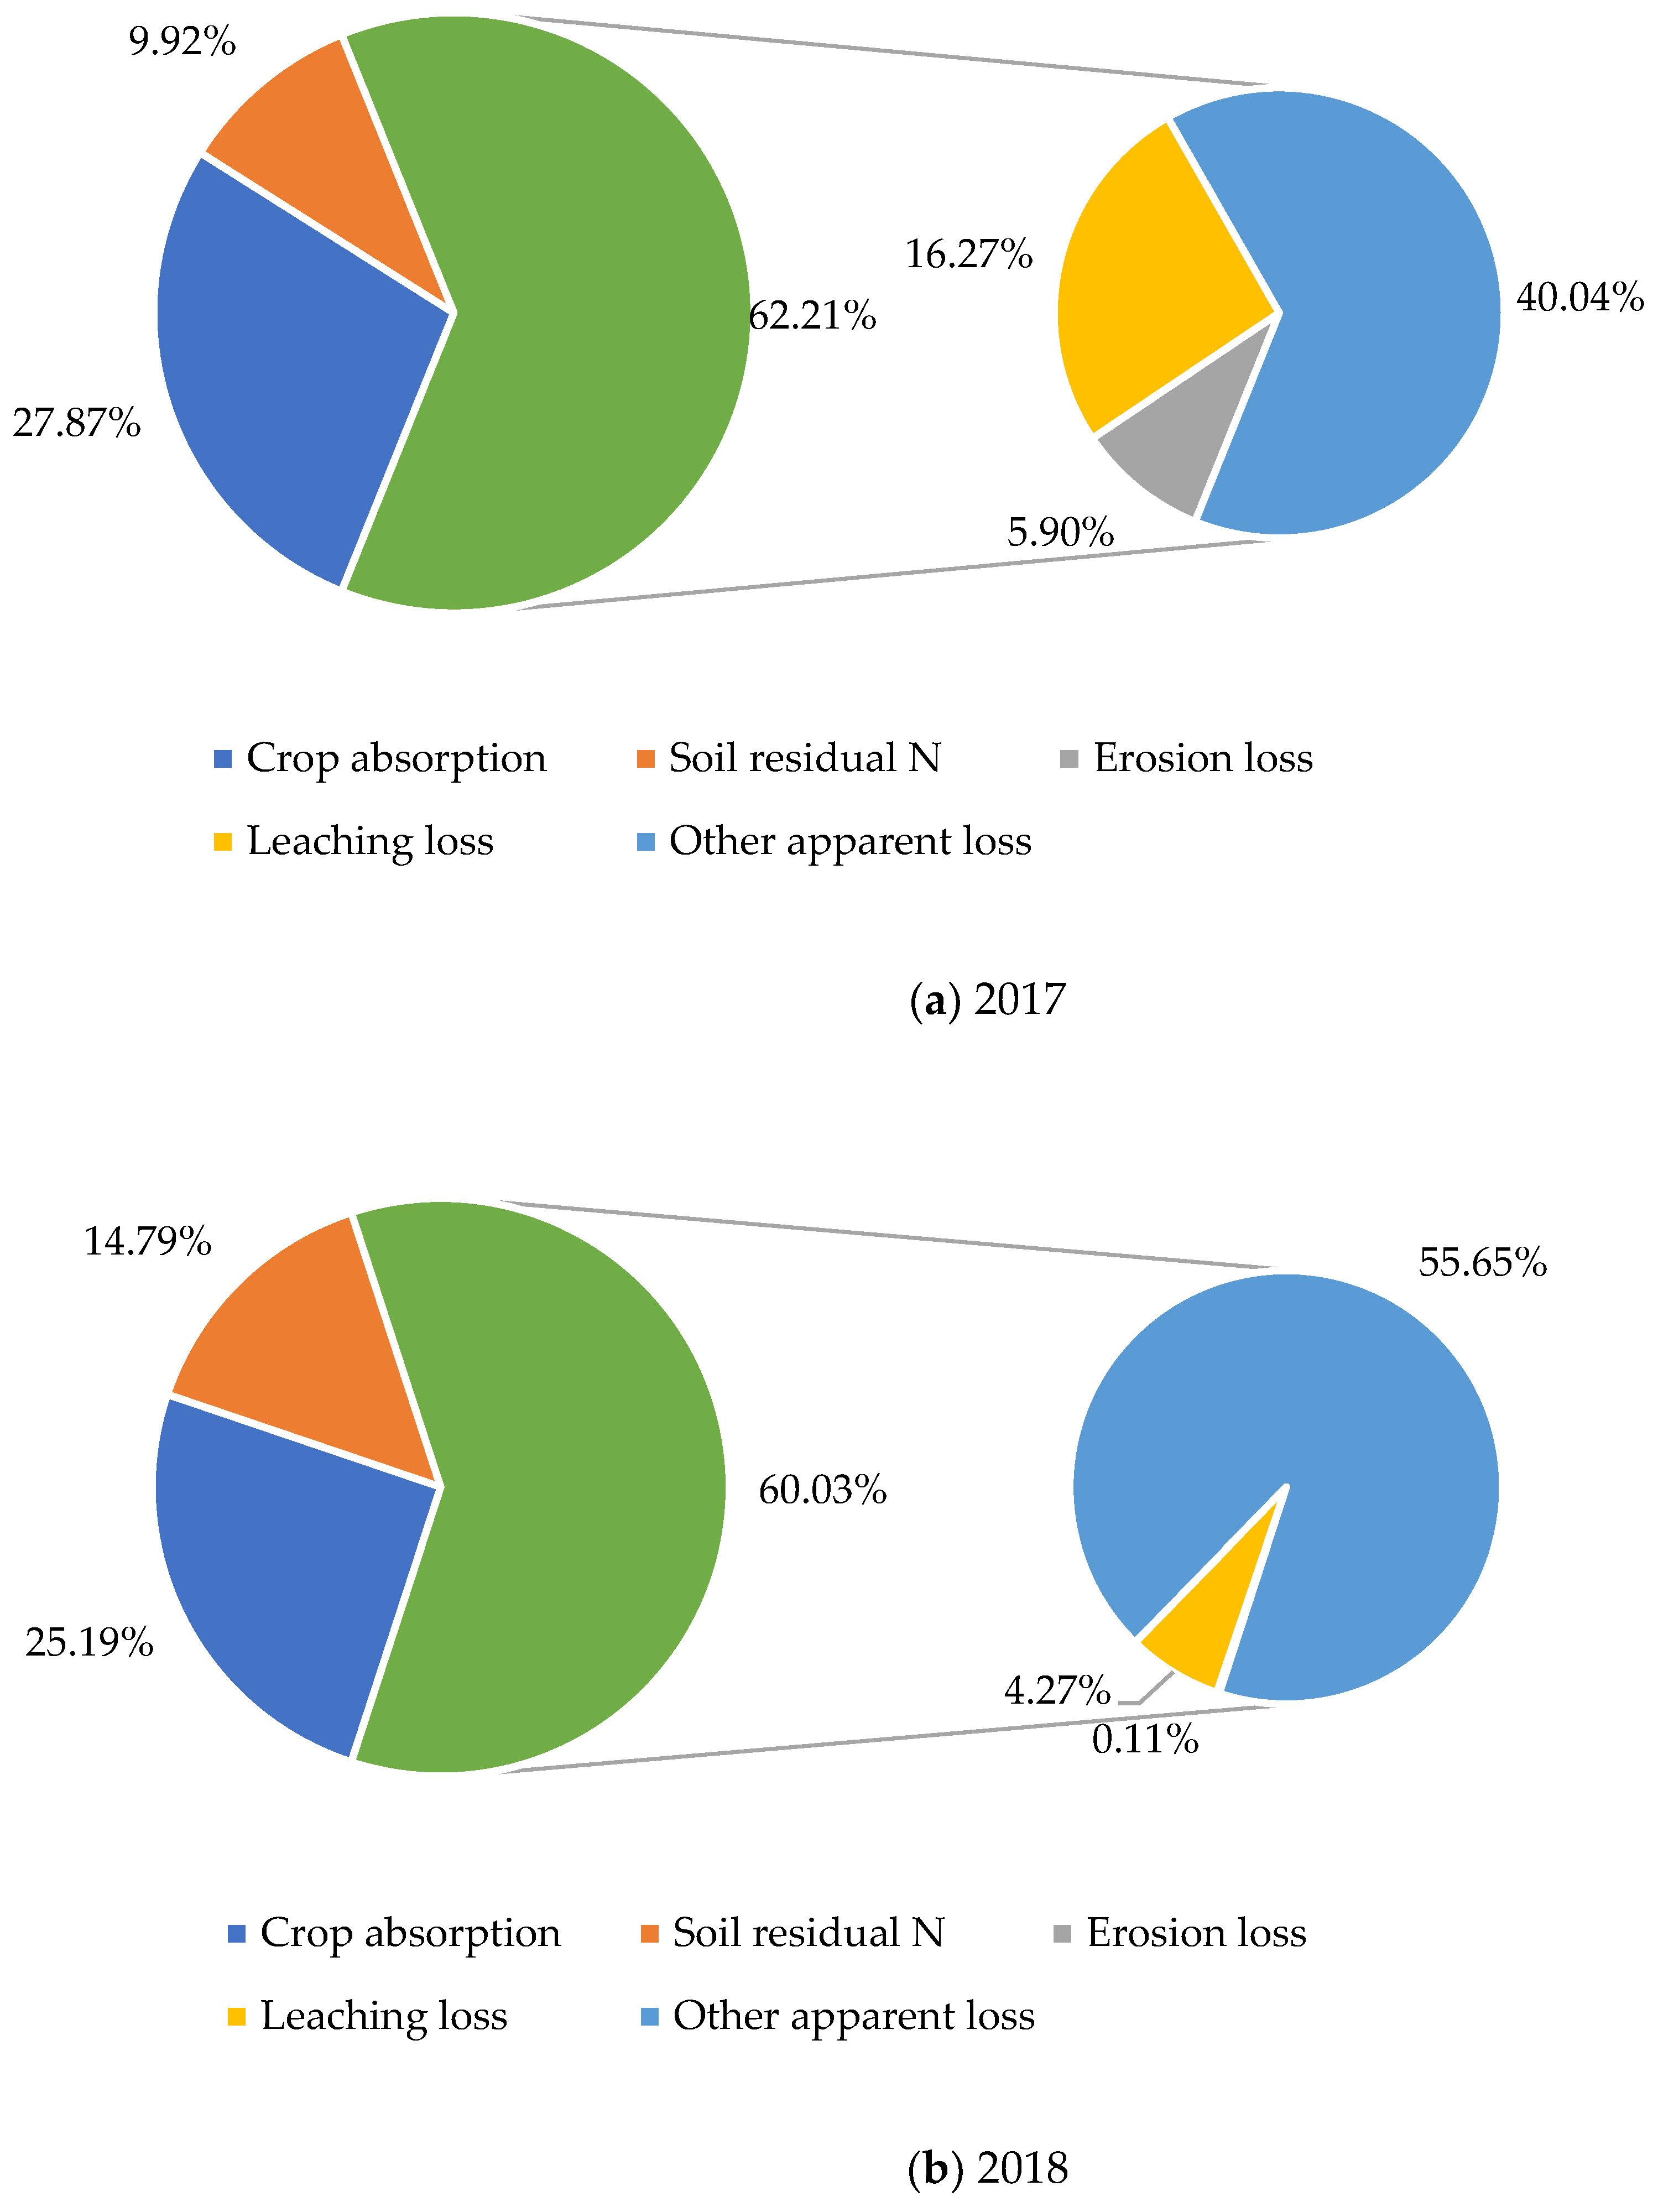
3.3.2. The Apparent Fate of Fertilizer N

Based on Figure 2, the apparent use rates of fertilizer N in 2017 and 2018 were 25.19–27.87%, indicating a great potential for fertilizer N use in sloped farmland on red soil. Under conventional fertilization in 2017 and 2018, 9.92–14.79% of the fertilizer N remained in soil after peanut harvest for second crop use, respectively.
Under the conditions of CF, 72.13–74.81% of fertilizer N could not be absorbed by crops, and 60.07–62.21% of the fertilizer N was lost from the soil-crop system (Figure 2). In this study, fertilizer N was mainly lost via erosion, leaching, and other losses such as gas loss. The results showed that the other apparent losses (such as gaseous N) of N obtained by the subtraction method were 40.04–55.64%. The N leaching loss rate was 4.27–16.27%, with an N erosion loss rate of 0.11–5.90%.

4. Discussion

4.1. Apparent N Balance and Its Influencing Factors

The experimental environment and tillage methods in this study resembled the local planting conditions. Generally, the main N input items are fertilizer application, soil initial inorganic N, soil organic matter mineralization, seed N and precipitation N [7,11]. In our study, the proportion of fertilizer N (Table 7) was the largest (accounting for 50.86–60.73%), followed by soil itself N (Nmin and Nini, accounting for 31.22–43.55%), and finally other sources such as seed and precipitation N (accounting for 8.05–5.59%) in CF. As shown in Table 7, the amount of Nmin and Nini in test soil was similar to the N required for peanut growth. This indicates that the tested soil had a strong N supply capacity due to long-term tillage and fertilization. In addition, precipitation N increased and Nmin decreased in the wet year. Because of the rainfall, the precipitation N in this region was a non-negligible factor for N balance. We found Nini in 2018 was smaller than that in 2017. This is maybe because there was less soil residual N in 2017. Therefore, we should pay attention to the influence of rainfall on N input in soil N balance. Because this test focused on the N loss pathway and its contribution, we did not consider the biological N fixation effect, and subsequent studies would be improved by taking this into account.
The main fates of fertilizer N in farmland are crop absorption, N losses, and residual N in the soil profile [5]. The results of this experiment (Figure 2) show that the N use efficiency of a peanut sloped field on red soil was only 25.19–27.87%, the residual rate of soil inorganic N was 9.92–14.79%, and apparent N loss was 60.02–62.21%. Compared with Zhu’s [13] estimation of fertilizer N fates (crop use 35%, total loss 52%, soil residue 13%) in flat farmland in China, we found that the loss rate of fertilizer N was higher, the N absorption rate of crops was lower, and the soil residual rate was relatively similar in our experiment. The reason for this is that compared with other crops, peanut has a relatively low demand for fertilizer N, so its N use rate is low [6]. Meanwhile, previous studies on the apparent balance of soil N mostly focused on flat land, whereas on sloped land, the migration output of N with lateral seepage (soil flow) is higher, along with the migration output of N with surface runoff and sediment [22,29]. In addition, the spatial and temporal distribution of rainfall is one of the important factors affecting farmland N losses [30]. Based on our results (Table 3 and Table 5), the surface runoff and leakage losses of N were relatively large (21.39% of the total amount of fertilization) in the wet year (2017), and the residual N in the soil profile accounted for 9.92% of the amount of fertilization. In the dry year (2018), N losses via surface erosion and leakage were significantly lower (accounting for 4.36% of fertilizer N) than in the wet year (2017). At the same time, the residual rate of soil inorganic N (14.79%) increased. Thus, in dry years, it is more likely that residual soil inorganic N occurs, with a reduced loss of soil N.
A too-high apparent loss rate of N can damage the ecological environment and reduce the N use efficiency. Rainfall and fertilization are important factors for the apparent N balance of sloped farmland on red soil. In this experiment, the rainfall in the peanut-growing season in 2018 was only about half of the average annual rainfall in the same period, with runoff and sediment yields of only 9.20–9.56% and 17.44–20.11% of those in 2017. Runoff and sediment are important carriers of soil N losses; in the wet year, they need to be controlled or even prevented [13]. In both years, the N application amount was 150–172 kg ha−1 in accordance with local practices and the N use rate was 25.19–27.87%. Zheng [5] showed that comprehensive benefit (crop yield, environment, soil fertility, etc.) was the highest when the N application was 90 kg N ha−1 for sloped farmland on red soil; the TN loss was 34.95 kg ha−1, which was 63.63–76.55% lower than that in our experiment (96.13–149.02 kg ha−1); the N output concentration of surface runoff also decreased significantly. This means the amount of local conventional fertilization exceeded the N required for peanut growth in our experiment. Therefore, fertilizer reduction and efficiency increase proposed in China’s 14th Five-Year National Agricultural Green Development Plan will greatly improve the current situation of fertilizer use in China and promote the green development of agriculture in China. Optimized water and N management, with the combined application of biochar and fertilizer N, can also significantly reduce N losses from farmland [31,32,33]. According to different crops and planting environments (climate, soil, topography, etc.), appropriate fertilizer application and tillage modes can reduce excessive N levels and prevent N input into the surrounding environment.

4.2. Key Pathways and Regulation Suggestions

The main pathways of N loss in farmland are soil erosion (including surface runoff and erosion sediment), leakage, and gas emissions [22,34]. Affected by the nature of red soil, the local climatic conditions and the farming practices, most N is lost via leaching water from sloped farmland [35]. In this study (Figure 2), the N leaching rate was 4.27–16.27%, the loss rate via N erosion was 0.11–5.90%, and other apparent loss rates, such as via gas, ranged from 40.04 to 55.69%. Although gas emission was the main form of N loss, leakage and erosion also play important roles. Similar, in a study on N loss in red soil by Lai et al. [36], under different fertilization treatments, the gaseous N loss rate was 21.38–48.16%, and the leakage rate was 3.56–16.81%. Zhu [13] preliminarily estimated the fate of farmland fertilizer N in China and reported gaseous losses of fertilizer N of 45%, leaching losses of 2%, and surface runoff losses of 5%. However, the first study did not consider N losses via sediment erosion [36]; the second study took the whole country as the research area, whereas the area of this study was southern China with abundant rainfall. Therefore, the amount of leached N in this experiment was higher than that in Zhu’s.
Some researchers have suggested that leaching water is the main carrier of N in red soil [37]. In this study, the leakage loss rate of fertilizer N was 4.27–16.27% (Table 3), and the main loss form was dissolved N, which was greatly affected by rainfall. In addition, the proportion of N erosion loss in sloped land with red soil was relatively low, but the TN concentration of each surface runoff all exceeded 2.0 mg L−1. According to the environmental quality standards for surface water in China, every surface runoff in this experiment (TN concentration > 2.0 mg L−1) belongs to the inferior V type water and it can increase the risk of eutrophication in rivers and lakes [34,38]. At the same time, in the eroded sediment, the surface runoff mainly carries fine sediment, resulting in nutrient enrichment, which makes the nutrient content of eroded sediment higher than that of basic soil [39]. About 82.35–86.70% of N was lost with surface runoff in surface erosion (Table 4 and Table 6), mainly in the form of NH4+-N (27.42–39.71% of TN surface runoff loss) and NO3-N (12.96–20.88% of TN surface runoff loss), which is consistent with the results of previous work [40].
Considering that other apparent loss rates, such as via gas, are the main pathways of N loss from sloping fields, N loss via erosion can lead to water eutrophication via nutrient enrichment. In this sense, the regulation of N losses from such fields should focus on N gas and erosion losses. Fertilization is an important factor affecting N losses [41,42], and a reasonable reduction in fertilization reduces N runoff and gas losses without significant reductions in crop yield [11]. In addition, reasonable soil and water conservation measures such as hedgerow [2], ridge cultivation [43], and straw mulching [44] can effectively prevent and control surface runoff and erosion, further reducing N losses and improving fertilizer use efficiency.

5. Conclusions

The peanut-planting period in summer is the main period of rainfall on red soil sloping farmland in southern China. The apparent loss rate of N fertilizer caused by erosion (including surface runoff and erosive sediment) and leakage is 4.36–21.39%. The N loss amount caused by leakage accounts for 63.97–88.31% of TN in runoff (including erosion and leakage), while the N concentration via surface runoff is relatively high, which has a high risk of inducing eutrophication. With abundant rainfall in the wet year, the surface runoff and leakage loss of N increases, while the residual N in the soil profile increases in the dry year. In addition, because N loss is greatly affected by rainfall, effective measures should be taken to control erosion in wet years, and the late crop planting mode and fertilizer application level should be adjusted to increase the use of residual N in dry years. This research reveals the situation of N loss and fertilizer N use and helps provide a reference to optimize fertilization and tillage of sloped land in this region.

Author Contributions

Conceptualization, H.Z.; L.W.; X.N. and J.C.; methodology, L.Z. and H.Z.; software, L.Z., validation, L.Z., L.W. and H.Z.; formal analysis, L.Z. and L.W.; investigation, L.Z. and J.Z.; resources, H.Z. and J.C.; data curation, X.N.; writing—original draft preparation, L.Z.; writing—review and editing, H.Z., X.N., S.L. and J.Z.; visualization, L.Z. and J.Z.; supervision, H.Z. and S.L.; project administration, H.Z. and J.C.; funding acquisition, H.Z. All authors have read and agreed to the published version of the manuscript.

Funding

This research was funded by the National Natural Science Foundation of China (41761060), National Science and Technology Award Reserve Project Cultivation Plan of China (20212AEI91011) and Jiangxi Provincial Water Conservancy Science and Technology Project (202124ZDKT22).

Data Availability Statement

Not applicable.

Acknowledgments

We would like to thank Kunming You and Xiaodan Hu for field observations during the whole experiment. We thank Jiangxi Ecological Science Park of Soil and Water Conservation for kindly providing the test site.

Conflicts of Interest

The authors declare no conflict of interest.

References

  1. Huang, G.; Zhao, Q. Initial exploration of red soil ecology. Acta Ecol. Sin. 2014, 34, 5173–5181. [Google Scholar]
  2. Zheng, H.; Li, H.; Mo, M.; Song, Y.; Liu, Z.; Zhang, H. Quantified benefits of cultivating day-lily (Hemerocallis citrina) hedgerows over multiple years on sloped red-soil farmland, southern China. J. Soil Sci. Plant Nutr. 2020, 21, 69–80. [Google Scholar] [CrossRef]
  3. Wu, Q.; Wang, Y.; Zhao, Y.; Li, R.; Si, Y.; Huang, Y.; Ye, Y.; Zhang, F. Effects of NPK ratio on yield, nutrient absorption and economic benefit of high-yielding summer peanut in a fluvo-aquic soil. Soil Fertil. Sci. China 2019, 2, 98–104. [Google Scholar]
  4. FAOSTAT. Crops and Livestock Products. 2022. Available online: https://www.fao.org/faostat/en/#data/QCL/visualize (accessed on 5 March 2022).
  5. Zheng, W.; Tan, W.; Liu, Z.; Wang, L.; Zheng, H. Effect of reduced nitrogen fertilization on nitrogen runoff loss and apparent balance on red-soil dry slope peanut land. Acta Pedol. Sin. 2022, accepted; in press. [Google Scholar]
  6. Wang, C.; Zheng, Y.; Shen, P.; Zheng, Y.; Wu, Z.; Sun, X.; Yu, T.; Feng, H. Determining N supplied sources and N use efficiency for peanut under applications of four forms of N fertilizers labeled by isotope 15N. J. Integr. Agric. 2016, 15, 432–439. [Google Scholar] [CrossRef]
  7. Sainju, U.; Lenssen, A.; Allen, B.; Stevens, J. Nitrogen balance in dryland agroecosystem in response to tillage, crop rotation, and cultural practice. Nutr. Cycl. Agroecosystems 2018, 110, 467–483. [Google Scholar] [CrossRef] [Green Version]
  8. Zhang, X.; Davidson, E.A.; Mauzerall, D.L.; Searchinger, T.D.; Dumas, P.; Shen, Y. Managing nitrogen for sustainable development. Nature 2015, 528, 51–59. [Google Scholar] [CrossRef] [Green Version]
  9. Gu, B.; Ju, X.; Chang, S.; Ge, Y.; Chang, J. Nitrogen use efficiencies in Chinese agricultural systems and implications for food security and environmental protection. Reg. Environ. Chang. 2017, 17, 1217–1227. [Google Scholar] [CrossRef]
  10. Zuo, H.; Zhang, Q.; Ma, L.; Xu, L.; Lv, W.; Ma, C.; Yang, Z.; Wang, Z. Dynamic variation characteristics of nitrate nitrogen concentration in farmland leaching water under different planting patterns. J. Soil Water Conserv. 2010, 24, 174–179. [Google Scholar]
  11. Ding, Y.; Yang, X.; Tong, Y.A.; Han, Z.; Chen, C.; Tang, X. Characteristics of N leaching and apparent N budget in cultivated lands under a winter wheat-summer maize rotation system. Acta Sci. Circumstantiae 2015, 35, 1914–1921. [Google Scholar]
  12. Hartmann, T.E.; Yue, S.; Schulz, R.; Chen, X.; Zhang, F.; Müller, T. Nitrogen dynamics, apparent mineralization and balance calculations in a maize—Wheat double cropping system of the north China plain. Field Crops Res. 2014, 160, 22–30. [Google Scholar] [CrossRef]
  13. Zhu, Z. Research on soil nitrogen in China. Acta Pedol. Sin. 2008, 5, 778–783. [Google Scholar]
  14. Javier, A.; Peter, M.; Corinne, V.; Miguel, A.G. Impacts of cultivation and fallow length on soil carbon and nitrogen availability in the Bolivian Andean highland region. Mt. Res. Dev. 2013, 33, 391–403. [Google Scholar]
  15. Shi, Z.; Li, D.; Jing, Q.; Cai, J.; Jiang, D.; Cao, W.; Dai, T. Effects of nitrogen applications on soil nitrogen balance and nitrogen utilization of winter wheat in a rice–wheat rotation. Field Crops Res. 2012, 127, 241–247. [Google Scholar] [CrossRef]
  16. Yang, Y.; Liu, B.; Yu, L.; Zhou, Z.; Ni, X.; Tao, L.; Wu, Y. Nitrogen loss and rice profits with matrix-based slow-release urea. Nutr. Cycl. Agroecosystems 2018, 110, 213–225. [Google Scholar] [CrossRef]
  17. Lawlor, P.A.; Helmers., M.J.; Baker., J.L.; Melvin., S.W.; Lemke., D.W. Nitrogen application rate effect on nitrate-nitrogen concentration and loss in subsurface drainage for a corn-soybean rotation. Trans. ASABE 2008, 51, 83–94. [Google Scholar] [CrossRef]
  18. Wang, L.; Zhao, X.; Gao, J.; Clayton, R.B.; Chen, Q.; Liu, M.; Yang, Y.; Xia, Y.; Xiao, X. Effects of fertilizer types on nitrogen and phosphorous loss from rice-wheat rotation system in the Taihu Lake region of China. Agric. Ecosyst. Environ. 2019, 285, 106605. [Google Scholar] [CrossRef]
  19. Cambouris, A.N.; St. Luce, M.; Zebarth, B.J.; Ziadi, N.; Grant, C.A.; Perron, I. Potato response to nitrogen sources and rates in an irrigated sandy soil. Agron. J. 2016, 108, 391–401. [Google Scholar] [CrossRef]
  20. Wang, C.; Li, S.; Wang, X.; Su, T. Nitrate nitrogen residue and leaching in dryland soil and influence factors. Soils 2006, 6, 676–681. [Google Scholar]
  21. Ma, K.; Wang, Z.; Chen, X.; You, L. Study on properties of nutrient loss from red soil in sloping land under different rainfall intensities. J. Soil Water Conserv. 2002, 3, 16–19. [Google Scholar]
  22. Zheng, H.; Liu, Z.; Nie, X.; Zuo, J.; Wang, L. Comparison of active nitrogen loss in four pathways on a sloped peanut field with red soil in China under conventional fertilization conditions. Sustainability 2019, 11, 6219. [Google Scholar] [CrossRef] [Green Version]
  23. SL 419-2007; Test Specification of Soil and Water Conservation. China Water&Power Press: Beijing, China, 2008.
  24. Lu, R. Soil Agrochemical Analysis Method; China Agricultural Science and Technology Press: Beijing, China, 2000; pp. 146–195. [Google Scholar]
  25. Guo, Z.; Liu, H.; Zhang, Y.; Zheng, J.; Chen, L. Effects of different fertilization modes on nitrogen loss bysurface runoff and the apparent nitrogen balance in the vegetable fields of Taihu Lake region. J. Soil Water Conserv. 2018, 32, 37–42. [Google Scholar]
  26. Bao, S. Soil Agrochemical Analysis, 3rd ed.; China Agriculture Press: Beijing, China, 2000; pp. 264–268. [Google Scholar]
  27. R Development Core Team. R: A Language and Environment for Statistical Computing; R Foundation for Statistical Computing: Vienna, Austria, 2021. [Google Scholar]
  28. Felipe, D.; Reinhard, S. Agricolae—Ten years of an open source statistical tool for experiments in breeding, agriculture and biology. PeerJ PrePrints 2015, 3, 1404. [Google Scholar]
  29. Macdonald, A.J.; Poulton, P.R.; Stockdale, E.A.; Powlson, D.S.; Jenkinson, D.S. The fate of residual 15N-labelled fertilizer in arable soils: Its availability to subsequent crops and retention in soil. Plant Soil 2002, 246, 123–137. [Google Scholar] [CrossRef]
  30. Schwenke, G.D.; Haigh, B.M. The interaction of seasonal rainfall and nitrogen fertiliser rate on soil N2O emission, total N loss and crop yield of dryland sorghum and sunflower grown on sub-tropical Vertosols. Soil Res. 2016, 54, 604–618. [Google Scholar] [CrossRef] [Green Version]
  31. Peng, S.; Yang, S.; Xu, J.; Luo, Y.; Hou, H. Nitrogen and phosphorus leaching losses from paddy fields with different water and nitrogen managements. Paddy Water Environ. 2011, 9, 333–342. [Google Scholar] [CrossRef]
  32. Gunavathy, S.; Huck, Y.C. Enhancing soil nitrogen availability and rice growth by using urea fertilizer amended with rice straw biochar. Agronomy 2021, 11, 1352. [Google Scholar]
  33. Figueiredo, C.C.D.; Wickert, É.G.; Vieira, N.H.C.; Coser, T.R.; PazFerreiro, J. Sewage sludge biochar increases nitrogen fertilizer recovery: Evidence from a 15N tracer field study. Soil Use Manag. 2020, 37, 689–697. [Google Scholar] [CrossRef]
  34. Tejada, M.; Gonzalez., J.L. Influence of two organic amendments on the soil physical properties, soil losses, sediments and runoff water quality. Geoderma 2008, 145, 325–334. [Google Scholar] [CrossRef]
  35. Wang, L.; Nie, X.; Zuo, J.; Liu, Z.; Zheng, H. Effects of growth periods nitrogen loss in runoff of peanut land on dry slope of red soil. J. Soil Water Conserv. 2019, 33, 34–40. [Google Scholar]
  36. Lai, T.; Li, C.; Li, Q.; Lai, Q. Study on the balance and fate of N in red arid soil. Plant Nutr. Fertil. Sci. 1995, 1, 85–89. [Google Scholar]
  37. Yang, J.; Zhou, Z.; Zhang, D.; Li, R.; Wu, H. Nitrogen and phosphorus leaching under pig manure application and safe manure digestion capacity of red clay soils of different fertilities. Soils 2019, 51, 305–315. [Google Scholar]
  38. Bouwman, L.; Goldewijk, K.K.; Van Der Hoek, K.W.; Beusen, A.H.; Van Vuuren, D.P.; Willems, J.; Rufino, M.C.; Stehfest, E. Exploring global changes in nitrogen and phosphorus cycles in agriculture induced by livestock production over the 1900–2050 period. Proc. Natl. Acad. Sci. USA 2013, 110, 20882–20887. [Google Scholar] [CrossRef] [PubMed] [Green Version]
  39. Lin, C.; Luo, C.; Pang, L.; Huang, J.; Fu, D.; Tu, S. Effects of different cultivation and mulching methods on soil erosion and nutrient losses from a purple soil of sloping land. Acta Ecol. Sin. 2010, 30, 6091–6101. [Google Scholar]
  40. Wang, Q.; Cao, Y.; Zhang, J.; Chen, G.; Li, Z.; Wu, H.; Wang, L. Characteristics of nitrogen transportation in castanea mollissima forest around the fushi reservoir watershed in north Zhejiang province, China. Chin. J. Appl. Ecol. 2017, 28, 545–553. [Google Scholar]
  41. Huang, S.; Lv, W.; Bloszies, S.; Shi, Q.; Pan, X.; Zeng, Y. Effects of fertilizer management practices on yield-scaled ammonia emissions from croplands in China: A meta-analysis. Field Crops Res. 2016, 192, 118–125. [Google Scholar] [CrossRef]
  42. Lian, Z.; Wei, O.; Hao, F.; Liu, H.; Hao, Z.; Lin, C.; Mengchang, H. Changes in fertilizer categories significantly altered the estimates of ammonia volatilizations induced from increased synthetic fertilizer application to Chinese rice fields. Agric. Ecosyst. Environ. 2018, 265, 112–122. [Google Scholar] [CrossRef]
  43. Zheng, H.; Nie, X.; Liu, Z.; Mo, M.; Song, Y. Identifying optimal ridge practices under different rainfall types on runoff and soil loss from sloping farmland in a humid subtropical region of Southern China. Agric. Water Manag. 2021, 255, 107043. [Google Scholar] [CrossRef]
  44. Shen, H.; Ma, R.; Ye, Q.; Feng, J.; Wang, J. Impacts of corn straw coverage and slope gradient on soil erosion and sediment size distributions in the Mollisol region, NE China. Eurasian Soil Sci. 2021, 54, 2000–2008. [Google Scholar] [CrossRef]
Figure 1. Test device diagram: (a) field diagram of lysimeter; (b) schematic of lysimeter [22].
Agronomy 12 02388 g001
Figure 2. The apparent fate of fertilizer N in peanut-growing season. Note: The values represent the proportion of N in different directions in 2017 (a) and 2018 (b). The pie chart on the left shows the proportion of the fertilizer N’s apparent fate through crop absorption, soil residual N, and apparent N loss. The pie chart on the right shows the proportion of fertilizer N loss through erosion, leaching, and other apparent loss (gaseous loss, etc.).
Agronomy 12 02388 g002
Table 1. Loss amount of runoff and sediment in peanut-growing season.
YearTreatmentRunoff Amount/mmProportion of Leaching Water/%Sediment Yield
/(kg ha−1)
Leakage WaterSurface RunoffTotal Runoff
2017CF468.30 ± 131.46 Aa261.20 ± 44.77 Aa729.50 ± 107.96 Aa64.197587.82 ± 2199.38 Aa
NF388.81 ± 95.36 Aa246.94 ± 50.15 Aa635.75 ± 107.95 Aa61.166109.17 ± 593.83 Aa
2018CF50.95 ± 16.04 Ba18.77 ± 3.59 Ba69.72 ± 19.63 Ba73.081323.62 ± 159.08 Ba
NF36.12 ± 3.98 Ba22.33 ± 2.10 Ba58.45 ± 6.08 Ba61.801228.54 ± 103.63 Ba
Data are means values of three replicates ± standard deviations. Different letters indicate significant differences between treatments (p < 0.05). For the same column, capital letters indicate significant differences between years of the same treatment, and small letters indicate significant differences between treatments in the same year. The same below.
Table 2. Loss amount and rate of N via leakage in peanut-growing season.
YearTreatmentN Output/(kg ha−1)Proportion in TN Output/%
TNDTNNH4+-NNO3-NDTNNH4+-NNO3-N
2017CF54.86 ± 12.10 Aa49.69 ± 10.60 Aa1.98 ± 0.77 Aa27.61 ± 5.63 Aa90.583.6150.33
NF26.88 ± 7.57 Ab24.12 ± 6.86 Ab1.37 ± 0.43 Aa10.16 ± 3.01 Ab89.735.1037.80
2018CF11.18 ± 4.27 Ba10.08 ± 3.47 Ba0.60 ± 0.14 Ba7.89 ± 3.48 Ba90.165.3770.57
NF4.78 ± 0.74 Ba4.41 ± 0.46 Ba0.29 ± 0.04 Bb3.60 ± 0.24 Ba92.266.0775.31
Table 3. Loss amount and rate of fertilizer N via leakage in peanut-growing season.
YearItemTNDTNInorganic Chemistry N
NO3-NNH4+-NSubtotal
2017Output/(kg ha−1)27.98 ± 4.5325.57 ± 3.7417.45 ± 2.620.61 ± 0.3418.06 ± 2.96
Proportion of N output/%100.0091.3962.372.1864.55
Proportion of fertilizer input/%16.2714.8710.150.3510.50
2018Output/(kg ha−1)6.40 ± 3.535.67 ± 3.014.29 ± 3.240.31 ± 0.104.60 ± 3.34
Proportion of N output/%100.0088.5967.034.8471.88
Proportion of fertilizer input/%4.273.782.860.213.07
Table 4. Loss amount and rate of N via surface runoff in peanut-growing season.
YearTreatmentN Output/(kg ha−1)Proportion in TN Output/%
TNDTNNH4+-NNO3-NDTNNH4+-NNO3-N
2017CF20.07 ± 3.72 Aa17.39 ± 3.03 Aa6.09 ± 0.74 Aa4.19 ± 0.94 Aa86.6530.3420.88
NF11.27 ± 2.71 Ab8.86 ± 2.08 Ab3.09 ± 0.96 Ab1.51 ± 0.85 Ab78.6227.4213.40
2018CF0.68 ± 0.14 Ba0.56 ± 0.10 Ba0.27 ± 0.19 Ba0.11 ± 0.06 Ba82.3539.7116.18
NF0.54 ± 0.04 Ba0.43 ± 0.06 Ba0.19 ± 0.06 Ba0.07 ± 0.03 Ba79.6335.1912.96
Table 5. Loss amount and rate of fertilizer N via surface runoff in peanut-growing season.
YearItemTNDTNInorganic Chemistry N
NO3-NNH4+-NSubtotal
2017Output/(kg ha−1)8.80 ± 1.018.53± 0.952.68 ± 0.093.00 ± 0.005.68 ± 0.09
Proportion of N output/%100.0096.9330.4534.0964.55
Proportion of fertilizer input/%5.124.961.561.743.30
2018Output/(kg ha−1)0.14 ± 0.100.13 ± 0.040.04 ± 0.030.08 ± 0.130.12 ± 0.16
Proportion of N output/%100.0092.8621.4357.1478.57
Proportion of fertilizer input/%0.090.090.030.050.08
Table 6. Loss amount of total N and fertilizer N via sediment in peanut-growing season.
YearTreatmentTN/(kg ha−1)Fertilizer N/(kg ha−1)
2017CF5.22 ± 1.28 Aa1.35 ± 0.77
NF3.87 ± 0.41 Aa--
2018CF0.80 ± 0.08 Ba0.03 ± 0.00
NF0.77 ± 0.08 Ba--
Table 7. N balance in peanut-growing period. Unit: N kg ha−1.
Item20172018
CFNFCFNF
A. Input of N(1) Fertilizer N17201500
(2) N mineralization28.3628.3691.7691.76
(3) Initial inorganic N60.0860.0836.6736.67
(4) Precipitation N11.4711.474.804.80
(5) Seed N11.3311.3311.6811.68
(1) + (2) + (3) + (4) + (5)283.24111.24294.91144.91
B. Output of N(1) Crop absorption107.959.97107.1669.38
(2) Soil residual N26.329.2591.6269.44
(3) N surface runoff loss20.0711.270.680.54
(4) N sediment loss5.223.870.80.77
(5) N leaching loss54.8626.8811.184.78
(6) Other apparent loss
(gaseous loss, etc.)
68.87--83.47--
(1) + (2) + (3) + (4) + (5) + (6)283.24111.24294.91144.91
Note: N mineralization, initial inorganic N and residues were only counted at 0–40 cm, and inorganic N refers to the sum of NH4+-N and NO3-N in fresh soil; other apparent losses were calculated by mass balance subtraction.
Publisher’s Note: MDPI stays neutral with regard to jurisdictional claims in published maps and institutional affiliations.

