Article

Agronomic Response of 13 Spanish Red Grapevine (Vitis vinifera L.) Cultivars under Drought Conditions in a Semi-Arid Mediterranean Climate

by
A. Sergio Serrano
1,2,
Jesús Martínez-Gascueña
1,
Gonzalo L. Alonso
2,*,
Cristina Cebrián-Tarancón
2,
M. Dolores Carmona
1,
Adela Mena
1 and
Juan L. Chacón-Vozmediano
1,*
1
Regional Institute of Agri-Food and Forestry Research, Development of Castilla-La Mancha (IRIAF), Ctra. Toledo-Albacete s/n, 13700 Tomelloso, Spain
2
Department Agricultural Chemistry, E.T.S.I. Agronomy and Forestry, University of Castilla-La Mancha, Avda. de España s/n, 02071 Albacete, Spain
*
Authors to whom correspondence should be addressed.
Agronomy 2022, 12(10), 2399; https://doi.org/10.3390/agronomy12102399
Submission received: 2 September 2022 / Revised: 28 September 2022 / Accepted: 30 September 2022 / Published: 4 October 2022

Abstract

:
Drought is perhaps the most important abiotic stressor affecting plants. Grapevine (Vitis vinifera L.) is a drought-tolerant species, and this feature makes it a traditional crop in semi-arid climate areas. However, not all cultivars respond to drought in the same way. Many studies on grapevine drought response have focused on physiological traits. This study mainly used agronomic indicators to assess the drought response of 13 red cultivars. Our results revealed high variability in must isotope ratios (δ13C and δ18O), yield components, and grape must quality. Bobal, Garnacha Peluda, Garnacha Tinta, Mazuela, and Moribel cultivars responded well to drought conditions, simultaneously maintaining high yields and must quality. By contrast, Garnacha Tintorera, Forcallat Tinta, and Tempranillo cultivars showed high water use efficiency but had low yield and must quality. Therefore, these cultivars can be considered poorly adapted to drought conditions. By knowing which cultivars perform well under drought conditions, viticulturists can reduce their reliance on water irrigation and continue to maintain vineyard sustainability in current and future semi-arid climatic conditions. This research also contributes novel information about the Castilla-La Mancha region, where there have been no previous similar assays.

1. Introduction

Drought stress is a critical factor in viticulture because it limits the yield and affects the grape quality [1,2,3] by altering grapevine physiology [4,5]. Currently, many wine-growing regions are vulnerable to drought, as vineyards are found mainly in dry climates. Many of these areas have semi-arid Mediterranean climates, characterized by warm and dry summers, in which vineyards are regularly exposed to long periods of seasonal drought. A 2016 report found that more than 90% of vineyards in Europe are rainfed [6]. This percentage is significantly lower in Spain, where it is 59.4% nationally and 49.3% in the Castilla-La Mancha region (2019 data obtained from the Spanish Ministry for Agriculture, Fisheries, and Food). Recent climate forecasts predict temperature increases and lower rainfall rates in the coming years, and consequently, drought events are likely to intensify [7]. Many traditional wine-growing regions will likely need to increase irrigation under these conditions. However, this is not a sustainable solution, particularly in semi-arid areas where water resources are increasingly limited [8,9]. In addition, the legislative regulation of water use by the European Union and individual countries is increasingly restrictive in these regions.
Although the grapevine genotypes currently cultivated in semi-arid environments are generally well adapted to water deficits and high temperatures, the suitability of some cultivars may soon become compromised [10,11,12]. As droughts intensify, they will negatively impact grapevine growth, physiology, and berry ripening, and vine yield and wines quality may suffer [13]. These effects are expected to be particularly severe for red cultivars, which may respond by producing grapes with lower concentrations of anthocyanins [14,15] and unbalanced in respect to sugar content [16,17].
Given these climate forecasts and their predicted effects on vineyards, identifying drought-tolerant cultivars is vital in developing strategies to maintain vineyard sustainability. However, drought tolerance is a complex concept [18], as it results from the combination of various types of stress, including low water availability, high evaporation demand, and heat stress. Consequently, no consensus has been reached as to which traits determine grapevine drought tolerance. Recently, a new quantitative measure named stress distance has been proposed. This parameter integrates four physiological traits related to the grapevines’ response to water stress: maximal transpiration rate, stomatal regulation, turgor loss point, and root volume [19].
To date, some studies on grapevine drought response have focused on agronomic indicators, such as yield and grapes quality [20,21,22,23,24,25,26]. Others have focused on physiological traits, such as stomatal regulation, carbon assimilation and hydraulic conductance, finding that both the rootstock and the scion genotypes confer drought adaptability traits, but in different ways [5,19,27,28,29,30]. While the rootstock influences the ability of the plant to extract water from the soil, the scion influences the sensitivity of the stomatal control [30]. Further studies are necessary to determine to what extent differences in yield or water use are attributable to innate genotypic differences between cultivars or environmental factors [24,31].
To determine the vine water status, the carbon isotope ratio of the grape must (δ13C) can be used. This is because the δ13C of the grape must at harvest is considered a physiological indicator of water stress that differs between rootstocks and cultivars [32]. It is an integrated marker of vine water status during berry growth, particularly during the veraison to harvest periods [33,34,35,36]. Carbon in plant tissues is fixed through photosynthesis and comes from existing in the atmosphere. In nature, there are two stable carbon isotopes: 12C is the lightest and more abundant form (98.93%), whereas 13C is heavier and represents 1.07% [37]. When C3 plants, such as grapevines, experience water deficit, stomatal closure is enhanced, and as a consequence, the 13C/12C ratio (δ13C) increases. This is because under these conditions there is less discrimination of the 13C form, due to the joint action of two processes. On the one hand, its diffusion through the stomata is prevented [38] and, on the other hand, its lower reactivity against the enzyme ribulose-1.5-biphosphate carboxylase-oxygenase (Rubisco), which prefers the 12C form, favors the relative proportion of 13C in the leaf. Therefore, it is common to observe that tissues of C3 plants growing under water deficit show greater δ13C than those from non-water-stressed plants [39,40].
In the present study, 13 Spanish red cultivars authorized for cultivation in Castilla-La Mancha region were monitored for three years under drought conditions in a multivarietal vineyard. The plants responses were assessed based on agronomic indicators, including the yield, grape quality, and vegetative development. The carbon isotope ratio of the grape must was measured at harvest as an indicator of vine water status. The study aimed to identify cultivars maintaining good yield and high grape quality under rainfed conditions, regardless of the genotypic traits or tolerance mechanisms leading this adaptation. This is the first comparative study of the drought behavior of grapevine cultivars performed in the La Mancha region.

2. Materials and Methods

2.1. Location and Plant Material

The present study was conducted from 2018 to 2020 in a multivarietal vineyard in Tomelloso, Spain (39°10′34” N; 3°00’01” W; 663 m.a.s.l.), belonging to the Regional Institute of Agri-Food and Forestry Research and Development of Castilla-La Mancha (IRIAF). Thirteen traditional red cultivars were selected for the present study: Bobal, Forcallat Tinta, Garnacha Peluda, Garnacha Tinta, Garnacha Tintorera, Graciano, Mazuela (syn. Carignan), Monastrell, Moravia Agria, Moribel, Tempranillo, Tinto de la Pámpana Blanca, and Tinto Velasco. The cultivars were arranged in parallel rows of 140 plants each. The plants were 15 years old and grafted onto 110-Richter rootstock. They were trained on a bilateral Royat cordon system and planted with a row spacing of 3 m and a vine spacing of 1.5 m. Twenty-two contiguous plants per cultivar were included in the study.

2.2. Climate, Soil, and Vine Water Regime

Tomelloso’s climate is Mediterranean continental semi-arid, with hot and dry summers and cold and moderately rainy winters. The annual thermal amplitude is high (21.5 °C). The mean annual rainfall is about 380 mm, of which only about 40% falls during the growing season, and drought periods are long (4.5 months). Figure 1 shows the monthly rainfall and mean air temperature at the study site during the three agronomic years of the experiment alongside the 20-year averages (2001–2020). The weather data used in this study were recorded at the Argamasilla de Alba weather station 6 km away from the experimental site. The station belongs to the SIAR network of the Spanish Ministry for Agriculture, Fisheries, and Food. The vapor pressure deficit (VPD) values were calculated using the FAO 56 methodology [41]. Each VPD value represents the average of the daily mean VPD values during the 7 days prior to the harvest date.
The soil at the study site is classified as Petric Calcisol (FAO soil classification) or Petrocalcic Calcixerept (USDA soil classification), typical of the La Mancha region. The main characteristic of this soil is the presence of a dense Ckm horizon 30 cm below the surface, impenetrable to grapevine roots. Subscripts k and m indicate carbonate accumulation and strong cementation or hardening, respectively. The pedoclimatic soil conditions are characterized by the typical xeric moisture regime of Mediterranean climates. The vineyard soil was managed mechanically by mowing the permanent natural plant cover throughout the year. Water was supplied to the vineyard by rainfall. However, at specific times, it was necessary to rehydrate the vines to ensure their survival. For this purpose, three 10 mm irrigations with local water from an aquifer well were carried out throughout the season each year (after fruit set, when the branches stopped growing, and when the berries reached the size of a pea).

2.3. Phenology

The phenology of the cultivars was monitored, noting the dates on which the main season phenological stages took place, according to the BBCH scale [42]: budbreak (07), flowering (65), veraison (81), and maturity (89). The phenological stage dates were assigned when 50% of the buds/bunches of monitored vines reached that stage, with the exception of maturity. This date was assigned when 100% of the berries were mature. Figure 2 graphically represents the mean phenology stages of each variety.

2.4. Vine Water Status and Must Carbon Isotope Analysis

The carbon isotope composition of grape must was measured by on-line analysis using a ThermoQuest Flash 1112 Elemental Analyzer equipped with an autosampler and coupled to a Delta-Plus IRMS (ThermoQuest, Bremen, Germany) through a ConFlo III interface (ThermoQuest). One microliter of must was placed in a tin capsule and sealed. All the carbon in the sample is oxidized to CO2 by the reactors of the elemental analyzer. The analyzer passes the gas through a gas chromatography (GC) column to separate the CO2 from other gases and then brings the CO2 into the mass spectrometer by a helium flow [43]. Carbon isotope composition was expressed as:
δ13Csample = [(Rs/Rstd) − 1] × 1000
where Rs is the 13C/12C ratio of the sample and Rstd is the international reference standard Vienna Pee Dee Belemnite. Five vines of each cultivar were sampled, with two must samples per vine.

2.5. Must Oxygen Isotope Analysis

An on-line gas equilibration and headspace introduction system model, GasBench II (ThermoQuest, Bremen, Germany), was used to analyze must oxygen isotopes. It is equipped with a GC column (PoraPlot Q, 25 m, 0.25 mm; Varian, Palo Alto, Santa Clara, CA, USA) operating at 70 °C and adapted to an autosampler CombiPAL (CTC-Analytics, Zwingen, Switzerland). For each must sample, 500 µL of must and a spatula tip of benzoic acid (to avoid possible fermentation) were transferred to a 10 mL vial with silicone septa. The vials were placed in the GasBench II, flushed with 0.3% CO2 in He for 10 min, and left for 48 h at 22 °C before analysis. During this equilibration time, an exchange reaction took place between the oxygen in CO2 and H2O:
12C16O2 + H218O ↔ 12C16O18O + H216O
The CO2 was then isolated from the vial headspace and introduced in the IRMS system. The GasBench II was coupled to a Delta-Plus IRMS (ThermoQuest) equipped with three Faraday cup detectors that simultaneously and continuously monitor the [CO2]+ signals for the three major ions at m/z 44 (12CO2), m/z 45 (13CO2 and 12C17O16O) and m/z 46 (12C18O16O). Oxygen isotope composition was expressed as:
δ18Osample = [(Rs/Rstd) − 1] × 1000
where Rs is the 18O/16O ratio of the sample and Rstd is the international reference standard Vienna Standard Mean Ocean Water. Five vines of each cultivar were sampled, with two must samples per vine.

2.6. Yield Components, Pruning Weight, and Grape Quality Components

To determine the harvest date, regular sampling was performed until the grapes reached 22.5–24.5 °Brix. However, in some varieties, the harvest date had to be brought forward because the yield was too high and the grapes were unable to reach a higher sugar concentration. In these cases, and in view of the possibility that the quality of the grapes might deteriorate, it was decided to bring forward the harvest date. By contrast, Graciano reached 26.3 °Brix while maintaining a high level of acidity (6.52 g L−1).
Five vines were harvested per cultivar. The vine yield was measured in terms of weight (kg vine−1) and bunches per vine. The mean bunch weight (g) of each vine was calculated by dividing the vine yield by the number of bunches. To determine the mean berry weight (g), 100 berries from each vine were randomly selected and weighed. During the winter, pruning weight (kg vine−1) was measured by pruning the same five vines and weighing the pruned wood. To evaluate the balance between production and vigor in each sample, the Ravaz index was calculated. The grapes of each harvested vine were pressed with a manual screw press to extract the must. Following the official methods of the International Organization of Vine and Wine [43], the total soluble solids (°Brix) of the must was measured by electronic refractometry (RX-5000α-Bev, Atago, Tokyo, Japan), and the total acidity (g L−1 tartaric acid) and pH were measured by potentiometry (HI 902, Hanna, Eibar, Spain). The must was sampled (12 mL per vine) and frozen in polycarbonate test tubes to allow later isotope ratio analysis (δ13C and δ18O).

2.7. Statistical Analysis

Statistical treatment of the data was performed using Statgraphics Centurion XVIII software (Statgraphics Technologies, The Plains, VA, USA). First of all, the three-year data set (n = 15) was analyzed for outliers (data exceeding three standard deviations). No outliers were found, so all data for each variable came from the same distribution. For each of the observed variables, the mean values of the cultivars were compared by applying the Student–Newman–Keuls (S–N–K) multiple range test with a 95% confidence level using a one-factor analysis of variance (ANOVA). The method used for simple regression was least squares with a 95% (α = 0.05) confidence interval (bilateral). Principal component analysis (PCA) was also performed to study the possible grouping of varieties to drought response. The PCA groups were identified by cluster analysis. Box plots were generated using IBM SPSS Statistics 25 Core System software (SPSS, Armonk, New York, NY, USA).

3. Results

3.1. Must Carbon Isotope Ratio

The carbon isotope ratio of grape must was highly variable between cultivars (Figure 3). The δ13C of individual vines ranged from −25.93 ‰ to −21.41‰, and the mean δ13C of cultivars ranged from −23.94‰ to −22.46‰. These wide ranges reveal substantial differences in the water status of the vines during ripening. According to the Student–Newman–Keuls test, the δ13C of grape must at harvest was significantly affected by genotype (p < 0.001). Garnacha Tintorera exhibited the highest mean δ13C, indicating that this cultivar is very efficient in water use [44,45]. By this measure, Garnacha Tinta is moderately efficient, whereas Mazuela and Graciano displayed low δ13C and thus are less efficient. The intra-cultivar variability of δ13C was also high across the three years of the study. Tinto de la Pámpana Blanca was the most highly variable cultivar in addition to having the lowest minimum δ13C value.

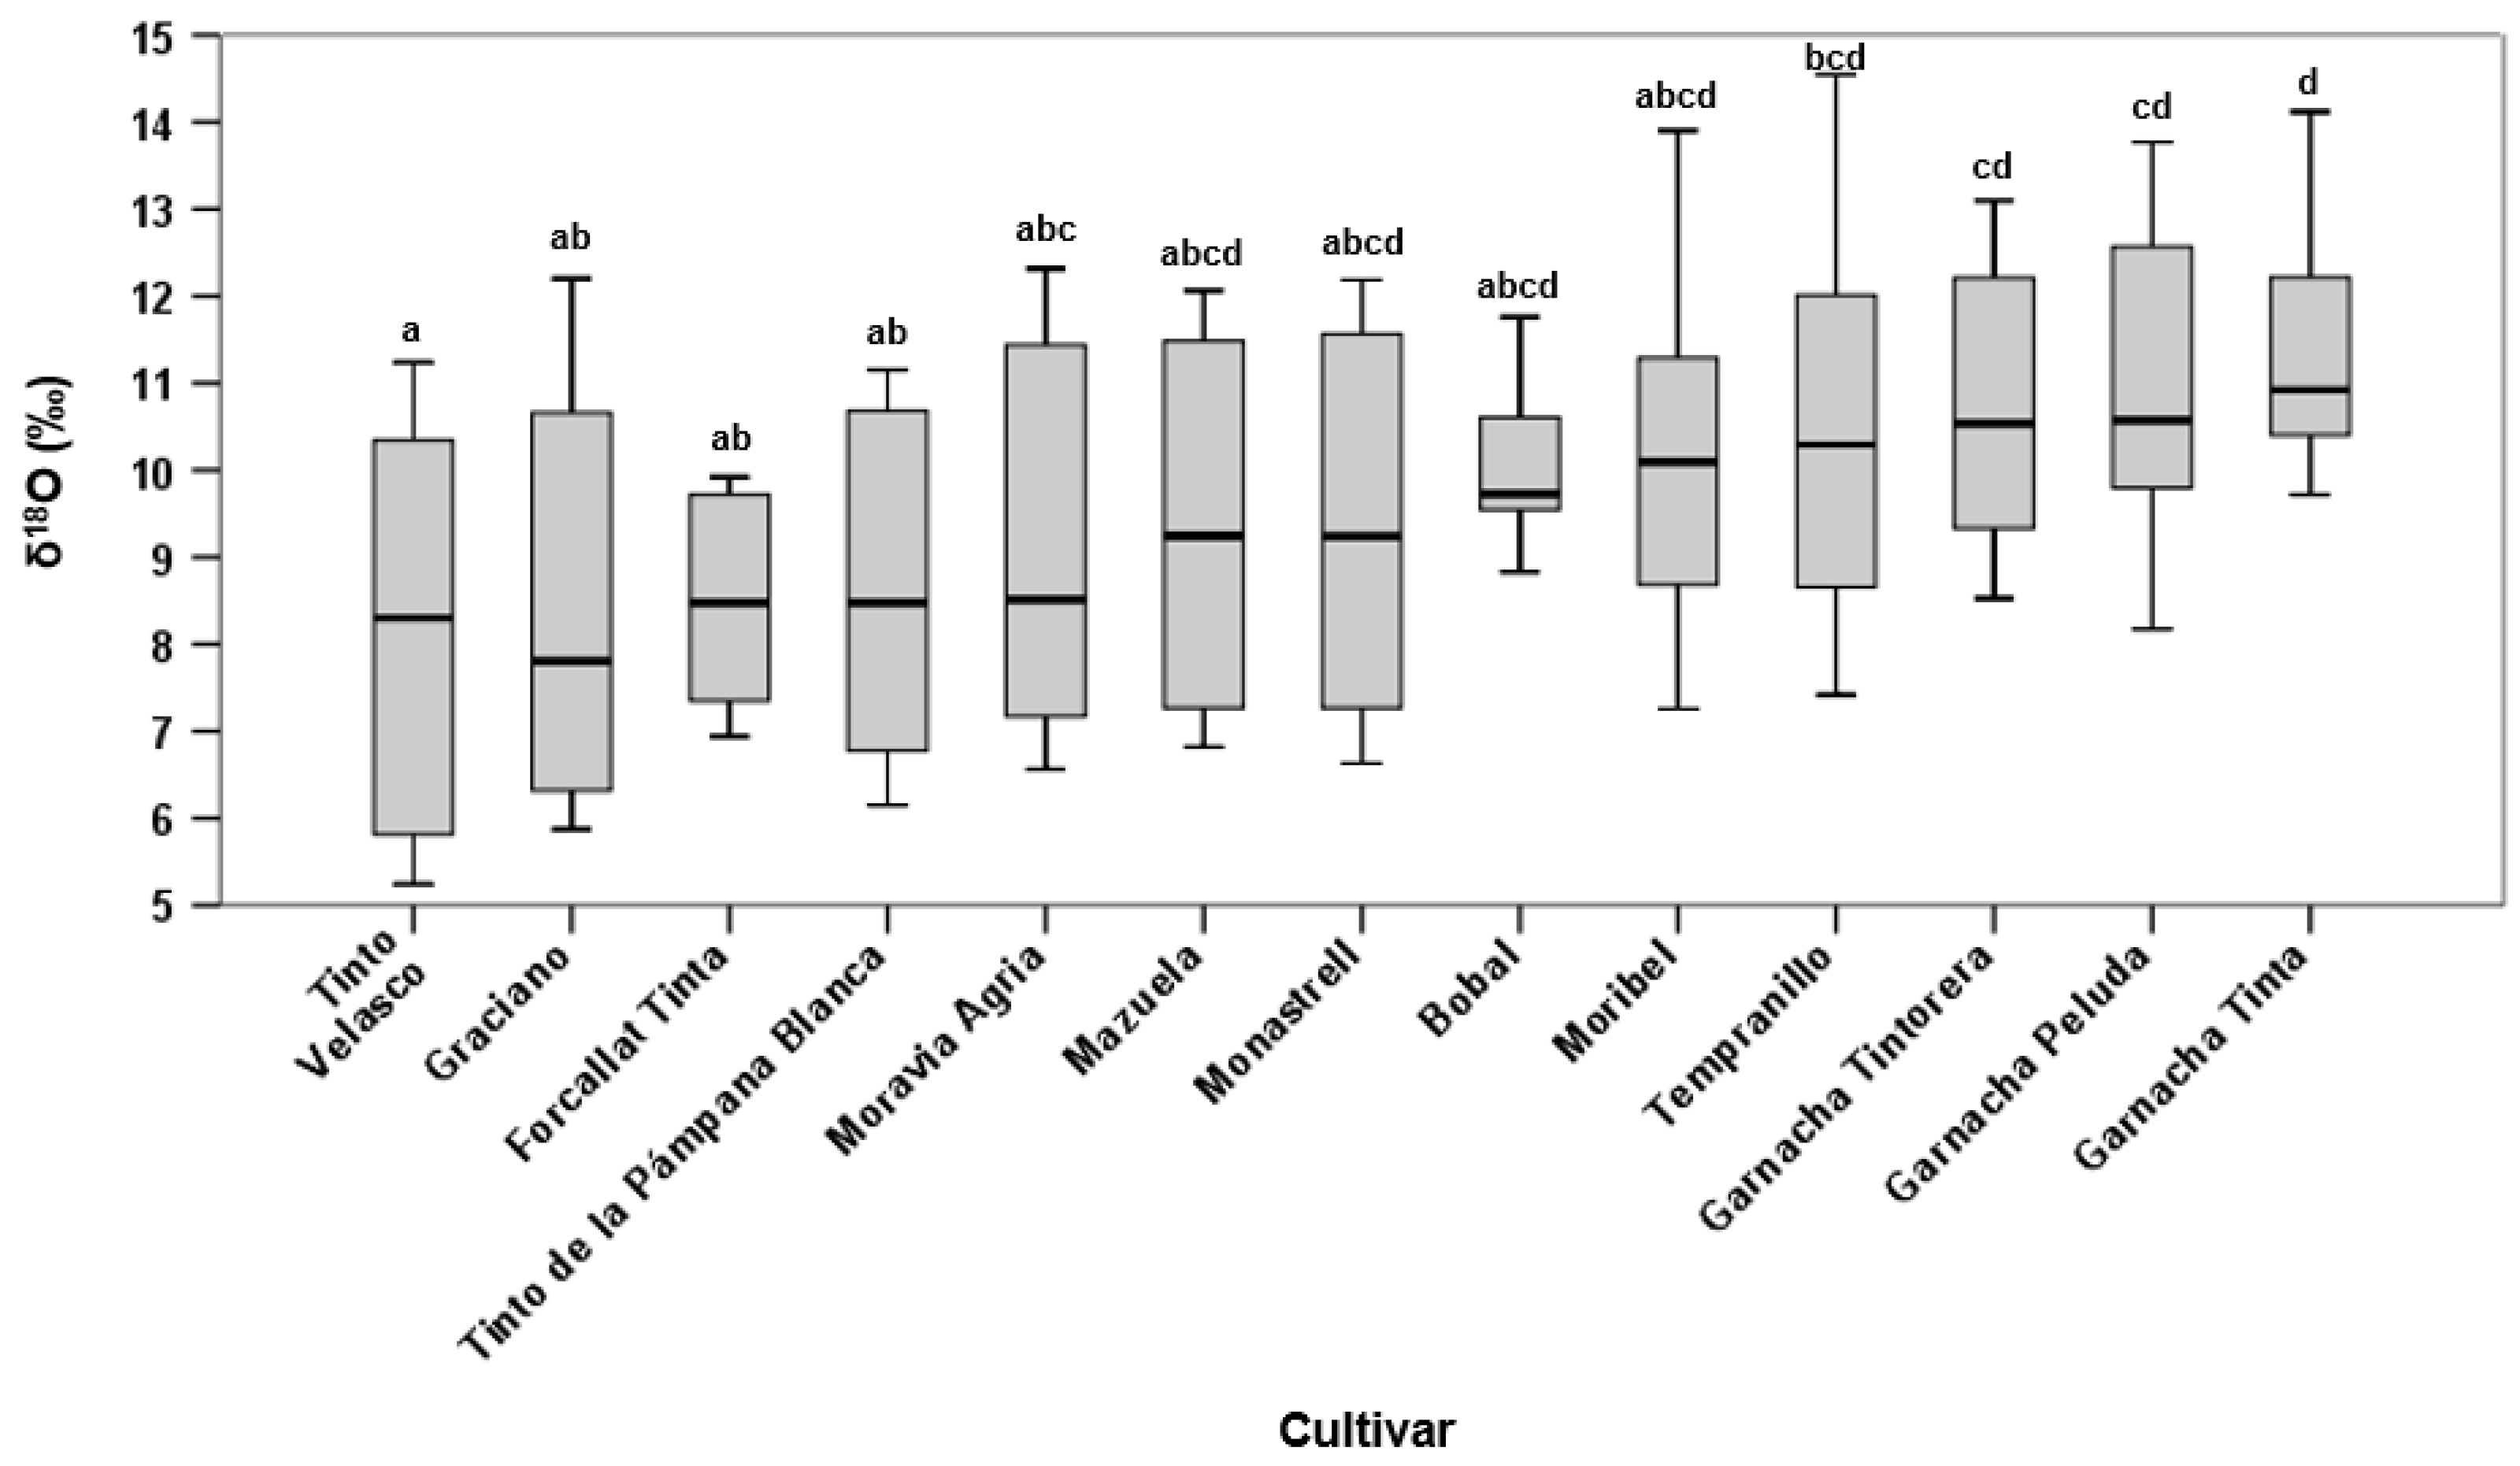
3.2. Must Oxygen Isotope Ratio

The oxygen isotope ratio of the must water was closely related to the mean VPD in the week before harvest, as indicated by a double inverse model (Figure 4). The VPD values ranged from 0.5 kPa to 2.3 kPa, and Tempranillo was the cultivar with the greatest VPD.
The δ18O in grape must water ranged widely (Figure 5), and differences between cultivars were highly significant (p < 0.001). Tinto Velasco had the smallest mean δ18O (8.12‰), indicating that this cultivar had the lowest transpiration rates during the seven days before harvest [46,47,48], while Garnacha Tinta exhibited the largest mean (11.33‰; Figure 5). As was observed for δ13C, intra-cultivar variability in δ18O was high. Tempranillo and Bobal presented the highest and lowest variability, respectively. Tempranillo also had the largest δ18O value.

3.3. Yield Components and Pruning Weight

Considering all cultivars, when comparing 2019 to 2018, the mean yield per vine fell by 46.4%, and pruning weight fell by 39.7%. The subsequent declines from 2019 to 2020 were somewhat smaller: 32.0% for yield and 36.2% for pruning weight. All the yield components were highly variable between cultivars. Table 1 presents the mean yield per vine of the cultivars in ascending order. Moravia Agria was the cultivar with the highest mean yield per vine (above 4 kg vine−1). However, when the cultivars were ranked by their berry and bunch weight, Bobal stood out above the other cultivars. Bobal and Tinto Velasco exhibited the highest pruning weight (above 0.50 kg vine−1), a measure of vigor. By contrast, Graciano had the smallst pruning weight (0.27 kg vine−1). Regarding the Ravaz index (yield/pruning weight), Tempranillo and Bobal stood out with the smallest values (5.64 and 6.13, respectively), while Tinto de la Pámpana Blanca and Moravia Agria exhibited the largest (values above 10).

3.4. Must Quality Components

The must quality components also displayed high variability between cultivars. Table 2 presents the mean total soluble solids of the cultivars in ascending order. Moravia Agria and Graciano exhibited the lowest and highest total soluble solids content (20.27 °Brix and 26.32 °Brix, respectively); the two cultivars also stood out for their high total acidity (6.58 g L−1 and 6.52 g L−1, respectively). Tempranillo was the cultivar with the highest must pH (3.45).

4. Discussion

Previous water stress assays have reported variation in drought response between different grapevine cultivars [28,30,44,45,49,50], clones [45,51], and rootstocks [27,30,50,52,53,54,55,56,57,58]. However, the tolerance mechanisms driving this variation in the adaptability of grapevines to drought conditions have not yet been completely elucidated. Many studies have explored the role of physiological traits in controlling differences between genotypes in drought response [5,59,60,61,62], but fewer studies have investigated the role of agronomic indicators. The present work is the first to assess the response of grapevine cultivars to drought in the Castilla-La Mancha wine region.

4.1. Cultivar Water Status and Isotope Ratios

This study found significant variation between cultivars in the δ13C of their grape must. The observed δ13C values suggest severe drought stress in all cultivars, with mean values above −24‰ [36]. These findings are consistent with previously reported values from viticultural areas including Bordeaux [32,63], Montpellier [64], Tavel [65], Navarra [66], and La Mancha [67]. Conversely, in assays performed in other geographical regions, including the Balearic Islands, the mean δ13C was substantially lower [44]. These differences could be due to the environmental conditions, rootstock traits, or vine organ sampled (fruit or leaf). For example, it is well established that the δ13C values obtained from the grape pulp are higher than values obtained from other grapevine organs and tissues such as leaves, whole berries, skins, or seeds [1,61,68]. In this study, the mean δ13C values of the grape must did not vary much between cultivars over the three years (2‰). The values observed are similar to those of previous studies obtained from leaves [44,61,69,70,71,72], but they are substantially lower than values reported from grape must [32,63,64,67].
Although the cultivars were all grown under the same conditions, they varied in the water use efficiency. According to results obtained, Garnacha Tintorera was the most efficient cultivar (high δ13C values), whereas Graciano and Mazuela (low δ13C values) behaved as the least efficient cultivars. The remaining cultivars were categorized into four groups. Some of the most widely cultivated varieties in Spain were among these remaining cultivars, including Garnacha Tinta and Tempranillo. A previous study performed in rainfed vineyards in the Bordeaux region has found that Mazuela is not a very water-use-efficient cultivar, whereas Garnacha Tinta is [32]. The δ13C values they obtained and their conclusions regarding water use efficiency are consistent with the present study. By contrast, in the La Mancha region, the δ13C of non-irrigated Garnacha Tinta vines was much higher than what was observed in the present study [67]. These differences could be due to differing environmental conditions during the growing season in which the assays were performed, sampling methods, or rootstocks traits. For the Tempranillo cultivar, the carbon isotope ratios of different organs and tissues have been widely evaluated [60,66,67,73], but few studies have evaluated its grape must. In this study, Tempranillo’s high δ13C suggested that it is more efficient in terms of water use than Garnacha Tinta. In contrast with these results, other researchers have considered Tempranillo a less efficient cultivar than Garnacha Tinta [67].
Previous studies have shown that δ18O can complement δ13C in estimating the accumulated water deficit under drought conditions since the grapevine’s transpiration rate in the days preceding harvest determines the oxygen isotope composition in must water [36,38]. Conversely, assays performed on the wood of forests trees have found that the correlation between the two isotope ratios is generally poor, suggesting that although both ratios are somewhat related to transpirative demand, they are relatively independent [74]. These previous findings are consistent with those obtained in the present study, in which no significant correlation was found between the two isotope ratios. By contrast, δ18O and the average of the daily mean VPD values during the 7 days prior to the date of harvest were closely correlated (Figure 4). Previous reports have found that δ18O isotope ratios are affected by the presence of vine irrigation and the climatic conditions in which the assays are performed. The δ18O values observed in this study are comparable to those obtained for non-irrigated cultivars in the same geographic region [67]. By contrast, in other areas such as Korea [75], the Crimean Peninsula, the Krasnodar region, the Rostov region, and the Republic of Daguestan [76], the δ18O is much lower, with some areas even presenting negative values. These differences may be because transpiration through the leaves and skin of the grape during the ripening season is high in semi-arid climatic conditions. Consequently, the δ18O of the grape water is elevated under these dry conditions [47]. In addition, the oxygen isotope composition of water differs depending on the geographic location. For example, the δ18O of atmospheric precipitation water and groundwater are higher in southern Europe than northern Europe [77].
The variation observed in δ18O was mainly observed for the VPD in the seven days immediately before harvest and not by differences between the cultivars. The δ18O was higher in moderately early harvest cultivars such as Garnacha Tinta, Garnacha Peluda, and Garnacha Tintorera (Figure 2). Their maturation took place in atmospheric conditions with high daily mean VPD values (low relative humidity and high air temperature), and consequently, these vines had a high transpiration rate. Conversely, in late harvest cultivars such as Tinto Velasco, Graciano, Forcallat Tinta, and Tinto de la Pámpana Blanca, the grapes ripened on days with low VPD, therefore, these varieties exhibited lower δ18O values. Although Tempranillo was harvested before Garnacha Tinta, its δ18O values were slightly lower than Garnacha Tinta’s, which agrees with the results obtained by other authors for the same cultivars under rainfed conditions [67].

4.2. Agronomic Response

Cultivars differed significantly in their yield components and pruning weight. The highest yields were observed for cultivars such as Tinto Velasco, Tinto de la Pámpana Blanca, and particularly for Moravia Agria, which often exceeded 4 kg vine−1. These cultivars also exhibited heavy grape bunches, but Bobal had the highest bunch weight of all cultivars. Bobal and Tinto de la Pámpana Blanca had the heaviest berries. Conversely, Monastrell was the cultivar with the lowest yield per vine and low bunch and berry weight. This finding is consistent with a previous study comparing rootstocks, which found that Monastrell has a low yield when grafted onto 110-R [58]. In the present study, Bobal and Tinto Velasco were the most vigorous cultivars, as measured by pruning weight. Garnacha Tinta exhibited moderate yield per vine and vigor, as well as low bunch and berry weight. These findings partially contradict the results obtained by other authors concerning the effects of water stress in Mediterranean climates [78]. The different results may be due to differences in soil, crop management, or rootstock.
In the higher yielding cultivars, such as Moravia Agria, Tinto de la Pámpana Blanca and Tinto Velasco, the grapes could not ripen fully, because they had a high Ravaz index. As a consequence, their final total soluble solids content was low. However, other cultivars such as Moribel and Graciano had similar ratios but matured properly. Moravia Agria and Graciano were the cultivars with the highest total must acidity. Conversely, the two cultivars differed in total soluble solids content: while Graciano had the highest content of all cultivars, Moravia Agria had the lowest. Garnacha Tinta matured adequately, reaching acceptable soluble solids content and acidity level, consistent with the results obtained from other regions with Mediterranean climates [78].

4.3. Categorizing Cultivars Based on Their Agronomic Response to Drought

A multivariate data analysis using PCA was performed to determine how the agronomic traits varied between cultivars. The five variables least correlated with each other were selected for the PCA: yield, pruning weight, total soluble solids, total acidity, and δ13C. Other variables were excluded to simplify the interpretation of the PCA. Figure 6 shows the biplot defined by the first two Principal Components (PCs), explaining 75.1% (41.07% and 34.03% for PC 1 and PC 2, respectively) of all variance for the 13 cultivars. To simplify the multivariate analysis, only these first two PCs were considered. The cluster analysis enabled the cultivars to be separated into four groups. A group formed by Mazuela, Moribel, Bobal, Garnacha Peluda, and Garnacha Tinta is located in the center of the graph, and a group composed of Tempranillo, Monastrell, Garnacha Tintorera, and Forcallat Tinta is located toward the bottom of the graph. Graciano is isolated from the other cultivars, and is located on the upper left side of the biplot. The last group, formed by Moravia Agria, Tinto Velasco, and Tinto de la Pámpana Blanca, is located on the upper right side.
Finally, to synthesize the results obtained by this study, the cultivars were classified again according to three arbitrary tolerance categories (high, moderate, and low) using the same traits as those chosen for the PCA (Table 3). As expected, there were no cultivars with all traits classified in the high category. Bobal, Garnacha Peluda, Garnacha Tinta, Mazuela, and Moribel had high to moderate drought tolerance according to this categorization system. All five cultivars were classified in the high or moderate categories for yield, pruning weight, and must quality, therefore, they can be considered appropriate cultivars for semi-arid conditions. However, there were some differences between the cultivars. As indicated by δ13C, Bobal, Garnacha Peluda, and Garnacha Tinta were more efficient in their water use than Mazuela or Moribel. By contrast, Garnacha Tintorera, Forcallat Tinta, and Tempranillo were highly water efficient, but had low yield and must quality. Therefore, they can be considered the least adapted to drought conditions of the 13 studied cultivars. These findings reveal that a cultivar’s water-regulation strategy, such as isohydric or anisohydric behavior, is not critical in determining its agronomic response to drought. Graciano and Monastrell exhibited low yields and high must quality. Conversely, Moravia Agria, Tinto de la Pámpana Blanca, and Tinto Velasco had high yields, but an imbalance between the yield and leaf surface prevented the grapes from fully ripening, leading to must with high acidity, but low total soluble solids content. This categorization of the cultivars using arbitrarily chosen characteristics is consistent with the groupings formed by the PCA, confirming the similarities and differences between cultivars in their agronomic responses to drought.

5. Conclusions

For viticulture to remain sustainable in the coming years, it is essential to understand how grapevine cultivars yield and grape quality respond to drought. This study classified 13 red grapevine cultivars based on their agronomic drought response. The results demonstrate that not all cultivars respond equally well to drought. The δ13C was not correlated to any agronomic variables, and consequently, no water use efficiency patterns could be established. However, cultivars with lower water use efficiency generally had a better agronomic response to drought. Bobal, Garnacha Peluda, Garnacha Tinta, Mazuela, and Moribel showed high to moderate drought tolerance, simultaneously maintaining high yield and must quality. This behavior suggests that these cultivars may be suitable for cultivation in current and future semi-arid climatic regions, where water resources are scarce.

Author Contributions

Conceptualization, J.M.-G. and A.S.S.; methodology, J.M.-G., A.S.S. and J.L.C.-V.; software, A.S.S.; validation, J.M.-G. and J.L.C.-V.; formal analysis, A.S.S., M.D.C., A.M. and C.C.-T.; investigation, A.S.S., J.M.-G. and J.L.C.-V.; resources, G.L.A.; data curation, A.S.S.; writing—original draft preparation, A.S.S. and J.L.C.-V.; writing—review and editing, A.S.S., G.L.A., J.M.-G. and J.L.C.-V.; visualization, A.S.S., J.M.-G. and J.L.C.-V.; supervision, J.M.-G., A.S.S. and J.L.C.-V.; project administration, G.L.A.; funding acquisition, G.L.A. All authors have read and agreed to the published version of the manuscript.

Funding

This research received no external funding.

Data Availability Statement

Not applicable.

Acknowledgments

A. Sergio Serrano is grateful for her predoctoral contract granted by the University of Castilla-La Mancha (UCLM) and co-financed by the European Social Fund under the Operational Programme 2014-2020 of Castilla-La Mancha.

Conflicts of Interest

The authors declare no conflict of interest.

References

  1. Chaves, M.M.; Santos, T.P.; Souza, C.R.; Ortuño, M.F.; Rodrigues, M.L.; Lopes, C.M.; Maroco, J.P.; Pereira, J.S. Deficit irrigation in grapevine improves water-use efficiency while controlling vigour and production quality. Ann. Appl. Biol. 2007, 150, 237–252. [Google Scholar] [CrossRef]
  2. Deluc, L.G.; Quilici, D.R.; Decendit, A.; Grimplet, J.; Wheatley, M.D.; Schlauch, K.A.; Mérillon, J.M.; Cushman, J.C.; Cramer, G.R. Water deficit alters differentially metabolic pathways affecting important flavor and quality traits in grape berries of Cabernet Sauvignon and Chardonnay. BMC Genom. 2009, 10, 212. [Google Scholar] [CrossRef] [PubMed] [Green Version]
  3. Medrano, H.; Escalona, J.M.; Cifre, J.; Bota, J.; Flexas, J. A ten-year study on the physiology of two Spanish grapevine cultivars under field conditions: Effects of water availability from leaf photosynthesis to grape yield and quality. Funct. Plant Biol. 2003, 30, 607–619. [Google Scholar] [CrossRef] [PubMed] [Green Version]
  4. Lovisolo, C.; Hartung, W.; Schubert, A. Whole-plant hydraulic conductance and root-to-shoot flow of abscisic acid are independently affected by water stress in grapevines. Funct. Plant Biol. 2002, 29, 1349–1356. [Google Scholar] [CrossRef] [PubMed]
  5. Prieto, J.A.; Lebon, É.; Ojeda, H. Stomatal behavior of different grapevine cultivars in response to soil water status and air water vapor pressure deficit. J. Int. Sci. Vigne Vin 2010, 44, 9–20. [Google Scholar] [CrossRef]
  6. Costa, J.M.; Vaz, M.; Escalona, J.; Egipto, R.; Lopes, C.; Medrano, H.; Chaves, M.M. Modern viticulture in southern Europe: Vulnerabilities and strategies for adaptation to water scarcity. Agric. Water Manag. 2016, 164, 5–18. [Google Scholar] [CrossRef]
  7. IPCC. IPCC AR6 WGI Climate Change 2021 The Physical Science Basis; Cambridge University Press: Cambridge, UK, 2021. [Google Scholar]
  8. Intrigliolo, D.S.; Castel, J.R. Trunk diameter variations as water stress indicator in plum and grapevine. Acta Hortic. 2008, 792, 363–369. [Google Scholar] [CrossRef]
  9. Medrano, H.; Tomás, M.; Martorell, S.; Escalona, J.M.; Pou, A.; Fuentes, S.; Flexas, J.; Bota, J. Improving water use efficiency of vineyards in semi-arid regions. A review. Agron. Sustain. Dev. 2015, 35, 499–517. [Google Scholar] [CrossRef] [Green Version]
  10. Chacón-Vozmediano, J.L.; Martínez-Gascueña, J.; Ramos, M.C. Projected effects of climate change on Tempranillo and Chardonnay varieties in La Mancha Designation of Origin. Agron. Sustain. Dev. 2021, 41, 24. [Google Scholar] [CrossRef]
  11. Morales-Castilla, I.; De Cortázar-Atauri, I.G.; Cook, B.I.; Lacombe, T.; Parker, A.; Van Leeuwen, C.; Nicholas, K.A.; Wolkovich, E.M. Diversity buffers winegrowing regions from climate change losses. Proc. Natl. Acad. Sci. USA 2020, 117, 2864–2869. [Google Scholar] [CrossRef]
  12. Wolkovich, E.M.; García De Cortázar-Atauri, I.; Morales-Castilla, I.; Nicholas, K.A.; Lacombe, T. From Pinot to Xinomavro in the world’s future wine-growing regions. Nat. Clim. Chang. 2018, 8, 29–37. [Google Scholar] [CrossRef]
  13. Bernardo, S.; Dinis, L.T.; Machado, N.; Moutinho-Pereira, J. Grapevine abiotic stress assessment and search for sustainable adaptation strategies in Mediterranean-like climates. A review. Agron. Sustain. Dev. 2018, 38, 66. [Google Scholar] [CrossRef] [Green Version]
  14. Barnuud, N.N.; Zerihun, A.; Mpelasoka, F.; Gibberd, M.; Bates, B. Responses of grape berry anthocyanin and titratable acidity to the projected climate change across the Western Australian wine regions. Int. J. Biometeorol. 2014, 58, 1279–1293. [Google Scholar] [CrossRef] [PubMed] [Green Version]
  15. Ramos, M.C.; Martínez de Toda, F. Variability in the potential effects of climate change on phenology and on grape composition of Tempranillo in three zones of the Rioja DOCa (Spain). Eur. J. Agron. 2020, 115, 126014. [Google Scholar] [CrossRef]
  16. Martinez De Toda, F.; Balda, P. Quantifying the effect of temperature on decoupling anthocyanins and sugars of the grape (Vitis vinifera L. ’Maturana Tinta de Navarrete’). Vitis J. Grapevine Res. 2015, 54, 117–120. [Google Scholar]
  17. Sadras, V.O.; Moran, M.A. Elevated temperature decouples anthocyanins and sugars in berries of Shiraz and Cabernet Franc. Aust. J. Grape Wine Res. 2012, 18, 115–122. [Google Scholar] [CrossRef]
  18. Tardieu, F. Any trait or trait-related allele can confer drought tolerance: Just design the right drought scenario. J. Exp. Bot. 2012, 63, 25–31. [Google Scholar] [CrossRef] [Green Version]
  19. Gambetta, G.A.; Herrera, J.C.; Dayer, S.; Feng, Q.; Hochberg, U.; Castellarin, S.D. The physiology of drought stress in grapevine: Towards an integrative definition of drought tolerance. J. Exp. Bot. 2020, 71, 4658–4676. [Google Scholar] [CrossRef]
  20. Alatzas, A.; Theocharis, S.; Miliordos, D.E.; Leontaridou, K.; Kanellis, A.K.; Kotseridis, Y.; Hatzopoulos, P.; Koundouras, S. The Effect of Water Deficit on Two Greek Vitis vinifera L. Cultivars: Physiology, Grape Composition and Gene Expression during Berry Development. Plants 2021, 10, 1947. [Google Scholar] [CrossRef]
  21. Bassoi, L.H.; De Melo Chaves, A.R.; Teixeira, R.P. Responses of “Syrah” grapevine to deficit irrigation in the Brazilian semi-arid region. Agric. Water Manag. 2021, 258, 107186. [Google Scholar] [CrossRef]
  22. Chacón-Vozmediano, J.L.; Martínez-Gascueña, J.; García-Romero, E.; Gómez-Alonso, S.; García-Navarro, F.J.; Jiménez-Ballesta, R. Effects of Water Stress on the Phenolic Compounds of ‘Merlot’ Grapes in a Semi-Arid Mediterranean Climate. Horticulturae 2021, 7, 161. [Google Scholar] [CrossRef]
  23. Chacón-Vozmediano, J.L.; Martínez-Gascueña, J.; García-Navarro, F.J.; Jiménez-Ballesta, R. Effects of Water Stress on Vegetative Growth and ‘Merlot’ Grapevine Yield in a Semi-Arid Mediterranean Climate. Horticulturae 2020, 6, 95. [Google Scholar] [CrossRef]
  24. Mirás-Avalos, J.M.; Intrigliolo, D.S. Grape composition under abiotic constrains: Water stress and salinity. Front. Plant Sci. 2017, 8, 851. [Google Scholar] [CrossRef] [PubMed] [Green Version]
  25. Zombardo, A.; Mica, E.; Puccioni, S.; Perria, R.; Valentini, P.; Mattii, G.B.; Cattivelli, L.; Storchi, P. Berry Quality of Grapevine under Water Stress as Affected by Rootstock–Scion Interactions through Gene Expression Regulation. Agronomy 2020, 10, 680. [Google Scholar] [CrossRef]
  26. Zufferey, V.; Verdenal, T.; Dienes, A.; Belcher, S.; Lorenzini, F.; Koestel, C.; Rösti, J.; Gindro, K.; Spangenberg, J.E.; Viret, O.; et al. The impact of plant water status on the gas exchange, berry composition and wine quality of Chasselas grapes in Switzerland. OENO One 2018, 52. [Google Scholar] [CrossRef]
  27. Faralli, M.; Bianchedi, P.L.; Bertamini, M.; Varotto, C. Rootstock Genotypes Shape the Response of cv. Pinot gris to Water Deficit. Agronomy 2020, 11, 75. [Google Scholar] [CrossRef]
  28. Florez-Sarasa, I.; Clemente-Moreno, M.J.; Cifre, J.; Capo, M.; Llompart, M.Q.; Fernie, A.R.; Bota, J. Differences in Metabolic and Physiological Responses between Local and Widespread Grapevine Cultivars under Water Deficit Stress. Agronomy 2020, 10, 1052. [Google Scholar] [CrossRef]
  29. Martorell, S.; Diaz-Espejo, A.; Tomàs, M.; Pou, A.; El Aou-ouad, H.; Escalona, J.M.; Vadell, J.; Ribas-Carbó, M.; Flexas, J.; Medrano, H. Differences in water-use-efficiency between two Vitis vinifera cultivars (Grenache and Tempranillo) explained by the combined response of stomata to hydraulic and chemical signals during water stress. Agric. Water Manag. 2015, 156, 1–9. [Google Scholar] [CrossRef] [Green Version]
  30. Tramontini, S.; Vitali, M.; Centioni, L.; Schubert, A.; Lovisolo, C. Rootstock control of scion response to water stress in grapevine. Environ. Exp. Bot. 2013, 93, 20–26. [Google Scholar] [CrossRef]
  31. Hochberg, U.; Rockwell, F.E.; Holbrook, N.M.; Cochard, H. Iso/Anisohydry: A Plant–Environment Interaction Rather Than a Simple Hydraulic Trait. Trends Plant Sci. 2018, 23, 112–120. [Google Scholar] [CrossRef]
  32. Gaudillère, J.P.; Van Leeuwen, C.; Ollat, N. Carbon isotope composition of sugars in grapevine, an integrated indicator of vineyard water status. J. Exp. Bot. 2002, 53, 757–763. [Google Scholar] [CrossRef] [PubMed]
  33. Bchir, A.; Escalona, J.M.; Gallé, A.; Hernández-Montes, E.; Tortosa, I.; Braham, M.; Medrano, H. Carbon isotope discrimination (δ13C) as an indicator of vine water status and water use efficiency (WUE): Looking for the most representative sample and sampling time. Agric. Water Manag. 2016, 167, 11–20. [Google Scholar] [CrossRef]
  34. Brillante, L.; Martínez-Lüscher, J.; Yu, R.; Kurtural, S.K. Carbon Isotope Discrimination (δ13 C) of Grape Musts Is a Reliable Tool for Zoning and the Physiological Ground-Truthing of Sensor Maps in Precision Viticulture. Front. Environ. Sci. 2020, 8, 561477. [Google Scholar] [CrossRef]
  35. Gowdy, M.; Destrac-Irvine, A.; Haines, M.; Gambetta, G.; Pieri, P.; Marguerit, E.; Van Leeuwen, C. Varietal responses to soil water deficit: First results from a common-garden vineyard near Bordeaux France. E3S Web Conf. 2018, 50, 23–26. [Google Scholar] [CrossRef]
  36. Santesteban, L.G.; Miranda, C.; Barbarin, I.; Royo, J.B. Application of the measurement of the natural abundance of stable isotopes in viticulture: A review. Aust. J. Grape Wine Res. 2015, 21, 157–167. [Google Scholar] [CrossRef]
  37. Hoefs, J. Stable Isotope Geochemistry; Springe: Berlin, Germany, 2009. [Google Scholar]
  38. Farquhar, G.D.; Ehleringer, J.R.; Hubick, K.T. Carbon Isotope Discrimination and Photosynthesis. Annu. Rev. Plant Physiol. Plant Mol. Biol. 1989, 40, 503–537. [Google Scholar] [CrossRef]
  39. Wang, Y.; Liu, F.; Andersen, M.N.; Jensen, C.R. undefined Improved plant nitrogen nutrition contributes to higher water use efficiency in tomatoes under alternate partial root-zone irrigation. Funct. Plant Biol. 2010, 37, 175–182. [Google Scholar] [CrossRef]
  40. Pascual, M.; Lordan, J.; Villar, J.M.; Fonseca, F.; Rufat, J. Stable carbon and nitrogen isotope ratios as indicators of water status and nitrogen effects on peach trees. Sci. Hortic. 2013, 157, 99–107. [Google Scholar] [CrossRef]
  41. Allen, R.G. Evapotranspiración del Cultivo: Guias Para la Determinación de Agua de los Cultivos; FAO: Rome, Italy, 2006; Volume 297. [Google Scholar]
  42. Lorenz, D.H.; Eichhorn, K.W.; Bleiholder, H.; Klose, R.; Meier, U.; Weber, E. Growth Stages of the Grapevine: Phenological growth stages of the grapevine (Vitis vinifera L. ssp. vinifera)—Codes and descriptions according to the extended BBCH scale†. Aust. J. Grape Wine Res. 1995, 1, 100–103. [Google Scholar] [CrossRef]
  43. OIV Compendio de Los Métodos Internacionales de Análisis de Los Vinos y de Los Mostos. Available online: https://www.oiv.int/es/normas-y-documentos-tecnicos/metodos-de-analisis/compendio-de-los-metodos-internacionales-de-analisis-de-los-vinos-y-de-los-mostos (accessed on 13 March 2022).
  44. Bota, J.; Tomás, M.; Flexas, J.; Medrano, H.; Escalona, J.M. Differences among grapevine cultivars in their stomatal behavior and water use efficiency under progressive water stress. Agric. Water Manag. 2016, 164, 91–99. [Google Scholar] [CrossRef]
  45. Tortosa, I.; Escalona, J.M.; Bota, J.; Tomás, M.; Hernández, E.; Escudero, E.G.; Medrano, H. Exploring the genetic variability in water use efficiency: Evaluation of inter and intra cultivar genetic diversity in grapevines. Plant Sci. 2016, 251, 35–43. [Google Scholar] [CrossRef] [PubMed]
  46. Tardaguila, J.; Bertamini, M.; Reniero, F.; Versini, G. Oxygen isotope composition of must-water in grapevine: Effects of water deficit and rootstock. Aust. J. Grape Wine Res. 1997, 3, 84–89. [Google Scholar] [CrossRef]
  47. Roßmann, A.; Reniero, F.; Moussa, I.; Schmidt, H.L.; Versini, G.; Merle, M.H. Stable oxygen isotope content of water of EU data-bank wines from Italy, France and Germany. Z. Für Lebensm. Und-Forsch. A 1999, 208, 400–407. [Google Scholar] [CrossRef]
  48. Ingraham, N.L.; Caldwell, E.A. Influence of weather on the stable isotopic ratios of wines: Tools for weather/climate reconstruction? J. Geophys. Res. Atmos. 1999, 104, 2185–2194. [Google Scholar] [CrossRef]
  49. Koç, M.; Kamiloğlu, Ö.; Cangi, R.; Yıldız, K. Physiological and biochemical responses to drought stress in some autochthonous grapevines of Turkey. Acta Hortic. 2019, 1248, 531–539. [Google Scholar] [CrossRef]
  50. Toumi, I.; M’Sehli, W.; Bourgou, S.; Jallouli, N.; Bensalem-Fnayou, A.; Ghorbel, A.; Mliki, A. Response of ungrafted and grafted grapevine cultivans and rootstocks (Vitis sp.) to water stress. OENO One 2007, 41, 85–94. [Google Scholar] [CrossRef] [Green Version]
  51. Tortosa, I.; Escalona, J.M.; Toro, G.; Douthe, C.; Medrano, H. Clonal Behavior in Response to Soil Water Availability in Tempranillo Grapevine cv: From Plant Growth to Water Use Efficiency. Agronomy 2020, 10, 862. [Google Scholar] [CrossRef]
  52. Bianchi, D.; Caramanico, L.; Grossi, D.; Brancadoro, L.; De Lorenzis, G. How Do Novel M-Rootstock (Vitis Spp.) Genotypes Cope with Drought? Plants 2020, 9, 1385. [Google Scholar] [CrossRef]
  53. Carbonneau, A. The Early Selection of Grapevine Rootstocks for Resistance to Drought Conditions. Am. J. Enol. Vitic. 1985, 36, 195–198. [Google Scholar]
  54. Fort, K.; Fraga, J.; Grossi, D.; Walker, M.A. Early Measures of Drought Tolerance in Four Grape Rootstocks. J. Am. Soc. Hortic. Sci. 2017, 142, 36–46. [Google Scholar] [CrossRef]
  55. Kucukbasmaci, A.; Sabir, A. Long-term impact of deficit irrigation on the physiology and growth of grapevine cv. “prima” grafted on various rootstocks. Acta Sci. Pol. Hortorum Cultus 2019, 18, 57–70. [Google Scholar] [CrossRef]
  56. Mohsen, A.T.; Stino, R.G.; Abd Allatif, A.M.; Zaid, N.M. In vitro evaluation of some grapevine rootstocks grown under drought stress. Plant Arch. 2020, 20, 1029–1034. [Google Scholar]
  57. Pavlousek, P. Evaluation of drought tolerance of new grapevine rootstock hybrids. J. Environ. Biol. 2011, 32, 543–549. [Google Scholar] [PubMed]
  58. Romero, P.; Botía, P.; Navarro, J.M. Selecting rootstocks to improve vine performance and vineyard sustainability in deficit irrigated Monastrell grapevines under semiarid conditions. Agric. Water Manag. 2018, 209, 73–93. [Google Scholar] [CrossRef]
  59. Bota, J.; Flexas, J.; Medrano, H. Genetic variability of photosynthesis and water use in Balearic grapevine cultivars. Ann. Appl. Biol. 2001, 138, 353–361. [Google Scholar] [CrossRef]
  60. Costa, J.M.; Ortuño, M.F.; Lopes, C.M.; Chaves, M.M.; Costa, J.M.; Ortuño, M.F.; Lopes, C.M.; Chaves, M.M. Grapevine varieties exhibiting differences in stomatal response to water deficit. Funct. Plant Biol. 2012, 39, 179–189. [Google Scholar] [CrossRef]
  61. De Souza, C.R.; Maroco, J.P.; Dos Santos, T.P.; Rodrigues, M.L.; Lopes, C.M.; Pereira, J.S.; Chaves, M.M. Impact of deficit irrigation on water use efficiency and carbon isotope composition (δ13C) of field-grown grapevines under Mediterranean climate. J. Exp. Bot. 2005, 56, 2163–2172. [Google Scholar] [CrossRef] [Green Version]
  62. Tomás, M.; Medrano, H.; Escalona, J.M.; Martorell, S.; Pou, A.; Ribas-Carbó, M.; Flexas, J. Variability of water use efficiency in grapevines. Environ. Exp. Bot. 2014, 103, 148–157. [Google Scholar] [CrossRef]
  63. Van Leeuwen, C.; Tregoat, O.; Choné, X.; Bois, B.; Pernet, D.; Gaudillére, J.P. Vine water status is a key factor in grape ripening and vintage quality for red Bordeaux wine. How can it be assessed for vineyard management purposes? OENO One 2009, 43, 121–134. [Google Scholar] [CrossRef]
  64. Guix-Hébrard, N.; Voltz, M.; Trambouze, W.; Garnier, F.; Gaudillère, J.P.; Lagacherie, P. Influence of watertable depths on the variation of grapevine water status at the landscape scale. Eur. J. Agron. 2007, 27, 187–196. [Google Scholar] [CrossRef]
  65. Martínez-Vergara, A.; Payan, J.-C.; Salançon, E.; Tisseyre, B. Spiderδ: An empirical method to extrapolate grapevine (Vitis vinifera L.) water status at the whole denomination scale using δ13C as ancillary data. OENO One 2014, 48, 129–140. [Google Scholar] [CrossRef]
  66. Santesteban, L.G.; Guillaume, S.; Royo, J.B.; Tisseyre, B. Are precision agriculture tools and methods relevant at the whole-vineyard scale? Precis. Agric. 2013, 14, 2–17. [Google Scholar] [CrossRef] [Green Version]
  67. Gómez-Alonso, S.; García-Romero, E. Effect of irrigation and variety on oxygen (δ18O) and carbon (δ13C) stable isotope composition of grapes cultivated in a warm climate. Aust. J. Grape Wine Res. 2010, 16, 283–289. [Google Scholar] [CrossRef]
  68. Santesteban, L.G.; Miranda, C.; Royo, J.B. Regulated deficit irrigation effects on growth, yield, grape quality and individual anthocyanin composition in Vitis vinifera L. cv. “Tempranillo”. Agric. Water Manag. 2011, 98, 1171–1179. [Google Scholar] [CrossRef]
  69. De Souza, C.R.; Maroco, J.P.; Dos Santos, T.P.; Rodrigues, M.L.; Lopes, C.M.; Pereira, J.S.; Chaves, M.M. Partial rootzone drying: Regulation of stomatal aperture and carbon assimilation in field-grown grapevines (Vitis vinifera cv. Moscatel). Funct. Plant Biol. 2003, 30, 653–662. [Google Scholar] [CrossRef]
  70. Diaz-Espejo, A.; Cuevas, M.V.; Ribas-Carbo, M.; Flexas, J.; Martorell, S.; Fernández, J.E. The effect of strobilurins on leaf gas exchange, water use efficiency and ABA content in grapevine under field conditions. J. Plant Physiol. 2012, 169, 379–386. [Google Scholar] [CrossRef]
  71. Gibberd, M.R.; Walker, R.R.; Blackmore, D.H.; Condon, A.G. Transpiration efficiency and carbon-isotope discrimination of grapevines grown under well-watered conditions in either glasshouse or vineyard. Aust. J. Grape Wine Res. 2001, 7, 110–117. [Google Scholar] [CrossRef]
  72. Tomás, M.; Medrano, H.; Pou, A.; Escalona, J.M.; Martorell, S.; Ribas-Carbó, M.; Flexas, J. Water-use efficiency in grapevine cultivars grown under controlled conditions: Effects of water stress at the leaf and whole-plant level. Aust. J. Grape Wine Res. 2012, 18, 164–172. [Google Scholar] [CrossRef]
  73. Santesteban, L.G.; Miranda, C.; Urretavizcaya, I.; Royo, J.B. Carbon isotope ratio of whole berries as an estimator of plant water status in grapevine (Vitis vinifera L.) cv. “Tempranillo”. Sci. Hortic. 2012, 146, 7–13. [Google Scholar] [CrossRef]
  74. Ferrio, J.P.; Voltas, J. Carbon and oxygen isotope ratios in wood constituents of Pinus halepensis as indicators of precipitation, temperature and vapour pressure deficit. Tellus B Chem. Phys. Meteorol. 2017, 57, 164–173. [Google Scholar] [CrossRef]
  75. Bong, Y.S.; Lee, K.S.; Shin, W.J.; Ryu, J.S. Comparison of the oxygen and hydrogen isotopes in the juices of fast-growing vegetables and slow-growing fruits. Rapid Commun. Mass Spectrom. 2008, 22, 2809–2812. [Google Scholar] [CrossRef] [PubMed]
  76. Kolesnov, A.; Zenina, M.; Tsimbalaev, S.; Davlyatshin, D.; Ganin, M.; Anikina, N.; Agafonova, N.; Egorov, E.; Guguchkina, T.; Prakh, A.; et al. Scientific study of 13C/12C carbon and 18O/16O oxygen stable isotopes biological fractionation in grapes in the Black Sea, Don Basin and the Western Caspian regions. BIO Web Conf. 2017, 9, 02020. [Google Scholar] [CrossRef] [Green Version]
  77. IAEA. Isotopic Composition of Precipitation in the Mediterranean Basin in Relation to Air Circulation Patterns and Climate; International Atomic Energy Agency: Vienna, Austria, 2005; p. 223. [Google Scholar]
  78. Cocco, M.; Mercenaro, L.; Cascio, M.L.; Nieddu, G. Effects of Vine Water Status and Exogenous Abscisic Acid on Berry Composition of Three Red Wine Grapes Grown under Mediterranean Climate. Horticulturae 2020, 6, 12. [Google Scholar] [CrossRef]
Figure 1. Total rainfall (bars) and monthly mean temperature (points and lines) at the experimental site during the 2018, 2019, and 2020 agronomic years and the 20-year averages (2001–2020).
Agronomy 12 02399 g001
Figure 2. Duration and date of each phenological stage of the cycle of the different cultivars. Bars are 3-year averages. Different colored bars indicate the duration of each period between phenological stages. ANOVA; n.s., not significant.
Agronomy 12 02399 g002
Figure 3. Carbon isotope ratio (δ13C) in grape must at harvest time. The box plot illustrates the distribution of δ13C values of must from 13 red cultivars from 2018 to 2020. The results are ordered by their means. The black solid line indicates that the median and the box ends correspond to the 25th and 75th percentiles of the data. The error bars represent the 10th and 90th percentiles. The mean δ13C values of cultivars with different letters (a, b, c, and d) are significantly different at p < 0.001 as indicated by the S–N–K test. The hollow circles outside the boxes correspond to outliers.
Agronomy 12 02399 g003
Figure 4. Relationship between grape must δ18O and VPD7d under severe water stress conditions for 13 red cultivars from 2018 to 2020. The points on the graph represent the δ18O and daily mean VPD7d values prior to the date of harvest of the individual vines. The curve represents the double inverse fit between the two variables.
Agronomy 12 02399 g004
Figure 5. Oxygen isotope ratio (δ18O) in grape musts at harvest time. The box plot illustrates the distribution of δ18O values of must from 13 red cultivars from 2018 to 2020. The results are ordered according to their means. The black solid line indicates the median and the box ends correspond to the 25th and 75th percentiles of the data. The error bars represent the 10th and 90th percentiles. The mean δ18O values of cultivars with different letters (a, b, c, and d) are significantly different at p < 0.001, as indicated by the S–N–K test.
Agronomy 12 02399 g005
Figure 6. Principal components analysis (PCA) of agronomic traits in 13 red grapevine cultivars. Abbreviations: TSS, total soluble solids; TA, total acidity; Y, yield; PW, pruning weight; 13C/12C, must carbon isotope ratio.
Agronomy 12 02399 g006
Table 1. Yield components and pruning weight (mean value ± standard deviation, n = 15) of 13 red cultivars.
CultivarYield
(kg vine−1)
Bunch Weight
(g)
Berry Weight
(g)
Pruning Weight
(kg vine−1)
Ravaz Index
Monastrell2.06 ± 1.00 a120.01 ± 40.36 a1.05 ± 0.20 a0.28 ± 0.09 ab7.27 ± 2.62 abcd
Forcallat Tinta2.20 ± 1.13 ab172.05 ± 47.84 ab1.45 ± 0.13 b0.33 ± 0.13 ab6.80 ± 2.83 abc
Graciano2.47 ± 1.81 abc138.94 ± 55.47 ab0.97 ± 0.18 a0.27 ± 0.14 a9.39 ± 4.83 bcd
Tempranillo2.74 ± 1.85 abc156.83 ± 79.98 ab1.34 ± 0.20 b0.47 ± 0.25 bc5.64 ± 3.00 a
Garnacha Tintorera2.89 ± 2.21 abc114.20 ± 51.42 a1.49 ± 0.27 b0.36 ± 0.21 abc7.30 ± 3.05 abcd
Garnacha Peluda3.00 ± 1.74 abc126.95 ± 44.46 ab1.36 ± 0.17 b0.42 ± 0.20 abc7.26 ± 2.76 abcd
Garnacha Tinta3.11 ± 2.17 abcd128.10 ± 60.41 ab1.34 ± 0.20 b0.40 ± 0.20 abc7.15 ± 2.49 abcd
Bobal3.18 ± 0.91 abcd329.63 ± 98.70 d2.01 ± 0.21 c0.56 ± 0.18 c6.13 ± 2.08 ab
Mazuela3.56 ± 1.20 abcd150.90 ± 38.53 ab1.39 ± 0.29 b0.47 ± 0.14 bc7.56 ± 1.63 abcd
Moribel4.04 ± 2.08 bcd185.77 ± 47.03 bc1.56 ± 0.18 b0.41 ± 0.16 abc9.82 ± 2.58 cd
Tinto Velasco4.22 ± 1.28 cd222.29 ± 53.00 c1.98 ± 0.35 c0.52 ± 0.14 c8.52 ± 3.31 abcd
Tinto de la Pámpana Blanca4.38 ± 1.48 cd236.97 ± 54.73 c2.00 ± 0.19 c0.45 ± 0.15 abc10.22 ± 3.31 d
Moravia Agria4.88 ± 2.62 d230.01 ± 76.64 c1.34 ± 0.18 b0.39 ± 0.18 abc12.56 ± 3.41 e
Different letters in the same column denote statistically significant differences between cultivars (ANOVA, S–N–K test, p < 0.001).
Table 2. Must quality components (mean value ± standard deviation, n = 15) of 13 red cultivars.
CultivarTotal Soluble Solids
(°Brix)
Total Acidity
(g L−1)
pH
Moravia Agria20.27 ± 1.59 a6.58 ± 1.05 f3.12 ± 0.12 ab
Garnacha Tintorera20.83 ± 2.39 ab4.29 ± 0.65 b3.34 ± 0.21 cd
Tinto de la Pámpana Blanca21.09 ± 1.97 abc4.88 ± 0.44 bc3.26 ± 0.13 bcd
Tinto Velasco21.65 ± 1.43 bcd4.85 ± 0.45 bc3.37 ± 0.22 cd
Forcallat Tinta22.11 ± 0.52 cde3.57 ± 0.35 a3.43 ± 0.18 cd
Tempranillo22.39 ± 1.37 cdef4.21 ± 0.78 b3.45 ± 0.20 d
Mazuela22.71 ± 1.11 defg6.09 ± 0.77 ef3.26 ± 0.19 bcd
Monastrell22.92 ± 1.00 defg4.81 ± 0.54 bc3.37 ± 0.14 cd
Garnacha Tinta23.53 ± 0.90 efg4.83 ± 0.59 bc3.26 ± 0.19 bcd
Moribel23.55 ± 1.51 efg5.54 ± 0.84 cde3.31 ± 0.18 cd
Bobal23.74 ± 1.20 fg5.80 ± 1.34 de3.36 ± 0.16 cd
Garnacha Peluda24.12 ± 1.08 g5.30 ± 0.71 cd3.23 ± 0.20 bc
Graciano26.32 ± 1.87 h6.52 ± 1.06 f3.06 ± 0.15 a
Different letters in the same column denote statistically significant differences between cultivars (ANOVA, S–N–K test, p < 0.001).
Table 3. A synthesis of the study results categorizes the cultivar’s drought tolerance according to five traits: yield, pruning weight, total soluble solids, total acidity, and δ13C. Category cut-offs are arbitrarily chosen (adapted from [44]).
TraitCategory 1 (High)Category 2 (Moderate)Category 3 (Low)
Yield(>4 kg vine−1)
Moribel, Tinto Velasco, Tinto de la Pámpana Blanca, Moravia Agria
(3–4 kg vine−1)
Garnacha Peluda, Garnacha Tinta, Bobal, Mazuela
(<3 kg vine−1)
Monastrell, Forcallat Tinta, Graciano, Tempranillo, Garnacha Tintorera
Pruning weight(>0.50 kg vine−1)
Tinto Velasco, Bobal
(0.35–0.50 kg vine−1)
Garnacha Tintorera, Moravia Agria, Garnacha Tinta, Moribel, Garnacha Peluda, Tinto de la Pámpana Blanca, Tempranillo, Mazuela
(<0.35 kg vine−1)
Graciano, Monastrell, Forcallat Tinta
Total soluble solids(>24.5 °Brix)
Graciano
(22.5–24.5 °Brix)
Mazuela, Monastrell, Garnacha Tinta, Moribel, Bobal, Garnacha Peluda
(<22.5 °Brix)
Moravia Agria, Garnacha Tintorera, Tinto de la Pámpana Blanca, Tinto Velasco, Forcallat Tinta, Tempranillo
Total acidity(>6.0 g L−1)
Mazuela, Graciano, Moravia Agria
(4.5–6.0 g L−1)
Bobal, Monastrell, Garnacha Tinta, Tinto Velasco, Tinto de la Pámpana Blanca, Garnacha Peluda, Moribel
(<4.5 g L−1)
Forcallat Tinta, Tempranillo, Garnacha Tintorera
δ13C(>−22.5‰)
Garnacha Tintorera
(−22.5 to −23.5‰)
Forcallat Tinta, Garnacha Peluda, Tinto de la Pámpana Blanca, Garnacha Tinta, Tinto Velasco, Monastrell, Moravia Agria, Tempranillo, Bobal
(<−23.5‰)
Moribel, Mazuela, Graciano
Publisher’s Note: MDPI stays neutral with regard to jurisdictional claims in published maps and institutional affiliations.

