Abstract
Identifying nematode damage in large soybean areas is not always achievable in a practical way. Multispectral reflectance sensors have not been thoroughly evaluated to detect nematode damage in soybeans (Glycine max L.). The main research aims of this study were to: (i) determine the bivariate relationship between individual spectral bands and vegetation indices (VIs) relative to soybean conditions (symptomatic versus asymptomatic), and (ii) to select the best model for identifying plant conditions using three algorithms (logistic regression—LR, random forest—RF, conditional inference tree—CIT) and three options for data input using bands, vegetation indices (VIs), and bands plus VIs. The trial was conducted in Brazil on three on-farm soybean fields presenting different species of nematode infestation. Multispectral imagery was obtained using a drone-mounted MicaSense RedEdge® sensor. At each sampling, georeferenced point nematode infestation and spectral measurements of soybean plants were retrieved for the classification of symptomatic and asymptomatic areas, according to the threshold level adopted. Bivariate analysis of variance (ANOVA), LR, RF, and CIT were used to select the multispectral bands/VIs that discriminated among symptomatic and asymptomatic plants, assessing the best model via their respective parameters for accuracy, sensitivity, and specificity. The greatest classification accuracy (>0.70) was achieved when using the CIT algorithm with the spectral bands only, with green (560 ± 20 nm) and near-infrared (840 ± 40 nm) included as the main spectral input variables in the model. These results demonstrate the potential of combining remotely sensed data and machine learning to distinguish nematode-symptomatic and asymptomatic soybean plants.
1. Introduction
Globally, the estimated economic losses due to soilborne plant nematodes are roughly USD 216 billion each year for about 20 crops considered essential in world subsistence [1]. Soybean (Glycine max L.) production can be significantly reduced by up to 30% due to nematode damage [2]. To prevent the spread and introduction of other species, early damage detection is important [3]. However, nematode occurrence is only evident via crop response, spatially concentrated but unorganized/unstructured, and manual surveillance is both time and labor-intensive, complicating its accurate and rapid prediction for timely management action.
Nematodes infect plant roots causing problems in plant water and nutrient absorption and translocation [4]. The aboveground symptoms include stunted growth and leaf chlorosis, challenging its correct diagnoses and typically confounding this symptom with other stresses such as drought and nutrient deficiencies [5]. Nonetheless, nematodes are spatially distributed in patches due to their low soil mobility, making their field-level detection prone to remote sensing use [6].
Nematode diagnosis and quantification of severity levels in large soybean areas is expensive and not always achievable in a practical way [7]. Laboratory analysis of several soil and root samples distributed over the entire field, both labor and cost intensive, is required for a detailed evaluation of potential damage [8]. Therefore, a rapid and affordable method to diagnose nematode occurrence involves the development of rapid phenotyping (e.g., via remote sensing) detection methods in site-specific management.
Spectral reflectance bands have been studied as a useful tool in detecting plant stress due to the variance in the reflected light in the visible (VIS) and near-infrared (NIR) range of the electromagnetic spectrum [7,9]. Hillnhutter et al. [6] reported that hyperspectral imaging was useful to detect and discriminate the development of root diseases. Bajwa et al. [10] were able to discriminate between non-infected and infected plants with nematodes and a soil-borne fungal pathogen based on the use of spectral reflectance and vegetation index (VI). Therefore, the use of spectral bands and VIs to identify nematode symptoms in soybean plants should be investigated as an important strategy to improve nematode management and control.
The analysis of remote sensing to detect plants infected with diseases can be challenging and different statistical approaches have been evaluated for improving the screening of this farming issue. These include parametric methods such as logistic regression (LR) [11,12] and non-parametric classification methods such as decision tree-based algorithms [13]. Two important decision tree methods are random forest (RF) and conditional inference tree (CIT). The RF algorithm has been used in multiple fields of remote sensing for imagery data extraction [14] with a high degree of accuracy but limited interpretability. The CIT is an algorithm used for recursive variable selection and binary partitioning on the explanatory variables according to a significance test and outputs an interpretable decision tree model [15]. These methods can be useful in identifying complex relationships between response and explanatory variables, and the choice of the algorithm should be made based both on its performance and interpretability [16]. Remote sensing can create large amounts of data, with machine learning potentially assisting in untangling complex relationships and aiding in plant protection management [17].
In summary, this paper aims to investigate the capability of remotely sensed multispectral data for the detection of nematode symptoms in soybean areas. The aims of this study were to: (i) determine the bivariate relationship between individual spectral bands and VIs and soybean conditions (symptomatic versus asymptomatic), and (ii) select the best model tested for identifying plant conditions using three algorithms (logistic regression—LR, random forest—RF, conditional inference tree—CIT) and three options for data input using only bands (reduced model), only VIs, and bands plus VIs (full model).
2. Materials and Methods
2.1. Sites Description
Three different site experiments were conducted during the 2018 and 2019 summer soybean growing season. The sites were located near Guaíra (sites I and II) and Jaboticabal (site III) in the state of São Paulo, Brazil (Figure 1). Sites were chosen based on previous natural nematode occurrences (Table 1). The previous crop was common beans at sites I and II, and corn at site III. The three sites have been managed under no-tillage practices. The growing season maximum and minimum average air temperature of sites I and II was 30.0 °C and 21.2 °C, respectively, and the cumulative rainfall was 822 mm, and for site III the averages air temperatures were 30.4 °C and 20.6 °C, respectively, and cumulative rainfall of 636 mm.
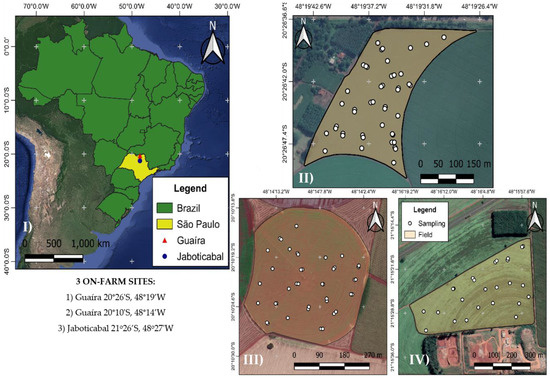
Figure 1.
Characterization of the experimental area. (I) Guaíra and Jaboticabal cities highlighted with different colors/symbols within the state of São Paulo and Brazil maps. (II–IV) site experiments with white circles representing the georeferenced sampling points.

Table 1.
Elevation, nematode species identified, and total area (ha) for each site.
Site I was sown at 290,000 seeds ha−1 on 3 November with soybean cultivar BRS 7380 (Embrapa Ltd., Brasília, Brazil), RR, resistant to cyst nematode (H. glycines) races 3, 4, 6, 9, 10, and 14; root-knot nematode, M. incognita e M. javanica and low reproduction factor to the lesion nematode (P. brachyurus). Site II was sown at 320,000 seeds ha−1 on 15 November with soybean cultivar DS 5916 (Don Mario, Argentina), resistant only to M. incognita. Site III was sown at 290,000 seeds ha−1 on 5 November with soybean cultivar TMG 7063 (Tropical Melhoramento e Genética Ltda., Cambé-PR, Brazil), susceptible to nematodes.
Soybean seeds were treated with Pyraclostrobin + Tiophanate-methyl + Fipronil (Standak Top ®) and inoculated with Bradyrhizobium japonicum SEMIA 5079 + SEMIA 5080 (Masterfix ® liquid inoculant). Sites I and III were rainfed and site II was center pivot irrigated frequently to keep moisture at field capacity. Sites I, II, and III were fertilized before sowing with a granular fertilizer at the rates of 12, 6, and 12 kg N ha−1; 60, 36, and 60 kg P2O5 ha−1; and 60 kg K2O ha−1 at each site, respectively. Weeds, diseases, and pests were controlled according to regional best management practices for soybean.
2.2. Data Collection
2.2.1. Pathogen and Plant Sampling
At the R5 soybean growth stage (beginning of seed filling), 45, 40, and 30 geo-referenced and randomized points were selected on sites I, II, and III, respectively. At each point, approximately 1 L of soil and 30 g of soybean pivoting and radicle roots from five consecutive plants were collected from the 0–20 cm depth soil layer. Soil and root samples were stored in a refrigerator. After sample collection, an EVA white plate was placed at each point. Mapping was completed with the Zenmuse RGB Camera (DJI, Nanshan District, Shenzhen, China) for later georeferencing of the nematode collection points with the images of the MicaSense RedEdge (MicaSense Inc., Seattle, WA, USA)using as control points physical features of the area perfectly identifiable in both images.
2.2.2. Nematode Extraction, Identification, and Qualification
Nematode species were identified from soil and roots samples at the Nematology Laboratory of São Paulo State University, Jaboticabal. The samples were homogenized and a 100 cm3 soil volume representing each point was sampled, using the method from Jenkins (1972) [18]. For root samples, total volume was measured on a digital scale, the roots were washed and cut into pieces of about 2 cm, crushed in a blender, and the nematodes were extracted according to the methodology proposed by Shepherd [19].
Nematode identification was carried out through morphology and compared with the original description of each species [20] and estimate of population of each species using Peters chamber, under an optical microscope [21]. From the results obtained, the nematode population was estimated by standardizing the result to 10 g of roots. For H. glycines species, which occurred only on site I, the cysts were extracted from the soil according to the methodology according to Shepherd [22].
2.2.3. Multispectral Data and VI Calculation
A small unmanned aerial vehicle (sUAV) DJI Matrice 100 (DJI, Shenzhen, China) was used as the sensor-carrying platform. The sUAV was mounted with a RedEdge® (MicaSense Inc.®, Seattle, WA, USA) multispectral sensor, featuring five global shutter narrowband image bands: blue (475 ± 20 nm), green (560 ± 20 nm), red (668 ± 10 nm), red edge (717 ± 10 nm) and near-infrared (NIR) (840 ± 40 nm).
Flights were performed between 10 a.m. and 2 p.m. (i.e., at solar noon to minimize shadows), at the R1 soybean growth stage (when soybean plants achieve maximum height). The sUAV was constantly flown 120 m above the ground level, resulting in a spatial resolution of 8 cm with 80% overlap between adjacent images to avoid gaps and allow subsequent photogrammetric processing. The images were calibrated with assistance of a downwelling radiation sensor and photo from the calibration panel before the starting of the flight. The raw images were calibrated and collated into a reflectance orthomosaic using photogrammetric software Pix4D MapperPro version 3.3.13 (Pix4D SA, Lausanne, Switzerland). Improvements in locational accuracy were obtained by establishing five control points using the software QGIS 3.12 (QGIS Development Team, QGIS Geographic Information System, Open-Source Geospatial Foundation Project 2017), georeferencing plugin (nearest neighbor method). To spatially match ground-truth data and imagery, the center of the manual sampling location points was identified in the processed imagery. For each point, a 1 m diameter buffer size was created from which mean band values were extracted and vegetation indices (Table 2) were then calculated using the ArcGIS (Redlards, CA, USA) software (Figure 2).
Table 2.
Vegetation index (VI), description, equation, and reference used to analyze nematode infection.
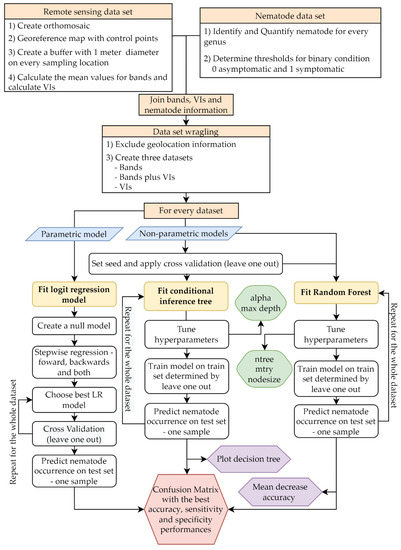
Figure 2.
Data set generation and workflow of the tested models. The rectangle shapes represent the datasets, the parallelogram shapes the model type, the rounded rectangle the main processes, the rounded hexagons the hyperparameters tuned, and the hexagons represent the overall output of the process. LR = logit regression, VIs = vegetation indices.
2.3. Data Analysis
2.3.1. Nematode Infection Classification
Soybean is a host for several plant parasitic nematodes species simultaneously occurring in commercial areas [32]. Based on the nematode laboratory results, each sample was classified as symptomatic and asymptomatic if any nematode count was above and below the threshold level, respectively (Table 3), adapted from Koenning et al. (2004) [33] and Dickerson et al. (2000) [34].
Table 3.
Thresholds to classify asymptomatic and symptomatic plants for the training model.
2.3.2. Bivariate Analysis of Individual Bands and VIs
Linear fixed-effect models were conducted with each individual band and VI as the response variable and nematode infection classification outcome (i.e., asymptomatic vs. symptomatic plants) as the explanatory variable using the function lm from package stats in R (R Core Team, Vienna, Austria, 2020). Significant models were further analyzed by performing pairwise comparisons between nematode infection classification outcomes at α = 0.05.
2.3.3. Nematode Infection Prediction
Nematode infection classification outcome was modeled as a function of bands, VIs, and band plus VIs using three different approaches: LR, RF, and CIT (Figure 2). The explanatory variables (i.e., bands and VIs) were split into three sets in order to identify the spectral characteristics that allow more evident separation of the nematode classification. Those sets were: (i) only bands (blue, green, red, red edge, and NIR); (ii) only VIs (all VIs); and (iii) bands plus VIs.
The LR model was performed using the function glm (with binomial error distribution and link function) from package stats (R Core Team, Vienna, Austria, 2020). The RF models were run with function randomForest from package randomForest [35], and the CIT models with function ctree from package partykit [15].
The LR model was fitted in three stepwise approaches to select the best subset of predictive variables and avoid multicollinearity. The predictive variables included in the final models were selected by using the stepAIC function with three different directions (“forward”, “backward”, and “both”). The selected final models were then checked for overdispersion.
Leave-one-out cross-validation was used in the tree-tested models. For RF and CIT, cross-validation was key to selecting the most proper hyperparameter values and to calculate unbiased model performance metrics. All analyses were executed using R software (R Core Team, Vienna, Austria, 2020).
For the RF algorithm, all combinations between three hyperparameters were tested, including the number of trees (ntree = 50, 100, 300, 600), the number of variables as predictors for each split (mtry = 1, 2, 4, 6), and the minimum size in each terminal node (nodesize = 1, 3, 6, 9). For the CIT algorithm, all combinations between two hyperparameters were tested, including the significance level for variable selection (alpha = 0.1, 0.05, 0.01) and the maximum depth of the tree (maxdepth = 2, 3, 4, 5). For both algorithms, the combination of hyperparameters that maximized classification accuracy was chosen for subsequent analysis. Therefore, after model optimization, RF selected hyperparameter values for ntree, mtry, and nodesize were 600, 4, and 1 for bands; 600, 1, and 1 for VIs; and 50, 2, and 9 for bans plus VIs, respectively. The CIT selected hyperparameter values for alpha and maxdepth were 0.01 and 2 for bands; 0.01 and 2 for VIs; and 0.05 and 2 for bands plus VIs, respectively.
2.3.4. Algorithm Performance Evaluation
LR, RF, and CIT models with their respective selected optimum hyper-parameters were evaluated for each of the explanatory variable sets (bands, VIs, bands plus VIs) based on overall classification accuracy (A) (Equation (1)), specificity (SP) (Equation (2)), and sensitivity (SN) (Equation (3)). These metrics are calculated based on the true-positive (TP), false-positive (FP), true-negative (TN), and false-negative (FN) rates. TP and TN represent the fundamental truth when the predicted class is symptomatic or asymptomatic, respectively, and FP and FN illustrate the wrong classification for symptomatic and asymptomatic occurrence. The metrics A, SN, and SP are then computed by the formulas:
Within the context of this work, sensitivity and specificity represent the proportion of symptomatic plants correctly predicted by the model, and the proportion of asymptomatic plants correctly predicted by the model, respectively. The performances were calculated using the function confusionMatrix from the caret package [36].
3. Results
3.1. Bivariate Analysis of Individual Bands and VIs
The spectral reflectance curves for symptomatic versus asymptomatic soybean conditions presented large variability and overlap (Figure 3A). The curve behavior in the visible range appears traditional for chlorophyll absorption, and the percentage difference between asymptomatic and symptomatic was less than 3%. Nonetheless, symptomatic soybeans presented significantly greater reflectance in the regions of blue, green, red, and red edge (Figure 3B).
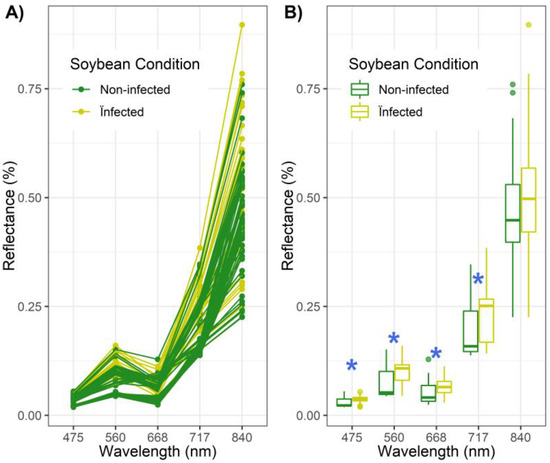
Figure 3.
Spectral reflectance curves from asymptomatic (green) and symptomatic (yellow) soybean plants with (A) all replications (n = 115) from all three sites, and (B) summarized reflectance as boxplots obtained for each condition. On panel (B), boxplots portray the 25th (lower hinge), 50th (solid black line), and 75th (upper hinge) percentiles, largest value no further than 1.5× inter-quartile range (lower whisker), smallest value at most 1.5× inter-quartile range (upper whisker), and outlying observations (points). * Represent significant differences between conditions within a given band at α = 0.05.
Across all tested VIs, only GNDVI, NDRE and SR were able to discriminate asymptomatic relative to symptomatic soybean plants (Figure 4). In those cases, the VI values for the symptomatic were significantly lower compared to the asymptomatic condition. Those indices are more sensitive to high-biomass conditions due to the replacement of the red band in NDVI by the green and red edge bands in GNDVI and NDRE, respectively. The other indices were not able to statistically differentiate soybean conditions related to nematode infection.
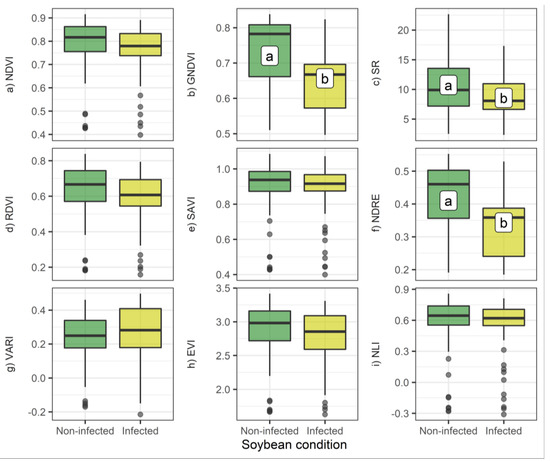
Figure 4.
Boxplot representing the data distribution for VIs in different soybean conditions (asymptomatic in green, symptomatic in yellow). Boxplots portray the 25th (lower hinge), 50th (solid black line), and 75th (upper hinge) percentiles, largest value no further than 1.5× inter-quartile range (lower whisker), smallest value at most 1.5× inter-quartile range (upper whisker), and outlying observations (points). Different letters represent significant differences between conditions at α = 0.05. Further details on all description and abbreviations on the vegetation indices can be consulted in Table 2.
3.2. Algorithms Performance
Across all algorithms and input variable types, overall accuracy, sensitivity, and specificity ranged from 0.64–0.71, 0.60–0.72, and 0.62–0.78, respectively (Table 4). The greatest accuracy (0.71) was observed when bands were the main input variables and the algorithm used was CIT. Using bands plus VIs as the input variables did not improve the classification accuracy and sensitivity. The lowest accuracy and specificity were observed with the LR approach.
Table 4.
Accuracy, sensitivity, and specificity from the classification of soybean condition (symptomatic vs. asymptomatic) from three algorithms (logistic regression—LR, random forest—RF, and conditional inference tree—CIT) and three data input (bands only, vegetation indices—VIs-only, bands plus VIs).
The difference in accuracy between the CIT and LR methods was 0.5, 0.02, and 0.07, respectively, when input variables included bands, VIs, and both bands and VIs, respectively. For sensitivity, CIT differed from LR by 0.01, −0.07, 0.6, and for specificity, by 0.09, 0.16, and 0.11 for bands, VIs, and bands plus VIs, respectively. The overall accuracy difference between CIT and RF was 0.01, 0.02, and 0.03, respectively, and for sensitivity and specificity was 0.05, −0.02, 0.03, and 0, 0.11, and 0.02 for the input variables bands, VIs and bands plus VIs, respectively.
3.2.1. Logistic Regression
For the LR algorithm, the independent variables in the final models were selected through stepwise regression with AIC as the metric criteria. The selected subset of variables in the final models was green (for bands); NDVI, GNDVI, RDVI, SAVI, and VARI (for VIs); and blue, green, red edge, GNDVI, NDRE, VARI, EVI (for both bands and VIs).
3.2.2. Random Forest
For the RF algorithm, the main variables assessed by the mean decrease accuracy (MDA) were green and red edge bands both when bands and bands plus VIs were used as input variables. When only bands were used as input variables, the MDA of green and red edge bands was 9.4% and 6.5%, respectively, and the same bands were selected when the input type included VIs, with an MDA of 6.6% and 4.4%, respectively. When only VIs was used as the input variable, VARI and GNDVI were the most relevant variables, with an MDA of 5.4% and 3.5%, respectively.
3.2.3. Conditional Inference Tree
When using only bands as the data input type, the most important variables differentiating soybeans condition classes were green and NIR (Figure 5). Soybeans’ condition was classified as symptomatic when green reflectance was greater than 0.105 (36.5% of the observations relative to all data), and asymptomatic when green reflectance was lower than 0.105 (63.5% of the observations relative to all data). Within the asymptomatic, when NIR reflectance was greater than 0.44 (41% of observations within the asymptomatic group), most of the observations within this node (90%) were asymptomatic soybean data. Lastly, when green reflectance was lower than 0.105 and NIR reflectance was lower than 0.44, soybean condition was classified as asymptomatic, although with less certainty due to both symptomatic and asymptomatic classes existing in similar proportion at this node (41% and 59%, respectively). The same result was obtained when the input type was bands plus VIs, demonstrating a lack of improvement in discriminating soybean conditions. This observation was also supported by the magnitude of sensitivity and specificity. For VIs input variable type, soybean was considered symptomatic when GNDVI was below 0.708, equivalent to 61% (n = 70) of the total dataset (data not shown). This last model classified a greater proportion of the data as symptomatic relative to the model using spectral bands only and full, spectral bands plus VI (same model as bands only; Figure 5).
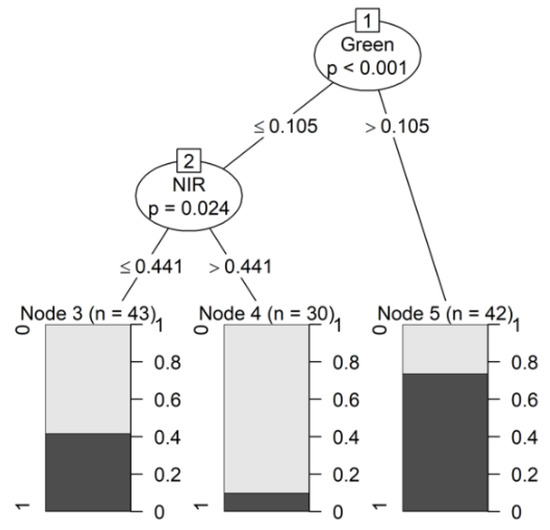
Figure 5.
Conditional inference tree model using bands. Terminal node bars represent the proportion (right y-axis) of samples for each soybeans condition at that node. Left y-axis refers to plant condition classes with 0 as asymptomatic and 1 as symptomatic.
4. Discussion
This study demonstrated a novel approach using remotely sensed data and machine learning in field-grown soybeans to differentiate between nematode-symptomatic and asymptomatic areas, improving both labor and time intensity constraints relative to boots on the ground approach. This new approach has the potential to be implemented in site-specific nematode management via the use of targeted pesticide treatments, utilization of tolerant soybean varieties, and diversifying crop rotation in heavily infested fields. The application of remote sensing data to assess pests and diseases has been already reported in the literature documenting that the VIS-NIR reflectance is sensitive to nematode occurrence in several crops [6,7]. Nutter et al. (2002) [37] indicated that remote sensing and GIS together offer a novel method for identifying and measuring the H. glycines population densities and their effects on the quantity and quality of soybean production.
From a physiological perspective, several studies reported the reduction of chlorophyll content, plant growth, photosynthetic rate, and nutrient concentrations due to nematodes infection, with the aboveground canopy symptoms including chlorosis and severely stunted plants [4,37,38,39], symptoms that can be differentiated via utilization of remote sensing aerial imagery via spectral bands. Our results (Figure 3) are in line with Sims and Gamon (2002) [40], reporting that chlorophyll content and other plant pigments are strongly correlated with absorption in the visible spectral regions. Visible light (400–700 nm) is absorbed by the plant mostly for photosynthesis and a lower concentration of pigments such as chlorophyll a and b, carotenoids, and anthocyanins can reduce the photosynthetic rate [41]. The red edge band (centered at 750 nm) has been identified as more sensitive to changes in chlorophyll content relative to blue, green, and red bands under high biomass [42]. Furthermore, leaf morphology and structure differences are retrieved by bands in the NIR region (800–1100 nm) [39].
Considering the scientific literature on spectral reflectance information to distinguish nematode symptomatic areas, an important outcome of this research was related to the capability of green and NIR bands on differentiating symptomatic and asymptomatic soybean conditions (Figure 3B and Figure 5). These findings show that multispectral data in the form of bands can be used as a rapid, non-destructive, and cost-effective method for the detection of nematodes. Martins et al. (2017) [7] reported that spectral curves obtained from coffee canopy severely infected with root-knot nematodes presented lower reflectance between 750 and 900 nm wavelength compared to asymptomatic plants. Our results (Figure 3B) agree with these authors, who stated that red edge and NIR regions were sensitive to this type of plant stress. Therefore, presented stress characteristics caused by nematode parasitism can be detected by leaf reflectance.
In addition to the investigation of the individual spectral bands, the VIs can estimate the relationship between crop physiological parameters and reflectance, with NDVI considered the most popular VI used in agricultural-related topics [6,10]. However, red reflectance can saturate rapidly even under low chlorophyll content [43]. In order to increase the sensitivity of NDVI to chlorophyll content, researchers developed indices including the green [24], and red edge bands [28]. Although NDVI was not an adequate VI to differentiate soybean conditions, GNDVI and NDRE were capable to discriminate and isolate these conditions. The SR is used to indicate the relative biomass presented in the image [25,44], and in our study (Figure 4c), it was able to differentiate the lower biomass infected plants. In the CIT models, GNDVI was selected as the only splitting variable and in the RF models, it was identified as an important variable via MDA.
The statistical techniques demonstrated that similar variables were selected to differentiate the symptomatic from the asymptomatic condition regardless of the tested algorithm. The variables subset selected to use in the LR algorithm included green (for bands); NDVI, GNDVI, RDVI, SAVI, and VARI (for VIs); and blue, green, red edge, GNDVI, NDRE, VARI, EVI (for both bands and VIs). The CIT model used green and NIR variables to split the tree (Figure 5). In contrast, NIR was not significant in explaining soybeans’ condition in the bivariate analysis (Figure 3B). This demonstrates how the CIT model was able to expand the bivariate relationship in finding a significant NIR effect within a sub-population of the data. Additionally, the RF model had green and red edge as the most important variables, agreeing with the bivariate analyses (Figure 3B). Our results demonstrated that LR, RF, and CIT were able to distinguish between soybean symptomatic with nematodes from asymptomatic plants with reasonable accuracy, with RF and CIT presenting greater classification accuracy (Table 4).
Others have found LR to be successful in detecting rhizomania in sugar beets [12] and apple scabs [11]. Although not evaluated, based on the current results the outcomes presented by Delalieux et al. (2007) [11] could have been improved if CIT and RF models had been tested in detecting biotic stress in apple trees. One disadvantage of LR is that it can be affected by multicollinearity (i.e., when two or more independent variables are collinear), leading to unstable estimation and inflated coefficient of variation, negatively impacting model predictive performance in new data sets.
The CIT with spectral bands as input variables was the best model in regard to accuracy and sensitivity, but not specificity relative when only VIs were used as data input (Table 4). Although the input variable VIs had the worst accuracy for all models, they had the best specificity when CIT was applied. In the context of this study, models with greater accuracy and sensitivity (correctly predicting symptomatic plants) are most useful since the economic extent of nematode damage can far exceed the cost of nematode control practice [45].
Future studies should evaluate multiple sources of both algorithm and input data following a similar step process as presented in the current paper. Limitations of this study are related to the limited number of fields and the constraint on the single timing for the sUAV flight for data collection. For upscaling the study to a product, a more robust data set including a larger pool of abiotic (e.g., soil type, weather regime) and biotic (e.g., soybeans cultivars, nematode incidence, and severity levels) variability is needed to retrain the models. Additionally, future studies should obtain spectral and ground-truthing information at various crop stages to determine the best moment to separate nematode-symptomatic from asymptomatic soybean areas. Sensors with more spectral bands (hyperspectral sensors) available can also be useful to relate the occurrence in specific wavelengths not evaluated in this study.
5. Conclusions
This research provided a useful nematode identification workflow for distinguishing symptomatic soybean plants infected with nematodes using high spatial resolution aerial sensing data combined with machine learning. The findings can support further development of more precise soil-borne parasites identification models.
Statistical non-parametric techniques were able to identify spectral wavelengths differentiating between soybean plants with or without nematode’s symptoms. Green and NIR spectral bands presented greater values of accuracy for model detection to separate symptomatic versus asymptomatic plants, even when compared with different tested VIs. Spectral bands as an input applied to CIT were able to identify nematode-symptomatic plants with reasonable classification accuracy and better performance than RF and LR methods. Further research should focus on increasing the efforts on data collecting under more contrasting nematode levels, soil and weather environments, with the goal of not only improving regional models (combining fields) but site-specific model prediction for plant behavior and response to nematode damage.
Author Contributions
Conceptualization, L.B.S., I.A.C., P.L.M.S. and R.P.d.S.; methodology, L.B.S., P.L.M.S., R.P.d.S., M.F.d.O.; formal analysis L.M.B., I.A.C. and L.B.S.; investigation, L.B.S.; resources, R.P.d.S. and I.A.C.; data curation L.M.B. and L.B.S.; writing—original draft preparation, L.B.S.; writing—review and editing, L.M.B., I.A.C., P.L.M.S. and R.P.d.S.; visualization, R.P.d.S., I.A.C., L.M.B., L.B.S., M.F.d.O. and P.L.M.S.; supervision, R.P.d.S., I.A.C., P.L.M.S. and L.M.B.; project administration, L.B.S. and M.F.d.O.; funding acquisition, R.P.d.S. and I.A.C. All authors have read and agreed to the published version of the manuscript.
Funding
Improvement of Higher Education Personnel Brazil (CAPES) for the scholarship granted-Financing code 001.
Acknowledgments
We would like to acknowledge the students, technicians, and professors that somehow contributed with technical support. We also would like to acknowledge the Laboratory of Machinery and Agricultural Mechanization (LAMMA) of the Department of Engineering and Mathematical Sciences for the infrastructural support.
Conflicts of Interest
The authors declare no conflict of interest.
References
- Askary, T.H.; Martinelli, P.P. Biocontrol Agents of Phytonematodes; CABI: Wallingford, UK, 2015. [Google Scholar]
- Allen, T.W.; Bradley, C.A.; Sisson, A.J.; Byamukama, E.; Chilvers, M.I.; Coker, C.M.; Collins, A.A.; Damicone, J.P.; Dorrance, A.E.; Dufault, N.S.; et al. Soybean Yield Loss Estimates Due to Diseases in the United States and Ontario, Canada, from 2010 to 2014. Plant Health Prog. 2017, 18, 19–27. [Google Scholar] [CrossRef]
- Zhao, L.; Jiang, P.; Humble, L.M.; Sun, J. Within-Tree Distribution and Attractant Sampling of Propagative Pinewood Nematode, Bursaphelenchus xylophilus: An Early Diagnosis Approach. For. Ecol. Manag. 2009, 258, 1932–1937. [Google Scholar] [CrossRef]
- Carneiro, R.G.; Mazzafera, P.; Ferraz, L.C.C.B.; Muraoka, T.; Trivelin, P.C.O. Uptake and Translocation of Nitrogen, Phosphorus and Calcium in Soybean Infected with Meloidogyne incognita and M. javanica. Fitopatol. Bras. 2002, 27, 141–150. [Google Scholar] [CrossRef]
- Blevins, D.G.; Dropkin, V.H.; Luedders, V.D. Macronutrient Uptake, Translocation, and Tissue Concentration of Soybeans Infested with the Soybean Cyst Nematode and Elemental Composition of Cysts Isolated from Roots1. J. Plant Nutr. 1995, 18, 579–591. [Google Scholar] [CrossRef]
- Hillnhütter, C.; Mahlein, A.K.; Sikora, R.A.; Oerke, E.C. Remote Sensing to Detect Plant Stress Induced by Heterodera Schachtii and Rhizoctonia Solani in Sugar Beet Fields. Field Crops Res. 2011, 122, 70–77. [Google Scholar] [CrossRef]
- Martins, G.D.; Galo, M.d.L.B.T.; Vieira, B.S. Detecting and Mapping Root-Knot Nematode Infection in Coffee Crop Using Remote Sensing Measurements. IEEE J. Sel. Top. Appl. Earth Obs. Remote Sens. 2017, 10, 5395–5403. [Google Scholar] [CrossRef]
- Wiesel, L.; Daniell, T.J.; King, D.; Neilson, R. Determination of the Optimal Soil Sample Size to Accurately Characterise Nematode Communities in Soil. Soil Biol. Biochem. 2015, 80, 89–91. [Google Scholar] [CrossRef]
- Garcia-Ruiz, F.; Sankaran, S.; Maja, J.M.; Lee, W.S.; Rasmussen, J.; Ehsani, R. Comparison of Two Aerial Imaging Platforms for Identification of Huanglongbing-Infected Citrus Trees. Comput. Electron. Agric. 2013, 91, 106–115. [Google Scholar] [CrossRef]
- Bajwa, S.G.; Rupe, J.C.; Mason, J. Soybean Disease Monitoring with Leaf Reflectance. Remote Sens. 2017, 9, 127. [Google Scholar] [CrossRef]
- Delalieux, S.; van Aardt, J.; Keulemans, W.; Schrevens, E.; Coppin, P. Detection of Biotic Stress (Venturia inaequalis) in Apple Trees Using Hyperspectral Data: Non-Parametric Statistical Approaches and Physiological Implications. Eur. J. Agron. 2007, 27, 130–143. [Google Scholar] [CrossRef]
- Steddom, K.; Heidel, G.; Jones, D.; Rush, C.M. Remote Detection of Rhizomania in Sugar Beets. Phytopathology 2003, 93, 720–726. [Google Scholar] [CrossRef] [PubMed]
- Adelabu, S.; Mutanga, O.; Adam, E. Evaluating the Impact of Red-Edge Band from Rapideye Image for Classifying Insect Defoliation Levels. ISPRS J. Photogramm. Remote Sens. 2014, 95, 34–41. [Google Scholar] [CrossRef]
- Rodriguez-Galiano, V.F.; Ghimire, B.; Rogan, J.; Chica-Olmo, M.; Rigol-Sanchez, J.P. An Assessment of the Effectiveness of a Random Forest Classifier for Land-Cover Classification. ISPRS J. Photogramm. Remote Sens. 2012, 67, 93–104. [Google Scholar] [CrossRef]
- Hothorn, T.; Hornik, K.; Zeileis, A. Unbiased Recursive Partitioning: A Conditional Inference Framework. J. Comput. Graph. Stat. 2006, 15, 651–674. [Google Scholar] [CrossRef]
- Yuan, Q.; Shen, H.; Li, T.; Li, Z.; Li, S.; Jiang, Y.; Xu, H.; Tan, W.; Yang, Q.; Wang, J.; et al. Deep Learning in Environmental Remote Sensing: Achievements and Challenges. Remote Sens. Environ. 2020, 241, 111716. [Google Scholar] [CrossRef]
- Susič, N.; Žibrat, U.; Širca, S.; Strajnar, P.; Razinger, J.; Knapič, M.; Vončina, A.; Urek, G.; Stare, B.G. Discrimination between Abiotic and Biotic Drought Stress in Tomatoes Using Hyperspectral Imaging. Sens. Actuators B Chem. 2018, 273, 842–852. [Google Scholar] [CrossRef]
- Jenkins, W.R. A Rapid Centrifugal-Flotation Technique for Separating Nematodes from Soil. Plant Dis. Report. 1964, 48, 692. [Google Scholar]
- Coolen, W.A.; D’herde, C.J.A.; D’herde, C.J. A Method for the Quantitative Extraction of Nematodes from Plant Tissue; State Agricultural Research Centre: Ghent, Belgium, 1972. [Google Scholar]
- Tihohod, D. Nematologia Agrícola, 2nd ed.; Funep: Jaboticabal, Brazil, 1993. [Google Scholar]
- Southey, J.F. Laboratory Methods for Work with Plant and Soil Nematodes; Technical bulletin 2; Her Majesty’s Stationery Office: London, UK, 1986; ISBN 0112427545. [Google Scholar]
- Shepherd, A.M. Extraction and Estimation of Cyst Nematodes. In Laboratory Methods for Work with Plant and Soil Nematodes; Her Majesty’s Stationery Office: London, UK, 1986; pp. 31–49. [Google Scholar]
- Rouse, R.W.H.; Haas, J.A.W.; Deering, D.W. Monitoring Vegetation Systems in the Great Plains with ERTS; NASA: Washington, DC, USA, 1974. [Google Scholar]
- Gitelson, A.A.; Kaufman, Y.J.; Merzlyak, M.N. Use of a Green Channel in Remote Sensing of Global Vegetation from EOS-MODIS. Remote Sens. Environ. 1996, 58, 289–298. [Google Scholar] [CrossRef]
- Jordan, C.F. Derivation of Leaf-Area Index from Quality of Light on the Forest Floor. Ecology 1969, 50, 663–666. [Google Scholar] [CrossRef]
- Roujean, J.; Breon, F. Estimating PAR Absorbed by Vegetation from Bidirectional Reflectance Measurements. Remote Sens. Environ. 1995, 51, 375–384. [Google Scholar] [CrossRef]
- Huete, A.R. A Soil-Adjusted Vegetation Index (SAVI). Remote Sens. Environ. 1988, 25, 295–309. [Google Scholar] [CrossRef]
- Barnes, E.M.; Clarke, T.R.; Richards, S.E.; Colaizzi, P.D.; Haberland, J.; Kostrzewski, M.; Waller, P.M.; Choi, C.Y.; Riley, E.; Thompson, T.E.; et al. Coincident Detection of Crop Water Stress, Nitrogen Status and Canopy Density Using Ground-Based Multispectral Data. In Proceedings of the Fifth International Conference on Precision Agriculture, Madison, WI, USA, 16–19 July 2000. [Google Scholar]
- Liu, H.Q.; Huete, A. A Feedback Based Modification of the NDVI to Minimize Canopy Background and Atmospheric Noise. IEEE Trans. Geosci. Remote Sens. 1995, 33, 457–465. [Google Scholar] [CrossRef]
- Gitelson, A.A.; Kaufman, Y.J.; Stark, R.; Rundquist, D. Novel Algorithms for Remote Estimation of Vegetation Fraction. Remote Sens. Environ. 2002, 80, 76–87. [Google Scholar] [CrossRef]
- Goel, N.S.; Qin, W. Influences of Canopy Architecture on Relationships between Various Vegetation Indices and LAI and FPAR: A Computer Simulation. Remote Sens. Rev. 1994, 10, 309–347. [Google Scholar] [CrossRef]
- Kinloch, R.A. Review: The Control of Nematodes Injurious to Soybean. Nematropica 1980, 141–153. [Google Scholar]
- Koenning, S.R.; Wrather, J.A.; Kirkpatrick, T.L.; Walker, N.R.; Starr, J.L.; Mueller, J.D. Plant-parasitic nematodes attacking cotton in the United States: Old and emerging production challenges. Plant Dis. 2004, 88, 100–113. [Google Scholar] [CrossRef]
- Dickerson, O.; Blake, J.; Lewis, S. Nematode Guidelines for South Carolina. In Clemson Extension Bulletin; Clemson University: Clemson, SC, USA, 2000. [Google Scholar]
- Liaw, A.; Wiener, M. Classification and Regression by RandomForest. R News 2002, 2, 18–22. [Google Scholar]
- Kuhn, M. Building predictive models in R using the caret package. J. Stat. Softw. 2008, 28, 1–26. [Google Scholar] [CrossRef]
- Nutter, F.W.; Tylka, G.L.; Guan, J.; Moreira, A.J.D.; Marett, C.C.; Rosburg, T.R.; Basart, J.P.; Chong, C.S. Use of Remote Sensing to Detect Soybean Cyst Nematode-Induced Plant Stress. J. Nematol. 2002, 34, 222–231. [Google Scholar]
- Haseeb, A.; Srivastava, N.K.; Pandey, R. The Influence of Meloidogyne incognita on Growth, Physiology, Nutrient Concentration and Alkaloid Yield of Hyoscy Amus Niger. Nematol. Mediterr. 1990, 18, 127–129. [Google Scholar]
- Behmann, J.; Steinrücken, J.; Plümer, L. Detection of Early Plant Stress Responses in Hyperspectral Images. ISPRS J. Photogramm. Remote Sens. 2014, 93, 98–111. [Google Scholar] [CrossRef]
- Sims, D.A.; Gamon, J.A. Relationships between Leaf Pigment Content and Spectral Reflectance across a Wide Range of Species, Leaf Structures and Developmental Stages. Remote Sens. Environ. 2002, 81, 337–354. [Google Scholar] [CrossRef]
- Chappelle, E.W.; McMurtrey, J.E.; Wood, F.M.; Newcomb, W.W. Laser-Induced Fluorescence of Green Plants 2: LIF Caused by Nutrient Deficiencies in Corn. Appl. Opt. 1984, 23, 139. [Google Scholar] [CrossRef]
- Curran, P.J.; Dungan, J.L.; Gholz, H.L. Exploring the Relationship between Reflectance Red Edge and Chlorophyll Content in Slash Pine. Tree Physiol. 1990, 7, 33–48. [Google Scholar] [CrossRef] [PubMed]
- Gitelson, A.A.; Merzlyak, M.N.; Chivkunova, O.B. Optical Properties and Nondestructive Estimation of Anthocyanin Content in Plant Leaves. Photochem. Photobiol. 2001, 74, 38–45. [Google Scholar] [CrossRef]
- Baret, F.; Guyot, G. Potentials and Limits of Vegetation Indices for LAI and APAR Assessment. Remote Sens. Environ. 1991, 35, 161–173. [Google Scholar] [CrossRef]
- Martins, G.D.; de Lourdes Bueno Trindade Galo, M. Caracterização Espectral Da Cana-de-Açúcar Infectada Por Nematoides e Migdolus Fryanus Por Espectrorradiometria de Campo. Boletim Ciências Geodésicas 2015, 21, 783–796. [Google Scholar] [CrossRef]


Publisher’s Note: MDPI stays neutral with regard to jurisdictional claims in published maps and institutional affiliations. |
© 2022 by the authors. Licensee MDPI, Basel, Switzerland. This article is an open access article distributed under the terms and conditions of the Creative Commons Attribution (CC BY) license (https://creativecommons.org/licenses/by/4.0/).