Abstract
A simple, sensitive, and rapid multi-residue analytical method was developed based on gas chromatography-tandem mass spectrometry (GC–MS/MS) and used to determine 77 multiclass pesticides in red ginseng. Samples were extracted and purified via a modified QuEChERS method. The calibration curves were in the range of 5 to 200 ng mL−1. The limits of detection (LODs) of the method were from 0.08 to 4.0 μg kg−1 and limits of quantification (LOQs) were in the range of 0.2–12.0 μg kg−1. The average recoveries of the method ranged from 61% to 133.9% at two spiked levels of 20 and 100 μg kg−1 in red ginseng samples, with relative standard deviations (RSDs) of 0.2% to 14.9%.
1. Introduction
For centuries, ginseng has been one of the most popular herbs as well as a widely used nutritional supplement with high commercial value in domestic and intercountry markets [1,2]. Ginseng has a wide range of pharmacological effects as an herb that can act not only on patients but also on healthy people, even as an ingredient in teas and cosmetics [3,4]. It currently has more than 2000 years of history in China, Korea, and Japan and has gained popularity in the United States, Canada, and the European Union (EU) in the last 20 years [5]. Ginseng can be processed in different ways, such as drying and steaming to obtain different edible ginsengs, which could be classified as white ginseng (WG), red ginseng (RG), and black ginseng (BG) [6]. BG is the type that has been recently developed based on a new processing method that involves multiple steaming and drying in the sun [6]. RG and WG are traditionally and commonly used ginseng in China [6,7]. RG is a reddish-brown ginseng made by prolonged steaming and drying [8]. Compared to WG, RG has superior antioxidant and immunomodulatory properties and also prevents chronic diseases related to oxidative stress, and exhibits antitumor effects on lung cancer cells [9,10].
Analysis of pesticide residues in food is mostly performed in unprocessed agricultural products and based on established maximum residue limits (MRLs) to assess the level of pesticide residues in food and perform risk assessment appropriately. However, some foods require some processing before they can be placed on the market for sale to consumers, such as washing, core or peel, drying, concentrating, drying, and various other methods [11]. It is important to note that the number of pesticide residues on processed foods may be altered by physicochemical or biochemical reactions that occur during processing compared to the original crop. It is widely believed that processing reduces pesticide residues on food, but due to the different physicochemical properties of individual pesticides and the characteristics of the raw materials themselves, as well as the different conditions involved in different processing methods, processing actually has different effects on the residues of various types of pesticides on different raw materials, and may even increase the number of pesticide residues [11,12,13]. Although fresh ginseng is widely distributed in different regions, it is often processed into RG, dried ginseng, and other forms that can be easily stored for consumers or exported. Considering the effect of food processing on the number of pesticide residues, and the free trade agreements involved in exports and the MRLs of pesticides on food in different countries, it is essential to detect and analyze the pesticide residues on the processed RG in order to reduce the impact of pesticide residues on consumers and imports and exports [14,15].
In recent years, the study of ginseng has attracted more and more attention from scholars, especially RG. Lee et al. developed a method for the determination of 32 pesticide residues in ginseng products, including RG, using GC-MS/MS [16]. Kuang et al. developed a UHPLC-ESI-MS/MS-based method for the determination of 10 mycotoxins and 29 pesticides in ginseng and used it for the detection of pesticides in RG samples collected from the market [3]. Zhu et al. conducted a comparative analysis of ginsenosides and oligosaccharides in WG, RG, and BG, and the results showed that RG had the largest variety of ginsenosides and the maltose content was 25.9 and 3.4 times higher than that of WG and BG, respectively [17]. At present, compared with other pesticide detection methods, there are relatively few studies on the detection of pesticides in red ginseng.
Both gas chromatography (GC) and liquid chromatography (LC) can also be used for the detection of pesticide residues in ginseng. Gas chromatography has high sensitivity, resolution, and speed but suffers from thermal instability, limitations in the detection of volatile compounds, and long analysis time. Liquid chromatography has the advantages of simple and wide use, high precision, and accuracy but has the disadvantages of long analysis time and relatively high cost [18]. Advanced analytical methods occupy an important place in the analysis of pesticide residues in food and the environment and can achieve the goal of ensuring food safety and environmental safety. Liquid chromatography-tandem mass spectrometry with QqQ MS system is one of the important developments in the field of pesticide residue analysis, which was applied in this field in the early 1990s, while GC-QqQ MS/MS was applied to pesticide residue analysis about 15 years later. Compared with other types of mass spectrometry, such as GC-IT MS(/MS) (gas chromatography ion trap mass spectrometry), QqQ has lower matrix effects and is able to sample more compounds at one time, and no significant difference in sensitivity [19,20]. Therefore, GC-QqQ MS/MS is commonly used for the detection of pesticide residues in samples with more complex matrices, especially for the detection of multiple pesticide residues.
In this study, a simple and rapid method for the determination of 77 pesticide residues in RG was established by combining an improved QuEChERS with GC/MS-MS. To our knowledge, this is the first report of establishing a simple and time-saving method to analyze 77 pesticide residues in RG. Therefore, our innovation is mainly in the application. In addition, the general feasibility of the developed method was verified and applied to the actual sample detection, providing a technical basis for the accurate determination of 77 pesticides in RG and also for the establishment of methods for the detection of pesticide residues in other herbal medicines.
2. Materials and Methods
2.1. Reagents, Chemicals and Materials
A total of 77 pesticide standards with purity > 95% were purchased from Dr. Ehrenstorfer Company (Augsburg, Germany), DIKMA technologies Co. Ltd. (Beijing, China), and Merck Companies (Darmstadt, Germany). HPLC-grade acetonitrile was supplied by Mreda Technology, Inc. (Beijing, China). All the other solvents and chemicals used in the experiment were analytical grade and were purchased from Beijing Chemical Works (Beijing, China) and CNW Technologies GmbH (Duesseldorf, Germany). Magnesium sulfate, PSA (primary secondary amine), and C18 were purchased from Agela Technologies Inc. (Newark, DE, USA).
2.2. Sample Preparation
200 g of the ginseng samples were homogenized in a grinder, then pulverized to 425 μm sieve and stored in a polyethylene bottle. Five grams of ginseng sample was weighed into a 50 mL centrifuge tube, then 10 mL of water was added. Then the mixture was vortexed well and settled for 30 min. Acetonitrile (15 mL), anhydrous magnesium sulfate (6 g), sodium acetate (1.5 g), and ceramic proton (1 grain) were then added. The mixture was then vigorously vortexed for 1 min and centrifuged for 5 min at 4000 r/min. 8 mL supernatant was added to a 15 mL microcentrifuge tube (the tubes contained 1200 mg magnesium sulfate, 400 mg PSA, and 400 mg C18) vortexed for1 min and centrifuged for 5 min at 4000 r/min. 3 mL supernatant was added to a 10 mL tube and blow nitrogen to near dry in a water bath at 40 °C, ethyl acetate(1 mL) was added and passed through a 0.22-μm membrane filter to determination.
2.3. Analytical Instruments and Conditions
GC-MS/MS analysis was conducted using a TRACE 1300 Series gas chromatograph tandem TSQ Triple Quadrupole, equipped with an Agilent DB-1701 column (30 m long, 0.25 mm i.d., 0.25 µm film thickness). For GC, the initial temperature of the column was set at 100 °C (1 min), followed by being increased to 180 °C at 10 °C/min and held for 10 min, and finally to 280 °C at 20 °C/min and held for 20 min. For the tandem mass spectrometer, the ion source temperature and transition line temperature were 300 °C and 280 °C, respectively. The ionization energy was 70 eV, and the carrier gas was helium. The multiple reaction monitoring mode (MRM) was used to scan the ions, and the retention time, ion transitions, and collision energy were obtained.
2.4. Calibration, Limits of Detection and Quantification
77 pesticide solutions were prepared into 1000 mg L−1 stock solution with acetone and stored at −20 °C. The calibration curves were in the range of 5 to 200 ng mL−1. The mixed standard solution and the mixed matrix standard solution were prepared with acetone and pesticide-free RG solution. The matrix-matched calibration curve was obtained by diluting mixed matrix standard solution to different concentrations between 20 and 100 μg kg−1 in pesticide-free RG extract solution. The standard curve was plotted against the concentration (mg L−1) with the peak area of each component, and the correlation coefficient was calculated.
2.5. Recovery Assays
Based on the sample preparation procedure, the fortified recovery experiment was carried out at 20 and 100 μg kg−1 pesticide levels. Each spiked level was repeated five times, and the average recoveries and RSDs were calculated. According to the Guideline for the testing of pesticide residues in crops in China, the recoveries should be in the range of 70–120%, with the relative standard deviations not higher than 20%, when the fortified levels were between 0.01 and 0.1 mg kg−1.
3. Results
3.1. Optimisation of GC-MS/MS
Optimization of instrumental methods to achieve the detection of target compounds at low concentrations is one of the important steps in pesticide residue analysis. In this study, GC-MS/MS was used to meet the detection requirements, and method optimization was performed. The MS spectra were first obtained by full scan mode, followed by the selection of appropriate precursor ions and scanning of the product ions at different collision energies (CE) to finally determine the retention time, transition pairs, and CE for each pesticide. This method is more accurate, sensitive, and reproducible than GC and LC. The results obtained are given in Table 1. The total ion chromatogram (TIC) of 77 pesticide standards and the total ion chromatogram (TIC) of 77 pesticides in red ginseng were shown in Figure 1 and Figure 2, respectively.

Table 1.
The retention time, MRM transitions for each pesticide.
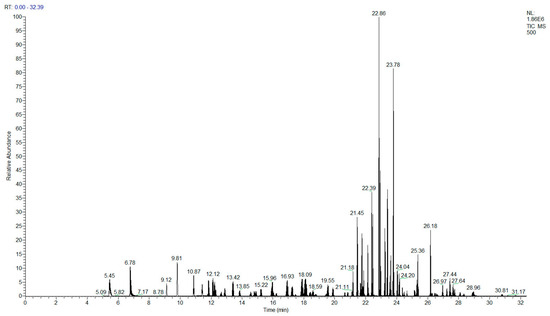
Figure 1.
Total ion chromatogram (TIC) of 77 pesticide standards.
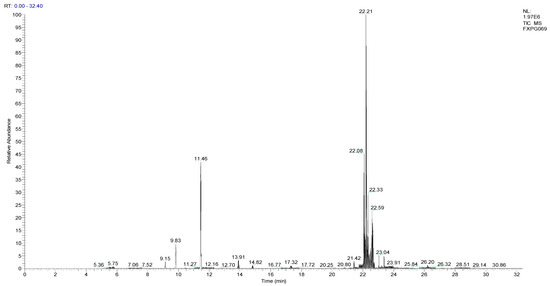
Figure 2.
Total ion chromatogram (TIC) of 77 pesticides in red ginseng.
3.2. Linearity, Limits of Detection (LODs) and Limits of Quantification (LOQs)
Both external and internal standard methods are commonly used in pesticide residue analysis, and each has advantages and disadvantages. matrix external standard method was used in this study, which could meet the requirements of residue analysis methods, while also avoiding the disadvantages of the internal standard being more difficult to obtain and cumbersome steps. A matrix-matched standard curve including at least 5 points from 5 to 200 ng mL−1 was prepared in pesticide-free RG solution to reduce the effect of the matrix in RG on the determination. The correlation coefficients of 77 pesticides were shown in Table 2. The correlation coefficients (R2) for 77 pesticides ranged from 0.9901 to 0.9997, indicating good linearity for 77 pesticides in RG. Instrumental analyses of the target compounds were conducted 3 and 10 times to obtain the signal-to-noise ratio for the LODs and LOQs, respectively. In this study, the LODs and LOQs were determined from the mixed matrix-matched curves. The results were shown in Table 2. The LODs and LOQs of 77 pesticides ranged from 0.08 to 4.0 μg kg−1 and 0.2 to 12.0 μg kg−1, respectively, indicating that the LODs and LOQs in this study were much lower than the maximum residue limits (MRLs) of European Union. Therefore, the established GC/MS/MS analysis method is suitable for routine analysis of pesticide residues in RG.
Table 2.
The mean recovery, SD, LOD and LOQ of each pesticide.
3.3. Recoveries
Due to the complexity of the ginseng matrix, many other chemical substances are inevitably extracted during the extraction process, causing interference with the analysis of pesticide residue detection. Therefore, to ensure accuracy and precision, a modified QuEChERS method combined with GC/MS/MS analysis was applied in this study. When the solvent blank was analyzed, no signal interference was shown. In the recovery test, the recoveries of 77 pesticides ranged from 61% to 133.9% with relative standard deviations (SDs) of 0.2% to 14.9% when the spiked levels were 20 and 100 ng mL−1. Among them, the recoveries of propamocarb, chlorothalonil, and tricyclazole were in the range of 61% to 69.2% at both spiked levels. The recoveries of pyrimethanil were greater than 120% at both spiked levels, and the recoveries of dicofol and fenitrothion at 20 ng mL−1 were greater than 120%. In general, the recoveries and RSDs obtained met the criteria for pesticide residue analysis and were suitable for pesticide residue analysis.
4. Conclusions
In this study, a reliable GC-MS/MS method combined with a modified QuEChERS method was developed for the simultaneous determination of 77 pesticide residues in RG. The GC-MS/MS method was optimized and performed to accurately identify and determine the pesticides in RG with high accuracy and precision by reducing the matrix interference to a certain extent. The modified QuEChERS method was able to successfully extract 77 different types of pesticides in RG simultaneously, and the method was simple, rapid, and the recoveries and relative standard deviations met the requirements of pesticide residue analysis and could be applied to the detection of actual samples. The present method is more mature and most of the pesticide assays are done with LC-MS/MS, while the new GC-MS/MS method is used in this paper. Not only has that, for red ginseng, the addition of water in the pretreatment had a better recovery for the sweetened red ginseng. This method has been used by us for risk assessment and screening to validate the actual samples, so the method is stable and efficient. Therefore, the developed method contributes to the progress of multi-residue analysis of pesticides in RG and is also applicable to the regulatory analysis of pesticides in RG and can be applied to the analytical detection of pesticide residues in WG and BG or even vegetables in an attempt.
Author Contributions
Conceptualization, Z.L. (Zhongbin Lu) and S.L.; methodology, X.X., S.W., S.H. and Z.L. (Ziqiang Li); validation, X.X., S.W., Z.L. (Zhongbin Lu) and S.L.; formal analysis, X.X. and S.W.; data curation, X.X., S.W., S.H., Z.L. (Ziqiang Li) and S.L.; writing—original draft preparation, X.X. and S.W.; writing—review and editing, Z.L. (Zhongbin Lu) and S.L. All authors have read and agreed to the published version of the manuscript.
Funding
This research was funded by Jilin Scientific and Technological Development Program (CN), grant number 20200703019ZP and “Thirteenth Five-Year” Science and Technology Research Project of Jilin Provincial Department of Education, grant number JJKH20200346KJ.
Data Availability Statement
Not applicable.
Conflicts of Interest
The authors declare no conflict of interest.
References
- Jin, S.; Jeon, J.H.; Lee, S.; Kang, W.Y.; Seong, S.J.; Yoon, Y.R.; Choi, M.K.; Song, I.S. Detection of 13 ginsenosides (Rb1, Rb2, Rc, Rd, Re, Rf, Rg1, Rg3, Rh2, F1, compound K, 20(S)-protopanaxadiol, and 20(S)-protopanaxatriol) in human plasma and application of the analytical method to human pharma cokinetic studies following two week-repeated administration of red ginseng extract. Molecules 2019, 24, 2618. [Google Scholar]
- Wang, B.Y.; Zhu, C.H.; Yang, X.Q.; Hu, M.; Xu, T.T.; Wang, X.Y.; Yang, S.; Yang, Y.B.; Ding, Z.T. Inducing Intermediates in Biotransformation of Natural Polyacetylene and A Novel Spiro-γ-Lactone from Red Ginseng by Solid Co-Culture of Two Gut Chaetomium globosum and The Potential Bioactivity Modification by Oxidative Metabolism. Molecules 2020, 25, 1216. [Google Scholar] [CrossRef] [PubMed]
- Kuang, Y.; Qiu, F.; Kong, W.; Luo, J.; Cheng, H.; Yang, M. Simultaneous quantification of mycotoxins and pesticide residues in ginseng with one-step extraction using ultra-high performance liquid chromatography–electrospray ionization tandem mass spectrometry. J. Chromatogr. B 2013, 939, 98–107. [Google Scholar] [CrossRef]
- Kim, Y.H.; Park, H.R.; Cha, S.Y.; Lee, S.H.; Jo, J.W.; Go, J.N.; Lee, K.H.; Lee, S.Y.; Shin, S.S. Effect of red ginseng NaturalGEL on skin aging. J. Ginseng Res. 2020, 44, 115–122. [Google Scholar] [CrossRef]
- Ye, L.; Xue, Y.; Wang, Y.; Qi, J.; Xiao, T. Identification of ginseng root using quantitative X-ray microtomography. J. Ginseng Res. 2017, 41, 290–297. [Google Scholar] [CrossRef][Green Version]
- Guo, N.; Zhu, L.; Song, J.; Dou, D. A new simple and fast approach to analyze chemical composition on white, red, and black ginseng. Ind. Crop. Prod. 2019, 134, 185–194. [Google Scholar] [CrossRef]
- Zhang, H.; Jiang, J.M.; Zheng, D.; Yuan, M.; Wang, Z.Y.; Zhang, H.M.; Zheng, C.W.; Xiao, L.B.; Xu, H.X. A multidimensional analytical approach based on time-decoupled online comprehensive two-dimensional liquid chromatography coupled with ion mobility quadrupole time-of-flight mass spectrometry for the analysis of ginsenosides from white and red ginsengs. J. Pharm. Biomed. Anal. 2019, 163, 24–33. [Google Scholar] [CrossRef] [PubMed]
- Lee, M.Y.; Kim, B.A.; Yang, J.C. Effects of extracts derived from red ginseng residue on antioxidant activity and elastase inhibition. J. Kor. Oil. Chem. Soc. 2016, 33, 658–666. [Google Scholar] [CrossRef]
- He, M.; Huang, X.; Liu, S.; Guo, C.; Xie, Y.; Meijer, A.H.; Wang, M. The difference between white and red ginseng: Variations in ginsenosides and immunomodulation. Planta Med. 2018, 84, 845–854. [Google Scholar] [CrossRef] [PubMed]
- Lee, Y.M.; Yoon, H.; Park, H.M.; Song, B.C.; Yeum, K.J. Implications of red panax ginseng in oxidative stress associated chronic diseases. J. Ginseng Res. 2017, 41, 113–119. [Google Scholar] [CrossRef] [PubMed]
- Amvrazi, E.G. Fate of pesticide residues on raw agricultural crops after postharvest storage and food processing to edible portions. In Pesticides-Formulations, Effects, Fate; IntechOpen: London, UK, 2011. [Google Scholar]
- Alister, C.; Araya, M.; Becerra, K.; Volosky, C.; Saavedra, J.; Kogan, M. Industrial prune processing and its effect on pesticide residue concentrations. Food Chem. 2018, 268, 264–270. [Google Scholar] [CrossRef] [PubMed]
- Yigit, N.; Velioglu, Y.S. Effects of processing and storage on pesticide residues in foods. Crit. Rev. Food Sci. Nutr. 2020, 60, 3622–3641. [Google Scholar] [CrossRef] [PubMed]
- Noh, H.H.; Shin, H.W.; Kim, D.J.; Lee, J.W.; Jo, S.H.; Kim, D.; Kyung, K.S. Effect of processing on residual buprofezin levels in ginseng products. Int. J. Environ. Res. Public Health 2021, 18, 471. [Google Scholar] [CrossRef] [PubMed]
- Wu, P.; Gu, M.; Wang, Y.; Xue, J.; Wu, X. Transfer of organochlorine pesticide residues during household and industrial processing of ginseng. J. Food Qual. 2020, 2020, 5946078. [Google Scholar] [CrossRef]
- Lee, K.G.; Jo, E.K. Multiresidue pesticide analysis in Korean ginseng by gas chromatography–triple quadrupole tandem mass spectrometry. Food Chem. 2012, 134, 2497–2503. [Google Scholar] [CrossRef] [PubMed]
- Zhu, L.; Luan, X.; Dou, D.; Huang, L. Comparative analysis of Ginsenosides and oligosaccharides in white ginseng (WG), red ginseng (RG) and black ginseng (BG). J. Chromatogr. Sci. 2019, 57, 403–410. [Google Scholar] [CrossRef] [PubMed]
- Qi, L.W.; Wang, C.Z.; Yuan, C.S. Isolation and analysis of ginseng: Advances and challenges. Nat. Prod. Rep. 2011, 28, 467–495. [Google Scholar] [CrossRef] [PubMed]
- Hernandez, F.; Cervera, M.I.; Portolés, T.; Beltrán, J.; Pitarch, E. The role of GC-MS/MS with triple quadrupole in pesticide residue analysis in food and the environment. Anal. Methods 2013, 5, 5875–5894. [Google Scholar] [CrossRef]
- Mezcua, M.; Ferrer, C.; García-Reyes, J.F.; Martínez-Bueno, M.J.; Sigrist, M.; Fernández-Alba, A.R. Analyses of selected non-authorized insecticides in peppers by gas chromatography/mass spectrometry and gas chromatography/tandem mass spectrometry. Food Chem. 2009, 112, 221–225. [Google Scholar] [CrossRef]


Publisher’s Note: MDPI stays neutral with regard to jurisdictional claims in published maps and institutional affiliations. |
© 2022 by the authors. Licensee MDPI, Basel, Switzerland. This article is an open access article distributed under the terms and conditions of the Creative Commons Attribution (CC BY) license (https://creativecommons.org/licenses/by/4.0/).