Article

The Key Regulators and Metabolic Intermediates of Lignin Response to Low Temperatures Revealed by Transcript and Targeted Metabolic Profiling Analysis in Poplar

State Key Laboratory of Biobased Material and Green Papermaking, School of Bioengineering, Qilu University of Technology, Jinan 250353, China
*
Author to whom correspondence should be addressed.
Agronomy 2022, 12(10), 2506; https://doi.org/10.3390/agronomy12102506
Submission received: 20 July 2022 / Revised: 1 October 2022 / Accepted: 7 October 2022 / Published: 14 October 2022

Abstract

:
Cold stress restricts the growth and development of plants. Lignin plays an important role in stress resistance. However, there are few studies on lignin mechanisms regulation under low-temperature stress. In this study, the contents of both acid-soluble and -insoluble lignin were reduced after a short period of cold treatment. A targeted metabolomics analysis showed that the contents of caffeate, ferulic acid, coniferaldehyde, and p-coumaraldehyde decreased after cold stress, while the contents of L-phenylalanine and sinapaldehyde increased. The C3′H (p-coumaroylshikimate 3-hydroxylase) and COMT (caffeic acid O-methyltransferase) families, which catalyze the formation of caffeate and coniferaldehyde, were analyzed. Among them, the transcriptional levels of PtrC3′H1, PtrCOMTL4, and PtrCOMT1 were positively correlated with the decreased lignin after cold stimulation. The lignin-related transcription factor PtrMYBs, such as PtrMYB021, PtrMYB074, PtrMYB125/85, and PtrMYB103/46, were clearly induced by cold stress. The reverse transcription-quantitative real-time polymerase chain reaction (RT-qPCR) further verified that the level of transcription of key genes was consistent with the transcriptomic data. The identified key genes and metabolic intermediates in lignin synthesis provide a foundation for the functional characterization of the molecular mechanism of lignin biosynthesis under cold stress, which should help to efficiently utilize lignin in forest resources.

1. Introduction

In recent years, as the global climate has been changing, extreme weather frequently has been occurring. Low temperature, a global natural disaster, seriously hinders the normal growth and development of plants, restricts the geographical distribution of vegetation, and affects agricultural production [1,2,3]. Improving plant stress resistance is critical to agricultural production and environmental sustainability. Crops with poor stress resistance consume more water and fertilizer and are deleteriously impacted by changes in the environment [4]. It is of substantial theoretical significance and practical value to study the molecular mechanism of plant responses to low-temperature stress.
Lignin, which is a vital component in the cell wall of lignified tissues, plays an important role in the mechanical strength, movement of water and resistance to abiotic stress in plants [5]. In addition, since lignin metabolism is induced by different environmental factors, it exists as a barrier to protect plants against pests, diseases and help the cells manage their water [6]. However, the presence of lignin in trees is an obstacle to the utilization of forest resources for its non-degradable characteristic [7]. The study of the effect of cold stress on the lignin pathway is important for the efficient application of natural resources and the promotion of agricultural and industrial development.
Lignin is generally recognized to be composed of the three monomers syringyl (S), guaiacyl (G), and p-hydroxyphenyl (H), which are polymerized by sinapyl alcohol, p-coumaryl, and hydroxycinnamyl alcohols, respectively [5]. In addition, various other aromatic monomers, such as hydroxycinnamyl alcohols, hydroxyarylpropanols, hydroxycinnamyl esters, hydroxybenzoic acids, hydroxycinnamic acids, hydroxycinnamides, hydroxycinnamaldehydes, hydroxybenzaldehydes, hydroxycinnamate esters, hydroxystilbenes, and the flavone tricin, also participate in the process of lignin synthesis [5]. The lignin monomers are primarily synthesized through phenylpropanoid metabolic pathways [5]. There are many enzymes that promote the synthesis of intermediates in lignin metabolism and genes that encode these enzymes, such as phenylalanine ammonia-lyase (PAL), cinnamate-4-hydroxylase (C4H), 4-coumarate-CoA ligase (4CL), p-coumarate 3-hydroxylase (C3H), hydroxycinnamoyl-CoA shikimate/quinate hydroxycinnamoyl transferase (HCT), caffeoyl-CoA O-methyltransferase (CCoAOMT), cinnamoyl-CoA reductase (CCR), ferulate 5-hydroxylase (F5H), caffeic acid O-methyltransferase (COMT), cinnamyl alcohol dehydrogenase (CAD), laccase (LAC) and peroxidase (POD), involved in the process of lignin synthesis [5]. Any changes in the intermediates of lignin and structural genes will affect the composition of lignin monomer and the content of total lignin.
C3′H and COMT are two vital structural genes in lignin synthesis [5]. C3′H is a cytochrome P450 monooxygenase that catalyzes the conversion of p-coumaric acid to caffeic acid and p-coumaroyl shikimate to caffeoyl shikimate. The level of its expression directly affects the content of lignin, H units and the S/G ratio [8]. In Arabidopsis, an early bioinformatics analysis isolated a CYP98A3 gene, which may encode the C3′H protein [9]. Subsequent experiments isolated an REF8 (REDUCED EPIDERMAL FLUORESCENCE 8, REF8) gene, which encoded C3′H and belonged to the CYP98A3 gene family [10]. Interfering with the expression of C3′H can significantly reduce the content of lignin, whereas the content of H type lignin evidently increased in the transgenic plants P. alba × P. grandidentata [11,12].
COMT is involved in the lignin biosynthetic pathway through the methylation of acids, aldehydes, and alcohols that contain caffeoyl and 5-hydroxyferuloyl moieties. When the expression of COMT1 in ryegrass was disturbed, the external phenotype and biomass of ryegrass did not change, but the content and composition of lignin changed, which improved the economic value of ryegrass [13]. In addition, the change in expression of COMT in different plants influenced the content of S-type lignin [14].
The genes that encode the synthesis of lignin intermediate metabolites are primarily regulated by upstream transcription factors that are principally involved in the NAC-MYB transcriptional regulatory network [7,15,16]. In the network, NACs that include NST1, NST2, and NST3, also designated SND1, and VNDs are first-level master switches in lignin regulation [17]. The MYB transcription factor that is downstream of NAC serves as a secondary regulatory hub and influences the expression of some structural genes, which change the lignin content and affect plant development [18,19]. Some MYBs, such as PtrMYB021 and PtrMYB074, participate in the formation of wood xylem [20]. Some others, such as HOS10, OsMYB3R-2, and MdMYB23, are also involved in the regulation of plant growth and development caused by low temperature [21,22]. However, only a few of the MYBs related to lignin have been reported to be involved in the response to low temperature.
Poplar, an important forest resource, serves as a model system to study the basic biological characters of trees in addition to its application in shelter forests, beautifying roads and papermaking [23]. Low temperature limits the distribution and level of lignin in poplar [24]. The molecular mechanisms that reveal the effect of low temperature on lignin synthesis and metabolism merits additional research. In this study, the key regulatory factors and metabolic intermediates of lignin in poplar under low-temperature stress were studied using transcriptional and targeted metabolic profiling analyses. We focused on the important metabolic intermediates, such as caffeate and coniferaldehyde, transcription factors such as PtrMYBs, and structural genes (PtrC3′H1 and PtrCOMTs) that are involved in lignin metabolism and studied their changes under low-temperature stress. This study should provide candidate genes related to lignin synthesis and metabolism that respond to cold stress and provide theoretical guidance for the cultivation of trees for agriculture, forestry, and industrial development.

2. Materials and Methods

2.1. Plant Material and Treatments

For this study, “84k” poplar (Populus alba × Populus glandulosa) tissue culture plantlets were kindly provided by Dr. Lingli Li (Northwest A&F University, Xianyang, China) and grown in a tissue culture flask under sterile conditions, at 25 °C, in a light incubator at 16/8 h long-day conditions in the tissue culture room of Qilu University of Technology (Jinan, China). Tissue culture plantlets were grown for approximately 6 weeks and then placed in an incubator, at 4 °C, and sampled at 0, 6, 12, 24, 48, and 72 h. Normal temperature plants (25 °C) were sampled at 0 h and 72 h after treatment, respectively. All the treated samples were immediately frozen in liquid nitrogen and stored at −80 °C for further study. This study complies with relevant institutional, national, and international guidelines. Three biological and technical replicates were conducted.

2.2. Extraction of Acid-Soluble and Acid-Insoluble Lignin and the Measurement of Their Contents

The Klason method and UV spectrophotometry were used to measure acid-soluble and acid-insoluble lignin. A sample was first dried at 100 °C and then sieved through 40 mesh. A 0.5 g sample (M0) was placed in a 25 mL beaker with a small glass bar, and 5 mL 72% sulfuric acid was added and then hydrolyzed, at 30 °C, for 1 h after evenly stirring. The hydrolysate was transferred to a 300 mL triangulated bottle; 140 mL distilled water was added; the sulfuric acid was diluted to 4% then sealed, and sterilized for hydrolysis at 121 °C, for 1 h with autoclave. After completion, a sand-core quartz crucible was used to filter the hydrolysate. An appropriate amount of filtered hydrolysate was diluted 10-fold with 4% sulfuric acid, and the absorbance was measured at A320 using the following formula to calculate the acid-soluble lignin. Among them, n is the dilution factor that is 10, and ɛ is the absorptivity of Populus at A320, which is 25 [25].
The sample from sand-core quartz crucible was dried at 105 °C for 3–6 h and weighed as M1. The samples were treated at 535 °C for 6–7 h in a muff furnace. After cooling, the samples were weighed as M2. Each sample of acid-insoluble lignin was sampled three times, and the average value is provided.
Acid-soluble lignin (%) = A320 × 0.145 × n/ɛ/M0 × 100
Acid-insoluble lignin (%) = (M1 − M2)/M0 × 100
Lignin (%) = Acid soluble lignin (%) + Acid insoluble lignin (%)

2.3. Measurement of the Intermediate Metabolites of Lignin

The extracted sample was processed as follows: after vacuum freeze-drying, the biological samples were ground (30 Hz, 1.5 min) to a powder by a grinding machine. A total of 100 mg powder was weighed and dissolved in 0.6 mL extract (70% of methanol). The dissolved samples were incubated overnight, at 4 °C, and swirled six times during this period to improve the extraction rate. After centrifugation at 10,000× g for 10 min, the supernatant was extracted, and the samples were filtered through a 0.22 m pore. The samples were then stored in injection bottles for UPLC-MS/MS analysis.
An UPLC-MS/MS analysis (Metware Company, Wuhan, China) was conducted. The liquid-phase conditions primarily included a chromatographic column (Waters ACQUITY UPLC HSS T3 C18 1.8 m, 2.1 mm × 100 mm; Milford, MA, USA). The mobile phase included the A phase, which was ultrapure water, and the B phase was acetonitrile. The elution gradient was as follows: B-phase ratio 5% at 0 min; B-phase ratio linearly increased to 95% within 10.0 min, and was maintained at 95% 1 min, 11.00–11.10 min; the B-phase ratio decreased to 5%, and was balanced at 5% to 14 min. The flow rate was 0.35 mL/min with a column temperature of 40 °C, and 4 μL was injected.
The mass spectrometry conditions and parameters were as follows: the temperature of electrospray ionized (ESI) source was 550 °C; the mass spectrometry voltage was 5500 V; the CURTAIN gas was 30 PSI; the collisionally activated dissociation was high, and the decluttering potential was optimized and scanned with collision energy. Three biological and technical replications were conducted.

2.4. Transcriptome Sequencing

Three replicates per sample (0, 6, 12, 24, 48, and 72 h) and a total of 18 poplar stem samples were used to construct the library, which was collected from treated poplar tissue culture plantlets and immediately frozen in liquid nitrogen and stored at −80 °C. A Plant RNA kit (Tiangen Company, Beijing, China) was used to extract total RNA according to the manufacturer’s instructions. A total amount of 1 μg RNA per sample was used to prepare the library with insert sizes of 350 bp and sequenced on a NovaSeq 6000 (Illumina, San Diego, CA, USA). The RNA concentration and purity were measured using a NanoDrop 2000 (Thermo Fisher Scientific, Waltham, MA, USA). The RNA integrity was assessed using an RNA Nano 6000 Assay Kit of the Agilent Bioanalyzer 2100 system (Agilent Technologies, Santa Clara, CA, USA). An mRNA-Seq Sample Preparation Kit (Cat # RS-930-1001, Illumina Inc., San Diego, CA, USA) was used to construct the mRNA-seq library. The RNA-seq was performed as paired-end, and the analysis was conducted as previously described [26]. Three biological and technical replicates were conducted.

2.5. Data Analysis

Raw data (raw reads) of the fast format were first processed using in-house Perl scripts. In this step, clean data (clean reads) were obtained by removing reads that contained an adapter, reads that contained ploy-N, and low-quality reads from the raw data. Simultaneously, the Q20, Q30, GC-content and sequence duplication level of the clean data were calculated. All the downstream analyses were based on clean data of high quality. The adaptor sequences and low-quality sequence reads were removed from the data sets. Raw sequences were transformed into clean reads after data processing. These clean reads were then mapped to the reference genome sequence. Only reads with a perfect match or one mismatch were further analyzed and annotated based on the reference genome. HISAT2 tools were used to map the reference genome.
The levels of gene expression were estimated by the FKPM fragments mapped. A differential expression analysis of two samples was performed using the edge R. FDR < 0.01 and Fold Change ≥2 was established as the threshold for significantly differential expression. The DEGs were performed using the edge R. FDR < 0.01 and Fold Change ≥2 was established as the threshold for significantly differential expression.
The gene function was annotated based on the following databases: Nr (NCBI non-redundant protein sequences); Nt (NCBI non-redundant nucleotide sequences); Pfam (Protein family); KOG/COG (Clusters of Orthologous Groups of proteins); Swiss-Prot (a manually annotated and reviewed protein sequence database); KO (KEGG Ortholog database); and GO. The GO enrichment analysis of the DEGs was implemented by the goseq R packages based on Wallenius non-central hyper-geometric distribution, which can adjust for gene length bias in DEGs [27]. KOBAS software was used to test the statistical enrichment of differential expression genes in KEGG pathways [28]. P. trichocarpa V3.0 was used as the reference genome (https://phytozome.jgi.doe.gov/pz/portal.html, accessed on 12 September 2020).

2.6. RT-qPCR

RT-qPCR was utilized to detect the transcriptional level of the NACs, MYBs, COMTs and C3′H in response to cold temperature. PtrACTIN was used as the control [29]. The primers were designed using the website (https://www.ncbi.nlm.nih.gov/tools/primer-blast/, accessed on 6 October 2022) to guarantee its effectiveness and specificity. The length of the amplified fragments of the two primers ranged from 200 bp to 300 bp, and the GC base content ranged from 40% to 60%. RT-qPCR was executed as previously described [30]. The RNA was extracted, and the A260/A280 was between 1.8 and 2.0. The integrity of RNA was assessed using an RNA Nano 6000 Assay Kit of an Agilent Bioanalyzer 2100 system (Agilent Technologies). A PrimeScript™RT Reagent Kit (TaKaRa Company, Beijing, Japan) with gDNA Eraser was used to synthesis cDNA from RNA, and qPCR was applied to analysis the levels of gene expression. The setup procedure was as follows: pre-denaturation at 95 °C for 10 min, denaturation at 95 °C for 15 s, annealing at 56 °C for 15 s, and elongation at 65 °C for 10 s for a total of 40 cycles. The fluorescence signal was obtained at the extension stage of each cycle. The data were analyzed using the 2−ΔΔCt method. All the primers used in this experiment are shown in Supplemental Table S1. Three biological and technical replications were conducted.

3. Results

3.1. Effect of Low-Temperature Treatment on the Content of Lignin in Poplar Stems

To explore the impact of cold stress on the contents of lignin, one-month-old tissue culture plantlets of poplar “84k” were treated with 4 °C (cold treatment) and 25 °C (normal treatment). The results indicated that the contents of lignin in the poplar stems were slightly reduced after exposure to low temperature for three days (Figure 1). Both the contents of acid-insoluble and acid-soluble lignin changed in a similar manner (Figure 1A,B). Similarly, there was a slight increase in the content of lignin in cultured plantlets of poplar tissue at normal temperature after 3 days (Figure 1). The results indicated that transient low-temperature stress reduced the content of lignin in poplar stems.

3.2. Response of Lignin Intermediate Metabolites to Low Temperatures

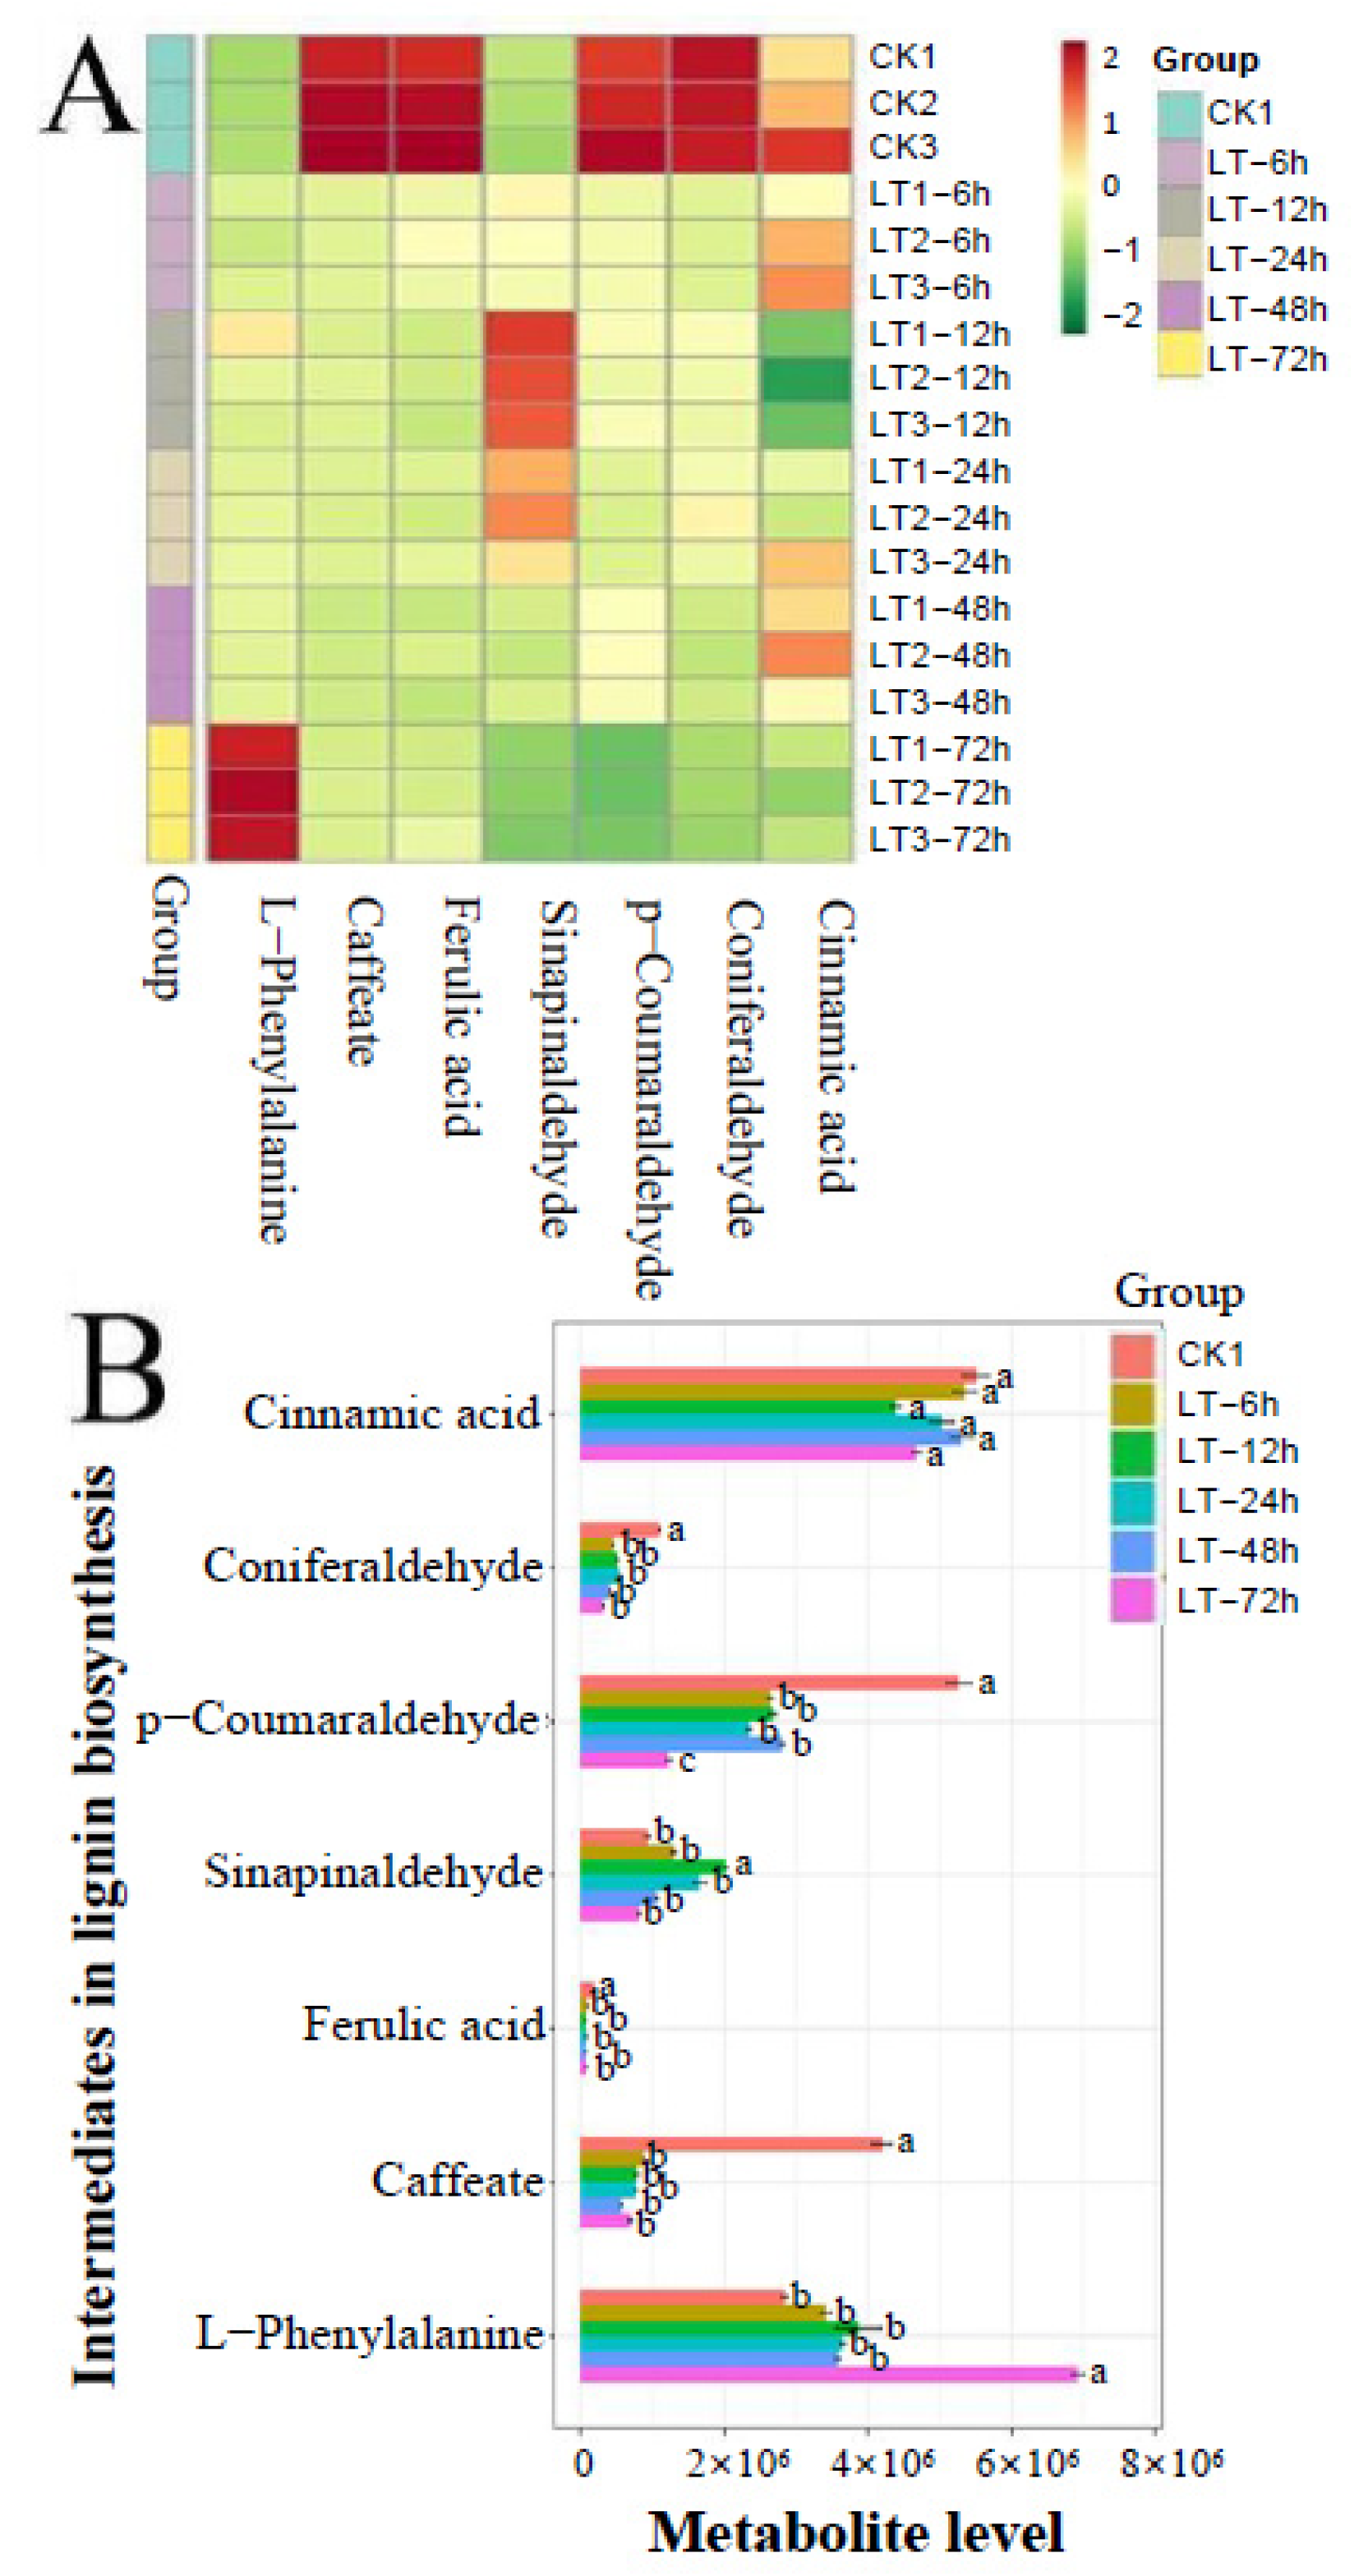
Lignin is composed of lignin intermediate metabolites [5,8,31]. In this study, the targeted metabolites were used to analyze the intermediate metabolites that comprise lignin. Based on the total ions current (TIC) mapping and multiple reaction monitoring (MRM) multi-peak map of the detection of metabolites, those of the samples were qualitatively and quantitatively analyzed using mass spectrometry based on the local metabolic database (Figure S1). Some intermediate metabolites, such as sinapic acid, coniferyl alcohol, p-coumaric acid, sinapyl alcohol, p-coumaryl alcohol, caffeoyl alcohol, and caffeoyl aldehyde, could not be quantified because they were present in such low amounts (Supplemental Table S2). The other compounds, including sinapinaldehyde, p-coumaraldehyde, l-phenylalanine, caffeate, ferulic acid, coniferaldehyde, and cinnamic acid, that were present at comparatively higher levels were induced by low-temperature treatment at different time periods (Figure 2A,B).
Metabolites with fold change ≥2 and fold change ≤0.5, which were considered to be different, were marked by red (upregulated) and green (downregulated) lines in the lignin synthesis pathway (Supplemental Tables S2 and S3). In comparison with the control group, caffeate, ferulic acid, coniferaldehyde, p-coumaraldehyde decreased, while L-phenylalanine and sinapinaldehyde increased after cold treatment (Supplemental Tables S2 and S3; Figure 2A,B). The overlapping results among the five pairwise comparisons showed that caffeate and coniferaldehyde were the only two compounds that consistently decreased following low temperature induction. The results described above suggest that ferulic acid, p-coumaraldehyde, and particularly caffeate and coniferaldehyde, play important roles in the effects of low temperature on lignin synthesis.

3.3. Differential Expression Profiles Related to Defenses Induced by Cold

To investigate the changes in the level of transcription of poplar plantlets under low-temperature stress, RNA-seq was conducted at 0, 6, 12, 24, 48 and 72 h after the low-temperature treatment. As a result, 815,954,416 high-quality clean reads of three replicates from 18 samples were obtained. Among the 18 samples, approximately 68.95–72.90% of reads were uniquely mapped to the genome (Supplemental Table S4).
Typically, after treatment at cold temperature, the transcripts were differentially expressed at different time periods. The correlation fragments per kilobase of transcript per million mapped fragments (FPKM) heat map of each sample showed that the correlation value of the three samples gathered at the same time frame was 1, revealing that the biological repeats were highly uniform (Figure 3A).
The variation of all the genes with the time after cold-temperature treatment was analyzed to investigate the trend of expression of those genes. After the cold treatment, 14,865 genes changed in 0, 6, 12, 24, 48 and 72 h. Eight different samples were divided into three large groups (0, 6–12–24, and 48–72) based on the pattern of gene expression (Figure 3B). The trend of variation in the expression of genes at different time periods differed after the cold-temperature treatment. As the results suggested, the patterns of transcription at all the culture stages were different and divided into six groups (Figure 4A). In total, there were 1475, 2029, 2926, 4219, and 5195 ascending genes and 1546, 2712, 3451, 5100, and 6329 descending genes in 6, 12, 24, 48, and 72 h of cold-temperature treatment, respectively (Figure 3C and Figure S2; Supplemental Table S5). With the extension in the time of low-temperature treatment, the number of genes that varied increased, indicating these altered genes may be involved in poplar tissue culture plantlets to cold stimuli. It is apparent that the level of expression of most of the genes changed between −5 ≤ log2 fold change ≤ 5, while the level of expression of many genes changed significantly, suggesting that they may participate the resistance of poplar to cold- temperature stress.

3.4. Functional Annotation Analysis of Differentially Expressed Genes (DEGs)

To further study the function of DEGs in response to cold stress, gene ontology (GO) and Kyoto Encyclopedia of Genes and Genomes (KEGG) were conducted. The GO function annotation analysis indicated that the DEGs of 6, 12, 24, 48, and 72 h of cold treatment were obviously enriched into 53, 56, 57, and 56 GO terms, which subordinated to three chiefly functional categories that included cellular component, molecular function and biological process (Figure 5 and Figure S3). Key genes that respond to low temperature to affect lignin metabolism can be found in the three functional categories, particularly in the metabolic process, response to stimulus and biological regulation (Figure 5 and Figure S3).
The KEGG analysis was subsequently performed, and the results showed that 129, 127, 131, 134, and 135 networks were involved in 6-, 12-, 24-, 48- and 72-h periods after the cold treatment, respectively (Figure S3). The statistics of KEGG enrichment primarily focused on the metabolism and biosynthesis under different cold treatments (Figure S4). In general, the KEGG classifications of DEGs were primarily involved in the metabolic pathways and biosynthesis of secondary metabolism, which is also the process of metabolism of lignin and its metabolic intermediates.

3.5. Identification of the Genes Involved in the Decrease in Lignin Intermediate Metabolites

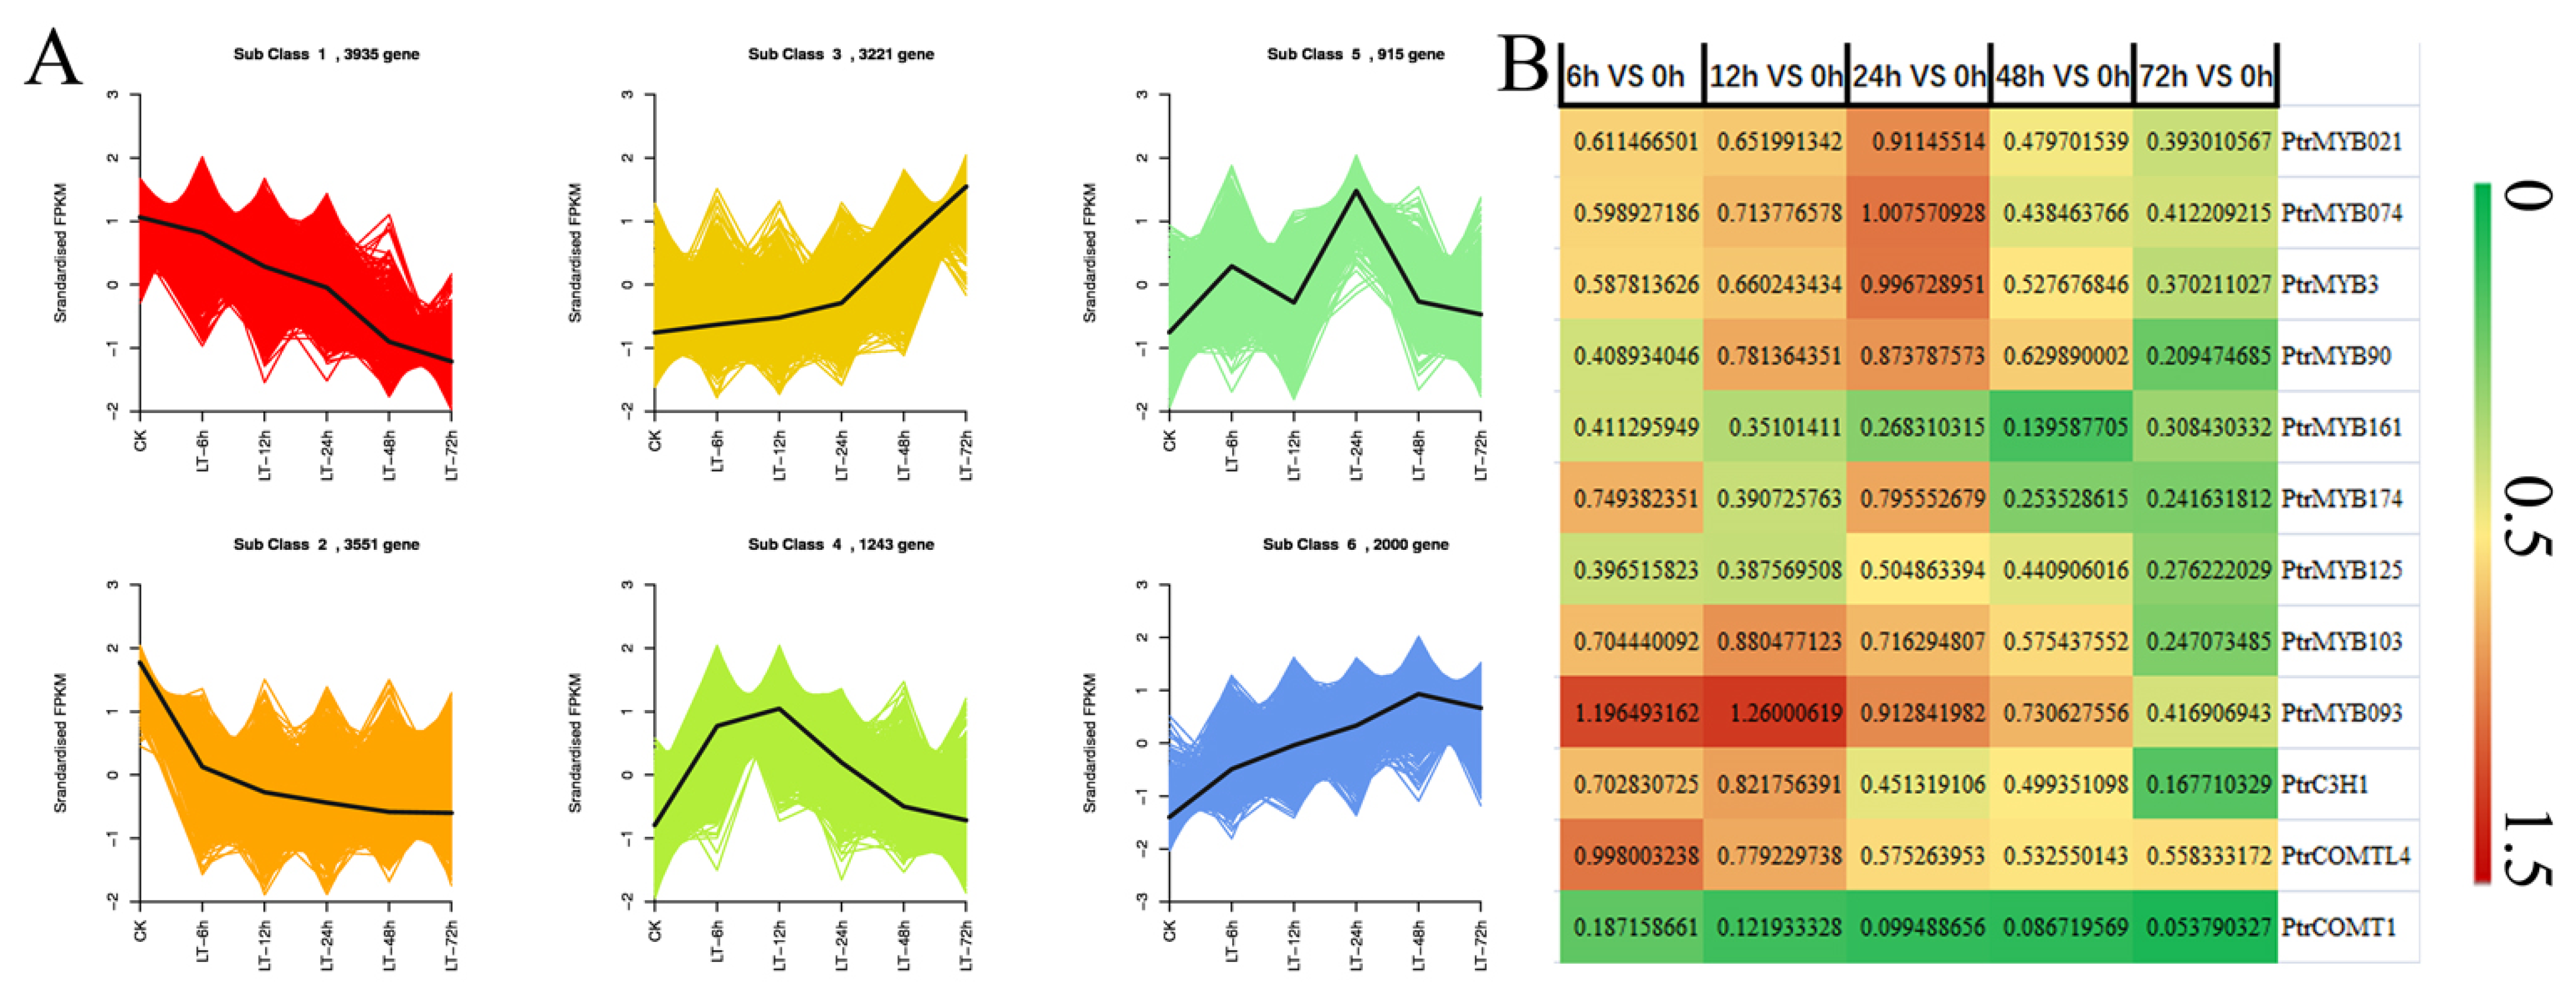
A clustering heat map showed all the different genes that were expressed (Figure 3B). Based on the change in the trend of gene expression after cold treatment, the transcripts were divided into six clusters with hundreds of DEGs in each cluster (Figure 4A; Supplemental Table S6). The genes that positively regulated the intermediates in lignin metabolism are shown in subclasses 1 and 2, and the expression of these genes generally decreased. The production of lignin metabolic intermediates is probably repressed by the genes in subclasses 3 and 6 whose expression continually increased. The level of expression of the genes in subclasses 4 and 5 went up and down, suggesting that some regulators intermittently regulated the lignin metabolic pathway.
C3′H and the other two enzymes C4H and F5H that been shown to clearly be involved in the lignin biosynthetic pathway are cytochrome P450s [32,33]. Based on the domain characteristics of the P450s, 86 transcripts that responded to low temperature were screened (Supplemental Table S7). Among them, the expression of many genes with a high FPKM decreased to different extents. C3′H is a P450 that is a member of the CYP98A class [9,10]. The expression of PtrC3′H1 gene (Potri.006G033300) decreased significantly under low temperature (Figure 4B). The obvious decrease in the expression of PtrC3′H1 indicated that it may be the key gene that leads to the decrease in content of caffeate. The COMT family plays important roles in the formation of coniferaldehyde. There are two genes designated PtrCOMTL4 (Potri.006G120000) and PtrCOMT1 (Potri.001G451100) that have a relatively lower trend of expression among the 12 PtrCOMTs that have been identified (Figure 4B; Supplemental Table S7), suggesting that PtrCOMTL4 and PtrCOMT1 may be important genes that result in the decrease in coniferaldehyde.
Lignin biosynthesis is regulated by many transcription factors, such as NAC and MYB [7]. To reveal the transcription factors that are involved in the process of lignin synthesis and metabolism under low-temperature stress, NAC and MYB were analyzed in more detail. In total, 485 MYBs and 9 NACs, which had a pattern of expression that was upregulated or downregulated, were separated (Supplemental Table S7). Among them, the expression of two PtrNACs transcripts decreased and those of seven PtrNACs increased. However, the change in level of transcription was not readily apparent. However, there were more PtrMYB transcription factors that appeared to be related to lignin synthesis, and the expression of most of them was reduced. It has been reported that PtrMYB021 (Potri.009G053900) and PtrMYB074 (Potri.015G082700) regulate lignin synthesis and cell wall development [20]. In this study, the levels of transcription of PtrMYB021 and PtrMYB074 were found to be reduced by the induction of low temperature (Figure 3B). Moreover, other PtrMYBs, such as PtrMYB90 (Potri.015G033600), PtrMYB3 (Potri.001G267300), PtrMYB161 (Potri.007G134500), PtrMYB174 (Potri.017G037000), PtrMYB125/85 (Potri.003G114100), PtrMYB103/46 (Potri.003G132000), PtrMYB093 (Potri.004G138000), that may be related to the lignin pathway were also found to be involved in the response to cold treatment (Figure 4B). Therefore, the PtrMYBs are likely to be vital regulators in the response of lignin metabolism to low temperature.

3.6. Quantitative Analysis of the Structural Genes and Transcription Factors Related to Lignin Synthesis and Metabolism in Response to Low-Temperature Stress

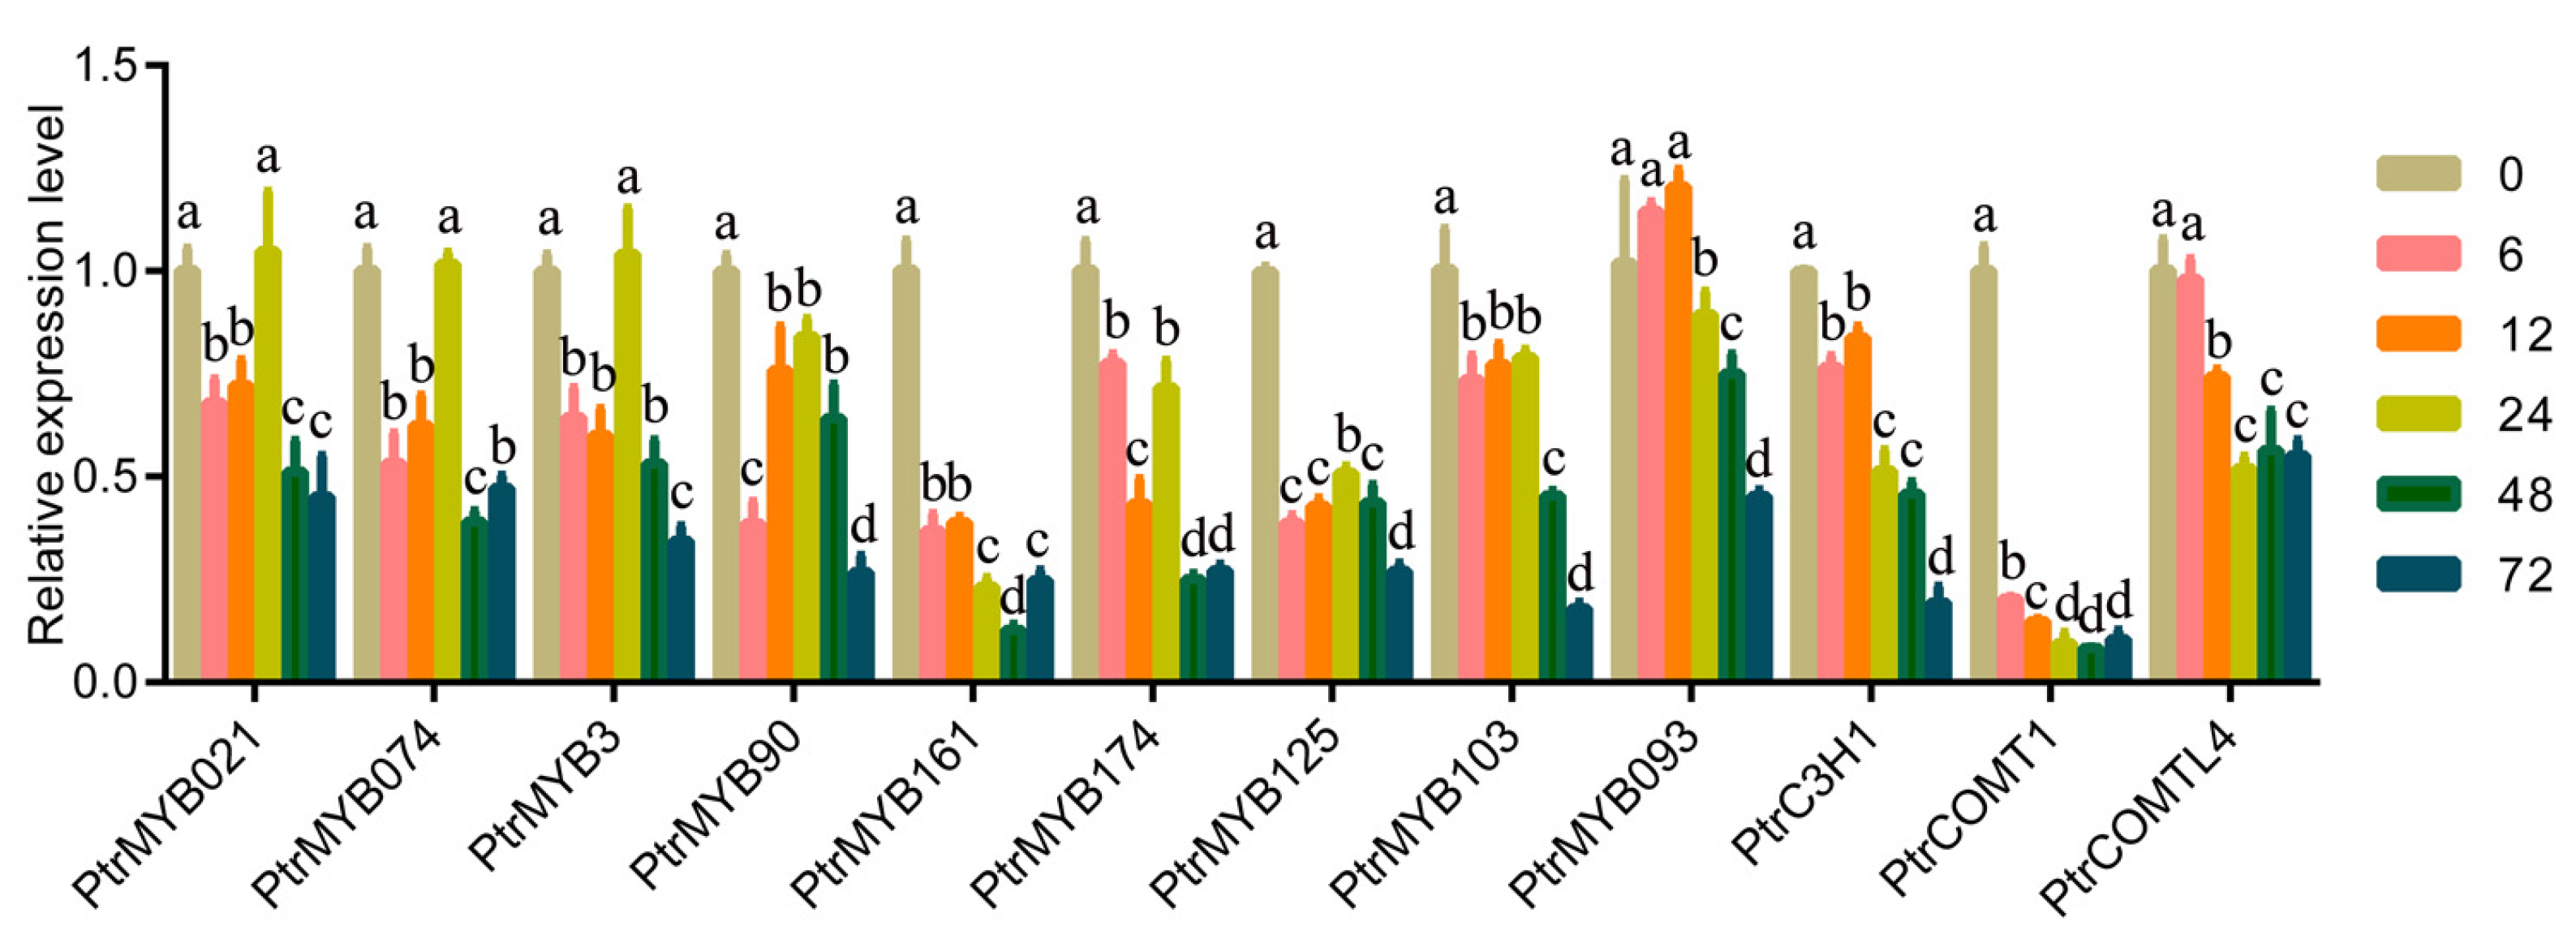
PtrMYBs, PtrC3′H1 and PtrCOMTs played crucial roles in the process of synthesis of lignin biosynthesis under low-temperature stress. Each type of gene family that was significantly induced by low temperature was used for subsequent quantitative analyses. The melting curves of RT-qPCR showed the effectiveness and specificity of the primers. The results demonstrated that the trend of RNA-seq was consistent with that of RT-qPCR at different time periods after cold-temperature treatment (Figure 6).

4. Discussion

4.1. Low-Temperature Stress Changed the Content of Lignin in Poplar Stems

The content of lignin is influenced by abiotic and biotic stresses [6,7]. Low temperature is a major limiting factor for the degree of deposition of lignin [24]. Previous studies found that low temperature restricted the production of lignin by trees and the lignification of cell walls [24]. After poplar was subjected to cold-temperature stress, the content of lignin increased [34]. When wheat (Triticum aestivum) was treated at 2 °C, the content of lignin in the roots increased, whereas the content in leaves decreased [35]. In loquat fruit, low-temperature stress reduced the degree of their lignification [36]. In this study, it was found that cold-temperature stress caused a slight decrease in the lignin content of poplar. Although the effects of low temperatures on lignin vary with plant species, developmental period and organs, short-term treatment with low temperature reduced the content of lignin in the stems of poplar plantlets [6,34,37,38]. Short-term low temperature may affect the lignin metabolic pathways. Different hypothermic conditioned stimuli, Brassica napus plants certain enzymes such as ρ-coumaric acid, ferulic acid and sinapic acid in the cells of the leaf mesophyll levels were elevated. However, we found the contents of caffeate, ferulic acid, coniferaldehyde, and p-coumaraldehyde decreased after cold stress. The reason for this difference may be the low-temperature conditions, handling time, and the plant samples (we used tissue culture plantlets). Under treatment at 10 °C, PAL activity of Glycine max roots increased. In our results, L-phenylalanine activity was also increased at 72 h after low-temperature treatment. The reduction in intermediate compounds in the lignin pathway after low- temperature treatment could be a reason for the decrease in lignin.

4.2. PtrC3′H1 Contributed to the Decrease in Caffeate Content in Response to Cold Stress

It is well known that lignin synthesis is a complex process in which 14 intermediate metabolites are produced [8,31,39]. When maize (Zea mays) was subjected to a water deficit, the contents of caffeate, one of the lignin metabolic compounds, were reduced, which resulted in the decrease in lignin [40]. Concentrations of CO2 and copper (Cu) also had a positive effect on the increase in caffeate and lignin [37,38]. In this study, low temperature was found to cause the decrease in caffeate. The gene that encodes the enzyme involved in lignin metabolic compounds may play an important role in the reduction in caffeate. The variation of structural genes is key and the direct factor in lignin synthesis pathway [7,20]. In the network of lignin formation, C3′H plays an important role in the synthesis of caffeate [8]. C3′H encodes a monooxygenase that catalyzes the generation of caffeic acid [5,8,11]. C3′H was also the key factor in lignin synthesis in alfalfa (Medicago sativa) and Arabidopsis thaliana [9,41]. In addition, it was found that the lignin content of the C3′H mutant decreased, and the poplar was stunted [11]. In this study, PtrC3′H1 (Potri.006G033300) was a closer gene in P. trichocarpa, compared with the C3′H gene (GenBank accession no. EU391631) in hybrid poplar (P. grandidentataalba). The level of expression of C3′H (Potri.006G033300) was found to be reduced by low temperature, and it may play an important role in the synthesis of caffeate. However, the level of transcription of the two other genes PtrC3′H2 (Potri.016G031000) and PtrC3′H3 (Potri.016G031100) increased in parallel with the treatment time of low temperature. This could explain why the content of caffeate decreased under low-temperature stress, and the content of lignin content did not change noticeably.

4.3. The Low-Level Expression of PtrCOMTs upon Cold Stimulus May Result in a Decrease in Coniferaldehyde

Coniferaldehyde is a specific lignin subunit, and its dominant increase modified the sustainable utilization of plant biomass in the production of pulp and its use as feed and in biorefineries [42]. In the chain extension reactions of lignin monomers, coniferaldehyde is essential, and its existence is vital for the production of lignin [43]. It was reported that coniferaldehyde made from feruloyl-CoA via CCR is primarily involved in the biosynthesis of coniferyl alcohol, and coniferaldehyde synthesized from caffealdehyde via COMT is primarily involved in sinapyl alcohol biosynthesis in alfalfa [5]. Therefore, the CCR and COMT families may be the key reason for the decrease in coniferaldehyde induced by chilling in different periods.
Among the 12 CCRs identified, PtrCCR2 (Potri.003G181400) exhibited high levels of FPKM. In birch, the correlation of expression of BpCCR1, content in lignin and biomass were positive [44]. The repression of CCR2 in poplar decreased the content of lignin without affecting the plant growth [45]. However, the level of expression of PtrCCR2 (Potri.003G181400), which was the closest gene to CCR2 in P. tremula × P. alba, had no evident alterations. The level of expression of PtrCCR2 was not related to the decrease in coniferaldehyde induced by cold stress. However, among the 12 CCR genes that changed following cold treatment, the level of transcript of CCR (Potri.003G181400) was elevated during the middle stage of the cold treatment, which could be the reason for the increase in sinapinaldehyde. These compounds, such as caffeic acid and coniferaldehyde, could be metabolized and converted to sinapinaldehyde as downstream metabolites.
Surprisingly, the analysis of COMT in the response of poplar to chilling showed that the expression of 12 PtrCOMTs had varying degrees of increasing and decreasing. In maize and sorghum (Sorghum bicolor), the mutation of COMT resulted in a lower content of lignin and easy digestion [46]. The RNAi suppression of COMT in barley altered the content of lignin in the stems by modifying the enzymatic activity [14]. In addition, the expression of COMT can be induced by Blumeria graminis in diploid wheat (Triticum monococcum) and drought in maize [47,48]. In Populus, the repression of COMT2 by LTF1 changed the content of lignin [49]. PtrCOMTL4 (Potri.006G120000) and PtrCOMT1 (Potri.001G451100) consistently had a low level of expression following cold stimulus. Thus, it is plausible that PtrCOMTL4 and PtrCOMT1 could participate in the synthesis of coniferaldehyde in response to low-temperature stress.

4.4. MYB Could Be Involved in the Alteration of Lignin Biosynthesis under Low Temperatures

Over the past decade, it has generally become accepted that the NAC MYB-based gene regulatory network (NAC-MYB-GRN) regulates the synthesis of lignin [17,50]. In NAC-MYB-GRN, NAC is the first layer that controls lignin synthesis. The VNS protein, a plant-specific group of NAC transcription factors, upregulates the level of transcription of the genes that encode the enzymes that are necessary for lignin biosynthesis and the lignification of secondary cell walls [50,51]. In this study, there was no significant decrease in the expression of NAC transcription factors among the nine NAC transcription factors that changed. This suggested that changes in lignin compounds owing to low-temperature stress may be independent of NAC, which could also explain why the content of lignin did not change under cold stress.
MYB transcription factors, such as AtMYB46 and AtMYB83, are located downstream of the VNS proteins and form the second layer in lignin synthesis [50,52]. Arabidopsis MYB46 and MYB83 activate the genes related to lignin that are directly involved in the lignin pathway and secondary cell wall formation [52,53]. Recently, studies demonstrated that PtrMYB021, PtrMYB074 and many other transcription factors participate in the formation of wood xylem [7]. PtrMYB3 and PtrMYB20, the functional orthologs of Arabidopsis MYB46 and MYB83, are related to the biosynthesis of cellulose, xylan, and lignin [53]. The transcriptional levels of OsMYB2 and OsMYB4 increased 2 h after cold treatment, suggesting that OsMYB2 and OsMYB4 could be involved in the cold response of rice [54]. Many PtrMYBs, such as PtrMYB021, PtrMYB074, PtrMYB3, PtrMYB125/85, and PtrMYB103/46, are induced by chilling, suggesting that these PtrMYBs play a vital role in the cold response and lignin pathway. Since the MYBs are critical for lignin synthesis, the confirmation that the MYBs were induced by chilling provides a key clue to study the relationship between low temperature and lignin synthesis.

4.5. Enzymatic Activity Could Contribute to Lignin Reduction

It is well known that the synthetic process of lignin is complex and that multiple intermediate metabolites are produced [8]. Caffeic acid and coniferaldehyde are intermediate compounds in the metabolism of lignin. The changes in caffeic acid and coniferaldehyde cause the changes in content of lignin. Factors such as mechanical injury and treatment by ethylene, UV and methyl jasmonate could change the content of caffeic acid [55,56,57]. This study found that cold temperature can cause a decrease in caffeic acid and coniferaldehyde in lignin metabolism. In maize, the coniferaldehyde generated in the lignin synthetic pathway protected the cell walls and other compounds from destruction [58]. In addition, changes in the number of coniferaldehyde residues would cause changes in the physical, mechanical and biochemical properties of lignin [59]. The decrease in caffeic acid and coniferaldehyde could be an important factor during the process of lignin degradation. Although other compounds change to varying degrees, their increase or decrease is not continuous. The genes respond very quickly by expressing transcripts. The results indicate that cold treatment causes changes in the level of transcription of some related genes, while the related cellular activity was not measured in this study. In addition, changes in cellular activity are typically caused by related enzymes that are encoded by genes in the growth, regulation and cold-response pathways. Therefore, we proposed a hypothesis that the decrease in active transcript levels was caused by the cellular response to cold treatment.

5. Conclusions

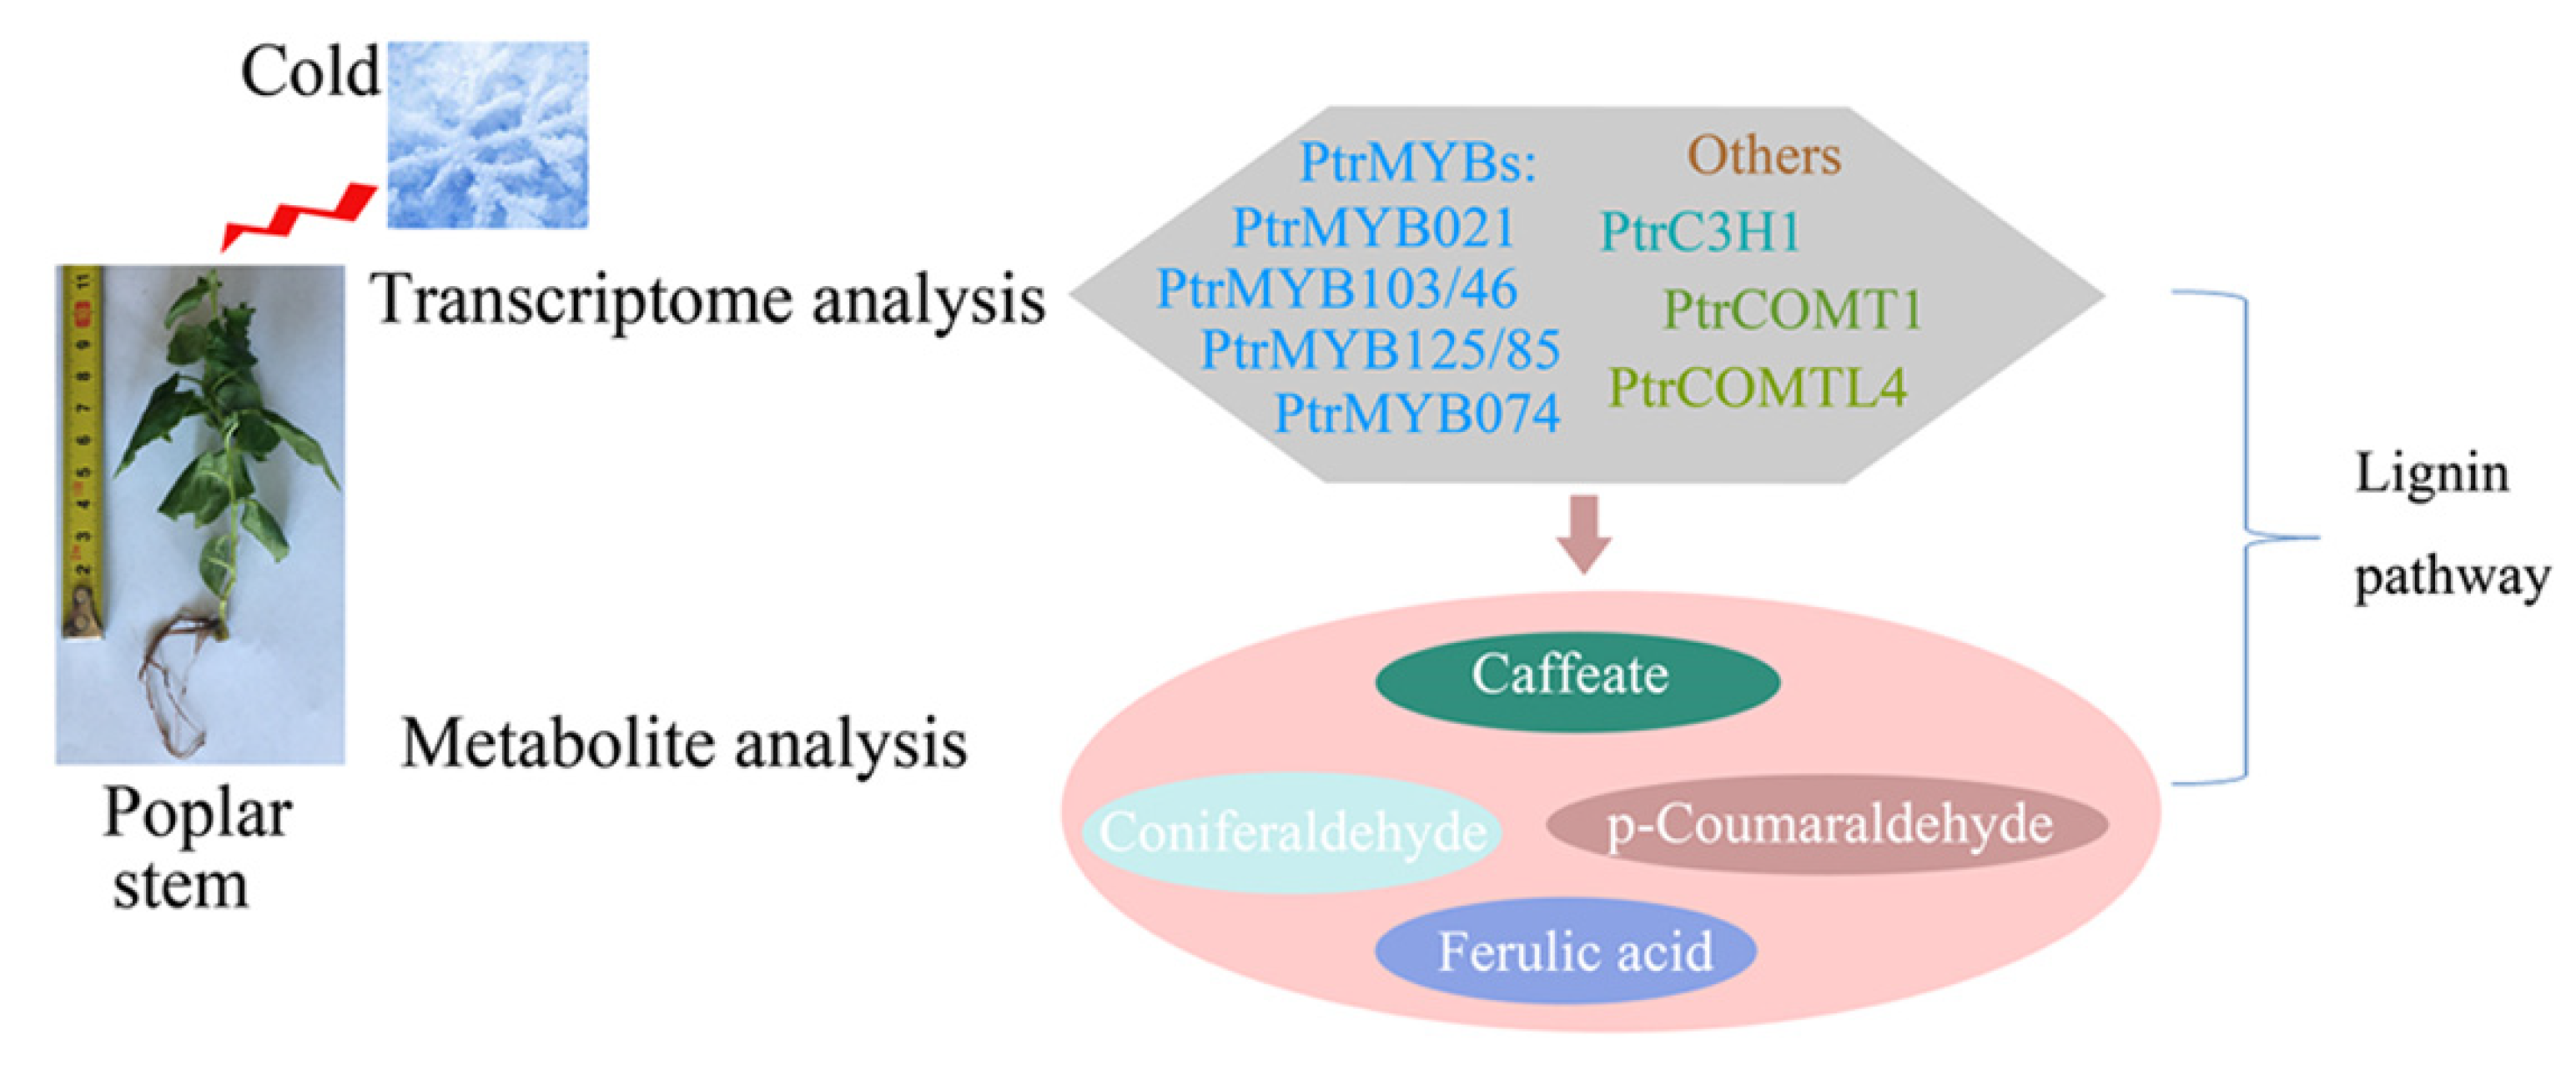
Based on the results of all the experimental data, we summarized a pattern graph to elucidate the relationship between low-temperature stress and transcription factors and lignin metabolic intermediates and biosynthesis (Figure 7). Cold temperature resulted in changes in the levels of transcription of some vital transcription factors, such as PtrMYBs and others that are related to lignin. The structural genes related to lignin, such as PtrC3′H1, PtrCOMTL4, PtrCOMT1 and others, were induced by chilling or by these transcription factors. PtrC3′H1 could be a possible factor that leads to the decrease in content of caffeate, while PtrCOMTL4 and PtrCOMT1 could reduce the amount of coniferaldehyde. In addition, the content of ferulic acid and p-coumaraldehyde decreased owing to low-temperature stress, which could be the result of the decreased level of transcription of some key genes, which merits further study. Subsequently, the lignin biosynthetic pathway was disrupted, and the contents of caffeate, ferulic acid, coniferaldehyde, and p-coumaraldehyde decreased. As a result, the content of lignin was reduced after short-term cold treatment. In conclusion, some transcription factors and genes identified in this project provide a theoretical basis for further research on the molecular mechanism of changes in the lignin pathway induced by low temperature.

Supplementary Materials

The following supporting information can be downloaded at: https://www.mdpi.com/article/10.3390/agronomy12102506/s1, Figure S1: Qualitative and quantitative analysis. Figure S2: Genes in different time periods of cold-temperature treatment. Figure S3: GO function annotation analysis. Figure S4: The statistics of KEGG enrichment. Table S1: List of primers used in this research. Table S2: The metabolites detected that belong to lignin synthesis pathway. Table S3: The content of intermediate metabolites of poplar stem with cold treatment for 0, 6, 12, 24, 48 and 72 h in lignin pathway. CK is 0 h. LT means low temperature. Red represents an increase while green means a decrease. Table S4: Sequencing quality assessment of three replicates from 18 poplar stem samples. Q20 represents an error rate of 1%. Q30 represents an error rate of 0.1%. Table S5: Elevated and lowered genes with low temperature treatment. Table S6: RPKM values, functional annotation and classification of changed genes with cold treatment for 0, 6, 12, 24, 48 and 72 h in lignin pathway. CK is 0 h. LT means low temperature. Table S7: RPKM values, functional annotation and classification of lignin-related genes with cold treatment for 0, 6, 12, 24, 48 and 72 h in lignin pathway. CK is 0 h. LT means low temperature.

Author Contributions

T.X. and X.Z. designed the research project. X.Z., P.L. and C.L. performed the experiments and analyzed the data. X.Z. and T.X. wrote this manuscript. All authors have read and agreed to the published version of the manuscript.

Funding

This study was financially supported by the Integration of Science and Education Program Foundation for the Talents by Qilu University of Technology, Shandong Academy of Sciences (No. 2018-81110268 chaired by Tao Xia), Natural Science Foundation of Shandong Province (No. ZR2021QC203 chaired by Xianyan Zhao), Foundation of State Key Laboratory of Biobased Material and Green Papermaking (No. 2419010205, No. 23190444 chaired by Tao Xia and No. ZZ20200130 chaired by Xianyan Zhao). The funders had no role in the design of the study, in the collection, analysis, and interpretation of data, or in writing the manuscript.

Data Availability Statement

Data are available on request to the corresponding author. The transcriptome sequencing has been deposited under BioProject in NCBI (https://www.ncbi.nlm.nih.gov/bioproject/?term=prjna693372, accessed on 19 January 2021). The accession number for these SRA data is PRJNA693372.

Conflicts of Interest

The authors declare no conflict of interest.

References

  1. Agarwal, M.; Hao, Y.; Kapoor, A.; Dong, C.H.; Fujii, H.; Zheng, X.; Zhu, J.K. A R2R3 type MYB transcription factor is involved in the cold regulation of CBF genes and in acquired freezing tolerance. J. Biol. Chem. 2006, 281, 37636–37645. [Google Scholar] [CrossRef] [PubMed] [Green Version]
  2. Fedoroff, N.V.; Battisti, D.S.; Beachy, R.N.; Cooper, P.J.; Fischhoff, D.A.; Hodges, C.N.; Knauf, V.C.; Lobel, D.; Mazur, B.J.; Molden, D.; et al. Radically rethinking agriculture for the 21st century. Science 2010, 327, 833–834. [Google Scholar] [CrossRef] [PubMed] [Green Version]
  3. Shi, Y.; Ding, Y.; Yang, S. Molecular regulation of CBF signaling in cold acclimation. Trends Plant Sci. 2018, 23, 623–637. [Google Scholar] [CrossRef] [PubMed]
  4. Zhu, J.K. Abiotic stress signaling and responses in plants. Cell 2016, 167, 313–324. [Google Scholar] [CrossRef] [Green Version]
  5. Vanholme, R.; De Meester, B.; Ralph, J.; Boerjan, W. Lignin biosynthesis and its integration into metabolism. Curr. Opin. Biotech. 2019, 56, 230–239. [Google Scholar] [CrossRef]
  6. Moura, J.C.M.S.; Bonine, C.A.V.; de Oliveira Fernandes Viana, J.; Dornelas, M.C.; Mazzafera, P. Abiotic and biotic stresses and changes in the lignin content and composition in plants. J. Integr. Plant Biol. 2010, 52, 360–376. [Google Scholar] [CrossRef]
  7. Behr, M.; Guerriero, G.; Grima-Pettenati, J.; Baucher, M. A molecular blueprint of lignin repression. Trends Plant Sci. 2019, 24, 1052–1064. [Google Scholar] [CrossRef] [Green Version]
  8. Bryant, N.D.; Pu, Y.; Tschaplinski, T.J.; Tuskan, G.A.; Muchero, W.; Kalluri, U.C.; Yoo, C.G.; Ragauskas, A.J. Transgenic Poplar Designed for Biofuels. Trends Plant Sci. 2020, 25, 881–896. [Google Scholar] [CrossRef]
  9. Schoch, G.; Goepfert, S.; Morant, M.; Hehn, A.; Meyer, D.; Ullmann, P.; Werck-Reichhart, D. CYP98A3 from Arabidopsis thaliana is a 3′-hydroxylase of phenolic esters, a missing link in the phenylpropanoid pathway. J. Biol. Chem. 2001, 276, 36566–36574. [Google Scholar] [CrossRef] [Green Version]
  10. Franke, R.; Humphreys, J.M.; Hemm, M.R.; Denault, J.W.; Ruegger, M.O.; Cusumano, J.C.; Chapple, C. The Arabidopsis REF8 gene encodes the 3-hydroxylase of phenylpropanoid metabolism. Plant J. 2002, 30, 33–45. [Google Scholar] [CrossRef]
  11. Coleman, H.D.; Park, J.Y.; Nair, R.; Chapple, C.; Mansfield, S.D. RNAi-mediated suppression of p-coumaroyl-CoA 3′-hydroxylase in hybrid poplar impacts lignin deposition and soluble secondary metabolism. Proc. Natl. Acad. Sci. USA 2008, 105, 4501–4506. [Google Scholar] [CrossRef] [Green Version]
  12. Bonawitz, N.D.; Im Kim, J.; Tobimatsu, Y.; Ciesielski, P.N.; Anderson, N.A.; Ximenes, E.; Maeda, J.; Ralph, J.; Donohoe, B.S.; Ladisch, M.; et al. Disruption of mediator rescues the stunted growth of a lignin-deficient Arabidopsis mutant. Nature 2014, 509, 376–380. [Google Scholar] [CrossRef]
  13. Tu, Y.; Rochfort, S.; Liu, Z.; Ran, Y.; Griffith, M.; Badenhorst, P.; Louie, G.V.; Bowman, M.E.; Smith, K.F.; Noel, J.P.; et al. Functional analyses of caffeic acid O-methyltransferase and cinnamoyl-CoA-reductase genes from perennial ryegrass (Lolium perenne). Plant Cell 2010, 22, 3357–3373. [Google Scholar] [CrossRef] [Green Version]
  14. Daly, P.; McClellan, C.; Maluk, M.; Oakey, H.; Lapierre, C.; Waugh, R.; Stephens, J.; Marshall, D.; Barakate, A.; Tsuji, Y.; et al. RNA i-suppression of barley caffeic acid O-methyltransferase modifies lignin despite redundancy in the gene family. Plant Biotechnol. J. 2020, 17, 594–607. [Google Scholar] [CrossRef] [Green Version]
  15. Wang, H.Z.; Dixon, R.A. On-off switches for secondary cell wall biosynthesis. Mol. Plant. 2012, 5, 297–303. [Google Scholar] [CrossRef] [Green Version]
  16. Geng, P.; Zhang, S.; Liu, J.; Zhao, C.; Wu, J.; Cao, Y.; Fu, C.; Han, X.; He, H.; Zhao, Q. MYB20, MYB42, MYB43, and MYB85 regulate phenylalanine and lignin biosynthesis during secondary cell wall formation. Plant Physiol. 2020, 182, 1272–1283. [Google Scholar] [CrossRef] [Green Version]
  17. Nakano, Y.; Yamaguchi, M.; Endo, H.; Rejab, N.A.; Ohtani, M. NAC-MYB-based transcriptional regulation of secondary cell wall biosynthesis in land plants. Front. Plant Sci. 2015, 6, 288. [Google Scholar] [CrossRef] [Green Version]
  18. Kim, W.C.; Ko, J.H.; Kim, J.Y.; Kim, J.; Bae, H.J.; Han, K.H. MYB46 directly regulates the gene expression of secondary wall-associated cellulose synthases in Arabidopsis. Plant J. 2013, 73, 26–36. [Google Scholar] [CrossRef]
  19. Grima-Pettenati, J.; Soler, M.; Camargo, E.L.O.; Wang, H. Transcriptional regulation of the lignin biosynthetic pathway revisited: New players and insights. Adv. Bot. Res. 2012, 61, 173–218. [Google Scholar]
  20. Chen, H.; Wang, J.P.; Liu, H.; Li, H.; Lin, Y.C.J.; Shi, R.; Sederoff, R.R. Hierarchical transcription factor and chromatin binding network for wood formation in Populus trichocarpa. Plant Cell. 2019, 31, 602–626. [Google Scholar] [CrossRef] [Green Version]
  21. Dai, X.; Xu, Y.; Ma, Q.; Xu, W.; Wang, T.; Xue, Y.; Chong, K. Overexpression of an R1R2R3 MYB gene, OsMYB3R-2, increases tolerance to freezing, drought, and salt stress in transgenic Arabidopsis. Plant Physiol. 2007, 143, 1739–1751. [Google Scholar] [CrossRef]
  22. An, J.P.; Li, R.; Qu, F.J.; You, C.X.; Wang, X.F.; Hao, Y.J. R2R3-MYB transcription factor MdMYB23 is involved in the cold tolerance and proanthocyanid in accumulation in apple. Plant J. 2018, 96, 562–577. [Google Scholar] [CrossRef] [Green Version]
  23. Taylor, G. Populus: Arabidopsis for forestry. Do we need a model tree? Ann. Bot. 2002, 90, 681–689. [Google Scholar] [CrossRef] [Green Version]
  24. Crivellaro, A.; Büntgen, U. New evidence of thermally constrained plant cell wall lignification. Trends Plant Sci. 2020, 25, 322–324. [Google Scholar] [CrossRef]
  25. Sluiter, A.; Hames, B.; Ruiz, R.; Scarlata, C.; Sluiter, J.; Templeton, D.; Crocker, D. Determination of structural carbohydrates and lignin in biomass. Lab. Anal. Proceed. 2008, 1617, 1–16. [Google Scholar]
  26. Jiang, C. Efficient extraction of RNA from various Camellia species rich in secondary metabolites for deep transcriptome sequencing and gene expression analysis. Afr. J. Biotechnol. 2019, 10, 16763–16768. [Google Scholar] [CrossRef] [Green Version]
  27. Young, M.D.; Wakefield, M.J.; Smyth, G.K.; Oshlack, A. Gene ontology analysis for RNA-seq: Accounting for selection bias. Genome Biol. 2010, 11, 1–12. [Google Scholar] [CrossRef] [Green Version]
  28. Mao, X.; Cai, T.; Olyarchuk, J.G.; Wei, L. Automated genome annotation and pathway identification using the KEGG Orthology (KO) as a controlled vocabulary. Bioinformatics 2005, 21, 3787–3793. [Google Scholar] [CrossRef]
  29. Wang, Z.; Mao, Y.; Guo, Y.; Gao, J.; Liu, X.; Li, S.; Lin, Y.J.; Chen, H.; Wang, J.P.; Chiang, V.L.; et al. MYB Transcription Factor 161 Mediates Feedback Regulation of Secondary wall-associated NAC-Domain 1 Family Genes for Wood Formation. Plant Physiol. 2020, 184, 1389–1406. [Google Scholar] [CrossRef]
  30. Bustin, S.A.; Benes, V.; Garson, J.A.; Hellemans, J.; Huggett, J.; Kubista, M.; Mueller, R.; Nolan, T.; Pfaffl, M.W.; Shipley, G.L.; et al. The MIQE Guidelines: Minimum Information for Publication of Quantitative Real-Time PCR Experiments. Clin. Chem. 2009, 55, 611–622. [Google Scholar] [CrossRef] [Green Version]
  31. Barros, J.; Escamilla-Trevino, L.; Song, L.; Rao, X.; Serrani-Yarce, J.C.; Palacios, M.D.; Engle, N.K.; Choudhury, F.; Tschaplinski, T.J.; Venables, B.J.; et al. 4-Coumarate 3-hydroxylase in the lignin biosynthesis pathway is a cytosolic ascorbate peroxidase. Nat. Commun. 2019, 10, 1–11. [Google Scholar] [CrossRef] [Green Version]
  32. Chapple, C. Molecular-genetic analysis of plant cytochrome P450-dependent monooxygenases. Annu. Rev. Plant Biol. 1998, 49, 311–343. [Google Scholar] [CrossRef] [PubMed]
  33. Ro, D.K.; Mah, N.; Ellis, B.E.; Douglas, C.J. Functional characterization and subcellular localization of poplar (Populus trichocarpa × Populus deltoides) cinnamate 4-hydroxylase. Plant Physiol. 2001, 126, 317–329. [Google Scholar] [CrossRef] [PubMed] [Green Version]
  34. Hausman, J.F.; Evers, D.; Thiellement, H.; Jouve, L. Compared responses of poplar cuttings and in vitro raised shoots to short-term chilling treatments. Plant Cell Rep. 2000, 19, 954–960. [Google Scholar] [CrossRef] [PubMed]
  35. Olenichenko, N.; Zagoskina, N. Response of winter wheat to cold: Production of phenolic compounds and l-phenylalanine ammonia lyase activity. Appl. Biochem. Microbiol. 2005, 41, 600–603. [Google Scholar] [CrossRef]
  36. Zeng, J.K.; Li, X.; Zhang, J.; Ge, H.; Yin, X.R.; Chen, K.S. Regulation of loquat fruit low temperature response and lignification involves interaction of heat shock factors and genes associated with lignin biosynthesis. Plant Cell Environ. 2016, 39, 1780–1789. [Google Scholar] [CrossRef] [PubMed]
  37. Cabane, M.; Afif, D.; Hawkins, S. Lignins and abiotic stresses. Adv. Bot. Res. 2012, 61, 219–262. [Google Scholar]
  38. Liu, Q.; Luo, L.; Zheng, L. Lignins: Biosynthesis and biological functions in plants. Int. J. Mol. Sci. 2018, 19, 335. [Google Scholar] [CrossRef] [Green Version]
  39. Boerjan, W.; Ralph, J.; Baucher, M. Lignin biosynthesis. Annu. Rev. Plant Biol. 2003, 54, 519–546. [Google Scholar] [CrossRef]
  40. Alvarez, S.; Marsh, E.L.; Schroeder, S.G.; Schachtman, D.P. Metabolomic and proteomic changes in the xylem sap of maize under drought. Plant Cell Environ. 2008, 31, 325–340. [Google Scholar] [CrossRef]
  41. Reddy, M.S.; Chen, F.; Shadle, G.; Jackson, L.; Aljoe, H.; Dixon, R.A. Targeted down-regulation of cytochrome P450 enzymes for forage quality improvement in alfalfa (Medicago sativa L.). Proc. Natl. Acad. Sci. USA 2005, 102, 16573–16578. [Google Scholar] [CrossRef] [Green Version]
  42. Yamamoto, M.; Blaschek, L.; Subbotina, E.; Kajita, S.; Pesquet, E. Importance of lignin coniferaldehyde residues for plant properties and sustainable uses. ChemSuschem 2020, 13, 4400. [Google Scholar] [CrossRef]
  43. Van Acker, R.; Déjardin, A.; Desmet, S.; Hoengenaert, L.; Vanholme, R.; Morreel, K.; Laurans, F.; Kim, H.; Santoro, N.; Foster, C.; et al. Different metabolic routes for coniferaldehyde and sinapaldehyde with Cinnamyl alcohol dehydrogenase1 deficiency. Plant Physiol. 2017, 175, 1018–1039. [Google Scholar] [CrossRef]
  44. Zhang, W.; Wei, R.; Chen, S.; Jiang, J.; Li, H.; Huang, H.; Yang, G.; Wang, S.; Wei, H.; Liu, G. Functional characterization of CCR in birch (Betula platyphylla × Betula pendula) through overexpression and suppression analysis. Physiol. Plantarum. 2015, 154, 283–296. [Google Scholar] [CrossRef]
  45. De Meester, B.; Madariaga Calderón, B.; de Vries, L.; Pollier, J.; Goeminne, G.; Doorsselaere, J.V.; Chen, M.; Ralph, J.; Vanholme, R.; Boerjan, W. Tailoring poplar lignin without yield penalty by combining a null and haploinsufficient CINNAMOYL-CoA REDUCTASE2 allele. Nat. Commun. 2020, 11, 5020. [Google Scholar] [CrossRef]
  46. Bout, S.; Vermerris, W. A candidate-gene approach to clone the sorghum Brown midrib gene encoding caffeic acid O-methyltransferase. Mol. Genet. Genomics 2003, 269, 205–214. [Google Scholar] [CrossRef]
  47. Bhuiyan, N.H.; Liu, W.; Liu, G.; Selvaraj, G.; Wei, Y.; King, J. Transcriptional regulation of genes involved in the pathways of biosynthesis and supply of methyl units in response to powdery mildew attack and abiotic stresses in wheat. Plant Mol. Biol. 2007, 64, 305–318. [Google Scholar] [CrossRef]
  48. Hu, Y.; Li, W.C.; Xu, Y.Q.; Li, G.J.; Liao, Y.; Fu, F.L. Differential expression of candidate genes for lignin biosynthesis under drought stress in maize leaves. J. Appl. Genet. 2009, 50, 213–223. [Google Scholar] [CrossRef]
  49. Gui, J.; Lam, P.Y.; Tobimatsu, Y.; Sun, J.; Huang, C.; Cao, S.; Zhong, Y.; Umezawa, T.; Li, L. Fibre-specific regulation of lignin biosynthesis improves biomass quality in Populus. New Phytol. 2020, 226, 1074–1087. [Google Scholar] [CrossRef] [Green Version]
  50. Ohtani, M.; Demura, T. The quest for transcriptional hubs of lignin biosynthesis: Beyond the NAC-MYB-gene regulatory network model. Curr. Opin. Biotech. 2019, 56, 82–87. [Google Scholar] [CrossRef]
  51. Zhong, R.; Lee, C.; Ye, Z.H. Global analysis of direct targets of secondary wall NAC master switches in Arabidopsis. Mol. Plant. 2010, 3, 1087–1103. [Google Scholar] [CrossRef] [PubMed]
  52. Ko, J.H.; Jeon, H.W.; Kim, W.C.; Kim, J.Y.; Han, K.H. The MYB46/MYB83-mediated transcriptional regulatory programme is a gatekeeper of secondary wall biosynthesis. Ann. Bot. 2014, 114, 1099–1107. [Google Scholar] [CrossRef] [PubMed] [Green Version]
  53. McCarthy, R.L.; Zhong, R.; Fowler, S.; Lyskowski, D.; Piyasena, H.; Carleton, K.; Spicer, C.; Ye, Z.H. The poplar MYB transcription factors, PtrMYB3 and PtrMYB20, are involved in the regulation of secondary wall biosynthesis. Plant Cell Physiol. 2010, 51, 1084–1090. [Google Scholar] [CrossRef] [PubMed]
  54. Dasgupta, P.; Das, A.; Datta, S.; Banerjee, I.; Tripathy, S.; Chaudhuri, S. Understanding the early cold response mechanism in IR64 indica rice variety through comparative transcriptome analysis. BMC Genomics 2020, 21, 425. [Google Scholar] [CrossRef] [PubMed]
  55. Mitiouchkina, T.; Mishin, A.S.; Somermeyer, L.G.; Markina, N.M.; Chepurnyh, T.V.; Guglya, E.B.; Karataeva, T.A.; Palkina, K.A.; Shakhova, E.S.; Fakhranurova, L.I.; et al. Plants with genetically encoded autoluminescence. Nat. Biotechnol. 2020, 38, 944–946. [Google Scholar] [CrossRef] [PubMed]
  56. Rao, X.; Dixon, R.A. Current models for transcriptional regulation of secondary cell wall biosynthesis in grasses. Front. Plant Sci. 2018, 9, 399. [Google Scholar] [CrossRef] [PubMed] [Green Version]
  57. Stewart, C.N., Jr.; Lenaghan, S.C. Lighting the Way: Advances in Engineering Autoluminescent Plants. Trends Plant Sci. 2020, 25, 1176–1179. [Google Scholar]
  58. Grabber, J.H.; Ralph, J.; Hatfield, R.D. Severe inhibition of maize wall degradation by synthetic lignins formed with coniferaldehyde. J. Sci. Food Agr. 1998, 78, 81–87. [Google Scholar] [CrossRef]
  59. Blaschek, L.; Champagne, A.; Dimotakis, C.; Decou, R.; Hishiyama, S.; Kratzer, S.; Kajita, S.; Pesquet, E. Cellular and genetic regulation of coniferaldehyde incorporation in lignin of herbaceous and woody plants by quantitative wiesner staining. Front. Plant Sci. 2020, 11, 109. [Google Scholar] [CrossRef]
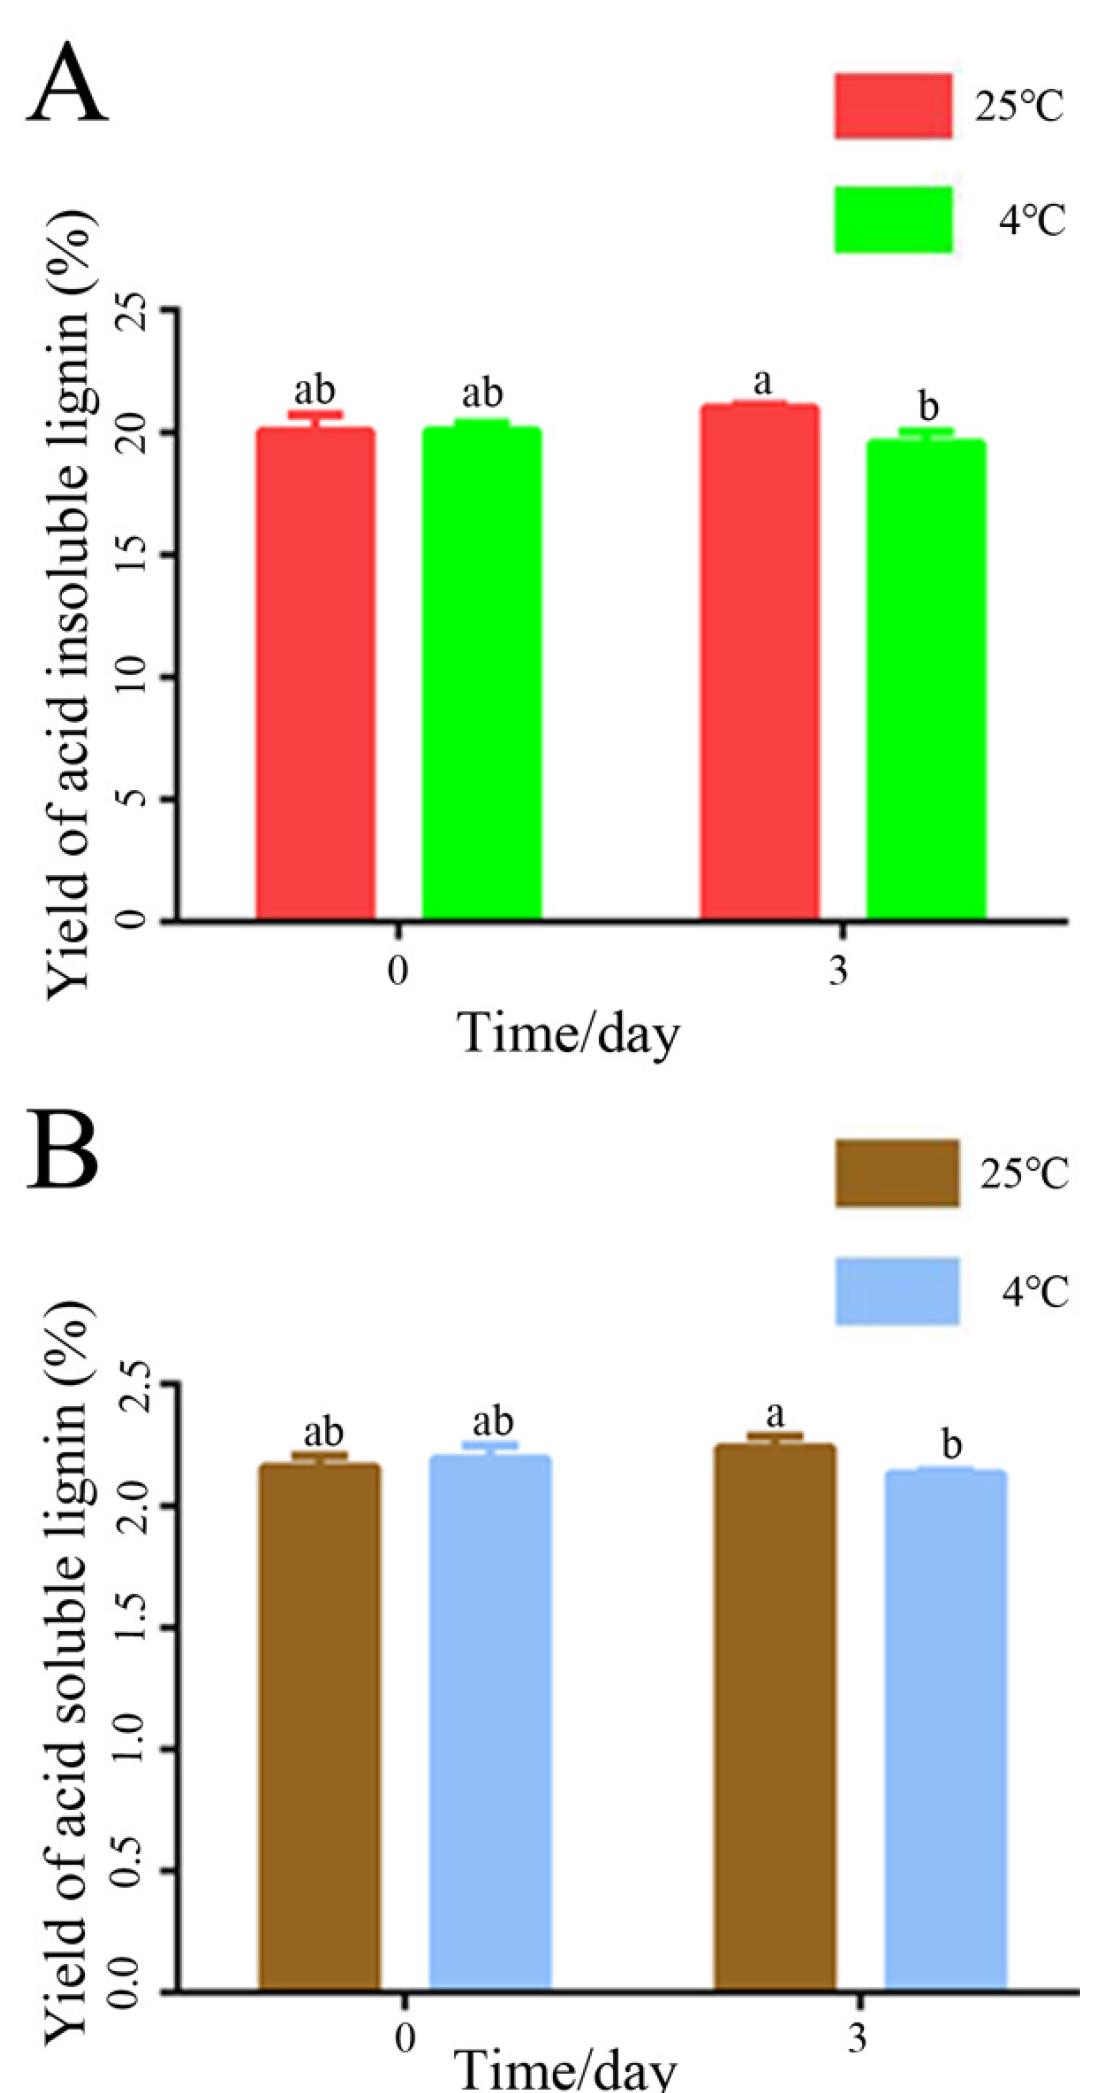
Figure 1. Cold treatment changed the content of lignin in poplar. (A) Yield of the content of acid insoluble lignin of the poplar stems after treatment with 4 °C (cold treatment) and 25 °C (normal treatment). (B) Yield of the acid soluble lignin content of stem in poplar after treatment with 4 °C (cold treatment) and 25 °C (normal treatment). The same letter on the P0.05 level indicates that there was no difference, while a different P0.05 level showed differences. The data are shown as the mean ± SE from three replicates. a and b represent significant differences, while ab and a, or ab and b, are not significantly different in both pairs because they have duplicate letters.
Agronomy 12 02506 g001
Figure 2. Analysis of intermediates in the lignin pathway. (A) The heat map of intermediates in lignin metabolism of 0 (CK), 6, 12, 24, 48, and 72 h after treatment with cold. (B) Histogram of the level of lignin of 0 (CK), 6, 12, 24, 48, and 72 h after treatment with cold. The data that showed as the mean ± SE was repeated three times. The sample of 0 h was used as calibrator. LT, low temperature.
Agronomy 12 02506 g002
Figure 3. Differential expression analysis and clustering of DEGs. (A) Heat map of correlation coefficient values across samples based on RNAseq FPKM. (B) Cluster analysis of DEGs. (C) Volcano plot of DEGs of cold treatment at 6 h.
Agronomy 12 02506 g003
Figure 4. Analysis of gene expression in response to low temperature. (A) The expression patterns of DEGs analyzed by express trend model profile. (B) The expression level of some lignin-related genes at different time periods (6, 12, 24, 48, 72 h) compared with the control group (0 h) after low- temperature treatment.
Agronomy 12 02506 g004
Figure 5. Functional annotation of DEGs after treated with 6 h cold stimulus. (A) The GO classification of DEGs. (B) Significantly enriched KEGG pathways analysis of DEGs.
Agronomy 12 02506 g005
Figure 6. qRT-PCR analysis of genes. RT-qPCR analysis of PtrMYB021, PtrMYB074, PtrMYB3, PtrMYB90, PtrMYB161, PtrMYB174, PtrMYB125, PtrMYB103, PtrMYB093, PtrC3′H1, PtrCOMT1, and PtrCOMTL4 of poplar stems with cold treatment for 0, 6, 12, 24, 48 and 72 h. The same letter of P0.05 level indicates that there is no difference, while different levels of P0.05 indicate differences. The data are shown as the mean ± SE from three replicates. The sample of 0 h was used as the calibrator. DEG, differentially expressed genes; LT, low temperature; RT-qPCR, reverse-transcriptase quantitative real-time PCR.
Agronomy 12 02506 g006
Figure 7. Regulatory mechanism that explains how the regulators regulate the pathway between low temperature and lignin. Cold temperatures resulted in the changes in content of lignin in poplar. A transcriptomic analysis indicated that some vital transcription factors, such as PtrMYBs, other transcription factors related to lignin, and structural genes related to lignin, such as PtrC3′H1, PtrCOMTL4, PtrCOMT1 and others, were induced by chilling. PtrC3′H1 could be a possible factor that leads to a decrease in the content of caffeate, while PtrCOMTL4 and PtrCOMT1 may reduce the amounts of coniferaldehyde, caffeate, ferulic acid, coniferaldehyde, p-coumaraldehyde represents different lignin precursors.
Agronomy 12 02506 g007
Publisher’s Note: MDPI stays neutral with regard to jurisdictional claims in published maps and institutional affiliations.