Article

Chitosan Treatment Effectively Alleviates the Adverse Effects of Salinity in Moringa oleifera Lam via Enhancing Antioxidant System and Nutrient Homeostasis

1
College of Forestry, Guangxi University, Nanning 530004, China
2
Horticulture Department, Faculty of Agriculture, Tanta University, Tanta 31527, Egypt
*
Authors to whom correspondence should be addressed.
Agronomy 2022, 12(10), 2513; https://doi.org/10.3390/agronomy12102513
Submission received: 18 September 2022 / Revised: 3 October 2022 / Accepted: 10 October 2022 / Published: 14 October 2022
(This article belongs to the Special Issue Advances in Plant Physiology of Abiotic Stresses Series II)

Abstract

:
Salt stress is a significant and common abiotic stress that negatively affects plant growth and development. Chitosan is a biodegradable and non-toxic stimulant of plant growth, which produces new routes to ameliorate the adverse effects of abiotic stresses. The possible profits of chitosan in salt stress alleviation have not been reported yet in Moringa oleifera, an important nutritional and medicinal tree. Therefore, the aim of the current study was to investigate the effect of chitosan treatment on salt-stressed moringa and its underlying physiological and biochemical mechanisms. Moringa plants were grown under 0, 25, 50 and 75 mM NaCl, while chitosan was applied at a 1% concentration as a foliar spray treatment. Growth attributes were considerably impaired, due to the salt stress treatment; however, chitosan application significantly reversed such an effect. Relative to the control, the fresh and dry weights of leaves were reduced by 51.44 and 48.74% in 75 mM-treated plants, while after chitosan treatment they were 33.61 and 35.72%, respectively. Additionally, chitosan treatment retarded chlorophyll and carotenoids reductions, enhanced the carbohydrate content, proline content, and phenol content and induced the activities of catalase, superoxide dismutase and ascorbate peroxidase in salt-stressed plants. Thus, chitosan application alleviated the oxidative injury, observed by lower malondialdehyde and H2O2 levels, thereby preserving membrane stability and improving antioxidant capacity and salt tolerance. In 50 mM NaCl-treated plants, chitosan treatment increased the activities of CAT, SOD and APX enzymes by 2.63, 2.74 and 2.31-fold relative to the control, respectively. Furthermore, chitosan application prevents the disturbance in ion homeostasis, and therefore not only enhanced the contents of N, P, K, Mg and Fe but also decreased Na content under salinity. Collectively, chitosan treatment overcame the adverse effects of salinity in moringa by activating the antioxidant machinery and preventing disturbance in ion homeostasis.

1. Introduction

Moringa (Moringa oleifera Lam.) is native to Southeast Asia and extensively grown in the tropics and subtropics areas. It has become widespread, due to its capability for adaptation to different soil types and its multidisciplinary purposes for livestock and humans [1]. The moringa tree has nutritional and medicinal importance, and hence it has been used in human nutrition and therapy [2]. Belonging to the Moringaceae family, the moringa tree contains 13 types, although M. oleifera is the most interesting species, having an impressive extent of medicinal applications of high nutritional prominence worldwide [3]. It can be used as an anti-diabetic, antioxidant, anticancer, antimicrobial, and anti-inflammatory agent [4]. Furthermore, the leaves are rich in nutrient elements (Fe, Ca, P and K), sugars, vitamins, antioxidants and amino acids [5] and therefore are used to alleviate malnutrition in several countries [6]. In plants, moringa extract affects various physiological and biochemical processes [7] and therefore enhances plant growth and productivity [5] and alleviates the adverse effects of abiotic stresses [8].
Recently, the demand for moringa has increased, but plant growth has declined under abiotic stress conditions, more so under salinity [9,10]. The leaves of the moringa are rich in elements, having high a level of antioxidant, which can make the tree tolerant under saline conditions, and therefore it can survive better at 6 or 8 dS m−1 with a nominal reduction in growth [11,12]. Salinity is the major abiotic stress that endangers not only growth but also plant productivity, affecting morphological and physiological attributes [13,14]. It is well known that salinity decreases the plant’s capacity to extract water from the soil, and leads to ion accumulation such as Na+ and Cl in cell tissues at toxic levels [15]. The adverse effects of salinity are caused by oxidative stress and osmotic effects, caused by cellular ionic flux imbalance [16]. These unfavorable effects are mediated by the higher production of reactive oxygen species (ROS), which are participants in cell injury processes [17]. Consequently, plants exposed to salinity accumulate high malondialdehyde (MDA) levels, a marker of lipid peroxidation [18] and show high ion leakage, which causes membrane damage [8,14]. It is widely established that ROS-scavengers play vital roles in abiotic stress tolerance [7,16,19].
Naturally, the upregulation of the antioxidant system is a common process in plants exposed to environmental stresses to mitigate the oxidative injury [16,20], but unfortunately it is an insufficient method for tissue protection against that injury [7]. Therefore, exogenous intervention is required for further improvement of abiotic stress tolerance [21]. Several strategies have been reported to enhance salt-stress tolerance in plants [8,14,22,23,24]. Using eco-friendly materials in plant production is very important for sustainable cultivation and environment protection [25,26]. Therefore, enhancing salt-stress tolerance in plants via eco-friendly materials is of great interest for environmental protection and commercial applications.
Chitosan (CS; poly β-(1,4)-N-acetyl-D-glucosamine) is a natural cationic polysaccharide that is able to enhance plant productivity and quality [19,27] and ameliorate the adverse effects of abiotic stress [14,28]. The biodegradable, biocompatible, and cytotoxic nature of CS raises its importance for application in edible plant products [29]. Additionally, it has a positive impact on economic gains in the agricultural sector [30]. Several reports have revealed the enhancement effect of the foliar application of CS in growth attributes of several species such as Calendula tripterocarpa [31], Mentha arvensis [32] and Calendula officinalis [33]. Therefore, CS application, as a natural biostimulant, may be a good strategy to mitigate the salt stress in moringa. Despite the use of CS in plant improvement, little information has been found about its application in abiotic stress tolerance. Furthermore, scarce information about mitigating the salt stress in moringa using CS is available, and the underlying mechanisms of CS in the salinity-tolerance process in moringa has not yet been well investigated. Therefore, the current study was conducted to investigate the effect of CS treatment on salt- stressed M. oleifera and its underlying physiological and biochemical mechanisms.

2. Materials and Methods

2.1. Plant Materials

This experiment was conducted on the experimental farm of the Horticulture Department, Faculty of Agriculture, Tanta University, Egypt (Lat 30°47′18.00″ N, Lon 30°59′54.61″ E) during the 2020 and 2021 seasons. M. oleifera seeds were sown on March 1st in 30 cm diameter plastic pots filled with clay loamy soil which contained sand, 21.5%; silt, 38.9%; and clay, 39.6%. The soil chemical features were: EC, 1.84 dS m−1; pH 8.32; Mg, 11.5 meq L−1; Ca, 14.5 meq L−1; HCO3, 14 meq L−1; CaCO3, 1.33 meq L−1; total N, 0.26%; PO4, 0.041%; and K, 0.06%. After germination, the seedlings were irrigated with tap water until the beginning of the treatments. During the study, the average temperature was 29 ± 1 °C during the day and 16 ± 1 °C at night, relative humidity was 32 ± 5% during the day and 69 ± 5% at night, with a 13 h average photoperiod.

2.2. Salinity and CS Treatments

The seedlings were subjected to saline irrigation watering for 45 days after germination. Salinity treatments were 25, 50, and 75 mM NaCl. Irrigation started with 25 mM saline water and was increased by 25 mM for every irrigation, until reaching the desired level of salinity (75 mM in all cases). The seedlings were irrigated every 5 days with saline water (500 mL/pot) for two months. The pots were flushed once with tap water and every 3 irrigations with salt, to ensure salt homogeneity and to prevent the accumulation of salt. Control plants were irrigated with tap water only, at the same time as the saline water treatments. A medium molecular weight with 90% deacetylation CS (Egyptian Company for the Manufacturing and Packing of Chitosan) was used in the current study. CS was applied as a foliar spray treatment at 1% concentration (10 g/L). A sample of 10 g of CS was dissolved in acetic acid until complete dissolution, and then distilled water was added to reach a volume of 1 L. The solution was then stirred until a uniform emulsion formed. CS application was started one day after the salinity treatment and continued for two months, as with the salinity. CS treatment was performed in the morning and plants were sprayed until the run-off point. The design of this experiment was completely randomized. The study contained seven treatments with three replicates each. Each replicate consisted of four pots; thus, each treatment had 12 pots.

2.3. Growth Attributes Measurements

After two months of treatment, data were collected. Plant height, number of leaves/plant, fresh and dry shoot weights and fresh and dry root weights were measured. Furthermore, samples were collected and stored at −80 °C until physiological and biochemical analysis was carried out.

2.4. Photosynthetic Pigments Assessment

The methodology reported by Metzner et al. [34] was followed for chlorophyll and carotenoid determination. In brief, a fresh leaf sample (0.2 g) was treated with 50 mL of 80% acetone and after this the extract was centrifuged at 15,000× g for 10 min. The absorbance of the extract was measured by a spectrophotometer (Cole-Parmer Ltd. Stone, Staffs, UK, ST15 0SA Model 7205) at 663, 645 and 470 nm for chlorophyll a, b and carotenoids, respectively. The values were recorded as mg g−1 , based on fresh weight (FW).

2.5. H2O2 Production

A hydrogen peroxide content assay was performed using the method of Patterson et al. [35]. Samples of 0.5 g leaf tissue were milled in 6 mL chilled acetone (100%), and then centrifuged at 4 °C for 10 min at 12,000× g. An extract sample of 1 mL was then added to 0.1 mL Ti(SO4)2 at 5% and a solution of NH4OH (0.2 mL), which was centrifuged for 10 min at 3000× g. After this, the pellet was dissolved in four ml sulfuric acid (2M). The optical density was finally measured at 412 nm. Several concentrations of H2O2 were prepared, to create a standard curve for calibration, and data were presented as µmol g−1 FW.

2.6. Lipid Peroxidation Assessment

The method described by Hodges et al. [36] was followed to assess lipid peroxidation as MDA content. Fresh leaf samples (0.2 g each) were homogenized in 0.1% trichloroacetic acid (2 mL) and then centrifuged for 15 min at 14,000× g. A volume of 2 mL aliquot was added to 5% trichloroacetic acid and 3 mL thiobarbituric acid (0.5%) and placed for 30 min in hot water. After that, the mixture was cooled on ice to stop the reaction and then centrifuged for 15 min at 5000× g. The optical density was finally investigated at 450, 532, and 600 nm. The content of MDA was measured, and calculated as μmol ml−1 as follows: MDA content = 6.45 × (A532 − A600) − 0.56 × A450, since Ax expresses the optical density.

2.7. Membrane Stability Index (MSI)

This was assessed following the methodology of Sairam et al. [37]. Two leaf samples (0.2 g each) were placed in 2 different flasks (50 mL each) containing deionized water (20 mL). After that, the 1st flask was kept at 40 °C for half an hour ,while the 2nd one was kept in a water bath (100 °C) for 15 min. Finally, the conductivity of both samples (C1 and C2) was measured, and ions leakage was then used to determine MSI, as follows:
MSI = [1 − (C1/C2)] × 100.

2.8. Total Carbohydrates

The total carbohydrates were determined following the method described by Yemm and Willis [38], using anthrone reagent. In brief, powdered leaf samples (0.5 g) were milled in 80% methanol (10 mL) and then centrifuged for 10 min at 3000× g. The resulting supernatant was kept, and the same solvent volume was used to re-extract the pellet. An equal volume of petroleum ether was added to partition the pooled supernatant for chlorophyll elimination. In a test tube containing 1 mL of the resulting extract, anthrone reagent (4 mL) was added and boiled in a water bath for 10 min. The mixture was then cooled to room temperature. The optical density was monitored at 625 nm by a spectrophotometer (Cole-Parmer Ltd. Stone, Staffs, UK, ST15 0SA Model 7205). The total carbohydrate content was determined, using a standard of glucose.

2.9. Proline Determination

Proline content was measured following the methodology of Bates et al. [39]. A frozen sample (0.5 g) of leaf tissue was homogenized in 3% sulfosalicylic acid (10 mL) at 4 °C. The extract was then filtered using Whatman No. 2. In a test tube, 2 mL of each filtrate, glacial acetic and acid acid-ninhydrin was mixed and incubated for 1 h at 100 °C and then the mixture was placed on ice to terminate the reaction. After this, 4 mL of toluene was used to extract the reaction mixture, and a separation of the chromophore-containing toluene from the hydrated phase was carried out. The optical density was spectrophotometrically investigated at 520 nm, using toluene as a blank. The proline level was determined based on a standard curve, and was presented as µmol g−1 FW.

2.10. Total Phenol Content Assay

Each powdered leaf sample (1 g) was extracted in 5 mL methanol (80%) by continuous stirring for 48 h. The solvent was then evaporated, and the resulting extract was placed at 4 °C to assay the total phenols [40]. A sample of 0.5 mL of diluted extract (1:10 g mL−1) or gallic acid as a standard was blended with a reagent of Folin-Ciocalteu (5 mL, 1:10 diluted with distilled water) and 1 M sodium carbonate (4 mL). The total phenols were spectrophotometrically monitored at 765 nm and expressed as g GAE kg−1 DW.

2.11. Antioxidant Enzyme Assays

A leaf sample (0.5 g) was homogenized in 5 mL of 50 mM sodium phosphate buffer (pH 7.5) containing 1 mM phenylmethylsulfonyl fluoride (PMSF). The extract was then centrifuged at 4 °C for 20 min at 12,000× g. The obtained supernatant was used to assay the enzyme. The method reported by Chandlee and Scandalios [41] was followed, to measure CAT (catalase, EC 1.11.1.6) activity. Each enzyme extract sample of 0.04 mL was mixed with 0.4 mL H2O2 (15 mM) and 2.6 mL of potassium phosphate (pH 7.0) buffer (50 mM). Finally, the decomposition of H2O2 obtained was investigated by determining the absorbance reduction at 240 nm. The activity of the CAT enzyme was presented as U mg−1 protein, since 1 U = decline of 1 mM of H2O2 in one minute per mg protein. Superoxide dismutase (SOD, EC 1.15.1.1) activity was investigated by determining its ability to suppress the photochemical reduction of nitroblue tetrazolium (NBT). The absorbance was monitored at 560 nm, using a spectrophotometer (type GBC, UV/VIS 916) according to Giannopolitis and Ries [42]. The SOD enzyme activity was expressed as SOD units in one minute per mg protein, where one unit was the enzyme amount required to inhibit 50% reduction of NBT.
The methodology of Nakano and Asada [43] was followed to measure ascorbate peroxidase (APX, EC 1.11.1.11) activity. Each leaf sample (0.1 g) was homogenized with 0.2 mL of extraction buffer (0.1 M Na-phosphate, pH 7.0, 3.0 mM EDTA, 1.0% polyvinylpyrrolidone [PVP], 1.0% Triton X-100) and then centrifuged for 20 min at 10,000× g. The reduction in absorbance at 290 nm, caused by enzymatic breakdown, was used to determine APX activity. The reaction buffer contained 0.05 mL of extract containing enzyme, 0.1 mM H2O2, 0.5 mM ascorbate and 0.1 mM EDTA ml−1 and the reaction was carried out for 5 min at 25 °C. To calculate APX activity, the coefficient of absorbance 2.8 mM−1 cm−1 was applied. The activity of the APX enzyme was determined as unit per mg protein where, one unit of APX enzyme is able to decompose 1.0 µmol of ascorbate per one minute.

2.12. Radical Scavenging Capacity (DPPH Assay)

The scavenging activity was assessed using the reagent of 1.1-diphenyl-2-picryl-hydrazyl (DPPH), following the method of Brand-Williams et al. [44]. The leaf extract was soluble in 85% aqueous methanol, and several levels of extract were prepared, viz. 1, 2, 3 and 4 µg mL −1. Approximately 0.5 mL of the extract was added to 1.5 mL of methanolic solution of DPPH (20 µg.mL−1), and stirred well, in the dark. After 30 min of reaction, the decolorizing process was monitored and compared with a blank at 517 nm. The DPPH activity was determined as the inhibition percentage (I%) and was measured as follows:
I (%) = 100 × (A blank − A sample)/A blank
where A is the absorbance of either the blank or the sample. The antiradical activity (IC50) was considered when the extract level generated 50% inhibition.

2.13. Mineral Content

Desiccated leaf samples were ground into a fine powder and then digested, using a mixture of perchloric acid and sulfuric acid (1:5 v/v, respectively) as described by AOAC [45]. The determination of N, P, and K contents in leaf tissues was performed using the abovementioned digestion solution. The measuring of N was conducted using the micro-Kjeldahl apparatus as described by Nelson and Sommers [46]. Phosphorus content was measured using a spectrophotometer (Pharmacia, LKB-Novaspec II) following the blue color ,according to the method of Jackson [47]. K and Na elements were estimated by flame emission photometry (Corning, Tewksbury, MA, USA). Mg and Fe contents were measured using atomic absorption spectrophotometry (Varian 220Z, Mul-grave, Melbourne, Australia).

2.14. Statistical Analysis

The data from both seasons were pooled and then the combined analysis was performed. The costat program v x86 (cohort6\clapboarded) was used to perform an ANOVA table. The separation of means was accomplished by an LSD test [48], at p ≤ 0.05. The results were expressed as means ± SD (n = 6).

3. Results

3.1. Plant Height and Leaf Number

Data in Figure 1A,B clearly indicate that both plant height and leaf number of M. oleifera L. plants was significantly (p ≤ 0.05) decreased with increasing levels of salinity in comparison with the control. Relative to the control, plant height decreased by 13.08, 23.77 and 35.83% while leaf number decreased by 26.67, 42.22 and 53.33% in plants exposed to 25, 50 and 75 mM NaCl, respectively. Meanwhile, chitosan application markedly enhanced both attributes under salt stress and alleviated the adverse salinity effects. In plants exposed to 25, 50 and 75 mM NaCl and treated with chitosan, the plant height reduction was 1.87, 8.10 and 16.51%, while the leaf number reduction was 11.11, 24.44 and 40% compared with the control, respectively.

3.2. Fresh and Dry Weights of Shoots and Roots

Plants exposed to salinity showed significantly lower weights of shoots and roots than those recorded by the control (Figure 2). Increasing the salinity level from 25 to 75 mM gradually decreased the fresh and dry weights of both leaves and roots, and the minimum values in this respect were recorded with the treatment of 75 mM NaCl. However, plants exposed to salt stress and sprayed with chitosan had significantly higher fresh and dry weights of both leaves and roots than those treated with salinity only. Compared with the untreated control, the fresh and dry weights of leaves were reduced by 51.44 and 48.74% in 75 mM-treated plants, while they were 33.61 and 35.72% in 75 mM salinity plus chitosan treated plants. The same direction was noticed in roots, as fresh and dry weights were reduced by 46.27 and 55.45% in 75 mM-treated plants, while they were 31.60 and 33.80% in 75 mM salinity plus chitosan treated plants, respectively.

3.3. Photosynthetic Pigments

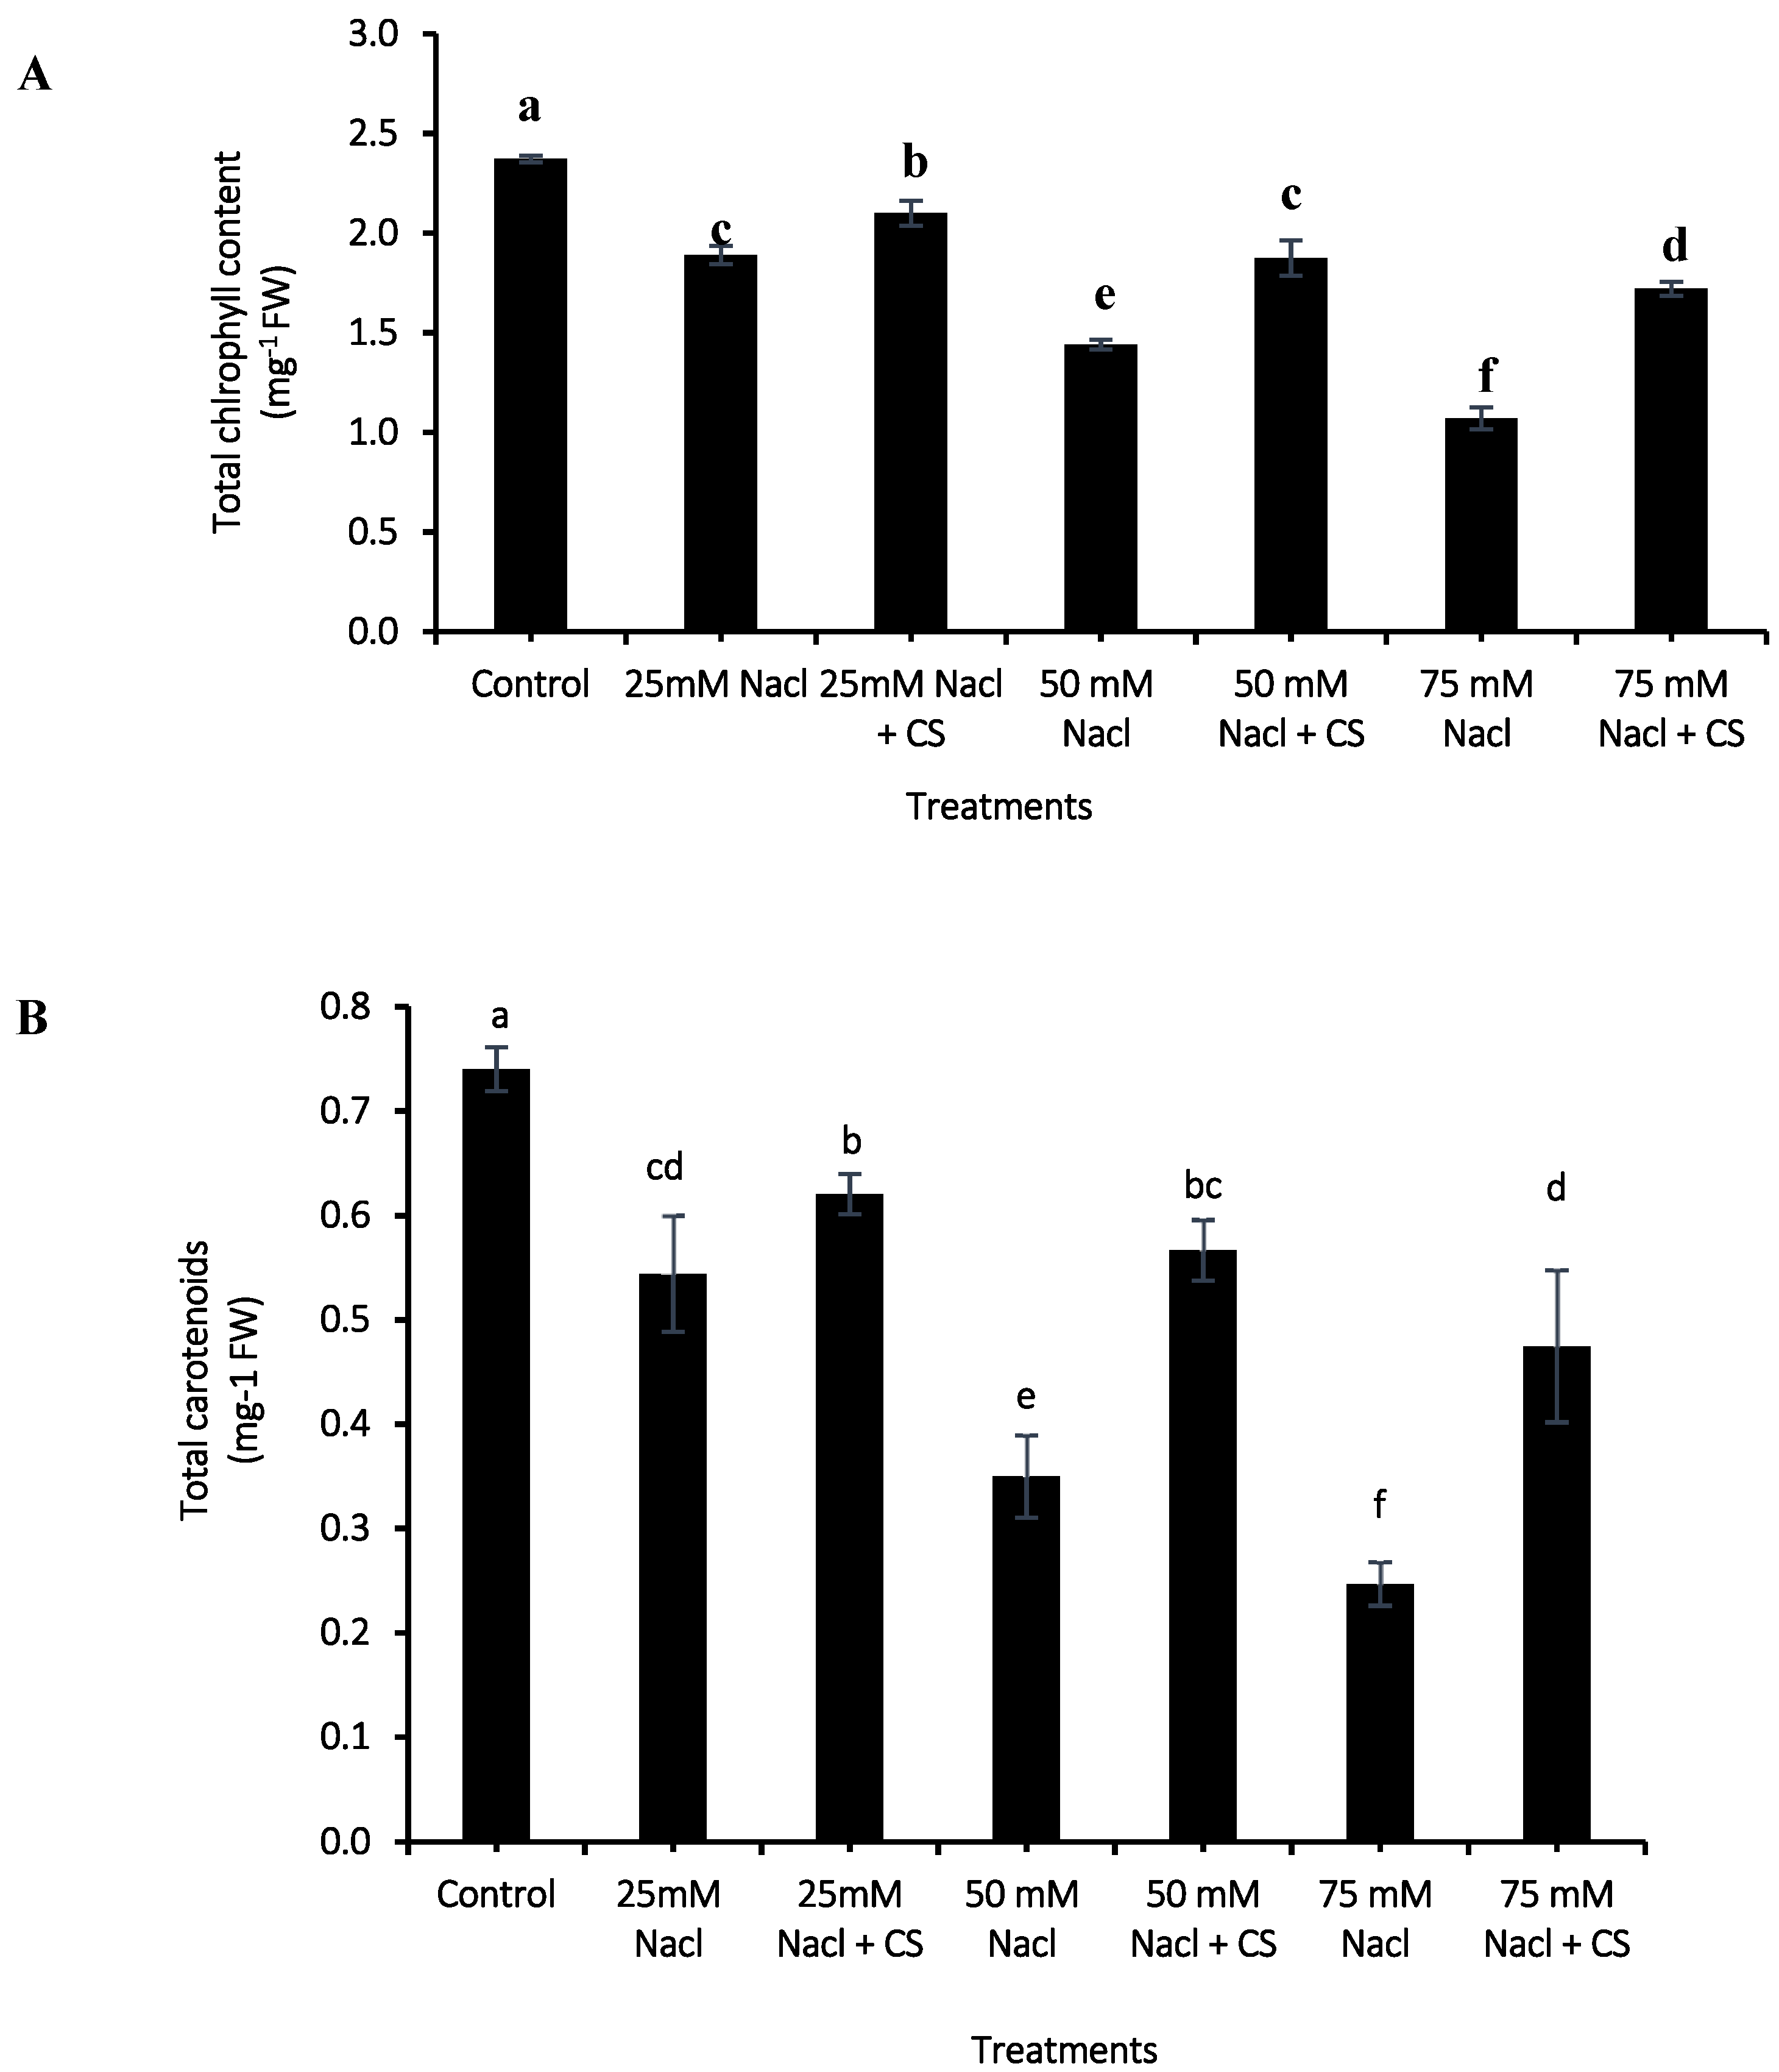
The deleterious effects of salinity on photosynthetic pigments were clearly observed, as salt-stressed plants produced significantly (p ≤ 0.05) lower chlorophyll and carotenoid levels than those in the control. Conversely, chitosan treatment ameliorated the adverse effects of salinity, and successfully prevented chlorophyll and carotenoid losses in the salinity plus chitosan treated plants (Figure 3). The highest salinity dose (75 mM NaCl) resulted in the lowest photosynthetic pigments. In comparison with the control, plants exposed to that level had 50.19 and 53.81% lower chlorophyll and carotenoid concentrations, respectively; those in the 75 mM NaCl plus chitosan treatment were only 22.60 and 26.33% lower, respectively.

3.4. H2O2 Production

Figure 4A clearly indicates that H2O2 generation was significantly higher under any salinity level than in the untreated control. The highest H2O2 production was observed in 75 mM NaCl-treated plants as H2O2 generation was induced 2.30-fold, relative to unstressed plants. However, chitosan application effectively decreased H2O2 production in plants grown under any salinity level. Plants grown under 50 mM NaCl and sprayed with chitosan had similar levels of H2O2 to those in the control. Furthermore, chitosan-treated plants that were exposed to 75 mM NaCl recorded only 1.49-fold higher H2O2 production compared with unstressed plants.

3.5. Malondialdehyde (MDA) Content

Data presented in Figure 4B show that all salinity treatments caused a significant (p ≤ 0.05) increase in MDA accumulation in moringa leaves compared to that found in unstressed plants. A gradual increase in MDA content was observed with increasing salinity level from 25 to 75 mM NaCl. In contrast, chitosan treatment led to a significant reduction in MDA content in plants exposed to salinity. Plants exposed to the highest level of salinity increased MDA concentration 3.59-fold over the control, although after chitosan application plants accumulated significantly less MDA (60.33% lower) than salt-stressed plants.

3.6. Membrane Stability Index (MSI)

The membrane stability markedly decreased with increasing salinity level, and reached its maximum value at 75 mM NaCl, compared with the control. Significantly lower membrane stability was observed in salt-stressed plants, while after chitosan application, membrane stability was significantly higher than that in salt-stressed moringa, suggesting that chitosan prohibited this effect under salt-stress conditions (Figure 4C).

3.7. Total Carbohydrates

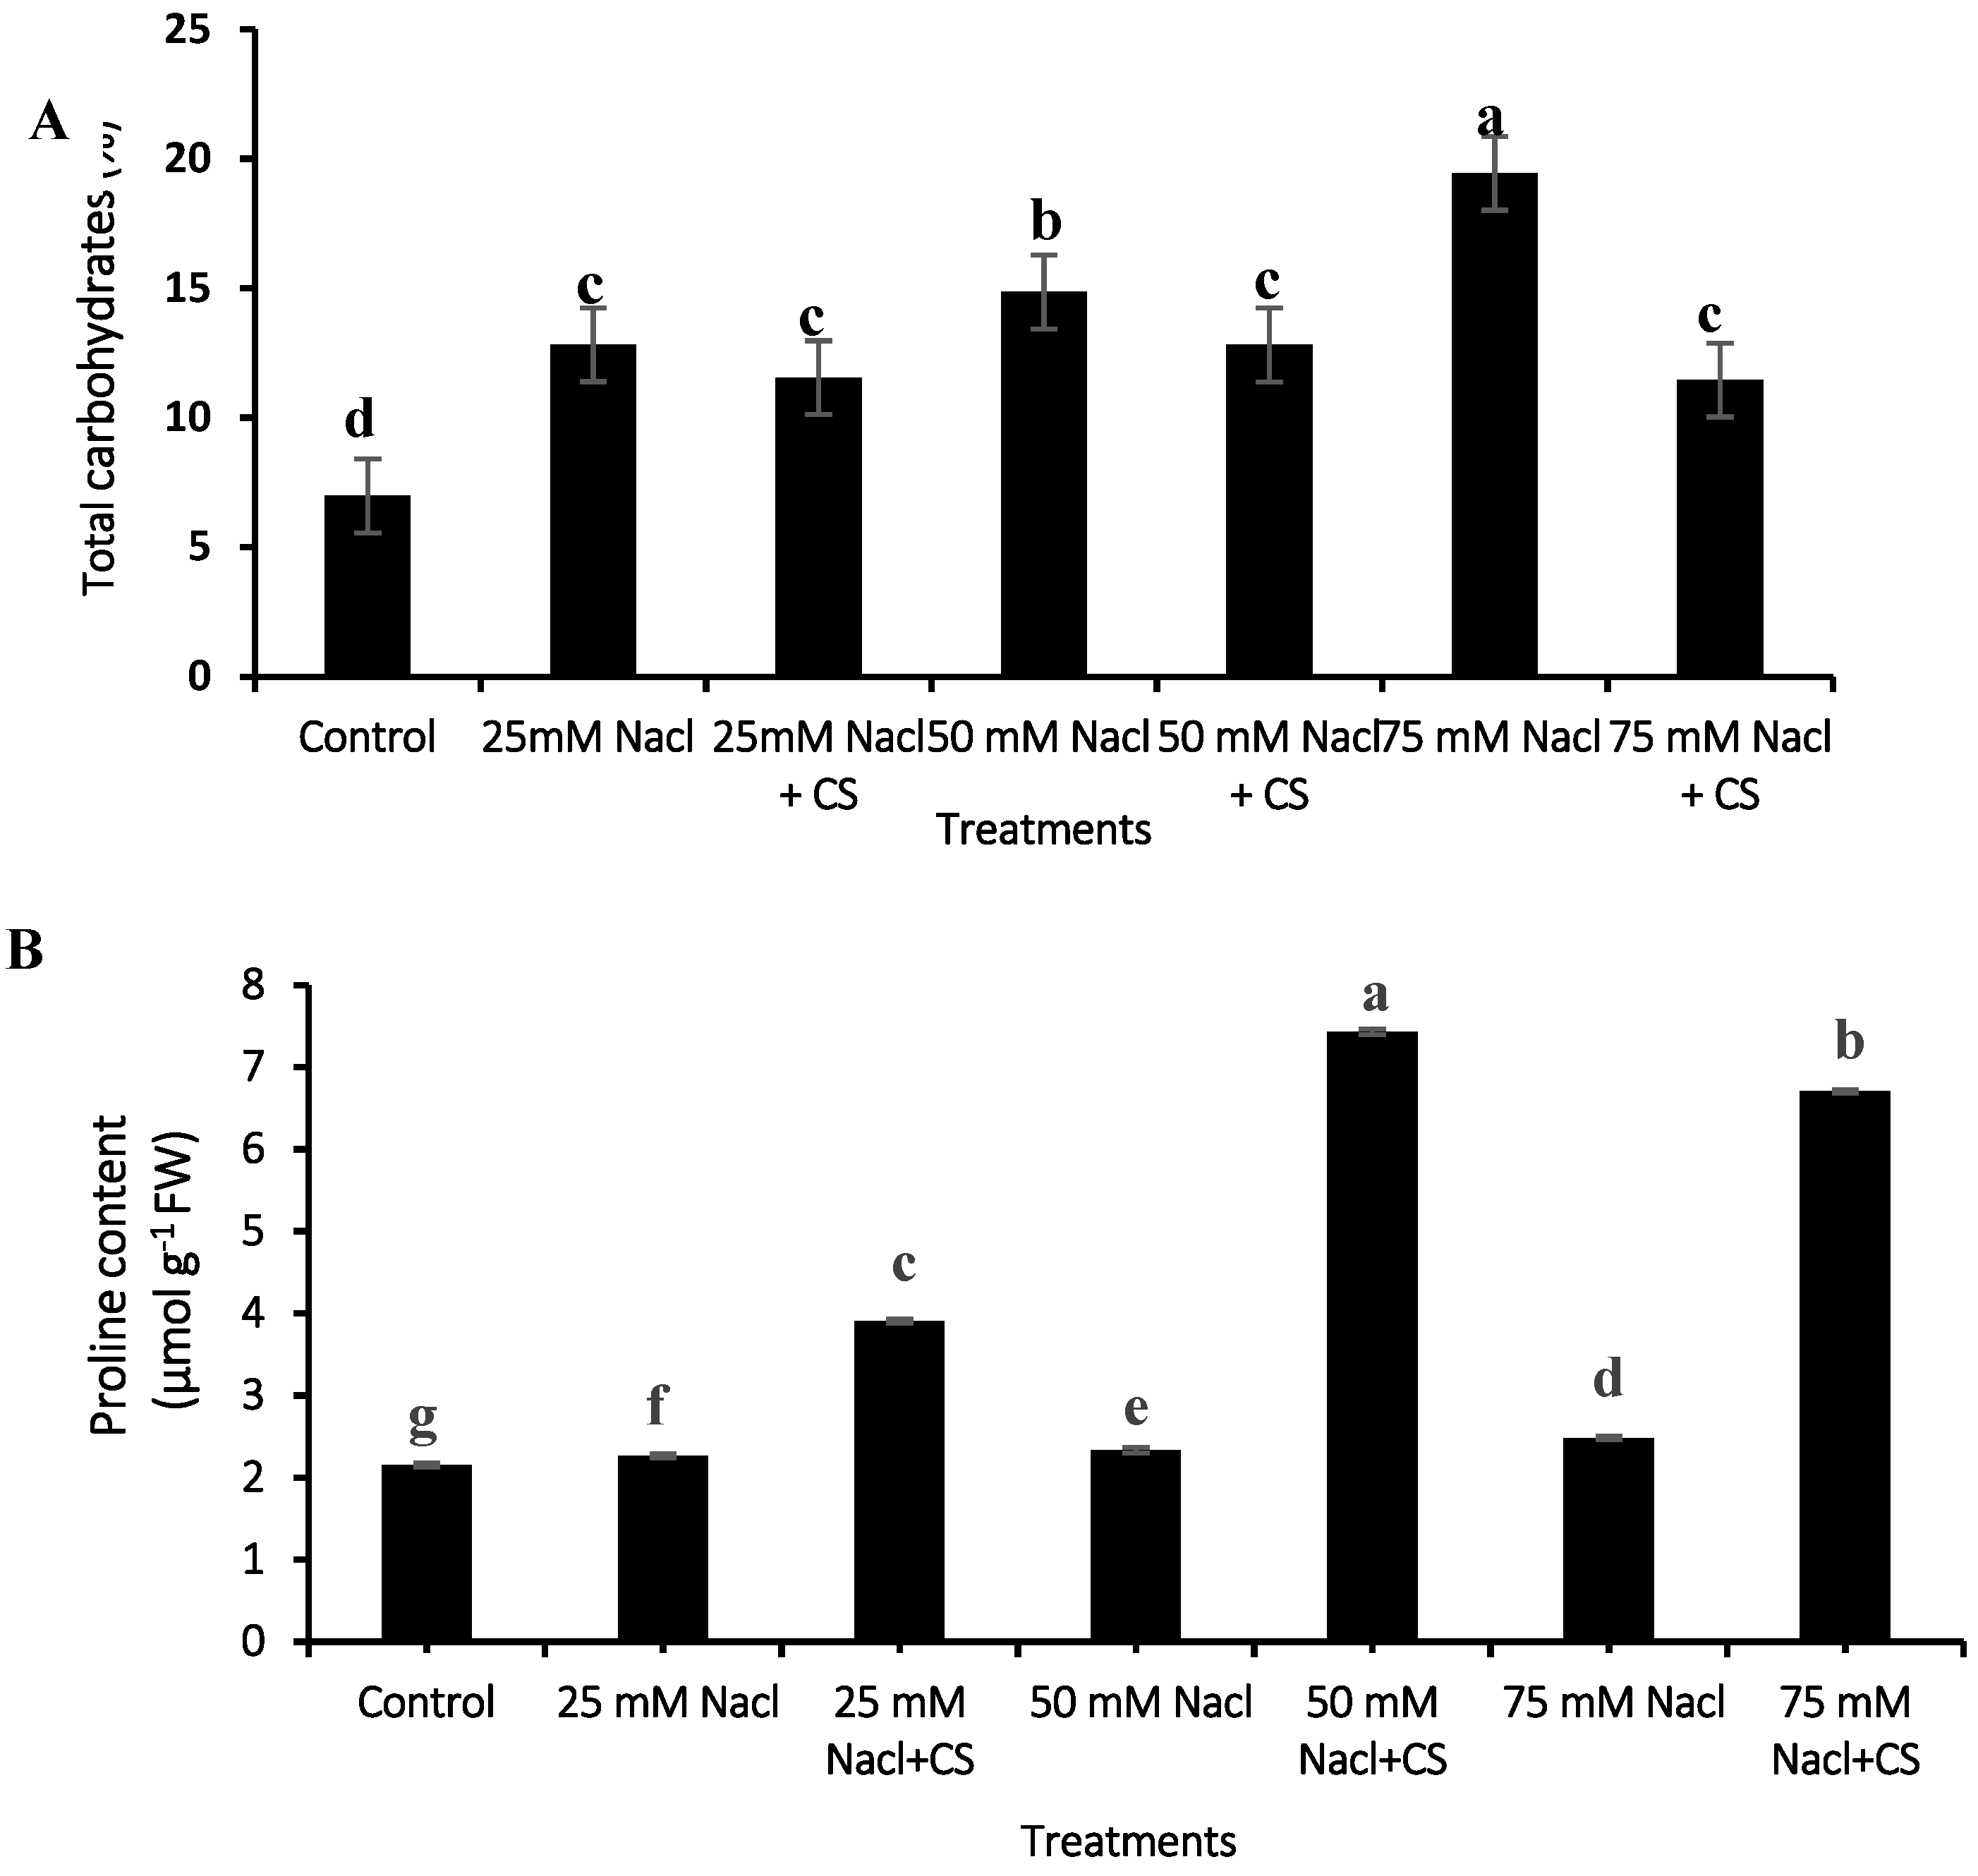
Results in Figure 5A reveal that increasing salinity levels from 25 to 75 mM resulted in a gradual increase in total carbohydrate percentage and the differences were significant compared with the control. The total carbohydrate percentage was 1.83, 2.12 and 2.78-fold higher than that of the control when the treatments of 25, 50 and 75 mM NaCl were applied, respectively. A significant increase was also detected in salt-stressed plants treated with chitosan, compared with the control, however; the impact of salt stress on increasing total carbohydrates was higher than that of chitosan.

3.8. Proline Content

The proline content in moringa leaves was significantly increased in plants grown under different salinity levels in comparison with unstressed plants. A considerable increase was also observed with chitosan foliar application under salinity. Plants exposed to 50 mM NaCl + chitosan recorded the highest proline content (Figure 5B). Compared to the control, plants exposed to 75 mM NaCl + chitosan had 3.45-fold higher proline; the proline in the 50 mM NaCl treatment was only 1.08-fold higher.

3.9. Total Phenol Content

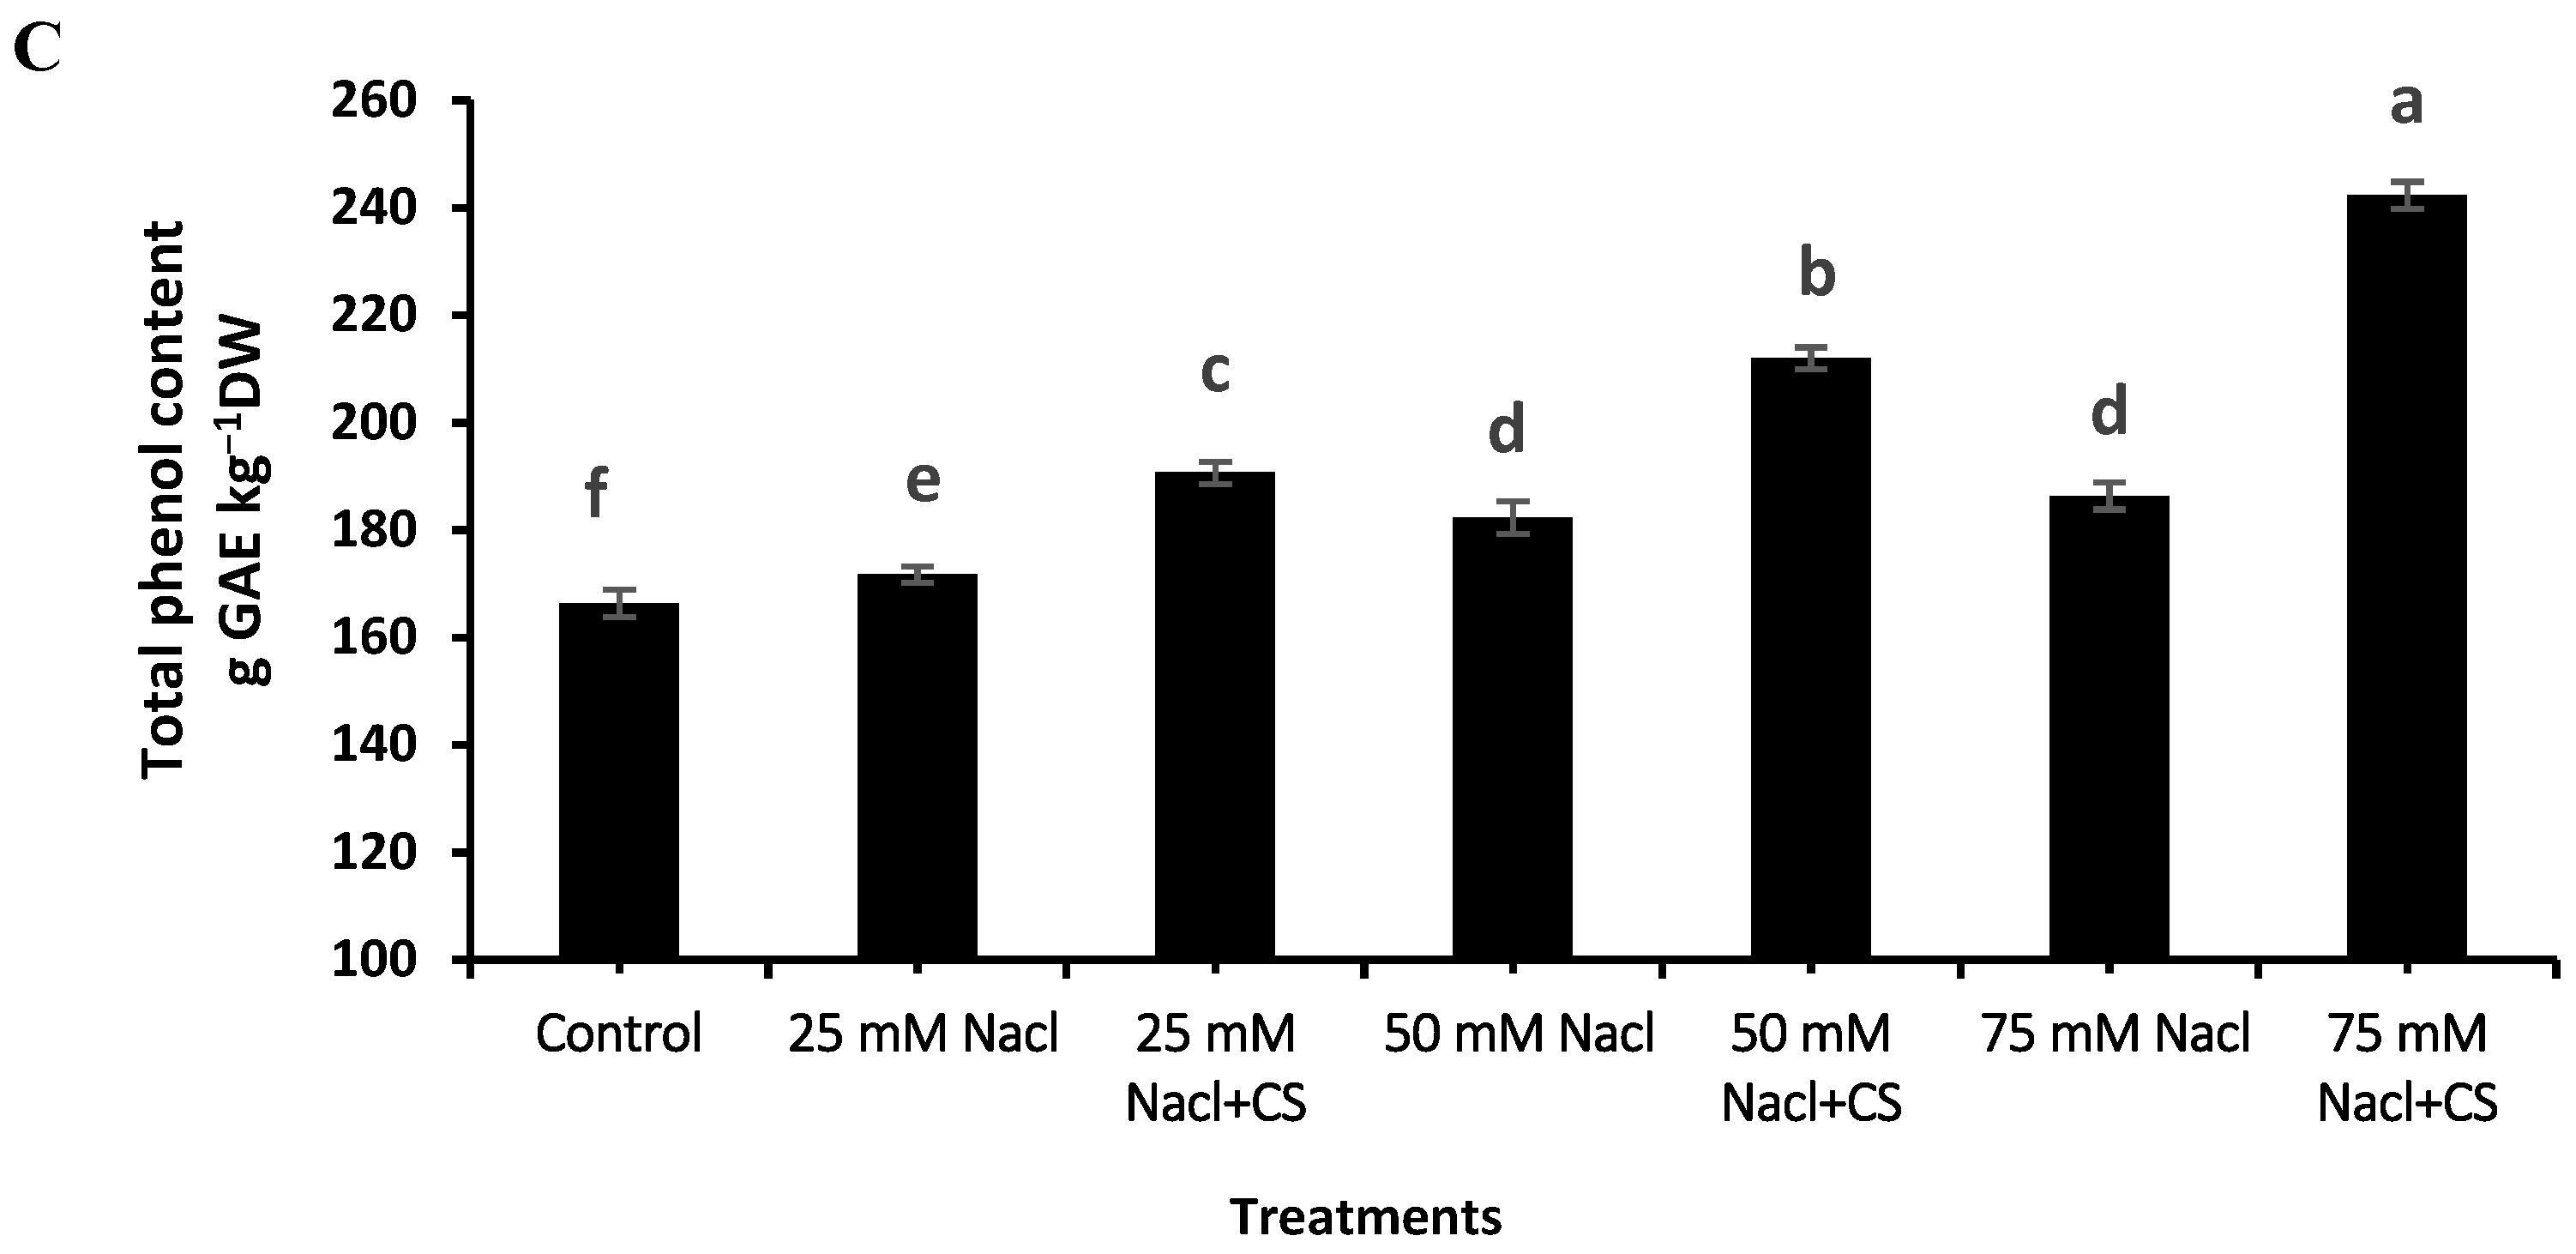
Figure 5C clearly shows that phenol content was significantly higher under any salinity level than in the untreated control. The highest phenol content was observed in 75 mM NaCl-treated plants, however; there were no differences between 50- and 75-mM treatments in this regard. Additionally, chitosan application effectively increased the phenol content in plants grown under any salinity level. Moringa plants exposed to a combined treatment of 75 mM NaCl and chitosan increased the total phenolics by 145.69%; in the 75 mM NaCl treatment this was only 112.02% compared with the control.

3.10. Activity of Antioxidant Enzymes

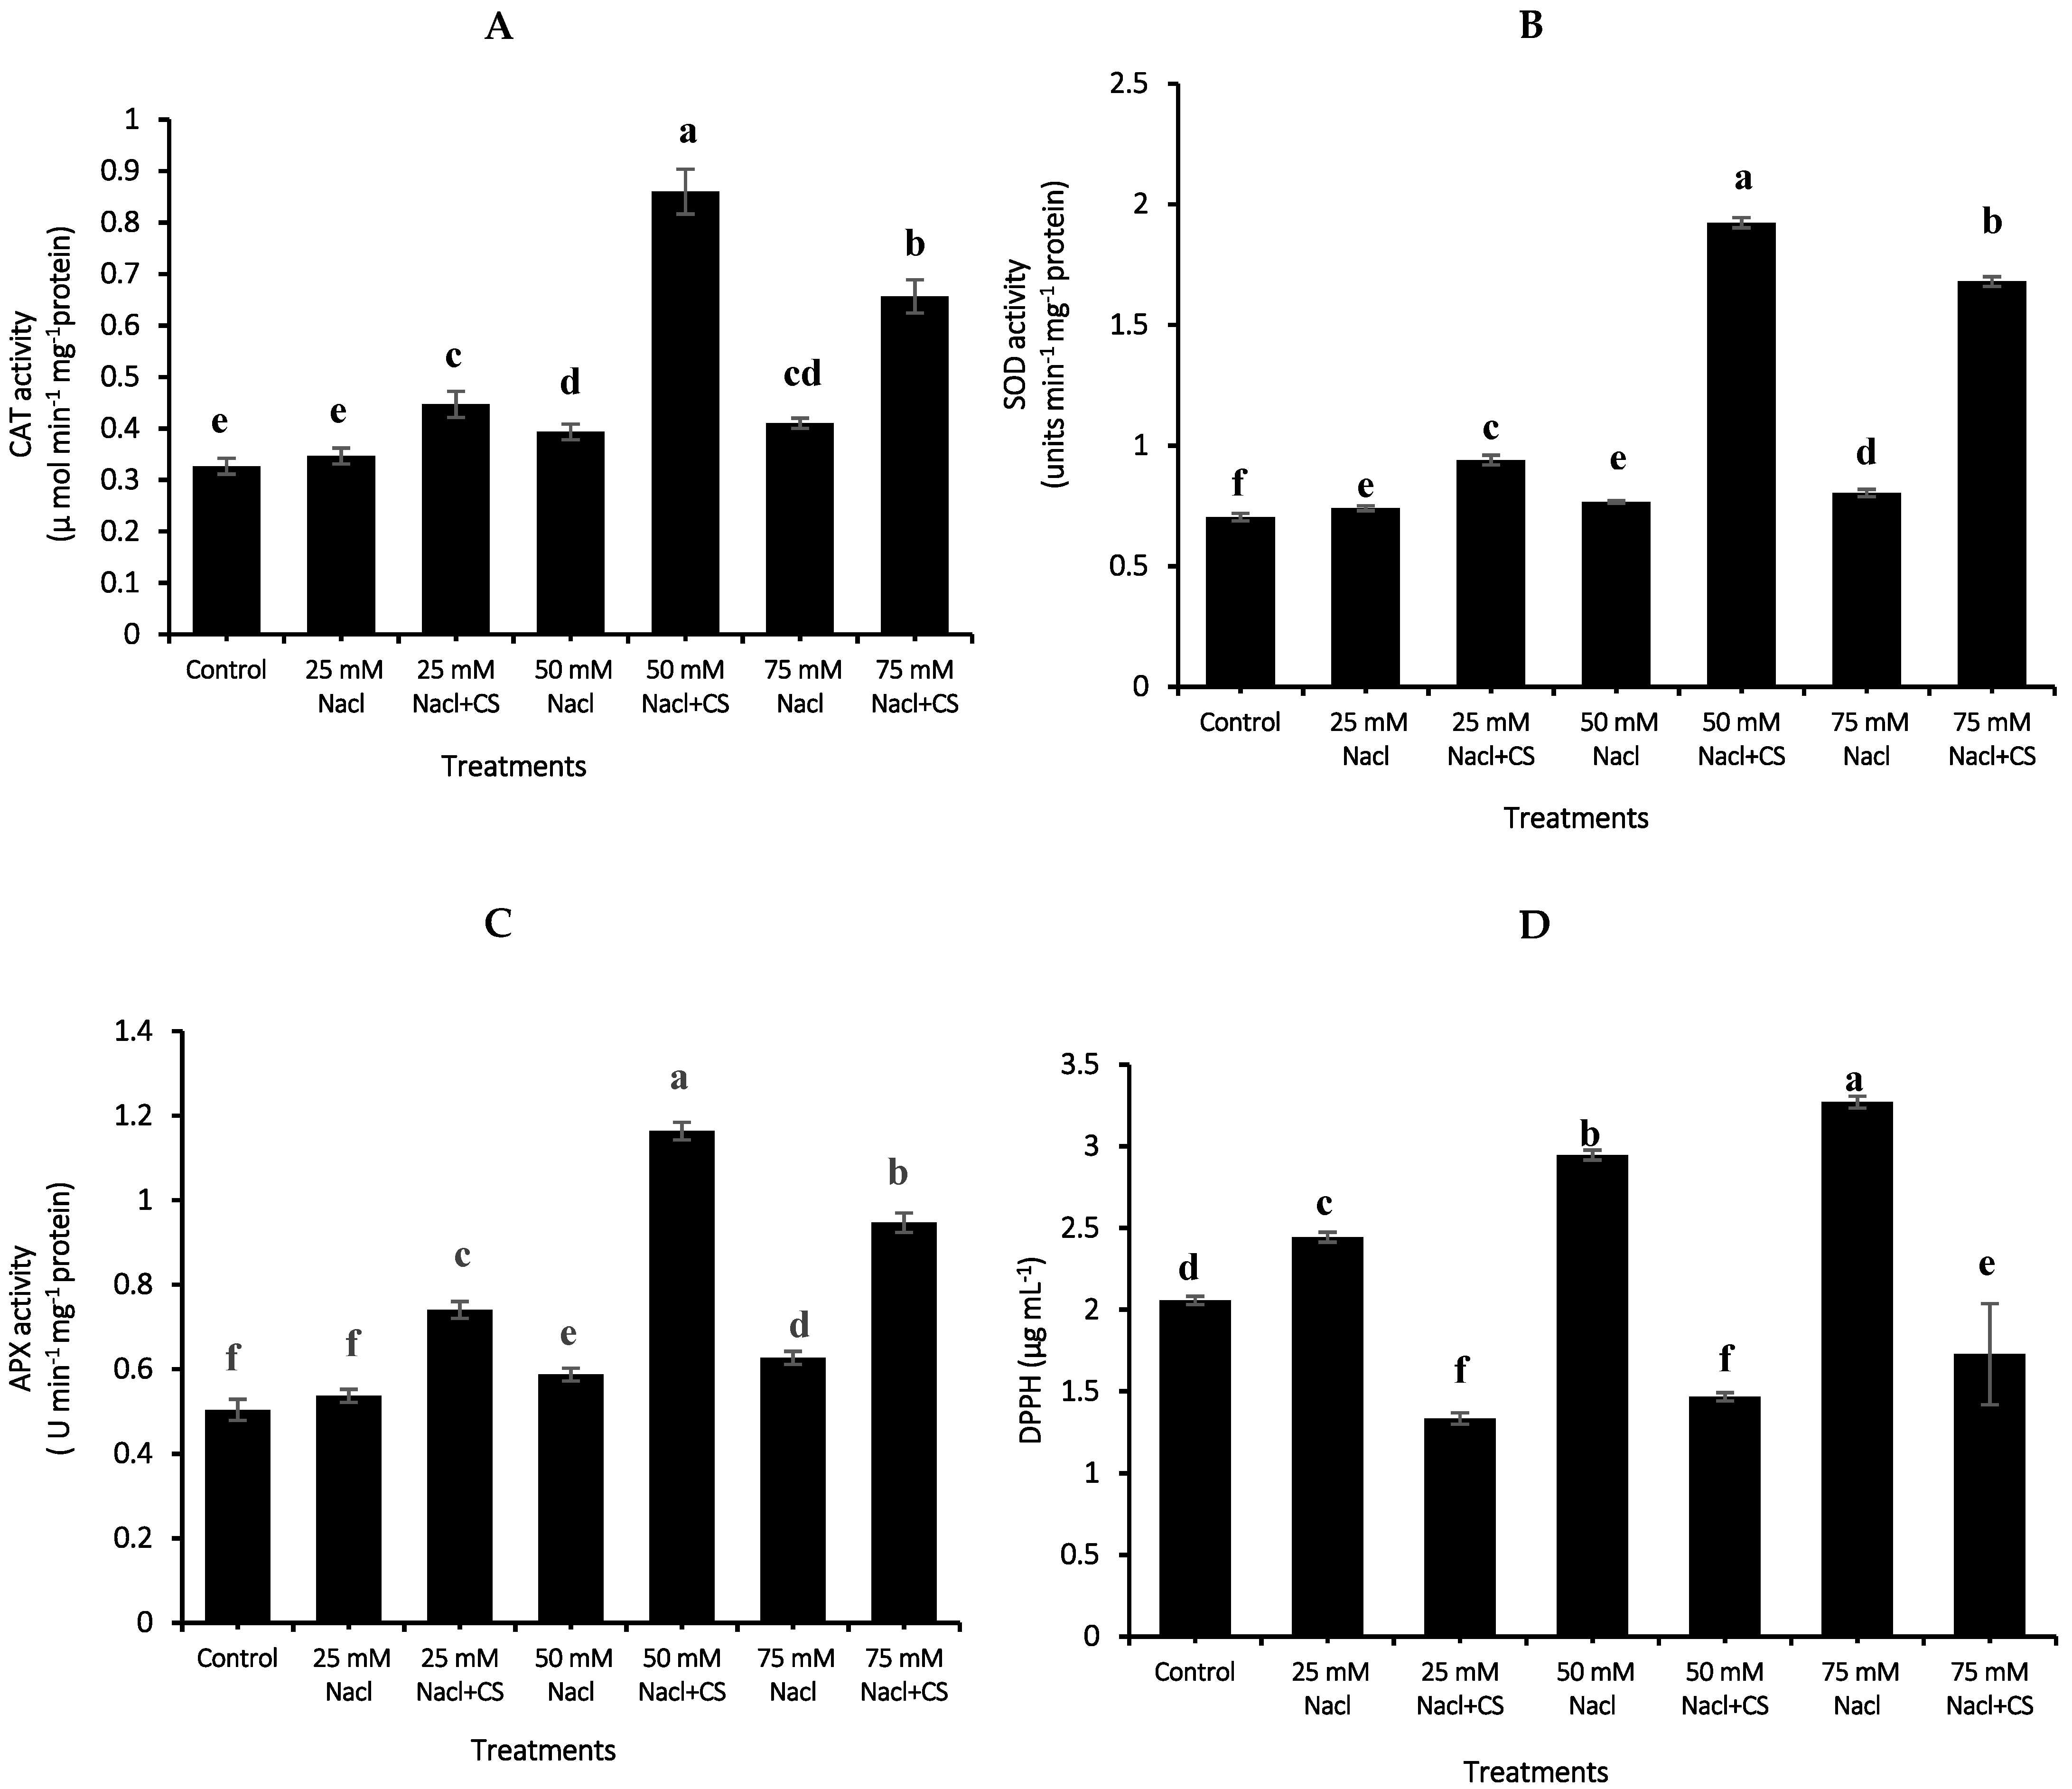
Data presented in Figure 6A–C show that in salt-stressed (50 and 75 mM NaCl) moringa, significantly higher enzyme activities of CAT, SOD and APX were detected compared with those in the control (Figure 4). Otherwise, plants exposed to the lowest salinity level recorded the same CAT and APX enzyme activities as the control. The application of chitosan further enhanced enzyme activities under salinity, more so in 50 mM NaCl-treated plants. Under the treatment of 50 mM NaCl + chitosan, the activities of the CAT, SOD and APX enzymes recorded 2.63, 2.74 and 2.31-fold higher values relative to the control plants, respectively.

3.11. Radical Scavenging Activity (DPPH)

Plants grown under salinity show significantly lower antioxidant capacity (higher DPPH values), measured by DPPH activity, than those recorded by the control (Figure 6D). Increasing the salinity level from 25 to 75 mM gradually decreased the antioxidant capacity, and the minimum values in this respect were recorded by the treatment of 75 mM NaCl. In contrast, plants exposed to salt stress and sprayed with chitosan had significantly higher antioxidant capacity than those treated with salinity only. Plants treated with 25 or 50 mM NaCl + chitosan recorded the highest antioxidant capacity.

3.12. Mineral Content

Results in Table 1 show that the N, P and K percentages in M. oleifera leaves were gradually and significantly decreased, due to increasing salinity levels compared with the control. Additionally, Mg and Fe contents were markedly decreased due to salinity treatments, compared with the control. The highest reduction in these elements was observed in 75 mM NaCl-treated plants. However, a significant increase in Na content was recorded in salt-stressed plants in comparison with unstressed plants. In 75 mM NaCl-treated plants, Na content was 3.77-fold higher than in the control. In contrast, chitosan treatment considerably enhanced the content of N, P, K, Mg and Fe, and decreased Na content under salt-stress conditions.

4. Discussion

This study investigated the effects of chitosan on salt -tress alleviation in M. oleifera. Plant height, leaf number, and the weights of both leaves and roots were decreased, due to salt stress. Growth inhibition in salt-stressed moringa may be due to ionic and osmotic stress, reduction of cell division and enlargement, metabolic disturbance or reduced photosynthesis [13,20]. The uptake of water and some essential nutrients were restricted under salinity, plant growth was inhibited [49] and therefore a reduction in growth attributes was observed. In agreement with these results, the adverse effects of salt stress on growth characters have been reported [16]. The suppression of growth attributes under salinity has been also found in M. oleifera [50], Vitex trifoliaPurpurea’ [51] and the damask rose [8]. In contrast, foliar application of chitosan in moringa enhanced plant growth under salinity. The impact of chitosan on growth promotion is probably ascribed to the fact that chitosan controls a sequence of metabolic pathways such as carbon and nitrogen metabolism [52] and also stimulates several pathways of hormone signaling, such as those for gibberellins and auxin [53], thereby contributing to growth improvement. In accordance with the current results, a positive correlation was observed between chitosan treatment and growth promotion in chamomile [27]. The current results agree with the findings of previous studies, which concluded that chitosan application has a growth-promotion effect and the requisites for dealing with growth reduction caused by salt stress in several species, such as Silybum marianum [53], Catharanthus roseus [14] and rose [54].
Photosynthetic pigments also decreased under salinity, supporting the previous results of several researchers, who reported similar reductions in several species exposed to salty conditions [8,55]. The decrease in chlorophyll under salty conditions may be ascribed to the salt-induced activity of the chlorophyllase enzyme, which participated in the process of chlorophyll degradation [56]. On the other hand, the reduction in Mg uptake under salinity may be involved in chlorophyll reduction [57]. A similar reduction in photosynthetic pigments due to salt stress was also observed in jojoba [13], some ornamental species [58] and M. oleifera [9]. In contrast, chitosan application enhanced the photosynthetic pigments in moringa leaves under salinity treatment. The alleviation of the deleterious effects of salinity on growth due to chitosan may be explained by the fact that chitosan application resulted in an improvement of photosynthetic pigments and increased uptake of Mg, which is a main component of the chlorophyll molecule [59]. It has been reported that higher chlorophyll concentrations are associated with improved growth [5]. CS has an impact on chloroplast gene expression, and therefore increases the chloroplast size and enlargement, which may be one factor leading to the increase of the chlorophyll content [60]. It has been found that CS application leads to increase stomatal opening, CO2 concentration integrated cells and stomatal conductance [59] which may be another factor able to increase chlorophyll content. An enhanced content of photosynthetic pigments following chitosan application has also been also observed in several species [61,62].
In the current study, the salt-stressed moringa plants exhibited higher H2O2 and MDA levels, which means that plants under salinity are exposed to oxidative stress that causes lipid peroxidation. Meanwhile, chitosan application significantly reduced both indicators of oxidative stress and lipid peroxidation in plants grown under salt stress. The peroxidation of polyunsaturated fatty acids of cell membrane results in MDA accumulation as a product of lipid peroxidation [8]. It is known that overproduction of ROS under salinity injures cellular macromolecules, which finally causes membrane deterioration and cell death [16]. Salt stress causes oxidative stress, due to redox imbalance between ROS and antioxidants [8,14]. In agreement with our results, lipid peroxidation induction by salinity-elevated ROS over-production has been proven in other species [16,55,63,64].
Decreasing lipid peroxidation following chitosan application may be ascribed to the decrease in H2O2 production, as our data indicated. Our results provide evidence that moringa plants treated with chitosan exhibited less ions leakage and hence better maintenance of membrane functions, indicated by higher MSI, suggesting that chitosan may act as an antioxidant ,which supports the previous reports on periwinkle and basil [14,19]. The chitosan antioxidant activity is mostly due to its hydroxylated amino group, which makes it a functional scavenger of ROS [65]. MDA reduction caused by chitosan application indicates reduced lipid peroxidation, and hence membrane integrity maintenance, which possibly contributes to salinity tolerance [66]. Reduced oxidative stress and lipid peroxidation, and thus preservation of the cell membrane by means of chitosan treatment has been observed in Stevia rebaudiana [67] and Calendula tripterocarpa [31].
Herein, the total carbohydrates markedly increased in salt-stressed moringa plants, and a further increase was observed following chitosan treatment. This increment may occur to regulate the osmotic potential under salinity conditions [68], or to sustain metabolism and prolong the energy supply for better recovery after stress relief [69]. In this way, the activity of sucrose phosphate synthase (a key enzyme in the sucrose synthesis pathway) increased under salinity, hence the total soluble sugars increased [70]. This result agrees with the previous reports on Hibiscus moscheutos [71] and liquorice [72]. Additionally, enhancing total carbohydrates in moringa leaves by chitosan application may be ascribed to the role of chitosan as a biostimulant in enhancing the growth and photosynthetic pigments, which in turn improves the total carbohydrate content. Such increase in total carbohydrates by chitosan treatment has been previously reported [27,53].
Proline plays a protective role against salt stress in plants, and therefore a higher proline level in salt-stressed moringa plants may be considered an adaptive mechanism under salinity. Proline acts as a free radical scavenger, compatible osmolyte, cell redox balancer, enzyme protectant, stabilizer for subcellular structures and cytosolic pH buffer to enhance salt tolerance [73]. In agreement with current results, proline content was markedly increased under salt treatment in rosemary [55], moringa [74] and the damask rose [8]. Interestingly, a synergistic effect between salinity and chitosan treatment was observed with respect to proline content. Thus, the fact that chitosan ameliorates the deleterious effects of salinity may be due to its stimulatory effect on proline accumulation. Similar reports have been published on milk thistle [53], stevia [75] and grapevines [76].
In this investigation, a higher number of total phenols was recorded in salt-stressed plants than in the control. Additionally, a further increase in phenol content was observed, due to chitosan application under salinity. Phenolic compounds have a scavenging ability of ROS [77] and therefore their levels are increased under stress as an adaptive mechanism under salt stress to scavenge the over-production of ROS. It has been reported that plants adapt to salt stress by maintaining homeostasis between ROS and phytochemicals such as polyphenols [8]. Increasing phenols under salinity has also been observed in M. oleifera [74] neem [77], and Thymus vulgaris [78]. It has been reported that chitosan treatment effectively enhances phenolic compound biosynthesis [27]. A positive correlation between chitosan application and phenol accumulation has been observed in thyme [79] and the damask rose [19]. Increasing total phenolics due to chitosan treatment has been reported also in rose [54], Ocimum basilicum [61] and stevia [75].
In this experiment, the activities of CAT, SOD and APX enzymes increased with salinity, and were further improved by chitosan treatment. It has been found that antioxidant metabolism is a vital defense process evolved by tissues to abolish ROS-generated damage [80]. It has been established that enzymatic antioxidants play a major role as ROS scavengers, and therefore they are essential in the mitigation of abiotic stress [8,14]. Strengthening of the antioxidant system under salinity has been documented in several reports [16,51,81], which are in agreement with our results. Despite the induction in CAT, SOD and APX activities in stressed moringa plants, this may be insufficient to provide adequate protection against ROS-generated injury, and hence the deleterious effects of salinity are not successfully retarded. Otherwise, the exogenous application of chitosan in this study further enhanced the enzymatic antioxidants, and effectively combated salinity stress in moringa. In this regard, chitosan induces the enzymatic antioxidants and effectively scavenges ROS, which enhances plant tolerance of salinity [53,66]. Similar findings have been reported in Origanum majorana [82], Catharanthus roses [14] and rose [54].
The DPPH activity was used to distinguish antioxidant capacity, and the results indicate that salinity treatment markedly increased DPPH activity (reduced antioxidant capacity). This result could be ascribed to the reduction in the efficiency of antioxidant machinery under salinity, proven by reducing both enzymatic (CAT, SOD and POX) and non-enzymatic antioxidants (sugars, proline, phenols). In accordance with the current results, the antioxidant capacity was reduced in salt-stressed peppermint [83] and the damask rose [8].Conversely, the antioxidant machinery was enhanced following chitosan application, which is reflected in the enhancement of the antioxidant capacity under salt stress conditions. In this connection, chitosan treatment increased the antioxidant capacity in chamomile [27] and stevia [75] which supports our results.
Herein, salinity treatment reduced the contents of N, P, K, Mg and Fe but increased Na content. It has been found that the accumulation of NaCl disturbs the ion homeostasis, which results in a decrease of the contents of essential elements in plant tissues [84], which is in agreement with the current results. Moreover, the reduction of P uptake under salinity may be attributed to the precipitation of H2PO4 with Ca2+ ions and of K and Ca2+ in competition with Na+ leading to a reduced level of internal K+ at high NaCl level [85,86]. Disturbing the homeostasis of Na+ and K+ has been proven under salinity [87]. The accumulation of Na+ under salinity is a vital mechanism of salt tolerance that reduces plant growth and ion uptakes [49]. A similar trend has been observed in M. oleifera [10], Bougainvillea spectabilis [15] and Thymus vulgaris [78]. On the other hand, chitosan application prevented the disturbance in ion homeostasis, and therefore it not only enhanced the contents of N, P, K, Mg and Fe but also decreased Na content under salt stress conditions. The current results are in agreement with the previous reports for chamomile [27], thyme [79] and red amaranth [88].

5. Conclusions

In conclusion, chitosan foliar application could play a dynamic role in alleviating the oxidative stress in salt-stressed moringa via the activation of the antioxidant machinery. Chitosan application enhanced growth attributes, the content of photosynthetic pigments, and the activities of non-enzymatic (carbohydrates, proline and phenols) and enzymatic (CAT, SOD and APX) antioxidants in plants exposed to salinity. The reduction of both H2O2 and MDA following chitosan application preserved membrane stability and improved salinity tolerance in moringa. These results suggest that chitosan treatment might be a significant application to improve salt stress tolerance in M. oleifera. Future studies at the molecular level are required to provide information about the involved mechanisms of CS in enhancing plant stress-tolerance.

Author Contributions

Conceptualization, F.A.S.H. and M.Y.; methodology, A.F.E.; software, M.Y.; validation, F.A.S.H., M.Y. and A.F.E.; formal analysis, A.F.E.; investigation, A.F.E.; resources, A.F.E.; data curation, M.Y.; writing—original draft preparation, F.A.S.H.; writing—review and editing, F.A.S.H.; visualization, M.Y.; supervision, M.Y. and F.A.S.H.; project administration, M.Y. All authors have read and agreed to the published version of the manuscript.

Funding

This research was funded by Guangxi Key Research and Development Project. The project name is: Collection, Conservation, Eco-Efficient Cultivation and Utilization of Distinctive Germplasm for Under-Forest Economic Plants in Guangxi. Project number: GuiKe AB21238014.

Institutional Review Board Statement

Not applicable.

Informed Consent Statement

Not applicable.

Data Availability Statement

The data sets supporting the results of this research are included within the article.

Conflicts of Interest

The authors declare no conflict of interest.

References

  1. Yisehak, K.; Solomon, M.; Tadelle, M. Contribution of Moringa (Moringa stenopetala, Bac.), a highly nutritious vegetable tree, for food security in South Ethiopia: A review. Asian J. Appl. Sci. 2011, 4, 477–488. [Google Scholar] [CrossRef] [Green Version]
  2. Tahany, M.A.; Hegazy, A.; Sayed, A.; Kabiel, H.; El-Alfy, T.; El-Komy, S. Study on combined antimicrobial activity of some biologically active constituents from wild Moringa peregrina Forssk. J. Yeast Fungal Res. 2010, 1, 15–24. [Google Scholar]
  3. El-Awady, M.A.; Hassan, M.M.; Abdel-Hameed, E.S.; Ahmed, G. Comparison of the antioxidant activities, phenolic and flavonoids contents of the leaves-crud extracts of Moringa peregrine and Moringa oleifera. Int. J. Biosci. 2016, 8, 55–62. [Google Scholar]
  4. Gopalakrishnan, L.; Doriya, K.; Kumar, D.S. Moringa oleifera: A review on nutritive importance and its medicinal application. Food Sci. Hum. Wellness 2016, 5, 49–56. [Google Scholar] [CrossRef] [Green Version]
  5. Ali, E.F.; Hassan, F.A.S.; Elgimabi, M. Improving the growth, yield and volatile oil content of Pelargonium graveolens L. Herit by foliar application with moringa leaf extract through motivating physiological and biochemical parameters. S. Afr. J. Bot. 2018, 119, 383–389. [Google Scholar] [CrossRef]
  6. Fahey, J.W. Moringa oleifera: A review of the medical evidence for its nutritional, therapeutic, and prophylactic properties. Part 1. Trees Life J. 2005, 1, 1–15. [Google Scholar]
  7. Hassan, F.A.S.; Mazrou, R.; Gaber, A.; Hassan, M.M. Moringa extract preserved the vase life of cut roses through maintaining water relations and enhancing antioxidant machinery. Postharvest Biol. Technol. 2020, 164, 111156. [Google Scholar] [CrossRef]
  8. Hassan, F.; Al-Yasi, H.; Ali, E.F.; Alamer, K.; Hessini, K.; Attia, H.; El-Shazly, S. Mitigation of salt stress effects by moringa leaf extract or salicylic acid through motivating antioxidant machinery in damask rose. Can. J. Plant Sci. 2021, 101, 157–165. [Google Scholar] [CrossRef]
  9. Metwally, S.A.; Ezzo, M.I.; Leila, B.H.A.; Abdalla, A.M. Effect of Diluted Red Sea Water on Growth Behavior and Chemical Component of Moringa Plants. Annu. Res. Rev. Biol. 2021, 36, 72–82. [Google Scholar] [CrossRef]
  10. De, F.; Carballo-Méndez, J.; Olivares-Sáenz, E.; Eustacio Vázquez-Alvarado, R.; Zavala-García, F.; Benavides-Mendoza, A.; Bolivar-Duarte, M. Silicon improves seedling production of Moringa oleifera lam. under saline stress. Pak. J. Bot. 2022, 54, 751–757. [Google Scholar] [CrossRef]
  11. Osman, A.; El-Naggar, H. Enhancing salinity stress tolerance and phenylalanine ammonia lyase gene activity using osmolytes in Moringa seedling production. Ann. Agric. Sci. 2022, 67, 127–135. [Google Scholar] [CrossRef]
  12. Nouman, W.; Siddiqui, M.T.; Basra, S.M.A.; Khan, R.A.; Gull, T.; Olson, M.E.; Munir, H. Response of Moringa oleifera to saline conditions. Int. J. Agric. Biol. 2012, 14, 757–762. [Google Scholar]
  13. Hassan, F.; Ali, E. Effects of salt stress on growth, antioxidant enzyme activity and some other physiological parameters in jojoba [Simmondsia chinensis (Link) Schneider] plant. Aust. J. Crop Sci. 2014, 8, 1615–1624. [Google Scholar]
  14. Hassan, F.A.S.; Ali, E.; Gaber, A.; Fetouh, M.; Mazrou, R. Chitosan nanoparticles effectively combat salinity stress by enhancing antioxidant activity and alkaloid biosynthesis in Catharanthus roseus (L.) G. Don. Plant Physiol. Biochem. 2021, 162, 291–300. [Google Scholar] [CrossRef] [PubMed]
  15. Carillo, P.; Cirillo, C.; De Micco, V.; Arena, C.; De Pascale, S.; Rouphael, Y. Morpho-anatomical, physiological and biochemical adaptive responses to saline water of Bougainvillea spectabilis Willd. trained to different canopy shapes. Agric. Water Manag. 2019, 212, 12–22. [Google Scholar] [CrossRef]
  16. Attia, H.; Al-Yasi, H.; Alamer, K.; Esmat, F.; Hassan, F.; Elshazly, S.; Hessini, K. Induced anti-oxidation efficiency and others by salt stress in Rosa damascena Miller. Sci. Hortic. 2020, 274, 109681. [Google Scholar] [CrossRef]
  17. Bernstein, N.; Shoresh, M.; Xu, Y.; Huang, B. Involvement of the plant antioxidative response in the differential growth sensitivity to salinity of leaves vs roots during cell development. Free Radic. Biol. Med. 2010, 49, 1161–1171. [Google Scholar] [CrossRef] [PubMed]
  18. Misra, N.; Misra, R.; Mariam, A.; Yusuf, K.; Yusuf, L. Salicylic acid alters antioxidant and phenolics metabolism in Catharanthus roseus grown under salinity stress. Afr. J. Tradit. Complement. Altern. Med. 2014, 11, 118–125. [Google Scholar]
  19. Ali, E.F.; Issa, A.A.; Al-Yasi, H.M.; Hessini, K.; Hassan, F.A.S. The efficacies of 1-methylcyclopropene and chitosan nanoparticles in preserving the postharvest quality of Damask rose and their underlying biochemical and physiological mechanisms. Biology 2022, 11, 242. [Google Scholar] [CrossRef]
  20. Al-Yasi, H.; Attia, H.; Alamer, K.; Hassan, F.; Esmat, F.; Elshazly, S.; Siddique, K.H.; Hessini, K. Impact of drought on growth, photosynthesis, osmotic adjustment, and cell wall elasticity in Damask rose. Plant Physiol. Biochem. 2020, 150, 133–139. [Google Scholar] [CrossRef]
  21. Rehman, H.U.; Alharby, H.F.; Alzahrani, Y.; Rady, M.M. Magnesium and organic biostimulant integrative application induces physiological and biochemical changes in sunflower plants and its harvested progeny on sandy soil. Plant Physiol. Biochem. 2018, 126, 97–105. [Google Scholar] [CrossRef] [PubMed]
  22. Liu, H.; Chen, X.; Song, L.; Li, K.; Zhang, X.; Liu, S.; Qin, Y.; Li, P. Polysaccharides from Grateloupia filicina enhance tolerance of rice seeds (Oryza sativa L.) under salt stress. Int. J. Biol. Macromol. 2019, 124, 1197–1204. [Google Scholar] [CrossRef] [PubMed]
  23. Nabi, R.B.S.; Tayade, R.; Hussain, A.; Kulkarni, K.P.; Imran, Q.M.; Mun, B.-G.; Yun, B.-W. Nitric oxide regulates plant responses to drought, salinity, and heavy metal stress. Environ. Exp. Bot. 2019, 161, 120–133. [Google Scholar] [CrossRef]
  24. Ghasemi, N.; Omidi, H.; Bostani, A. Morphological Properties of Catharanthus roseus L. Seedlings Affected by Priming Techniques under Natural Salinity Stress. J. Plant Growth Regul. 2021, 40, 550–557. [Google Scholar] [CrossRef]
  25. Hassan, F.; Ali, E.F.; Mahfouz, S. Comparison between different fertilization sources, irrigation frequency and their combinations on the growth and yield of coriander plant. Aust. J. Basic Appl. Sci. 2012, 6, 600–615. [Google Scholar]
  26. Kahil, A.A.; Hassan, F.A.S.; Ali, E.F. Influence of bio-fertilizers on growth, yield and anthocyanin content of Hibiscus sabdariffa L. plant under Taif region conditions. Annu. Res. Rev. Biol. 2017, 17, 1–15. [Google Scholar] [CrossRef]
  27. Mazrou, R.; Ali, E.F.; Hassan, S.; Hassan, F.A.S. A pivotal role of chitosan nanoparticles in enhancing the essential oil productivity and antioxidant capacity in Matricaria chamomilla L. Horticulturae 2021, 7, 574. [Google Scholar] [CrossRef]
  28. Ali, E.F.; El-Shehawi, A.M.; Ibrahim, O.H.M.; Abdul-Hafeez, E.Y.; Moussa, M.M.; Hassan, F.A.S. A vital role of chitosan nanoparticles in improvisation the drought stress tolerance in Catharanthus roseus (L.) through biochemical and gene expression modulation. Plant Physiol. Biochem. 2021, 161, 166–175. [Google Scholar] [CrossRef]
  29. Saqib, S.; Zaman, W.; Ullah, F.; Majeed, I.; Ayaz, A.; Munis, M. Organometallic assembling of chitosan-Iron oxidenanoparticles with their antifungal evaluation against Rhizopus oryzae. Appl. Organomet. Chem. 2019, 33, e5190. [Google Scholar] [CrossRef]
  30. Saqib, S.; Zaman, W.; Ayaz, A.; Habib, S.; Bahadur, S.; Hussain, S.; Muhammad, S.; Ullah, F. Postharvest disease inhibition in fruit by synthesis and characterization of chitosan iron oxide nanoparticles. Biocatal. Agric. Biotechnol. 2020, 28, 101729. [Google Scholar] [CrossRef]
  31. Heidari, J.; Amooaghaie, R.; Kiani, S. Impact of chitosan on nickel bioavailability in soil, the accumulation and tolerance of nickel in Calendula tripterocarpa. Int. J. Phytoremediat. 2020, 22, 1175–1184. [Google Scholar] [CrossRef] [PubMed]
  32. Da Silva, E.A.; de Paula, A.C.C.F.F.; Silva, V.N.B.; de Alvarenga, A.A.; Bertolucci, S.K.V. Biostimulating effect of chitosan and acetic acid on the growth and profile of the essential oil of Mentha arvensis L. Ind. Crop. Prod. 2021, 171, 113987. [Google Scholar] [CrossRef]
  33. Akhtar, G.; Faried, H.N.; Razzaq, K.; Ullah, S.; Wattoo, F.M.; Shehzad, M.A.; Sajjad, Y.; Ahsan, M.; Javed, T.; Dessoky, E.S.; et al. Chitosan-induced physiological and biochemical regulations confer drought tolerance in pot marigold (Calendula officinalis L.). Agronomy 2022, 12, 474. [Google Scholar] [CrossRef]
  34. Metzner, H.; Rau, H.; Senger, H. Unter suchungen zur synchronisier barteit einzelner pigmentan angel mutanten von chlorela. Planta 1965, 65, 186. [Google Scholar] [CrossRef]
  35. Patterson, B.D.; MacRae, E.A.; Ferguson, I.B. Estimation of hydrogen peroxide in plant extracts using titanium (IV). Anal. Biochem. 1984, 139, 487–492. [Google Scholar] [CrossRef]
  36. Hodges, D.M.; DeLong, J.M.; Forney, C.F.; Prange, R.K. Improving the thiobarbituric acid-reactive-substances assay for estimating lipid peroxidation in plant tissues containing anthocyanin and other interfering compounds. Planta 1999, 207, 604–611. [Google Scholar] [CrossRef]
  37. Sairam, R.K.; Deshmukh, P.S.; Shukla, D.S. Tolerance of drought and temperature stress in relation to increased antioxidant enzyme activity in wheat. J. Agron. Crop Sci. 1997, 178, 171–178. [Google Scholar] [CrossRef]
  38. Yemm, E.W.; Willis, A.J. The estimation of carbohydrate in the plant extract by anthrone reagent. J. Biochem. 1954, 57, 508–514. [Google Scholar] [CrossRef] [Green Version]
  39. Bates, L.S.; Waldren, R.P.; Teare, I.D. Rapid determination of free proline for water-stress studies. Plant Soil 1973, 39, 205–207. [Google Scholar] [CrossRef]
  40. Mcdonald, S.; Prenzler, P.D.; Antolovich, M.; Robards, K. Phenolic content and antioxidant activity of olive extracts. Food Chem. 2001, 73, 73–84. [Google Scholar] [CrossRef]
  41. Chandlee, J.M.; Scandalios, J.G. Analysis of variants affecting the catalase developmental program in maize scutellum. Theoret. Appl. Genet. 1984, 69, 71–77. [Google Scholar] [CrossRef] [PubMed]
  42. Giannopolitis, C.N.; Ries, S.K. Superoxide dismutases: I. Occurrence in higher plants. Plant Physiol. 1977, 59, 309–314. [Google Scholar] [CrossRef] [PubMed]
  43. Nakano, Y.; Asada, K. Hydrogen Peroxide is Scavenged by Ascorbate-specific Peroxidase in Spinach Chloroplasts. Plant Cell Physiol. 1981, 22, 867–880. [Google Scholar]
  44. Brand-Williams, W.; Cuvelier, M.E.; Berset, C. Use of a free radical method to evaluate antioxidant activity. LWT Food Sci. Technol. 1995, 28, 25–30. [Google Scholar] [CrossRef]
  45. AOAC. Official Methods of Analysis of the Association of Official Agricultural Chemists, 6th ed.; AOAC: Washington, DC, USA, 1995. [Google Scholar]
  46. Nelson, D.W.; Sommers, L.E. Determination of total nitrogen in plant material. Agron. J. 1973, 65, 109–112. [Google Scholar] [CrossRef]
  47. Jackson, M.L. Soil Chemical Analysis; Prentice Hall of India Pvt. Ltd.: New Delhi, India, 1967. [Google Scholar]
  48. Snedecor, G.W.; Cochran, W.G. Statistical Methods, 7th ed.; Iowa State University Press: Ames, IA, USA, 1980. [Google Scholar]
  49. Cai, X.; Niu, G.; Starman, T.; Hall, C. Response of six garden roses (Rosa× hybrida L.) to salt stress. Sci. Hortic. 2014, 168, 27–32. [Google Scholar] [CrossRef]
  50. Hussein, M.M.; Abou-Baker, N.H. Growth and mineral status of moringa plants as affected by silicate and salicylic acid under salt stress. Int. J. Plant Soil Sci. 2014, 3, 163–177. [Google Scholar] [CrossRef]
  51. Ashour, H.A.; Sanaa, E.; Mohamed, S. Alleviative effects of chitosan or humic acid on Vitex trifolia ‘Purpurea’ grown under salinity stress. Ornam. Hortic. 2020, 27, 88–102. [Google Scholar] [CrossRef]
  52. Zhang, X.; Li, K.; Xing, R.; Liu, S.; Li, P. Metabolite Profiling of Wheat Seedlings Induced by Chitosan: Revelation of the Enhanced Carbon and Nitrogen Metabolism. Front. Plant Sci. 2017, 8, 02017. [Google Scholar] [CrossRef] [PubMed] [Green Version]
  53. Safikhan, S.; Khoshbakht, K.; Chaichi, M.R.; Amini, A.; Motesharezadeh, B. Role of chitosan on the growth, physiological parameters and enzymatic activity of milk thistle (Silybum marianum (L.) Gaertn.) in a pot experiment. J. Appl. Res. Med. Arom. Plants 2018, 10, 49–58. [Google Scholar] [CrossRef]
  54. Arshad, M.A.; Akhtar, G.; Rajwana, I.A.; Ullah, S.; Hussain, M.B.; Amin, M.; Faried, N.; Razzaq, K.; Shehzad, M.A.; Ahsan, M.; et al. Foliar application of chitosan improves biomass, physiological and biochemical attributes of Rose (Gruss-an-Teplitz). Kuwait J. Sci. 2022, 49, 11655. [Google Scholar] [CrossRef]
  55. Hassan, F.A.S.; Morsi, M.M.; Aljoudi, N.G.S. Alleviating the Adverse Effects of Salt Stress in Rosemary by Salicylic Acid Treatment. Res. J. Pharm. Biol. Chem. Sci. 2017, 8, 1980–1995. [Google Scholar]
  56. Taiz, L.; Zeiger, E.; Moller, I.M.; Murphy, A. Plant Physiology and Development, 6th ed.; Sinauer Associates: Sunderland, UK, 2015; p. 761. [Google Scholar]
  57. Sheng, M.; Tang, M.; Chen, H.; Yang, B.; Zhang, F.; Huang, Y. Influence of arbuscular mycorrhizae on photosynthesis and water status of maize plants under salt stress. Mycorrhiza 2008, 18, 287–296. [Google Scholar] [CrossRef] [PubMed]
  58. Lacerda, C.F.d.; Oliveira, E.V.d.; Neves, A.L.R.; Gheyi, H.R.; Bezerra, M.A.; Costa, C.A.G. Morphophysiological responses and mechanisms of salt tolerance in four ornamental perennial species under tropical climate. Rev. Bras. Eng. Agrícola Ambient. 2020, 24, 656–663. [Google Scholar] [CrossRef]
  59. Van, S.N.; Minh, H.D.; Anh, D.N. Study on chitosan nanoparticles on biophysical characteristics and growth of Robusta coffee in green house. Biocatal. Agric. Biotechnol. 2013, 2, 289–294. [Google Scholar]
  60. Limpanavech, P.; Chaiyasuta, S.; Vongpromek, R.; Pichyangkura, R.; Khunwasi, C.; Chadchawan, S.; Lotrakul, P.; Bunjongrat, R.; Chaidee, A.; Bangyeekhun, T. Chitosan effects on floral production, gene expression, and anatomical changes in the Dendrobium orchid. Sci. Hortic. 2008, 116, 65–72. [Google Scholar] [CrossRef]
  61. Rashidi, N.; Khavari-Nejad, R.A.; Ramak, P.; Saadatmand, S. The effect of chitosan on gene expression, some morphological and physiological traits of sweet basil (Ocimum basilicum l.) under salinity stress. Acta Sci. Pol. Hortorum Cultus 2020, 19, 21–30. [Google Scholar] [CrossRef]
  62. Sharma, G.; Kumar, A.; Devi, K.A.; Prajapati, D.; Bhagat, D.; Pal, A.; Raliya, R.; Biswas, P.; Saharan, V. Chitosan nanofertilizer to foster source activity in maize. Int. J. Biol. Macromol. 2020, 145, 226–234. [Google Scholar] [CrossRef] [PubMed]
  63. Behdad, A.; Mohsenzadeh, S.; Azizi, M.; Moshtaghi, N. Salinity effects on physiological and phytochemical characteristics and gene expression of two Glycyrrhiza glabra L. populations. Phytochemistry 2020, 171, 112236. [Google Scholar] [CrossRef] [PubMed]
  64. Bonacina, C.; da Cruz, R.M.S.; Nascimento, A.B.; Barbosa, L.N.; Gonçalves, J.E.; Gazim, Z.C.; de Souza, S.G.H. Salinity modulates growth, oxidative metabolism, and essential oil profile in Curcuma longa L. (Zingiberaceae) rhizomes. S. Afr. J. Bot. 2022, 146, 1–11. [Google Scholar] [CrossRef]
  65. Xie, W.; Xu, P.; Liu, Q. Antioxidant activity of water-soluble chitosan derivatives. Bioorg. Med. Chem. Lett. 2001, 11, 1699–1701. [Google Scholar] [CrossRef]
  66. Sen, S.K.; Chouhan, D.; Das, D.; Ghosh, R.; Mandal, P. Improvisation of salinity stress response in mung bean through solid matrix priming with normal and nano-sized chitosan. Int. J. Biol. Macromol. 2020, 145, 108–123. [Google Scholar] [CrossRef] [PubMed]
  67. Gerami, M.; Majidian, P.; Ghorbanpour, A.; Alipour, Z. Stevia rebaudiana Bertoni responses to salt stress and chitosan elicitor. Physiol. Mol. Biol. Plants 2020, 26, 965–974. [Google Scholar] [CrossRef] [PubMed]
  68. Teixeira, J.; Pereira, S. High salinity and drought act on an organ-dependent manner on potato glutamine synthetase expression and accumulation. Environ. Exp. Bot. 2007, 60, 121–126. [Google Scholar] [CrossRef]
  69. Slama, I.; Ghnaya, T.; Hessini, K.; Messedi, D.; Savouré, A.; Abdelly, C. Comparative study of the effects of mannitol and PEG osmotic stress on growth and solute accumulation in Sesuvium portulacastrum. Environ. Exp. Bot. 2007, 61, 10–17. [Google Scholar] [CrossRef]
  70. Khalid, K.A.; Cai, W. The effects of mannitol and salinity stresses on growth and biochemical accumulations in lemon balm. Acta Ecol. Sin. 2011, 31, 112–120. [Google Scholar] [CrossRef]
  71. Feng, X.; Hussain, T.; Guo, K.; An, P.; Liu, X. Physiological, morphological and anatomical responses of Hibiscus moscheutos to non-uniform salinity stress. Environ. Exp. Bot. 2021, 182, 104301. [Google Scholar] [CrossRef]
  72. Shen, Z.; Pu, X.; Wang, S.; Dong, X.; Cheng, X.; Cheng, M. Silicon improves ion homeostasis and growth of liquorice under salt stress by reducing plant Na+ uptake. Sci. Rep. 2022, 12, 5089. [Google Scholar] [CrossRef] [PubMed]
  73. Tuna, A.L.; Kaya, C.; Dikilitas, M.; Higgs, D. The combined effects of gibberellic acid and salinity on some antioxidant enzyme activities, plant growth parameters and nutritional status in maize plants. Environ. Exp. Bot. 2008, 62, 1–9. [Google Scholar] [CrossRef]
  74. Abou El-Leel, O.F.; El-Shayeb, N.S.; El-Azzony, E.A. Effect of proline on growth and the active ingredients of moringa oleifera lam. plant under salt stress. N. Egypt. J. Microbiol. 2018, 51, 56–85. [Google Scholar]
  75. Sheikhalipour, M.; Esmaielpour, B.; Gohari, G.; Haghighi, M.; Jafari, H.; Farhadi, H.; Kalisz, A. Salt stress mitigation via the foliar application of chitosan-functionalized selenium and anatase titanium dioxide nanoparticles in stevia (Stevia rebaudiana Bertoni). Molecules 2021, 26, 4090. [Google Scholar] [CrossRef] [PubMed]
  76. Khalil, H.A.; Eldin, R.M.B. Chitosan improves morphological and physiological attributes of grapevines under deficit irrigation conditions. J. Hortic. Res. 2021, 29, 9–22. [Google Scholar] [CrossRef]
  77. Jahan, I.; Parvin, S.; Miah, M.G.; Ahmed, J.U. Effect of salinity on the physiological and biochemical responses of neem. Int. J. Environ. Agric. Res. 2018, 4, 47–54. [Google Scholar]
  78. Bistgani, Z.E.; Hashemi, M.; DaCosta, M.; Craker, L.; Maggi, F.; Morshedloo, M.R. Effect of salinity stress on the physiological characteristics, phenolic compounds, and antioxidant activity of Thymus vulgaris L. and Thymus daenensis Celak. Ind. Crop. Prod. 2019, 135, 311–320. [Google Scholar] [CrossRef]
  79. Bistgani, Z.E.; Hashemi, M.; Hamid, R. Fertilizer source and chitosan effect on productivity, nutrient accumulation, and phenolic compounds of Thymus daenensis Celak. Agron. J. 2021, 113, 5499–5515. [Google Scholar] [CrossRef]
  80. Idrees, M.; Naeem, M.; Aftab, T.; Khan, M.M.A. Moinuddin Salicylic acid mitigates salinity stress by improving antioxidant defence system and enhances vincristine and vinblastine alkaloids production in periwinkle [Catharanthus roseus (L.) G. Don]. Acta Physiol. Plant. 2011, 33, 987–999. [Google Scholar] [CrossRef]
  81. Zhao, Z.; Li, T.; Cheng, Y.; Wang, F.; Zhao, X. Morphological and metabolic responses of four Iris germanica cultivars under salinity stress. Sci. Hortic. 2021, 281, 109960. [Google Scholar] [CrossRef]
  82. Al-Ghamdi, A.A. Marjoram physiological and molecular performance under water stress and chitosan treatment. Acta Physiol. Plant. 2019, 41, 1–8. [Google Scholar] [CrossRef]
  83. Khalvandi, M.; Amerian, M.; Pirdashti, H.; Keramati, S.; Hosseini, J. Essential oil of peppermint in symbiotic relationship with Piriformospora indica and methyl jasmonate application under saline condition. Ind. Crop. Prod. 2019, 127, 195–202. [Google Scholar] [CrossRef]
  84. Tarighaleslami, M.; Zarghami, R.; Boojar, M.M.A.; Oveysi, M. Effects of drought stress and different nitrogen levels on morphological traits of proline in leaf and protein of corn seed (Zea mays L.). Am.-Eurasian J. Agric. Environ. Sci. 2012, 12, 49–56. [Google Scholar]
  85. Marschner, H. Mineral Nutrition of Higher Plants, 2nd ed.; Academic Press: New York, NY, USA, 1995; pp. 15–22. [Google Scholar]
  86. Botella, M.A.; Martinez, V.; Pardines, J.; Cerda, A. Salinity induced potassium deficiency in maize plants. J. Plant Physiol. 1997, 150, 200–205. [Google Scholar] [CrossRef]
  87. Roussos, P.A.; Gasparatos, D.; Tsantili, E.; Pontikis, C.A. Mineral nutrition of jojoba explants in vitro under sodium chloride salinity. Sci. Hortic. 2007, 114, 59–66. [Google Scholar] [CrossRef]
  88. Nasrin, H.; Zakir, H.M.; Nipa, N.A.; Paul, N.R.; Quadir, Q.F. Effect of foliar application of chitosan on growth, yield and nutritional qualities of red amaranth (Amaranthus gangticus L.). J. Exp. Agric. Int. 2022, 44, 105–116. [Google Scholar] [CrossRef]
Figure 1. Plant height (A) and number of leaves per plant (B) of Moringa oleifera exposed to salt stress and sprayed with chitosan (CS) at 1% concentration. Values are means ± SD of two experiments (n = 6). Columns with different letters are statistically different from each other according to LSD test at p ≤ 0.05.
Agronomy 12 02513 g001
Figure 2. Shoot FW (A), Shoot DW (B), Root FW (C) and Root DW (D) of Moringa oleifera exposed to salt stress and sprayed with chitosan (CS) at 1% concentration. Values are means ± SD of two experiments (n = 6). Columns with different letters are statistically different from each other according to LSD test at p ≤ 0.05.
Agronomy 12 02513 g002
Figure 3. Total chlorophyll (A) and total carotenoids (B) of Moringa oleifera exposed to salt stress and sprayed with chitosan (CS) at 1% concentration. Values are means ± SD of two experiments (n = 6). Columns with different letters are statistically different from each other according to LSD test at p ≤ 0.05.
Agronomy 12 02513 g003
Figure 4. MDA content (A), H2O2 production (B) and MSI (C) of Moringa oleifera exposed to salt stress and sprayed with chitosan (CS) at 1% concentration. Values are means ± SD of two experiments (n = 6). Columns with different letters are statistically different from each other according to LSD test at p ≤ 0.05.
Agronomy 12 02513 g004
Figure 5. Total carbohydrates (A), proline content (B) and total phenol content (C) of Moringa oleifera exposed to salt stress and sprayed with chitosan (CS) at 1% concentration. Values are means ± SD of two experiments (n = 6). Columns with different letters are statistically different from each other according to LSD test at p ≤ 0.05.
Agronomy 12 02513 g005aAgronomy 12 02513 g005b
Figure 6. Catalase (A), Superoxide dismutase (B), Ascorbate peroxidase (C) activities and radical scavenging activity measured by DPPH (D) of Moringa oleifera exposed to salt stress and sprayed with chitosan (CS) at 1% concentration. Values are means ± SD of two experiments (n = 6). Columns with different letters are statistically different from each other according to LSD test at p ≤ 0.05.
Agronomy 12 02513 g006
Table 1. Effect of salinity levels and chitosan application on the mineral content of Moringa oleifera L. plant.
TreatmentsMacroelements (%)Microelements (mg g−1 DW)
NPKMgFeNa
Control2.13 a0.74 a2.49 a8.39 a0.89 a19.67 f
25 mM NaCl1.73 c0.56 c2.08 c7.44 c0.85 b35.00 d
25 mM NaCl + 1% chitosan2.0 ab0.63 b2.24 b7.72 b0.83 b26.67 e
50 mM NaCl1.55 d0.37 e1.70 e6.77 e0.71 d54.67 b
50 mM NaCl + 1% chitosan1.91 b0.52 d1.83 d7.13 d0.79 c44.67 c
75 mM NaCl 1.41 e0.23 g1.63 e4.19 g0.54 f74.67 a
75 mM NaCl + 1% chitosan1.72 c0.31 f1.69 e5.77 f0.66 e48.67 c
LSD (p ≤ 0.05)0.1220.0660.1260.1590.02025.127
Values in each column with different letters are statistically different from each other according to LSD test at p ≤ 0.05.
Publisher’s Note: MDPI stays neutral with regard to jurisdictional claims in published maps and institutional affiliations.