Article

Dynamics of Crop Evapotranspiration of Four Major Crops on a Large Commercial Farm: Case of the Navajo Agricultural Products Industry, New Mexico, USA

1
Department of Plant and Environmental Sciences, New Mexico State University, Agricultural Science Center at Farmington, P.O. Box 1018, Farmington, NM 87499, USA
2
Biological and Agricultural Engineering Department, Kansas State University, 1016 Seaton Hall, 920 N. Martin Luther King Jr. Drive, Manhattan, KS 66506, USA
3
Department of Biological Systems Engineering, University of Nebraska-Lincoln, Lincoln, NE 68583, USA
*
Author to whom correspondence should be addressed.
Agronomy 2022, 12(11), 2629; https://doi.org/10.3390/agronomy12112629
Submission received: 1 October 2022 / Revised: 18 October 2022 / Accepted: 21 October 2022 / Published: 26 October 2022
(This article belongs to the Special Issue Precision Water Management)

Abstract

:
Crop evapotranspiration (ETa) is the main source of water loss in farms and watersheds, and with its effects felt at a regional scale, it calls for irrigation professionals and water resource managers to accurately assess water requirements to meet crop water use. On a multi-crop commercial farm, different factors affect cropland allocation, among which crop evapotranspiration is one of the most important factors regarding the seasonally or annually available water resources for irrigation in combination with the in-season effective precipitation. The objective of the present study was to estimate crop evapotranspiration for four major crops grown on the Navajo Agricultural Products Industry (NAPI) farm for the 2016–2010 period to help crop management in crop plant allocation based on the different objectives of the NAPI. The monthly and seasonal satellite-based ETa of maize, potatoes, dry beans, and alfalfa were retrieved and compared using the analysis of variance and the least significant difference (LSD) at 5% of significance. Our results showed the highly significant effects of year, months, and crops. The year 2020 obtained the highest crop ETa, and July had the most evapotranspiration demand, followed by August, June, September, and May, and the pool of April, March, February, January, December, and November registered the lowest crop ETa. Maize monthly ETa varied from 17.5 to 201.7 mm with an average seasonal ETa of 703.8 mm. The monthly ETa of potatoes varied from 9.8 to 207.5 mm, and their seasonal ETa averaged 600.9 mm. The dry bean monthly ETa varied from 10.4 to 178.4 mm, and the seasonal ETa averaged 506.2 mm. The alfalfa annual ETa was the highest at 1015.4 mm, as it is a perennial crop. The alfalfa monthly ETa varied from 8.2 to 202.1 mm. The highest monthly crop ETa was obtained in July for all four crops. The results of this study are very critical for cropland allocation and irrigation management under limited available water across a large commercial farm with multiple crops and objectives.

1. Introduction

Agricultural water is the most limiting factor for crop production in arid and semiarid environments, where actual crop evapotranspiration is not met by the received in-season precipitation. Under such conditions, supplementary irrigation is necessary for crops to meet their water requirements for optimum food and fiber production [1]. Crop evapotranspiration (ETa) is one of the most important parameters in hydrological, environmental, and agricultural studies and plays a key role in designing and managing irrigation projects and water management under irrigated and rainfed agriculture. Water resources are limited under semiarid climates such as that of the southwestern United States, the hottest and driest region in the United States with diminishing winter and spring precipitation and shifts in precipitation and reference evapotranspiration [2,3,4,5,6]. Cozzetto et al. [7] reported that the Southwest is prone to drought, and its paleoclimate showed severe mega-droughts lasting at least 50 years. This projection is mostly challenging regarding water resource management and planning when the human population is increasing, along with the demand for food and increasing competition among water users such as agricultural producers, industries, mines, communities, environmentalists, and others. Across the southwestern region, 92% of the cropland is irrigated [4]. Prein et al. [8] indicated that the southwestern US climate might be transitioning to a drier climate state, leading to higher drought risk. The USDA [9] reported that irrigation water withdrawals for crop production account for 79% of the total water withdrawal in the southwestern region. Conservation efforts should target limited irrigation strategies when maintaining or improving crop water productivity across the region under the increasing trend in reference to evapotranspiration [6]. Evapotranspiration is one of the largest components of the hydrological cycle and is expected to increase with the warming climate across the southwestern United States. Irrigation management is dependent on farm cropping systems and seems complex in the case of multi-crop farms. In a multi-crop farm, different crops are used, and they differ in terms of planting date, crop evapotranspiration, seasonal water requirement, and growing season length, all of which dictate the mechanisms for cropland allocation to different crops [10]. However, for system sustainability, the combination of the allocated croplands should consider the available fresh water to meet crop water requirements.
The Navajo Agricultural Products Industry (NAPI) was developed by the Navajo Nation Council as an enterprise to operate the Navajo Indian Irrigation Project (NIIP), one of the largest agricultural businesses owned and operated by Native Americans in the United States. The objective of the NIIP is to irrigate 44,770 hectares of farmland with about 36,421 hectares fully developed and equipped with irrigation systems. Navajo Lake is the storage reservoir for approximately 626.61 million cubic meters of annual allocated water to irrigate the NAPI farm. The NAPI grows a variety of quality forage, feed, and food products under the Navajo Pride brand as retail and wholesale. The grown crops include maize, potatoes, dry beans, wheat, alfalfa, sorghum-sudan, chile, pumpkins, watermelon, and others. Of these crops, potatoes, maize, alfalfa, and dry beans represent the most important crops in terms of annually harvested areas. Cropland allocation and water management should be closely considered for system sustainability under a changing climate, with the decreasing trend in the annual precipitation in the southwestern United States [11].
Some studies have reported different seasonal crop evapotranspiration values for different crops such as maize, potatoes, alfalfa, and dry beans across the western United States. Djaman et al. [12] used different estimation methods, reported maize seasonal evapotranspiration, and found maize ETa that varied from 634.2 to 697.7 mm, averaging 665.3 mm in northern New Mexico. Maize seasonal ETa was estimated at 684 mm in Farmington, NM [13], while it was 685 mm under subsurface drip irrigation in Farmington [14]. Nielsen and Heinkle [15] found a good correlation between the maize ETa estimated using the combination of crop coefficients and reference evapotranspiration and the measured maize ETa in northeastern Colorado. Locally developed crop coefficients provided accurate estimates of ETa compared with the measured ETa [1,16], and crop managers should use the actual crop ETa, rather than the reference crop evapotranspiration, for the determination of crop water requirements and irrigation management [17]. Under furrow irrigation, maize ETa varied from 667 to 984 mm [18], while it varied from 750 to 973 under sprinkler irrigation [19,20,21]. Subsurface drip-irrigated maize ETa varied from 711 to 818 mm at Bushland, TX [22]. Djaman et al. [12] estimated maize water requirements varying from 758.4 to 848.3 mm in northern New Mexico, with large variations between planting dates [23]. Maize water requirements varied from 671 to 945 mm from the Diamond Valley to Lovelock Valley in the State of Nevada [24].
The potato (Solanum tuberosum L.) is very sensitive to water stress and grows better on deep and well-drained soils [25,26]. Potatoes are also one of the most water-efficient crops [27,28,29,30]. Water management in potatoes is, therefore, crucial due to their shallow rooting system [23,31,32]. Potato ETa has been investigated, and it varies with irrigation methods, irrigation regimes, fertilizer management options, and other management factors. Potato water requirements varied from 500 to 700 mm [33]. Well-irrigated potato evapotranspiration averaged 630 mm at Davis, California [34]. Katerji et al. [35] reported a potato seasonal ETa value of 413.2 mm under drip irrigation in loam soil and 362.1 mm in clay soil in Valenzano, Italy. The potato seasonal ETa varied from 580 to 645 mm in Farmington, New Mexico [23].
Alfalfa is a perennial forage crop with a high yield and high nutritive value. Alfalfa has a high protein content and is highly appreciated by livestock compared with other forage crop species [36,37]. Alfalfa is the second most important crop grown in New Mexico in terms of the total harvested area [9]. Water stress is the most limiting production factor for alfalfa [38]. Irrigation water requirements for alfalfa vary with climate and local precipitation pattern and amount. In most of the western US, alfalfa production depends on irrigation, while elsewhere in the US, alfalfa can be grown under rainfed conditions [39]. Irrigated alfalfa represents more than 90% of the alfalfa acreage across the western states, while rainfed alfalfa is produced in some western regions such as Montana [40]. Alfalfa has a relatively high water requirement, and irrigated alfalfa represents 12% of the alfalfa-produced area in the US [41]. Alfalfa water use varied from 615 to 1448 mm across the US Great Plains. Under semiarid and arid conditions, alfalfa is mostly adapted to drought due to its deep rooting system [42]. The maximum amounts of applied water to alfalfa were 350, 300, 208, and 312 mm, respectively, during the first, second, third, and fourth regrowth cycles in 2013, and 373, 282, 198, and 246 mm in 2014 for the respective regrowth cycles in 2014; the seasonal applied irrigation amount varied from 711 to 1171 mm in 2013 and from 328 to 1100 mm in 2014 in Farmington, NM [43].
Moore et al. [44] demonstrated that water price plays a unique role in decision making in irrigated multi-crop production systems regarding crop choice, supply, land allocation, and water demand functions for field crops in the western United States. They considered the farm-scale water demand to be the sum of crop-level water demands. Crop ETa is, therefore, a key factor in land allocation to different crops within the multi-cop farms for optimizing irrigation water and cropland resources [45,46,47,48]. It is, therefore, critical to have accurate knowledge of the crop water requirement of different crops and mostly the locally measured or estimated crop evapotranspiration of the different crops grown across multi-crop farms and the region. The objective of the present study was to estimate and compare the monthly and seasonal evapotranspiration rates of maize, potatoes, dry beans, and alfalfa grown by the NAPI for the 2016–2020 period to be able to properly allocate space for these crops for conservative and sustainable irrigation management in the northwestern New Mexico.

2. Materials and Methods
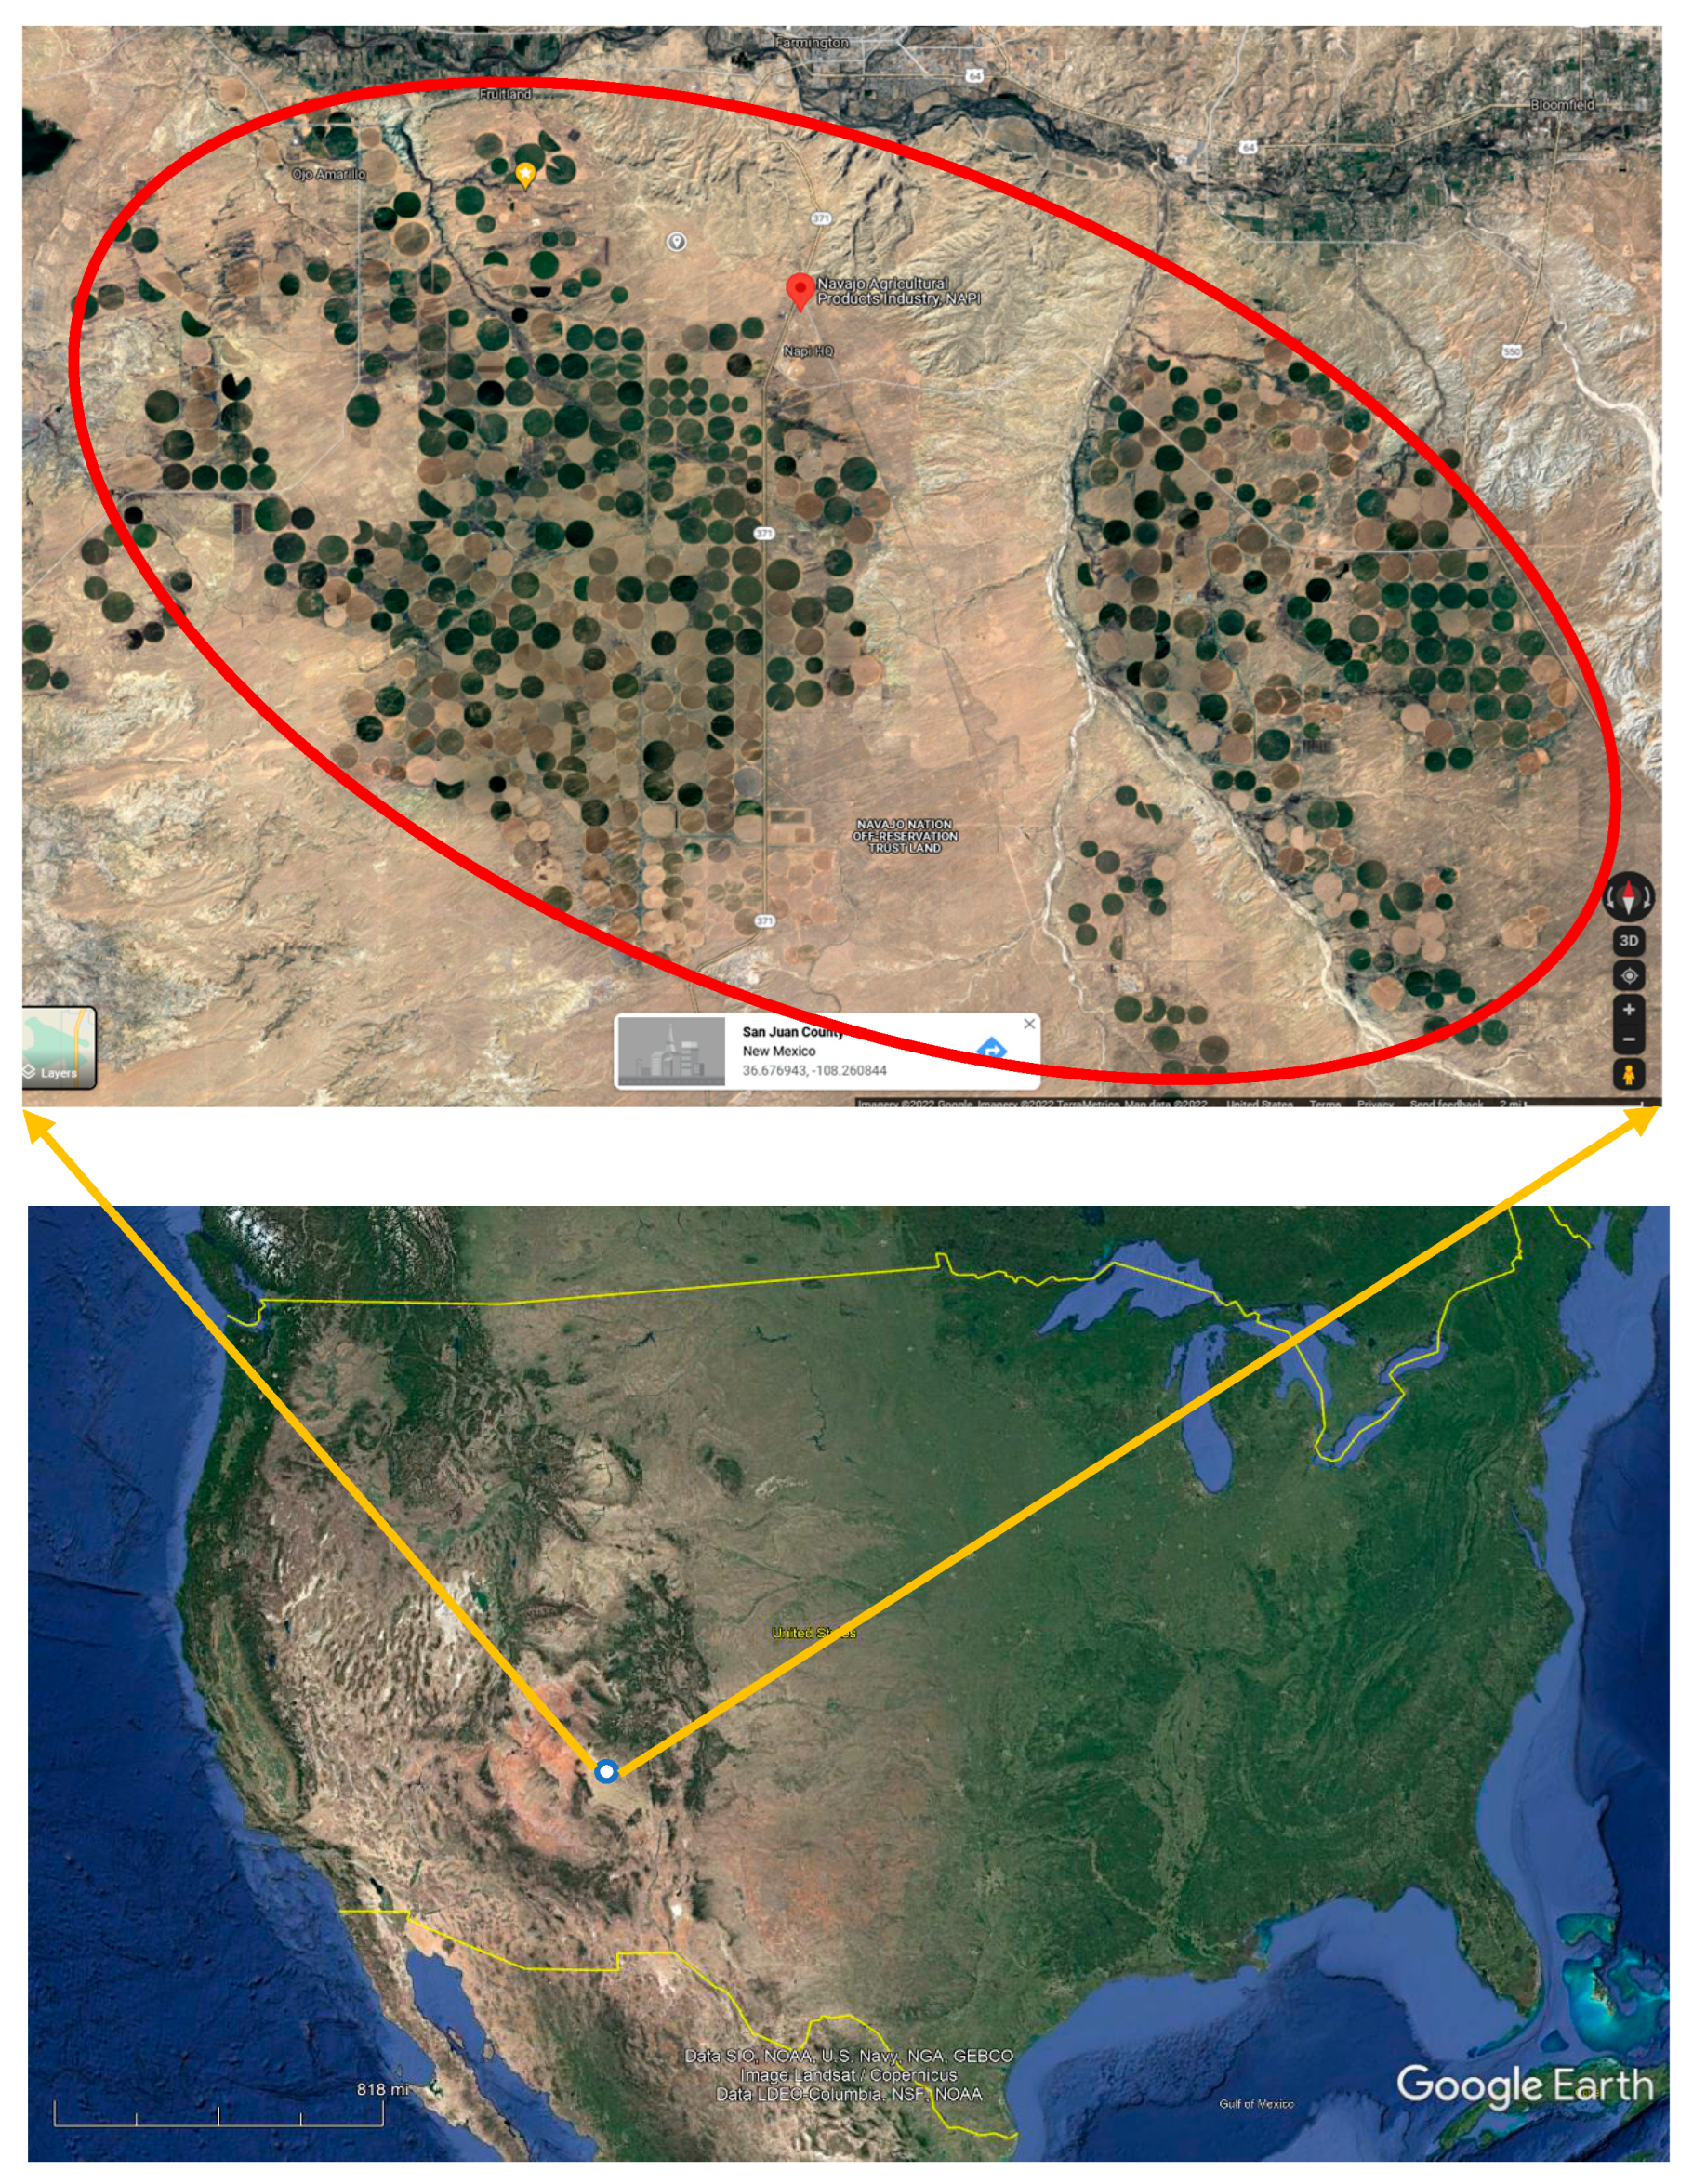
2.1. Study Area

This study was conducted at the Navajo Agricultural Products Industry (NAPI) located in San Juan County in northwestern New Mexico (Long. 36.676943, Lat. 108.260844, Elev. 1830 m) during the 2016 and 2020 crop growing seasons (Figure 1). Minimum temperature (Tmin), maximum temperature (Tmax), average temperature (Tmean), minimum relative humidity (RHmin), maximum relative humidity (RHmax), average relative humidity (RHmean), wind speed (u2), and solar radiation (Rs) were collected daily from an automated weather station installed at the New Mexico State University Agricultural Experiments Station (latitude 36.69′ north, longitude 108.31′ west), which is located within the NAPI exploitation domain. The weather station was about 0.5 to 6 km from the potato fields, depending on the field under consideration, and the year. Different soil types are present across the study area, and the most dominant soil types are Avalon sandy loam, Avalon loam, Doak loam, Sheppard–Mayqueen–Shiprock complex, Shiprock loamy fine sand, Shiprock fine sandy loam, and Turley clay loam according to the Official Soil Series Description (OSDs). Soil pH averaged 8, and the soil organic matter content was below 1%.

2.2. Crop Evapotranspiration Retrieved from OpenET

The monthly evapotranspiration values of alfalfa, maize, potatoes, and dry beans were retrieved from the OpenET (https://openetdata.org/ accessed on 15 January 2022), which is a community-driven effort that is building upon the advances in the development of an operational system for generating and distributing ET data at a field scale using an ensemble of six well-established, satellite-based approaches for mapping crop evapotranspiration [49]. OpenET has an operational system for field-scale ET mapping across the western US, and it provides access to both spatially continuous gridded datasets and choropleth maps that summarize the data to individual field boundaries. Twenty-two fields of each of the four crops were located and selected each year from 2016 to 2020 from the Navajo Agricultural Products Industry’s domain using the OpenET website (Figure 2). The current ensemble of ET models included in OpenET is composed of Atmosphere-Land Exchange Inverse/Disaggregation of the Atmosphere-Land Exchange Inverse (version 0.0.27) [50,51]; Mapping Evapotranspiration at High Resolution with Internalized Calibration (version 0.20.15) [16,52,53]; Surface Energy Balance Algorithm for Land using Google Earth Engine (version 0.2.1) [54,55]; Priestley–Taylor Jet Propulsion Laboratory (version 0.2.1) [56]; Satellite Irrigation Management Support (version 0.0.20) [57,58]; and Operational Simplified Surface Energy Balance (version 0.1.5) [59,60]. For operational purposes, for a selected year, twenty-two fields of potatoes, maize, alfalfa, and dry beans were located, and the monthly evapotranspiration data were retrieved. This process was repeated for each year from 2016 to 2020. At the NAPI, field preparation usually starts by mid-March, with soil preparation, pre-irrigation, and fumigation for potato plots under conventional production, and planting starts in early April with potatoes and ends mostly in late June with dry beans. Planting and harvesting mostly depend on resource availability, and their occurrence may vary from year to year. The monthly crop ET of the selected fields was retrieved, and the monthly average ET, seasonal ET, and average seasonal ET of the selected crops were estimated regardless of the potato, maize, alfalfa, and dry bean varieties, effective planting date, and effective harvest date. Fall planting is the best management practice for alfalfa to better control weeds, compared with spring planting with huge weed infestation.

2.3. Data Processing and Statistical Analysis

The monthly evapotranspiration values of each crop were averaged across the years under study, and the seasonal crop evapotranspiration was estimated as the sum of the monthly evapotranspiration. The standard deviations were estimated, and the data were plotted to show the variations in the monthly evapotranspiration for the 2016–2010 period. All the data were combined and checked for normality, and the analysis of variance was performed to determine the significance of the main effects such as years, months, and crops, and the interactions using the CoStat statistical software [61] The data were checked for variance homogeneity before the ANOVA processing. The means were cross-paired and compared using LSD at a 5% significance level.

3. Results and Discussion

3.1. Weather Conditions during the Study Period

The daily weather conditions of the 2017–2020 period are presented in Figure 3. The 2016 data had many gaps and were removed from the analysis. The maximum, minimum, and average temperatures increased from January to the maximum values in mid-July and decreased thereafter to the minimum values at the end of December of each year. Tmax varied from −9.0 to 36.6 °C; Tmin varied from −21.8 to 20.8 °C, and Tmean varied from −14.9 °C to 27.6 °C (Figure 3a). The minima of Tmax, Tmin, and Tmean were obtained in late December, and the maxima were obtained in July of each year. The air RHmax varied from 22.4% to 100%, the RHmin varied from 0% to 81%, and the RHmean varied from 10.5% to 95.5% (Figure 3b). The RHmax, RHmin, and RHmean averaged 70.9, 20.3, and 42.7% for the 2017–2020 period. The daily average wind speed fluctuated considerably and varied from 0.5 to 22 m/s and averaged 2.2 m/s. The highest wind speed values were obtained in the spring of each year, as shown in Figure 3c. The daily solar radiation varied from 2.1 to 31.3 MJ/m2 and averaged 19.2 MJ/m2 (Figure 3c). The daily precipitation varied from 0 to 19.1 mm, and the annual precipitation averaged 133.2 mm (Figure 3d), which was lower than the long-term average annual precipitation of 230 mm [11]. As crop planting is dictated by the soil and air temperatures, there was a strong relationship between the soil and air Tmean, with a coefficient of determination of 0.82 (Figure 4); thus, crop managers can use the air Tmean to derive soil mean temperature to determine the planting dates of potatoes, maize, and dry beans.

3.2. Actual Monthly and Annual Evapotranspiration of the Major Crops

The analysis of variance revealed highly significant differences in years (Fstat. = 35.06), months (Fstat. = 4566.7), crops (Fstat. = 585.7), and the interactions Year*Month, Year*Crop, Month*Crop, and Year*Month*Crop (p < 0.001) (Table 1). Besides alfalfa, which is a perennial crop, maize, potatoes, and dry beans are annual crops mostly sown in spring, starting with potatoes once the air temperature is at least equal to the potato base temperature. The climate variables interchange with years, and the monthly ETa varies drastically with crop species, crop growth stages, and planting dates [62]. Climate parameters interact and directly influence crop growth and development, showing the significance of the interactions among the main effects. The significantly higher crop ETa was registered in 2020, followed by 2017, 2018, 2019, and 2016. July was found to be the month with significantly the highest crop evapotranspiration, with an average of 150.7 mm, followed by August with 141.7 mm, June with 101.9 mm, September with 96.9 mm, and May with 53.7 mm, and all the rest of the months showed the lowest crop ETa. All four crops had significantly different seasonal ETa. Alfalfa showed the highest ETa, followed by maize, potatoes, and dry beans.
The maize monthly ETa varied with months, increasing from a minimum in April to the peak value in July and decreasing thereafter toward the crop physiological stage and harvest in November. The monthly ETa averaged 14.8, 74.5, 125.6, 177.7, 159.1, 108.6, 58.3, and 31.1 mm in April, May, June, July, August, September, October, and November, respectively, for the 2016–2020 period (Figure 5). Few maize fields are planted in April, and most of April ETa values basically reflect soil water evaporation from the pre-irrigation practiced to alleviate soil preparation. Across the farm, maize usually reaches full growth and development with the tasseling–silking stage in July. In addition, the peak air temperature occurred in July at the site with high evaporative water demand [12,63]. June, July, and August are the most critical months for maize production in northwestern New Mexico when irrigation practices not meeting crop water requirements may jeopardize maize yield and quality [12]. Therefore, maize crop managers have to work very closely with irrigation technicians to fulfill optimum irrigation management. Maize evapotranspiration in November is basically soil water evaporation, as the fall freeze usually occurs in October [64] but can occur as early as mid to late September [12] or as late as early November [64]. The seasonal potato ETa averaged 742.7 ± 21, 732.4 ± 35, 783.7 ± 19, 766.5 ± 28, and 773.3 ± 42 mm for 2016, 2017, 2018, 2019, and 2020, respectively.
Potato planting starts in early April and finishes in early May, while soil preparation, soil treatment for soilborne diseases, and nematode control and seedbed preparation start in March. Planting and harvesting mostly depend on resource availability, and their occurrence may vary from year to year with harvesting in late September–early October before the first fall frost. After the planting of potatoes, irrigation is very limited because the moisture in the potato seed is enough for potato sprouting and emergence. Soil water evaporation is, therefore, limited, and transpiration is almost null in April. Potato ETa increased with crop emergence and growth and development and averaged 21.5, 61.4, 151.3, 176.4, 126.8, and 63.5 mm in April, May, June, July, August, and September, respectively, for the 2016–2020 period (Figure 6). Like maize, the potato’s monthly peak ETa occurred in July. Depending on the planting date and or variety, tuber initiation may start as early as May and continue to the bulk stage, and most tubers mature by mid-August, with senescence occurring by the end of August for the early maturing potato varieties. Starch accumulation continues with the mid- to late-maturing varieties, and the potato vine is usually killed at the end of August–early September. However, light irrigation continues for at least two weeks to reinforce the buildup of the potato tuber skin before harvest with an increase in soil water evaporation before tuber harvest. The seasonal potato ETa averaged 571.3 ± 55, 574.9 ± 5.5, 572.9 ± 53, 591.0 ± 43, and 694.4 ± 48 mm for the 2016, 2017, 2018, 2019, and 2020, respectively.
Dry beans’ monthly ETa followed similar patterns as those of maize and potatoes and averaged 21.4, 55.9, 78.3, 135.4, 124.2, 66.4, 45.0, and 25.8 mm for April, May, June, July, August, September, October, and November, respectively (Figure 7). Very few fields are planted with dry beans in April, as the last spring killing frost, which usually occurs in May, could damage the young plants of the dry beans, which may not recover, as their growing point may be destroyed by the frost in contrast to the monocotyledons (maize), which may still have their growing point situated below the soil surface of similar growth stage [23]. Therefore, the crop ETa of April is soil water evaporation and the evapotranspiration of weeds before field preparation and could be ignored in the management planning objectives. Dry beans are short-duration crops, and the harvest usually starts in September and continues to October–November depending on the planting date, which is echeloned in late April to late June and early July, and sometimes at the NAPI, based on the availability of equipment or personnel, drying equipment such as a silo is used with a drying system. Thus, the dry beans’ ETa estimates vary across fields and planting dates. For planning purposes, dry bean crop season could be considered for the May–October period. The estimated dry bean seasonal ETa averaged 512.8 ± 46, 484.9 ± 39, 505.6 ± 67, 507.4 ± 59, and 520.0 ± 60 mm for the growing seasons of 2016, 2017, 2018, 2019, and 2020, respectively.
Alfalfa is a perennial high-value forage crop usually planted in fall or spring; however, fall planting yields higher than the spring planting during the first production year [65,66,67]. For this research, the planting year data were removed from the dataset to better help plan water management throughout the year of well-established alfalfa fields regardless of the second, third, fourth, or fifth year after planting. The monthly alfalfa ETa varied with years and rapidly increased from January to May and slightly decreased in June, July, August, and September, corresponding to the first, second, third, and fourth cut, respectively, in the study area [12,43,67] (Figure 8). Alfalfa ETa decreased from September to December when air temperature drastically decreases in winter, and reduced alfalfa growth plants go into the dormancy stage from November to February, with intrinsic variation due to the fall dormancy rating for the planted alfalfa varieties. However, Djaman et al. [67] reported that dormant and moderately dormant alfalfa cultivars should be the first choice in northwestern New Mexico. The alfalfa monthly ETa averaged 18.7, 27.0, 49.8, 111.8, 155.3, 148.8, 142.6, 131.4, 107.6, 68.8, 36.4, and 17.3 mm for the consecutive months from January to December, respectively, for the 2016–2020 period. The alfalfa annual ETa averaged 986.2, 1051.0, 992.1, 968.3, and 1079.4 mm for 2016, 2017, 2018, 2019, and 2020, respectively. The alfalfa annual ETa was the highest, followed by maize, potatoes, and dry beans (Figure 9).

3.3. Important of Crop Evapotranspiration in Decision Making for Future Farm Management

The on-farm retrieved monthly and seasonal crop evapotranspiration values for maize, potatoes, dry beans, and alfalfa for the 2016–2020 period across the NAPI farm constitute the basis for the estimation of crop water requirements for the studied crops in northern New Mexico. Climate change is expected to intensify the hydrological cycle and alter one of its important components, evapotranspiration [68], and crop ETa is expected to increase under a dominant warming phenomenon at the regional scale of the southwestern United States [43]. Easterling et al. [69] reported that the annual precipitation decreased in much of the western and southwestern United States during the 1901–2015 period. In addition, Kunkel et al. [70] indicated that the southern portions of the southwestern United States would experience the largest decrease in the annual precipitation, while a slight increase is predicted for the northern portions. Consequently, supplementary irrigation water amounts may show an increasing trend to meet crop water requirements. However, variation in the annual total and seasonal precipitation could partly have been affected by El Niño–Southern Oscillation (ENSO) and La Niña, which are associated with floods and drought in the southwestern United States [71,72,73]. Using the California Irrigation Management Information System data, Szilagyi and Jozsa [74] showed a statistically significant plot-scale irrigation ET rate increase of 31 to 41 ± 17 mm per decade for the 1983–2007 period across the Central Valley of California. Efficient irrigation technologies, crop-ETa-based irrigation scheduling, and the adoption of adaptation strategies to climate change are necessary for the production system’s sustainability. The San Juan River basin, the main source of water for the NIIP project, may be affected if the Navajo reservoir is overexploited, with higher water allocation to irrigation as the major source of water supply for the southwestern region, while the Colorado River watershed is affected by the overallocation of surface waters and 20 year-long droughts [75].
In addition, the data could be used in cropland allocation planning concerning the available irrigation water and the precipitation forecast. However, in a commercial multi-crop farm, cropland allocation is subjected to other several factors such as crop price, the demand for crops, system profitability, crop rotation in different cropping systems, soil health, cover cropping, weed, pest control, etc. Cervantes-Gaxiola et al. [76] successfully simulated maize, wheat, alfalfa, and bean land allocation and their optimal scheduling for the years 2020, 2021, and 2022 while maximizing the total annual profit. Other parameters such as the operating costs, including the costs of fresh water, fertilizer, and pumping, and the capital costs, including the costs of storage tanks, treatment units, pipelines, and pumps, are considered in determining the profit. The best combination of land and crop that optimizes the use of farm resources is determined through the modeling approaches of the crop plan decision [77,78]. To address optimum planning issues in a commercial farm such as the NAPI, a multi-objective optimizer including planting areas, crop production, and profit should be considered [79,80]. Other optimization models of annual crop allocation have been developed based on economic factors [81,82], the uncertainly of the available water, the net benefit considering wastewater recovery [83], limited water availability [84,85], the benefit subject to a given set of ecological, financial, and food crop production self-sufficiency constraints [86], optimum production [87], crop rotation [88], intra-seasonal water allocation [89], etc. As each environment and each farm has its specificities, the model choice may be directed by the model development environment, the number of crops grown on the farm, management practices for system sustainability, water conservation at the farm level while reducing the environmental impact and improve ng soil health characteristics.

4. Conclusions

Northwestern New Mexico is dominated by a semiarid to arid climate with very limited annual precipitation not able to allow rainfed production. In the context of changing climate, agricultural water resources are decreasing in many regions and sometimes with contracting trends with unpredictable extremes, and these phenomena are more emphasized in the semiarid and arid areas. It is, therefore, important to access crop water use mostly in the large agricultural industry similar to the Navajo Agricultural Products Industry where rigorous, sustainable, and conservation practices are adopted. Accurate crop evapotranspiration is indispensable to increasing irrigation water productivity. The results of the present study report the dynamics of the monthly and seasonal actual crop evapotranspiration of maize, potatoes, dry beans, and alfalfa in a commercial farm in the Navajo Agricultural Products Industry. Crop evapotranspiration significantly varied with crops, months, and years. The highest monthly crop evapotranspiration was observed in July, and it averaged 201.7 mm for maize, 207.5 mm for potatoes, 178.4 mm for dry beans, and 202.1 mm for alfalfa. The seasonal crop evapotranspiration averaged 703.8, 600.9, 506.2, and 1015.4 mm for maize, potatoes, dry beans, and alfalfa, respectively. These results could be used by crop managers to estimate accurate crop irrigation requirements to avoid putting those crops under water stress or water lodging, which may drastically reduce crop yield and crop water use efficiency. Future research should target the use of a complex nonlinear programming model to determine the optimum crop allocation based not only on the irrigation water availability and in-season precipitation forecast but also on production cost and profitability and the existence of proper value chains of different crops. However, crop rotation for improving soil health may be at risk due to crop prices and the profitability of production systems. Effective water-saving irrigation strategies could be implemented to increase crop water productivity and expand the cultivated area. For future work, the crop evapotranspiration rates of the major crops should be estimated for a longer period and the long-term dynamics of crop evapotranspiration and the future projection of crop evapotranspiration would help have a long-term plan for irrigated production under different scenarios considering the actual and future trends in the climate variables in northern New Mexico. Thus, the use of different resource allocation models with multiple objectives would help optimize cropland allocation, irrigation scheduling, farm profit, and the environmental impact of the production systems for water conservation and sustainable management conditions.

Author Contributions

Conceptualization, K.D.; methodology, K.D., A.T.M. and K.K.; formal analysis, K.D.; investigation, K.D.; resources, K.D.; data curation, K.D. and A.T.M.; writing—original draft preparation, K.D.; writing—review and editing, K.D., A.T.M. and K.K. All authors have read and agreed to the published version of the manuscript.

Funding

This research received no external funding.

Institutional Review Board Statement

Not applicable.

Informed Consent Statement

Not applicable.

Acknowledgments

This work was completed with the support of the New Mexico State University (NMSU) and the Agricultural Science Center at Farmington.

Conflicts of Interest

The authors declare no conflict of interest.

References

  1. Djaman, K.; Irmak, S.; Rathje, W.R.; Martin, D.L.; Eisenhauer, D.E. Maize evapotranspiration, yield production function, biomass, grain yield, harvest index, and yield response factors under full and limited irrigation. Trans. ASABE 2013, 56, 273–293. [Google Scholar]
  2. Archer, S.R.; Predick, K.I. Climate Change and Ecosystems of the Southwestern United States. Rangelands 2008, 30, 23–28. [Google Scholar] [CrossRef] [Green Version]
  3. Cayan, D.; Tyree, M.; Kunkel, K.E.; Castro, C.; Gershunov, A.; Barsugli, J.; Ray, A.J.; Overpeck, J.; Anderson, M.; Russell, J.; et al. Future climate: Projected average. In Assessment of Climate Change in the Southwest United States: A Report Prepared for the National Climate Assessment; Garfin, G., Jardine, A., Merideth, R., Black, M., LeRoy, S., Eds.; A report by the Southwest Climate Alliance; Island Press: Washington, DC, USA, 2013; pp. 101–125. [Google Scholar]
  4. Garfin, G.; Jardine, A.; Merideth, R.; Black, M.; LeRoy, S. Assessment of Climate Change in the Southwest United States: A Report Prepared for the National Climate Assessment. A Report by the Southwest Climate Alliance; Island Press: Washington, DC, USA, 2013. [Google Scholar]
  5. Garfin, G.; Franco, G.; Blanco, H.; Comrie, A.; Gonzalez, P.; Piechota, T.; Smyth, R.; Waskom, R. Ch. 20: Southwest. In Climate Change Impacts in the United States: The Third National Climate Assessment; Melillo, J.M., Richmond, T., Yohe, G.W., Eds.; U.S. Global Change Research Program: Washington, DC, USA; pp. 462–486. Available online: http://nca2014.globalchange.gov/report/regions/southwest (accessed on 30 September 2022).
  6. Dettinger, M.; Udall, B.; Georgakakos, A. Western water and climate change. Ecol. Appl. 2015, 25, 2069–2093. [Google Scholar] [CrossRef] [PubMed] [Green Version]
  7. Cozzetto, K.; Chief, K.; Dittmer, K.; Brubaker, M.; Gough, R.; Souza, K.; Ettawageshik, F.; Wotkyns, S.; Opitz-Stapleton, S.; Duren, S.; et al. Climate change impacts on the water resources of American Indians and Alaska Natives in the U.S. Clim. Chang. 2013, 120, 569–584. [Google Scholar] [CrossRef]
  8. Prein, A.; Holland, G.J.; Rasmussen, R.M.; Clark, M.P.; Tye, M.R. Running dry: The U.S. Southwest’s drift into a drier climate state. Geophys. Res. Lett. 2016, 43, 1272–1279. [Google Scholar] [CrossRef]
  9. USDA (United States Department of Agriculture). New Mexico Agricultural Statistics 2016 Annual Bulletin; USDA: Las Cruces, NM, USA, 2018.
  10. Dinar, A.; Rosegrant, M.W.; Meinzen-Dick, R. Water Allocation Mechanisms: Principles and Examples. The World Bank. 1997. Available online: https://elibrary.worldbank.org/doi/abs/10.1596/1813-9450-1779 (accessed on 30 September 2022).
  11. Djaman, K.; Koudahe, K.; Bodian, A.; Diop, L.; Ndiaye, P.M. Long-Term Trend Analysis in Annual and Seasonal Precipitation, Maximum and Minimum Temperatures in the Southwest United States. Climate 2020, 8, 142. [Google Scholar] [CrossRef]
  12. Djaman, K.; O’Neill, M.; Owen, C.K.; Smeal, D.; Koudahe, K.; West, M.; Allen, S.; Lombard, K.; Irmak, S. Crop evapotranspiration, irrigation water requirement and water productivity of maize from meteorological data under semiarid climate. Water 2018, 10, 405. [Google Scholar] [CrossRef] [Green Version]
  13. Barnes, F. Estimating Crop Water Requirement in Arizona and New Mexico. Master’s Thesis, Department of Hydrology and Water Resources, Tucson, AZ, USA, 2011. [Google Scholar]
  14. Pablo, R.G.; O’Neill, M.K.; Mccaslin, B.D.; Remmenga, M.D.; Keenan, J.G.; Onken, B.M. Evaluation of corn grain yield and water use efficiency using subsurface drip irrigation. J. Sustain. Agric. 2007, 30, 153–172. [Google Scholar] [CrossRef]
  15. Nielsen, D.C.; Hinkle, S.E. Field evaluation of basal crop coefficients for corn based on growing degree days, growth stage or time. Trans. ASAE 1996, 39, 97–103. [Google Scholar] [CrossRef]
  16. Allen, R.G.; Tasumi, M.; Morse, A.; Trezza, R.A. Landsat-based energy balance and evapotranspiration model in Western US water rights regulation and planning. Irrig. Drain. Syst. 2005, 19, 251–268. [Google Scholar] [CrossRef]
  17. Reyes-González, A.; Trooien, T.; Kjaersgaard, J.; Hay, C.; Reta-Sánchez, D.G. Development of crop coefficients using remote sensing-based vegetation index and growing degree days. In Proceedings of the 2016 ASABE Annual International Meeting, Orlando, FL, USA, 17–26 July 2016. [Google Scholar]
  18. Musick, J.T.; Dusek, D.A. Irrigated corn yield response to water. Trans. ASAE 1980, 23, 92–98, 103. [Google Scholar]
  19. Schneider, A.D.; Howell, T.A. LEPA and spray irrigation of corn-Southern High Plains. Trans. ASAE 1998, 41, 1391–1396. [Google Scholar] [CrossRef]
  20. Yazar, A.; Howell, T.A.; Dusek, D.A.; Copeland, K.S. Evaluation of crop water stress index for LEPA irrigated corn. Irrig. Sci. 1999, 18, 171–180. [Google Scholar] [CrossRef]
  21. Evett, S.R.; Howell, T.A.; Schneider, A.D.; Upchurch, D.R.; Wanjura, D.F. Automatic drip irrigation of corn and soybean. In Proceedings of the 4th Decennial National Irrigation Symposium, Phoenix, AZ, USA, 14–16 November 2000; Evans, R.G., Benham, B.L., Trooien, T.P., Eds.; ASAE: St. Joseph, MI, USA; pp. 401–408.
  22. Colaizzi, P.D.; Evett, S.R.; Howell, T.A. Corn production with spray, LEPA, and SDI. In Proceedings of the 23rd Annual Central Plains Irrigation Conference, Burlington, CO, USA, 22–23 February 2011; Central Plains Irrigation Association: Colby, KS, USA; pp. 52–67.
  23. Djaman, K.; Koudahe, K.; Saibou, A.; Darapuneni, M.; Higgins, C.; Irmak, S. Soil water dynamics, effective rooting zone, and evapotranspiration of sprinkler irrigated potato in a sandy loam soil. Agronomy 2022, 12, 864. [Google Scholar] [CrossRef]
  24. Huntington, J.L.; Allen, R.G. Evapotranspiration and Net Irrigation Water Requirements for Nevada; Nevada Division of Water Resources: Carson City, NV, USA, 2010; p. 288.
  25. Pierce, F.J.; Gaye Burpee, C. Zone tillage effects on soil properties and yield and quality of potatoes (Solanum tuberosum L.). Soil Tillage Res. 1995, 35, 135–146. [Google Scholar] [CrossRef]
  26. Djaman, K.; Irmak, S.; Koudahe, K.; Allen, S. Irrigation Management in Potato (Solanum tuberosum L.) Production: A Review. Sustainability 2021, 13, 1504. [Google Scholar] [CrossRef]
  27. Vreugdenhil, D.; Bradshaw, J.; Gebhardt, C.; Govers, F.; Taylor, M.A.; MacKerron, D.K.L.; Ross, H.A. (Eds.) Water Availability and Potato Crop Performance. Potato Biology and Biotechnology: Advances and Perspectives; Elsevier: Amsterdam, The Netherlands, 2007. [Google Scholar]
  28. FAO. Potato and Water Resources; Hidden Treasure: International Year of the Potato. 2008. Available online: http://www.potato2008.org/en/potato/water.html (accessed on 22 December 2020).
  29. CIP. Agricultural Research for Development: Potato Facts and Figures. 2013. Available online: http://cipotato.org/potato/facts (accessed on 22 December 2021).
  30. Quiroz, R.; Chujoy, E.; Mares, V. Potato. In Crop Yield Response to Water; Steduto, P., Hsiao, T., Fereres, E., Raes, D., Eds.; Irrig Drain Paper 66; FAO: Rome, Italy, 2012; pp. 184–189. [Google Scholar]
  31. Zarzyńska, K.; Boguszewska-Mańkowska, D.; Nosalewicz, A. Differences in size and architecture of the potato cultivars root system and their tolerance to drought stress. Plant Soil Environ. 2017, 63, 159–164. [Google Scholar]
  32. Djaman, K.; Koudahe, K.; Koubodana, H.D.; Saibou, A.; Essah, S. Tillage Practices in Potato (Solanum tuberosum L.) Production: A Review. Am. J. Potato Res. 2022, 99, 1–12. [Google Scholar] [CrossRef]
  33. Doorenbos, J.; Kassam, A.H. Yield Response to Water; Irrigation and Drainage Paper no. 33; FAO: Rome, Italy, 1979. [Google Scholar]
  34. Wolfe, D.W.; Fereres, E.; Voss, R.E. Growth and yield response of two potato cultivars to various levels of water applied. Irrig. Sci. 1983, 3, 211–222. [Google Scholar] [CrossRef]
  35. Katerji, N.; Rana, G.; Fahed, S. Parameterizing canopy resistance using mechanistic and semi-empirical estimates of hourly evapotranspiration: Critical evaluation for irrigated crops in the Mediterranean. Hydrol. Process 2011, 25, 117–129. [Google Scholar] [CrossRef]
  36. Marita, J.M.; Ralph, J.; Hatfield, R.D.; Guo, D.; Chen, F.; Dixon, R.A. Structural and compositional modifications in lignin of transgenic alfalfa down-regulated in caffeic acid 3-O-methyltransferase and caffeoyl coenzyme A 3-O-methyltransferase. Phytochemistry 2003, 62, 53–65. [Google Scholar] [CrossRef] [Green Version]
  37. Bouton, J.H. Breeding lucerne for persistence. Crop Pasture Sci. 2012, 63, 95–106. [Google Scholar] [CrossRef] [Green Version]
  38. Undersander, D.; Cosgrove, D.; Cullen, E.; Grau, C.; Rice, M.; Renz, M. Alfalfa Management Guide. American Society of Agronomy, Inc. 2011. Available online: https://www.agronomy.org/files/publications/alfalfa-management-guide.pdf (accessed on 12 December 2019).
  39. Mubako, S.T.; Lant, C.L. Agricultural virtual water trade and water footprint of U.S. States. Ann. Assoc. Am. Geogr. 2013, 103, 385–396. [Google Scholar] [CrossRef]
  40. Summers, C.G.; Putnam, D.H. Irrigated Alfalfa Management for Mediterranean and Desert Zones; University of California, Agriculture and Natural Resources: Davis, CA, USA, 2008. [Google Scholar]
  41. Broner, I.; Schneekloth, J. Seasonal Water Needs and Opportunities for Limited Irrigation for Colorado Crops. Newsletter of the Extension Irrigation Services, Dept. of Civil Engineering, Colorado State University. No. 4.718. 2003. Available online: https://agris.fao.org/agris-search/search.do?recordID=US201300135602 (accessed on 12 December 2021).
  42. Allen, R.G.; Pereira, L.S.; Raes, D.; Smith, M. Crop Evapotranspiration-Guidelines for Computing Crop Water Requirements; FAO Irrigation and Drainage Paper 56; FAO: Rome, Italy, 1998; Volume 300, p. D05109. [Google Scholar]
  43. Djaman, K.; Smeal, D.; Koudahe, K.; Allen, S. Hay yield and water use efficiency of alfalfa under different irrigation and fungicide regimes in a semiarid climate. Water 2020, 12, 1721. [Google Scholar] [CrossRef]
  44. Moore, M.R.; Gollehon, N.R.; Carey, M.B. Multicrop production decisions in western irrigated agriculture: The role of water price. Am. J. Agric. Econ. 1994, 76, 859–874. [Google Scholar] [CrossRef]
  45. Gong, X.; Zhang, H.; Ren, C.; Sun, D.; Yang, J. Optimization allocation of irrigation water resources based on crop water requirement under considering effective precipitation and uncertainty. Agric. Water Manag. 2020, 239, 106264. [Google Scholar] [CrossRef]
  46. Linker, R. Unified framework for model-based optimal allocation of crop areas and water. Agric. Water Manag. 2020, 228, 105859. [Google Scholar] [CrossRef]
  47. Li, J.; Shang, S.; Jiang, H.; Song, J.; Rahman, K.U.; Adeloye, A.J. Simulation-based optimization for spatiotemporal allocation of irrigation water in arid region. Agric. Water Manag. 2021, 254, 106952. [Google Scholar] [CrossRef]
  48. Li, M.; Sun, H.; Liu, D.; Singh, V.P.; Fu, Q. Multi-scale modeling for irrigation water and cropland resources allocation considering uncertainties in water supply and demand. Agric. Water Manag. 2021, 246, 106687. [Google Scholar] [CrossRef]
  49. Melton, F.S.; Huntington, J.; Grimm, R.; Herring, J.; Hall, M.; Rollison, D.; Erickson, T.; Allen, R.; Anderson, M.; Fisher, J.B.; et al. OpenET: Filling a critical data gap in water management for the Western United States. J. Am. Water Resour. Assoc. 2021, 1–24. [Google Scholar] [CrossRef]
  50. Anderson, M.C.; Norman, J.M.; Mecikalski, J.R.; Otkin, J.A.; Kustas, W.P. A climatological study of evapotranspiration and moisture stress across the continental United States based on thermal remote sensing: 2. Surface moisture climatology. J. Geophys. Res. 2007, 112, D10117. [Google Scholar] [CrossRef]
  51. Anderson, M.; Gao, F.; Knipper, K.; Hain, C.; Dulaney, W.; Baldocchi, D.; Eichelmann, E.; Hemes, K.; Yang, Y.; Medellin-Azuara, J.; et al. Field-scale assessment of land and water use change over the California Delta using remote sensing. Remote Sens. 2018, 10, 889. [Google Scholar] [CrossRef] [Green Version]
  52. Allen, R.G.; Tasumi, M.; Trezza, R. Satellite-based energy balance for mapping evapotranspiration with internalized calibration (METRIC)-Model. J. Irrig. Drain. Eng. 2007, 133, 380–394. [Google Scholar] [CrossRef]
  53. Allen, R.G.; Pereira, L.S.; Howell, T.A.; Jensen, M.E. Evapotranspiration information reporting: I. Factors governing measurement accuracy. Agric. Water Manag. 2011, 98, 899–920. [Google Scholar] [CrossRef] [Green Version]
  54. Bastiaanssen, W.G.M.; Menenti, M.; Feddes, R.A.; Holtslag, A.A.M. A remote sensing surface energy balance algorithm for land (SEBAL). 1. Formulation. J. Hydrol. 1998, 212–213, 198–212. [Google Scholar] [CrossRef]
  55. Laipelt, L.; Kayser, R.H.B.; Fleischmann, A.S.; Ruhoff, A.; Bastiaanssen, W.; Erickson, T.A.; Melton, F. Long-term monitoring of evapotranspiration using the SEBAL algorithm and Google Earth Engine cloud computing. ISPRS J. Photogramm. Remote Sens. 2021, 178, 81–96. [Google Scholar] [CrossRef]
  56. Fisher, J.B.; Tu, K.P.; Baldocchi, D.D. Global estimates of the land—Atmosphere water flux based on monthly AVHRR and ISLSCP-II data, validated at 16 FLUXNET Sites. Remote Sens. Environ. 2008, 112, 901–919. [Google Scholar] [CrossRef]
  57. Melton, F.S.; Johnson, L.F.; Lund, C.P.; Pierce, L.L.; Michaelis, A.R.; Hiatt, S.H.; Guzman, A.; Adhikari, D.D.; Purdy, A.J.; Rosevelt, C.; et al. Satellite irrigation management support with the terrestrial observation and prediction system: A framework for integration of satellite and surface observations to support improvements in agricultural water resource management. IEEE J. Sel. Top. Appl. Earth Obs. Remote Sens. 2012, 5, 1709–1721. [Google Scholar] [CrossRef]
  58. Pereira, L.; Paredes, P.; Melton, F.; Johnson, L.; Wang, T.; López-Urrea, R.; Cancela, J.; Allen, R. Prediction of crop coefficients from fraction of ground cover and height. Background and validation using ground and remote sensing data. Agric. Water Manag. 2020, 241, 106197. [Google Scholar] [CrossRef]
  59. Senay, G.B. Satellite psychrometric formulation of the operational Simplified Surface Energy Balance (SSEBop) Model for quantifying and mapping evapotranspiration. Appl. Eng. Agric. 2018, 34, 555–566. [Google Scholar] [CrossRef] [Green Version]
  60. Senay, G.B.; Bohms, S.; Singh, R.K.; Gowda, P.H.; Velpuri, N.M.; Alemu, H.; Verdin, J.P. Operational evapotranspiration mapping using remote sensing and weather datasets: A new parameterization for the SSEB approach. JAWRA J. Am. Water Resour. Assoc. 2013, 49, 577–591. [Google Scholar]
  61. Cardinali, A.; Nason, G.P. Costationarity of Locally Stationary Time Series Using costat. J. Stat. Softw. 2013, 55, 1–22. [Google Scholar] [CrossRef] [Green Version]
  62. Djaman, K.; Allen, S.; Djaman, D.S.; Koudahe, K.; Irmak, S.; Puppala, N.; Darapuneni, M.K.; Angadi, S.V. Planting date and plant density effects on maize growth, yield and water use efficiency. Environ. Chall. 2022, 6, 100417. [Google Scholar] [CrossRef]
  63. Djaman, K.; Rudnick, D.R.; Moukoumbi, Y.D.; Sow, A.; Irmak, S. Actual evapotranspiration and crop coefficients of irrigated lowland rice (Oryza sativa L.) under semiarid climate. Ital. J. Agron. 2019, 14, 19–25. [Google Scholar] [CrossRef]
  64. O’Neill, M.K.; Smeal, D.; West, M.M.; Allen, S.C.; Djaman, K. Forty-Eight Years (1969–2016) of Climatological Data: NMSU Agricultural Science Center: Farmington, New Mexico; NMSU, PES Bulletin 809; New Mexico State University, College of Agriculture and Home Economics: Las Cruces, NM, USA, 2018. [Google Scholar]
  65. Kee, D.D.; Bransby, D.I.; Ward, C.Y. Effects of seeding rate and planting season on alfalfa yield. Proc. Am. Forage Grassl. Council 1994, 3, 198–201. [Google Scholar]
  66. Trostle, C. Spring Fever Alfalfa—The Pitfalls of Spring Seeding Alfalfa in West Texas. Texas Cooperative Extension; Extension Agronomy, Texas A&M: Lubbock, TX, USA, 2003. [Google Scholar]
  67. Djaman, K.; O’Neill, M.; Lauriault, L.; Marsalis, M.; Koudahe, K.; Darapuneni, M. The dynamics of Forage Yield of Different Fall Dormancy Rating Alfalfa Cultivars in a Semiarid Climate. Agric. Res. 2021, 10, 378–389. [Google Scholar] [CrossRef]
  68. Huntington, T.G. Evidence for intensification of the global water cycle: Review and synthesis. J. Hydrol. 2006, 319, 83–89. [Google Scholar] [CrossRef]
  69. Easterling, D.R.; Kunkel, K.E.; Arnold, J.R.; Knutson, T.; LeGrande, A.N.; Leung, L.R.; Vose, R.S.; Waliser, D.E.; Wehner, M.F. Precipitation change in the United States. In Climate Science Special Report: Fourth National Climate Assessment; Wuebbles, D.J., Fahey, D.W., Hibbard, K.A., Dokken, D.J., Stewart, B.C., Maycock, T.K., Eds.; U.S. Global Change Research Program: Washington, DC, USA, 2017; Volume I, pp. 207–230. [Google Scholar]
  70. Kunkel, K.E.; Stevens, L.E.; Stevens, S.E.; Sun, L.; Janssen, E.; Wuebbles, D.; Redmond, K.T.; Dobson, J.G. Regional Climate Trends and Scenarios for the U.S. National Climate Assessment; Part 5. Climate of the Southwest, U.S.; NOAA Technical Report NESDIS; NOAA: Washington, DC, USA, 2013; pp. 142–145.
  71. D’Odorico, P.; Yoo, J.C.; Over, T.M. An assessment of ENSO-induced patterns of rainfall erosivity in the southwestern United States. J. Clim. 2001, 14, 4230–4242. [Google Scholar] [CrossRef]
  72. Jia, L.; Yang, X.; Vecchi, G.A.; Gudgel, R.G.; Delworth, T.L.; Rosati, A.; Stern, W.F.; Wittenberg, A.T.; Krishnamurthy, L.; Zhang, S. Improved Seasonal Prediction of Temperature and Precipitation over Land in a High-Resolution GFDL Climate Model. J. Clim. 2015, 28, 2044–2062. [Google Scholar] [CrossRef]
  73. Corringham, T.W.; Cayan, D.R. The Effect of El Niño on Flood Damages in the Western United States. Weather Clim. Soc. 2019, 11, 489–504. [Google Scholar] [CrossRef]
  74. Szilagyi, J.; Jozsa, J. Evapotranspiration Trends (1979–2015) in the Central Valley of California, USA: Contrasting Tendencies during 1981–2007. Water Resour. Res. 2018, 54, 5620–5635. [Google Scholar] [CrossRef]
  75. USGCRP. Our Changing Planet, Indicators of Change, Adapting to Change. USGCRP Released the Third National Climate Assessment, the Authoritative and Comprehensive Report on Climate Change and Its Impacts in the United States. 2014. Available online: http://www.globalchange.gov/ (accessed on 30 September 2022).
  76. Cervantes-Gaxiola, M.E.; Sosa-Niebla, E.F.; Hernández-Calderón, O.M.; Ponce-Ortega, J.M.; Ortiz-del-Castillo, J.R.; Rubio-Castro, E. Optimal crop allocation including market trends and water availability. Eur. J. Oper. Res. 2020, 285, 728–739. [Google Scholar] [CrossRef]
  77. Haneveld, W.K.K.; Stegeman, A.W. Crop succession requirements in agricultural production planning. Eur. J. Oper. Res. 2005, 166, 406–429. [Google Scholar] [CrossRef]
  78. Bachinger, J.; Zander, P. ROTOR, a tool for generating and evaluating crop rotations for organic farming systems. Eur. J. Agron. 2007, 26, 30–143. [Google Scholar] [CrossRef]
  79. Adeyemo, J.; Otieno, F. Differential evolution algorithm for solving multi-objective crop planning model. Agric. Water Manag. 2010, 97, 848–856. [Google Scholar] [CrossRef]
  80. Adekanmbi, O.; Olugbara, O. Multiobjective optimization of crop-mix planning using generalized differential evolution algorithm. J. Agric. Sci. Technol. JAST 2015, 17, 1103–1114. [Google Scholar]
  81. Adewumi, A. Optimum Production Plans for Cassava-Based Crop Farmers in Kwara State, Nigeria. Master Thesis, Federal University of Technology, Minna, Nigeria, 2017; p. 54. [Google Scholar]
  82. Fereidoon, M.; Koch, M. SWAT-MODSIM-PSO optimization of multi-crop planning in the Karkheh River Basin, Iran, under the impacts of climate change. Sci. Total Environ. 2018, 630, 502–516. [Google Scholar] [CrossRef]
  83. Aljanabi, A.A.; Mays, L.W.; Fox, P. Application of an optimization model for assessing the performance of water appropriation in Iraq. Environ. Nat. Resour. Res. 2018, 8, 105. [Google Scholar] [CrossRef] [Green Version]
  84. English, M.J.; Solomon, K.H.; Hoffman, G.J.A. paradigm shift in irrigation management. J. Irrig. Drain. Eng. 2022, 128, 267–277. [Google Scholar] [CrossRef]
  85. López-Mata, E.; Orengo-Valverde, J.; Tarjuelo, J.; Martínez-Romero, A.; Domínguez, A. Development of a direct-solution algorithm for determining the optimal crop planning of farms using deficit irrigation. Agric. Water Manag. 2016, 171, 173–187. [Google Scholar] [CrossRef]
  86. Melaku, N.D.; Renschler, C.S.; Holzmann, H.; Strohmeier, S.; Bayu, W.; Zucca, C.; Ziadat, F.; Klik, A. Prediction of soil and water conservation structure impacts on runoff and erosion processes using SWAT model in the northern Ethiopian highlands. J. Soils Sediments 2018, 18, 1743–1755. [Google Scholar] [CrossRef] [Green Version]
  87. Mohammadian, F.; Heydari, M. Application of fuzzy goal programming to determine the optimal cultivation crops model. Int. J. Stud. Res. Technol. Manag. 2019, 7, 01–08. [Google Scholar] [CrossRef] [Green Version]
  88. Regis Mauri, G. Improved mathematical model and bounds for the crop rotation scheduling problem with adjacency constraints. Eur. J. Oper. Res. 2019, 278, 120–135. [Google Scholar] [CrossRef]
  89. Grové, B.; Du Plessis, M.C. Optimising intra-seasonal irrigation water allocation: Comparison between mixed integer nonlinear programming and differential evolution. Water SA 2019, 45, 48–54. [Google Scholar] [CrossRef]
Figure 1. Presentation of the study site in San Juan County, northwestern New Mexico (white dot on the US map) and the Navajo Agricultural Products Industry farm projected as shown by yellow arrows. The green circles are center-pivot-irrigated fields, and the large red circle represents approximately the NAPI farm (downloaded from Google earth on 19 December 2021).
Agronomy 12 02629 g001
Figure 2. The OpenET Data Explorer showing the fields across Region 2 of the Navajo Agricultural Products Industry farm.
Agronomy 12 02629 g002
Figure 3. Weather conditions during the 2017–2020 period at the experiment station: (a) air temperatures, (b) air relative humidity, (c) wing speed and solar radiation, and (d) precipitation.
Agronomy 12 02629 g003aAgronomy 12 02629 g003b
Figure 4. Relationship between mean daily air temperature and the soil temperature (average upper 10 cm soil layer) during the 2018–2021 period at the experiment station.
Agronomy 12 02629 g004
Figure 5. Monthly actual maize crop evapotranspiration with standard deviation among twenty-two maize fields for the 2016–2020 period under center-pivot irrigation.
Agronomy 12 02629 g005
Figure 6. Monthly actual potato crop evapotranspiration with standard deviation among twenty-two potato fields for the 2016–2020 period under center-pivot irrigation.
Agronomy 12 02629 g006
Figure 7. Monthly actual dry bean crop evapotranspiration with standard deviation among twenty-two dry bean fields for the 2016–2020 period under center-pivot irrigation.
Agronomy 12 02629 g007
Figure 8. Monthly actual alfalfa evapotranspiration with standard deviation among twenty-two alfalfa fields for the 2016–2020 period under center-pivot irrigation.
Agronomy 12 02629 g008
Figure 9. Seasonal crop evapotranspiration (mm) of maize, potatoes, dry beans, and alfalfa for the 2016–2020 period.
Agronomy 12 02629 g009
Table 1. Summary of the analysis of variance of crop monthly and seasonal ETa.
SourcedfType III SSMSFPSignificance
Main Effects
Year432,705.38176.3335.060.0000Highly significant
Month55,325,143.81,065,028.84566.70.0000Highly significant
Crop3409,794.9136,598.3585.70.0000Highly significant
Interaction
Year*Month2097,802.34890.120.90.0000Highly significant
Year*Crop1246,315.83859.616.50.0000Highly significant
Month*Crop151,392,370.992,824.7398.00.0000Highly significant
Year*Month*Crop60182,261.13037.713.00.0000Highly significant
Error2485579,541.9233.2
Total26048,145,994.9
Model1197,566,452.963,583.6272.60.0000Highly significant
Publisher’s Note: MDPI stays neutral with regard to jurisdictional claims in published maps and institutional affiliations.

