Article

Metabolism Reorganization in Kale (Brassica oleracea L. var acephala) Populations with Divergent Glucosinolate Content under Thermal Stresses

by
María Díaz-Urbano
,
Pablo Velasco
,
María Elena Cartea
and
Víctor M. Rodríguez
*
Group of Genetics, Breeding and Biochemistry of Brassica Crops, Mision Biologica de Galicia (MBG), CSIC, 36143 Pontevedra, Spain
*
Author to whom correspondence should be addressed.
Agronomy 2022, 12(11), 2652; https://doi.org/10.3390/agronomy12112652
Submission received: 7 October 2022 / Revised: 21 October 2022 / Accepted: 23 October 2022 / Published: 27 October 2022
(This article belongs to the Special Issue Omics Methods for Probing the Abiotic Stress Responses in Plants)

Abstract

:
Thermal stress causes the reduction in productivity and harvest quality. To adapt to different temperature ranges, plants activate protecting metabolic pathways. Previous studies have reported that stressful environments due to abiotic stresses have an impact on the accumulation of glucosinolates (GSLs) in Brassicaceae plants. In order to determine the role of GSLs in the plant response to thermal stress, we conducted a study comparing four populations with a high and low GSL content. The GSL levels were analysed at different temperatures [control (20), 12 and 32 °C], detecting that populations with a higher GSL content increased their resistance to the cold. In addition, populations subjected to the cold increased the content of indolic GSLs. Populations with high levels of GSLs show higher levels of glucobrassicin (GBS) and sinigrin (SIN) under cold temperatures than plants grown under control conditions. High temperatures have a lower impact on GSLs accumulation. To elucidate the induced metabolic changes due to the accumulation of GSLs under cold conditions, we performed an untargeted metabolomic analysis and identified 25 compounds differentially expressed under cold conditions in the populations with a high GSL content. Almost 50% of these compounds are classified as lipids (fatty amides, monoradylglycerols, diterpenes, glycosylglycerols, linoleic acids and derivatives). Organoheterocyclic and nitrogenous organic compounds are also over-represented. Therefore, the current results suggest that GSLs play a key role in cold tolerance. Although the associated molecular mechanisms have not been elucidated, the non-targeted metabolomics assay shows a significant change in the lipid profile, with compounds that need to be studied further.

1. Introduction

Temperature is one of the major modulator factors of life distribution on Earth. Life beings only can survive on a relatively narrow range of temperatures, though optimal growth temperatures are distinct on different species. Plants are a poikilothermic organism and, due to their lack of motility, are specially exposed to air temperature variations. Even pioneer plants, which modulate plant development and phenology, are sensitive to air temperatures [1]. Specific temperature sensors have not been identified thus far in plants. Indeed, due to their large surface/volume ratio, almost every molecule of the plant is susceptible to temperature variations [2]. However, some molecular structures are especially sensitive to temperature changes. The physical properties of cell membranes change with fluctuations in air temperatures [3]. As temperatures descend, movements of lipids within membranes slow down and cell membranes become more rigid. Conversely, as air temperatures rise, membranes become more fluid. The fluidity of the cell membranes can be modulated by changing the lipid composition. The increase in the ratio of polyunsaturated lipids is a well-known strategy for cold adaptation [4,5].
Changes in a membranes’ fluidity triggers an intracellular signal cascade mediated by Ca2+. The transient increase in cytosolic Ca2+ is a common response to plants exposed to cold and heat stresses [6,7] and can be mimicked by compounds that interfere with membrane fluidity. Aside from Ca2+, hydrogen peroxide (H2O2) and nitric oxide (NO) are a common secondary messenger on the plant response to thermal stress. The downstream cascade differs between the heat and cold response. The response to cold temperatures activates the expression of the COR (cold-responsive) genes mediated by CBF transcription factors in Arabidopsis [8]. Though, a few years later, these authors also demonstrate that a significant part of the cold-response is CBF-independent [9]. The response to high temperatures is accompanied by the activation of heat-shock transcription factors (HSFs) which bind the promoter of heat shock proteins (HSPs) genes [10]. The final result of the signaling cascade to cold or heat stress is a modulation of the plant metabolome. Kaplan et al. [11] studied the metabolic response to temperature shock in Arabidopsis thaliana. They reported that 38% of the identified metabolites respond specifically to cold temperatures, whereas 4% respond only to heat stress and 19% respond to both stresses. Thermal stress affects both the primary and secondary metabolome [12,13].
Interestingly, some papers suggest that glucosinolates (GSLs) have a role on the thermal shock response. Glucosinolates are sulphur-containing compound characteristics of the Brassicaceae plant family. The major biological role of these compounds in response to the biotic interactions has been extensively studied [14,15,16,17]. Several papers reported that changes in growth temperatures affect the accumulation of different GSLs on brassica plants. On field experiments, Bohinc and Trdan [18] find a positive correlation between the highest temperature and epiprogoitrin content and a slightly negative correlation with the glucobrassicin (GBS) content in different Brassicaceae species. Controlled experiments were performed by Engelen-Eigles et al. [19], showing that night temperatures below 20 °C induce a gluconasturtiin accumulation in watercress (Nasturtium officinale R. Br.). The tu8 Arabidopsis mutant shows an altered GSL profile and a reduced tolerance to heat stress [20]. We have recently reported that a kale population with a higher content of GBS shows a better agronomical performance on field experiments than a population with the same genetic background and a lower GBS content under different environmental conditions [21]. The objective of the present paper was to elucidate the role of GSLs on plant resilience to thermal stress and to determine the metabolomic changes that drive that response.

2. Materials and Methods

2.1. Plant Material and Growth Conditions

Plant material consists of four kale (Brassica oleracea var. acephala) populations with a modified content of GSLs. Two divergent populations for the glucobrassicin (GBS) content (High-GBS and Low-GBS) and two for the sinigrin (SIN) content (High-SIN and Low-SIN) were obtained as described previously by Sotelo et al. [22] by mass divergent selection. The starting material was a kale population (MBG-BRS0062) showing variability for GSL concentration, from the brassica germplasm bank at MBG-CSIC (Pontevedra, Spain). The plant material was evaluated on a walk-in growth chamber in multi-pot (0.8 L each) trays filled with sterilized peat (Gramoflor GmbH & Co. KG, Vechta, Germany) with one seed per cavity. The seedlings were grown under white light (228 μmol m−2 s−1) in a 16 h light/8 h dark–light regime. The temperatures were set at constant day–night 20 ± 1 °C for the control experiments and 12 ± 1 °C and 32 ± 1 °C for the cold and heat treatments, respectively.

2.2. Agronomic Parameters

The fresh weight was recorded immediately after the harvest of the aerial part of the seedling on 25 biological replicates per population and temperature at the three leaves developmental stage.

2.3. Biochemical Analysis

The glucosinolates were extracted and desulphated as described by Rodriguez et al. [23] from ten biological replicates. The detection and quantification were performed using an Atlantis® T3 C18 column (3 μm particle size, 2.1 mm × 100 mm i.d.) and a mobile phase consisting of acetonitrile and water. Glucotrapeolin (GTP) was used as the internal standard. The quantification was performed at 229 nm in a Nexera LC-30AD UHPLC (Shimadzu, Kyoto, Japan) using the chemical standards for the major glucosinolates identified in kale and expressed as µmolg−1 of the dry weight. Standard curves were made with at least five data points. The total glucosinolates content and the content of the two classes of GSLs (indolics and aliphatics) were calculated by adding the content of the individual glucosinolates.
An analysis of the untargeted metabolomics were performed as described by Poveda et al. [21] on ten biological replicates. Before the injection, the LC-qTOF system stability was tested by three consecutive injections of chloramphenicol (ESI − mode; ΔRT = 0.02 min; Δm/z = 0.002) and triphenyl phosphate (ESI + mode; ΔRT = 0.02 min; Δm/z = 0.001). The peak alignment and feature detection on the raw data were performed using the T-Rex 3D algorithm from MetaboScape 4.0 software (Bruker Daltoniks, Bremen, Germany). The peak stability was determined by using the QC samples obtained by pooling two µL of each individual sample. The QC samples were injected in every 10 samples. An in-house R script was used to remove from the analysis the peaks that were not present at least in 50% of the QC samples or with a relative standard deviation (RSD) > 20%.

2.4. Statistical Analysis

A one-way ANOVA was performed to analyse the agronomic parameters, as well as the GSL content, within each temperature treatment using the procedure GLM of SAS (SAS Institute Inc., Cary, NC, USA; 2008). The populations and replications were used as the classification variables. Replications were considered to be the random effects and populations were fixed. Comparisons of the means were made using the Fishers’ protected LSD at p ≤ 0.05.
A multivariate statistical analysis approach was used to analyse the untargeted metabolomics data. Positive and negative data sets were combined to remove redundancies based on the retention time and neutral exact mass. Data were analysed using the web-based software Metaboanalyst [24]. In order to remove non–informative variables, the data were filtered using the interquantile range filter (IQR). Pareto variance scaling was used to remove the offsets and adjust the importance of high- and low-abundance ions, whilst keeping the data structure partially intact. The resulting three-dimensional matrix (peak indices, samples and variables) was further subjected to statistical analysis. A partial least squares discriminant analysis (PLS-DA) was carried out to investigate and visualize the pattern of the metabolite changes. The PLS model was evaluated through a cross-validation (R2 and Q2 parameters). The differential ions from both conditions were selected according to the VIP (variable importance in projection; VIP score ≥ 2) list obtained from the PLS-DA. These important features were selected as parent ions for the MS/MS and identification analysis.

2.5. Compound Identification

The feature table was hand-filtered to remove the putative fragments due to the in-source fragmentation of real metabolites. Features that coelute (RT window ≤ 6 s) and with an intensity correlation coefficient ≥ 0.8 among the samples were considered as the potential fragments. We used the software MetaboScape 4.0 (Bruker Daltoniks, Germany) and SIRIUS 4.7.0 [25] to assign a molecular formula to each metabolite based on the exact mass and the isotopic pattern. The molecular formula was used to search for candidates in different publicly available databases: METLIN, KEGG, Pubchem, ChEBI, HMDB and the Plant Metabolic Network. Candidates were filtered by the comparison of the MS/MS fragmentation patterns against the reference compounds found in the previously mentioned databases. Once identified, the compounds were classified following a chemical ontology rule using the web-based application ClassyFire [26].

3. Results

3.1. Populations with High GSLs Content Performed Better at Cold Conditions

To test the role of GSLs on plant adaptation to extreme temperatures, we evaluated four divergent populations from a selection of a high and low content of the two major GSLs present in B. oleracea (GBS and SIN). The two populations with a higher content of GBS (HGBS) and SIN (HSIN) showed a higher fresh weight than those with a lower content (LGBS and LSIN) (Figure 1a), suggesting that these GSLs may play a role in plant adaptation to low temperatures. We observed a significant accumulation of GSLs when plants are grown at low temperatures compared to that measured at the control conditions (Figure 1b). This accumulation is more remarkable in the two populations with higher a content of GBS and SIN. There was no clear effect observed when the plants were grown at a high temperature. Only the population with a high SIN content shows a significant increase in the total GSLs content at those conditions, but this is not correlated with changes in the fresh weight.
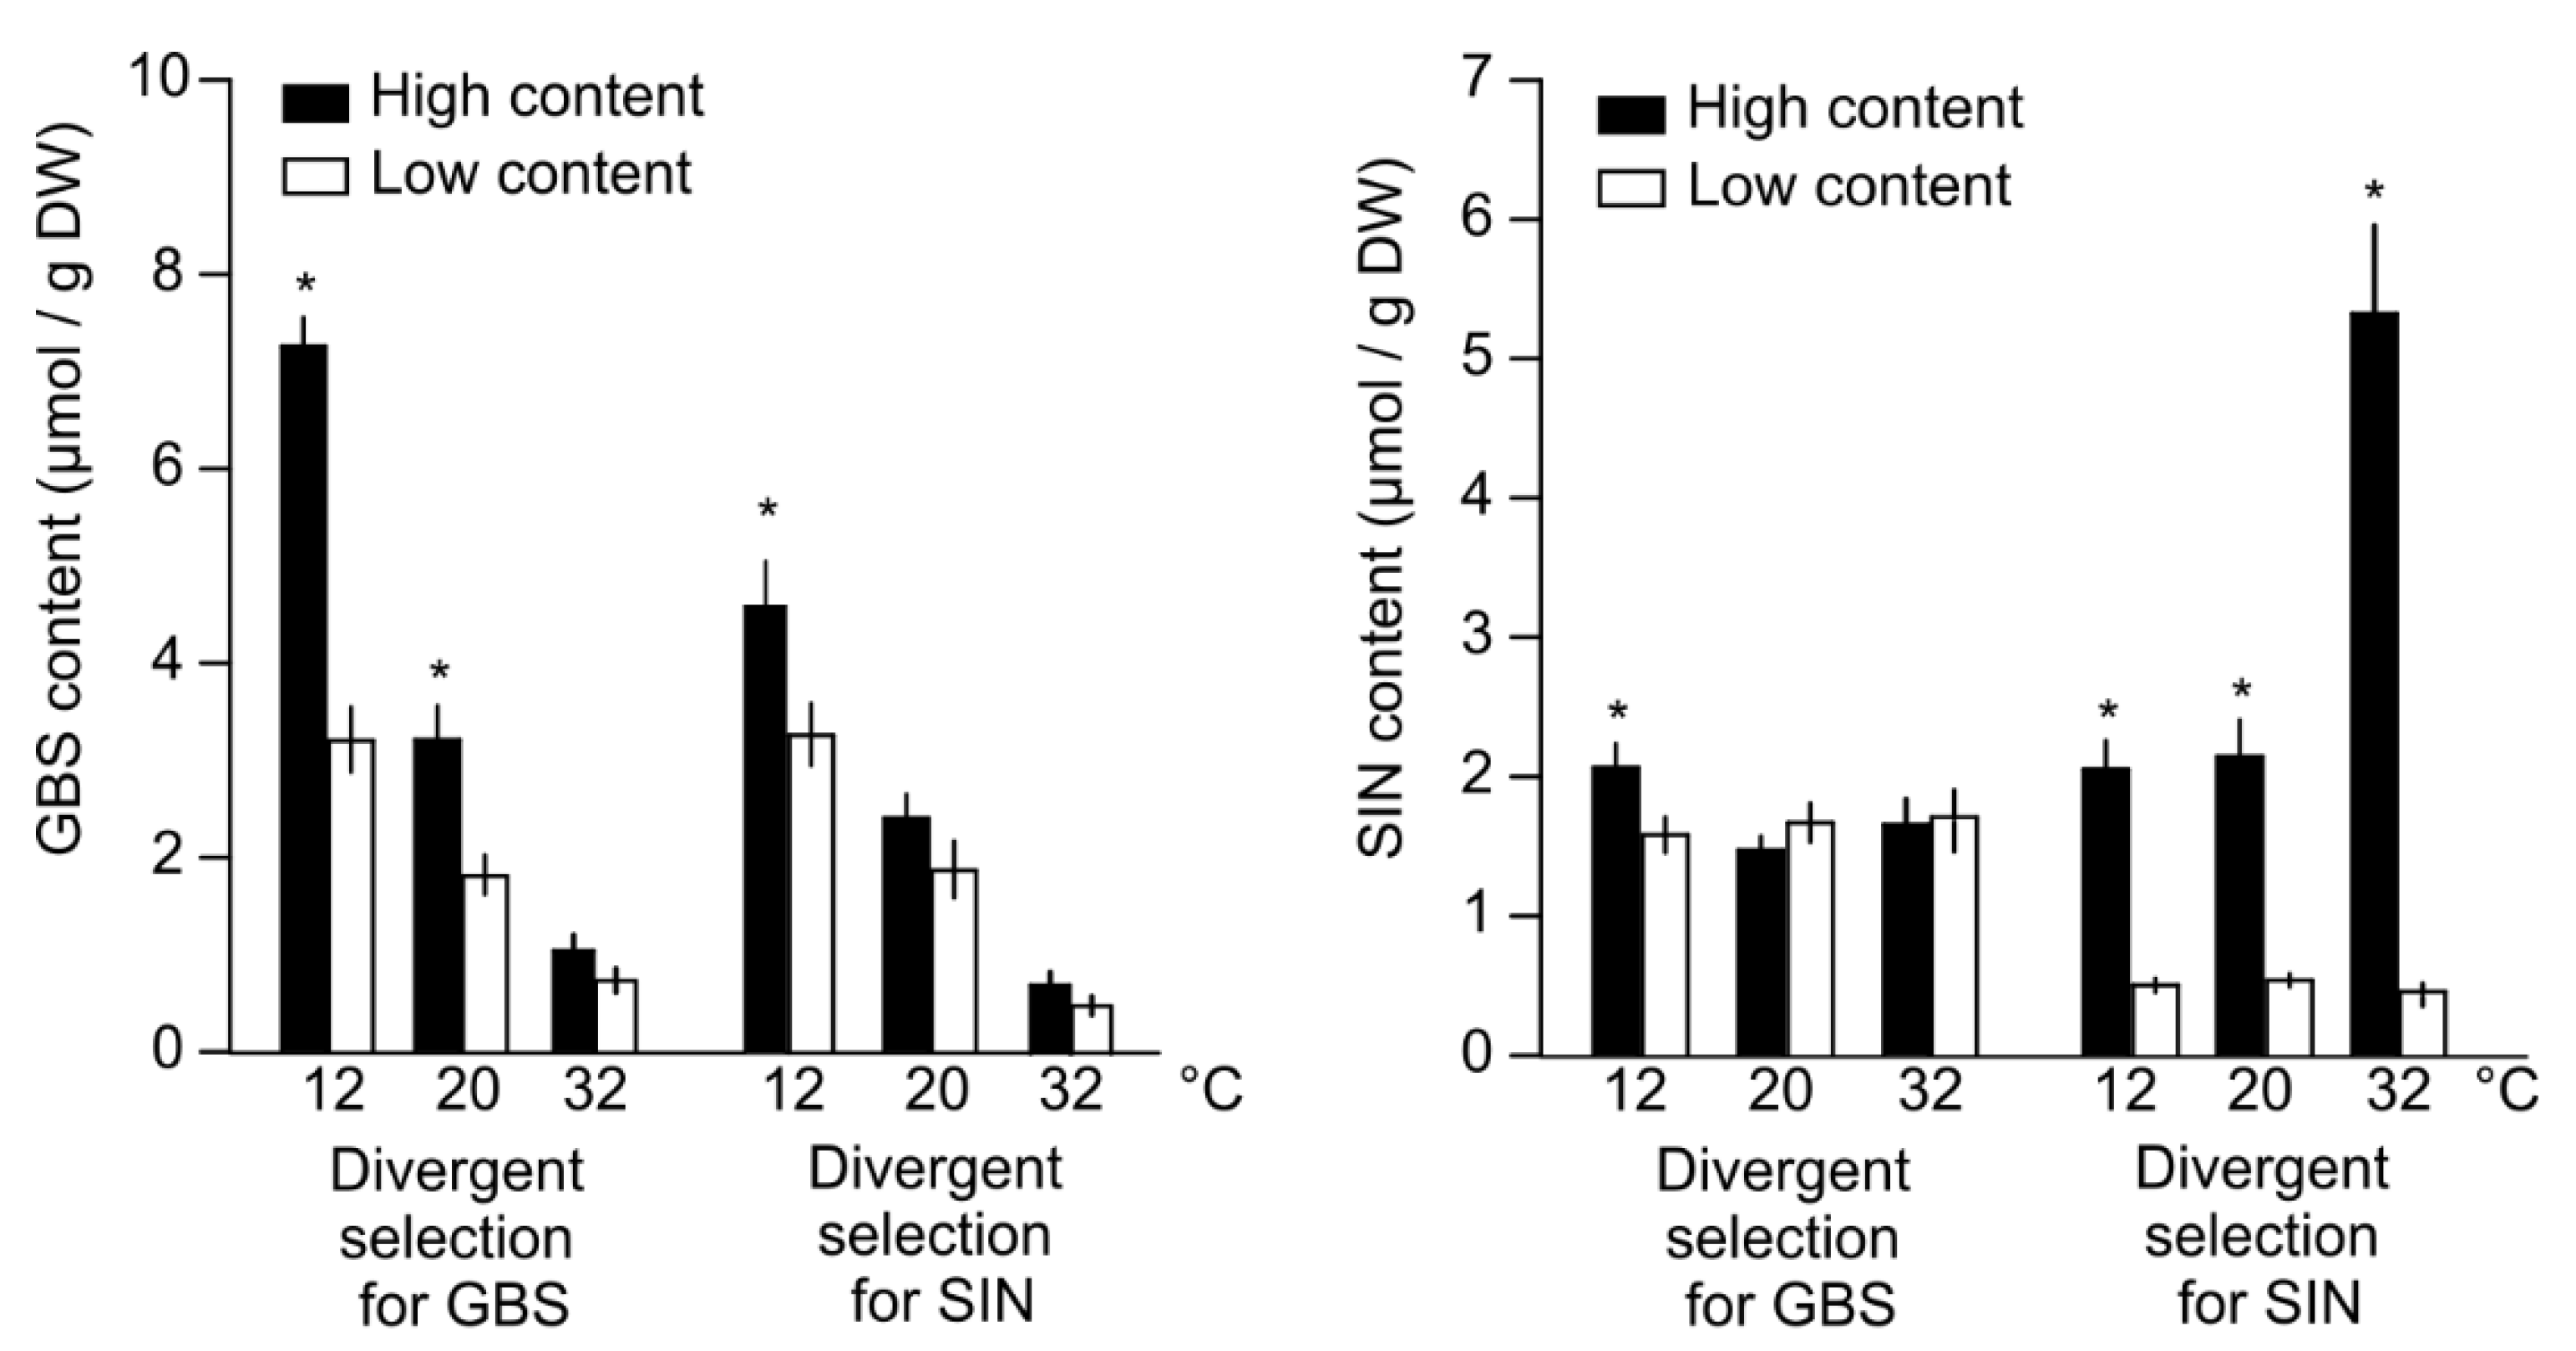
B. oleracea accumulates two major groups of GSLs, aliphatics and indolics [27]. Low temperatures clearly stimulate the accumulation of indolic GSLs in the four populations evaluated in this study, but there is not a clear effect on the aliphatic GSLs (Figure 1c,d). Conversely, high temperatures significantly inhibit the accumulation of indolic GSLs in three out of the four evaluated populations. Once again, the effect is more drastic on the populations with a higher content of GBS and SIN than in those with a lower content. Populations with a high GSLs content show a significant increase in GBS and SIN when plants are grown at cold conditions compared to the levels recorded and the control temperatures (Figure 2). There was no impact of high temperatures in the accumulation of this GSL, except for the SIN content in the HSIN population. This tendency is not so clear for other GSLs (Figure S1).

3.2. Profile of Metabolomics Reorganization of Plants with High GSLs Content at Low Temperatures

We performed an untargeted metabolomics study in order to determine the metabolomic changes that occur in the B. oleracea populations that could be correlated with a better performance at low temperatures. Since, in general terms, we observed a common response in the populations with a higher GSL content compared to that of the populations with a lower content, we combined the two groups of the populations for a metabolomics analysis. When we analysed all the samples together, the first component explains more than 50% of the variability of the model (Figure S2). The distribution of the samples along this axis is due to the differences among the temperatures. For this reason, we decided to compare the populations with a high and low GSL content independently at the control and low temperatures. Values of Q2 > 0.71 and R2 > 0.98 were obtained for the PLS-DA model comparing the high and low GSL populations at low temperatures, whereas values of Q2 > 0.58 and R2 > 0.95 were obtained in the analysis at the control temperatures. A PLS-DA model is believed to be reliable when Q2 > 0.5 and R2 > Q2. Thus, these results indicate a good prediction power of the model.
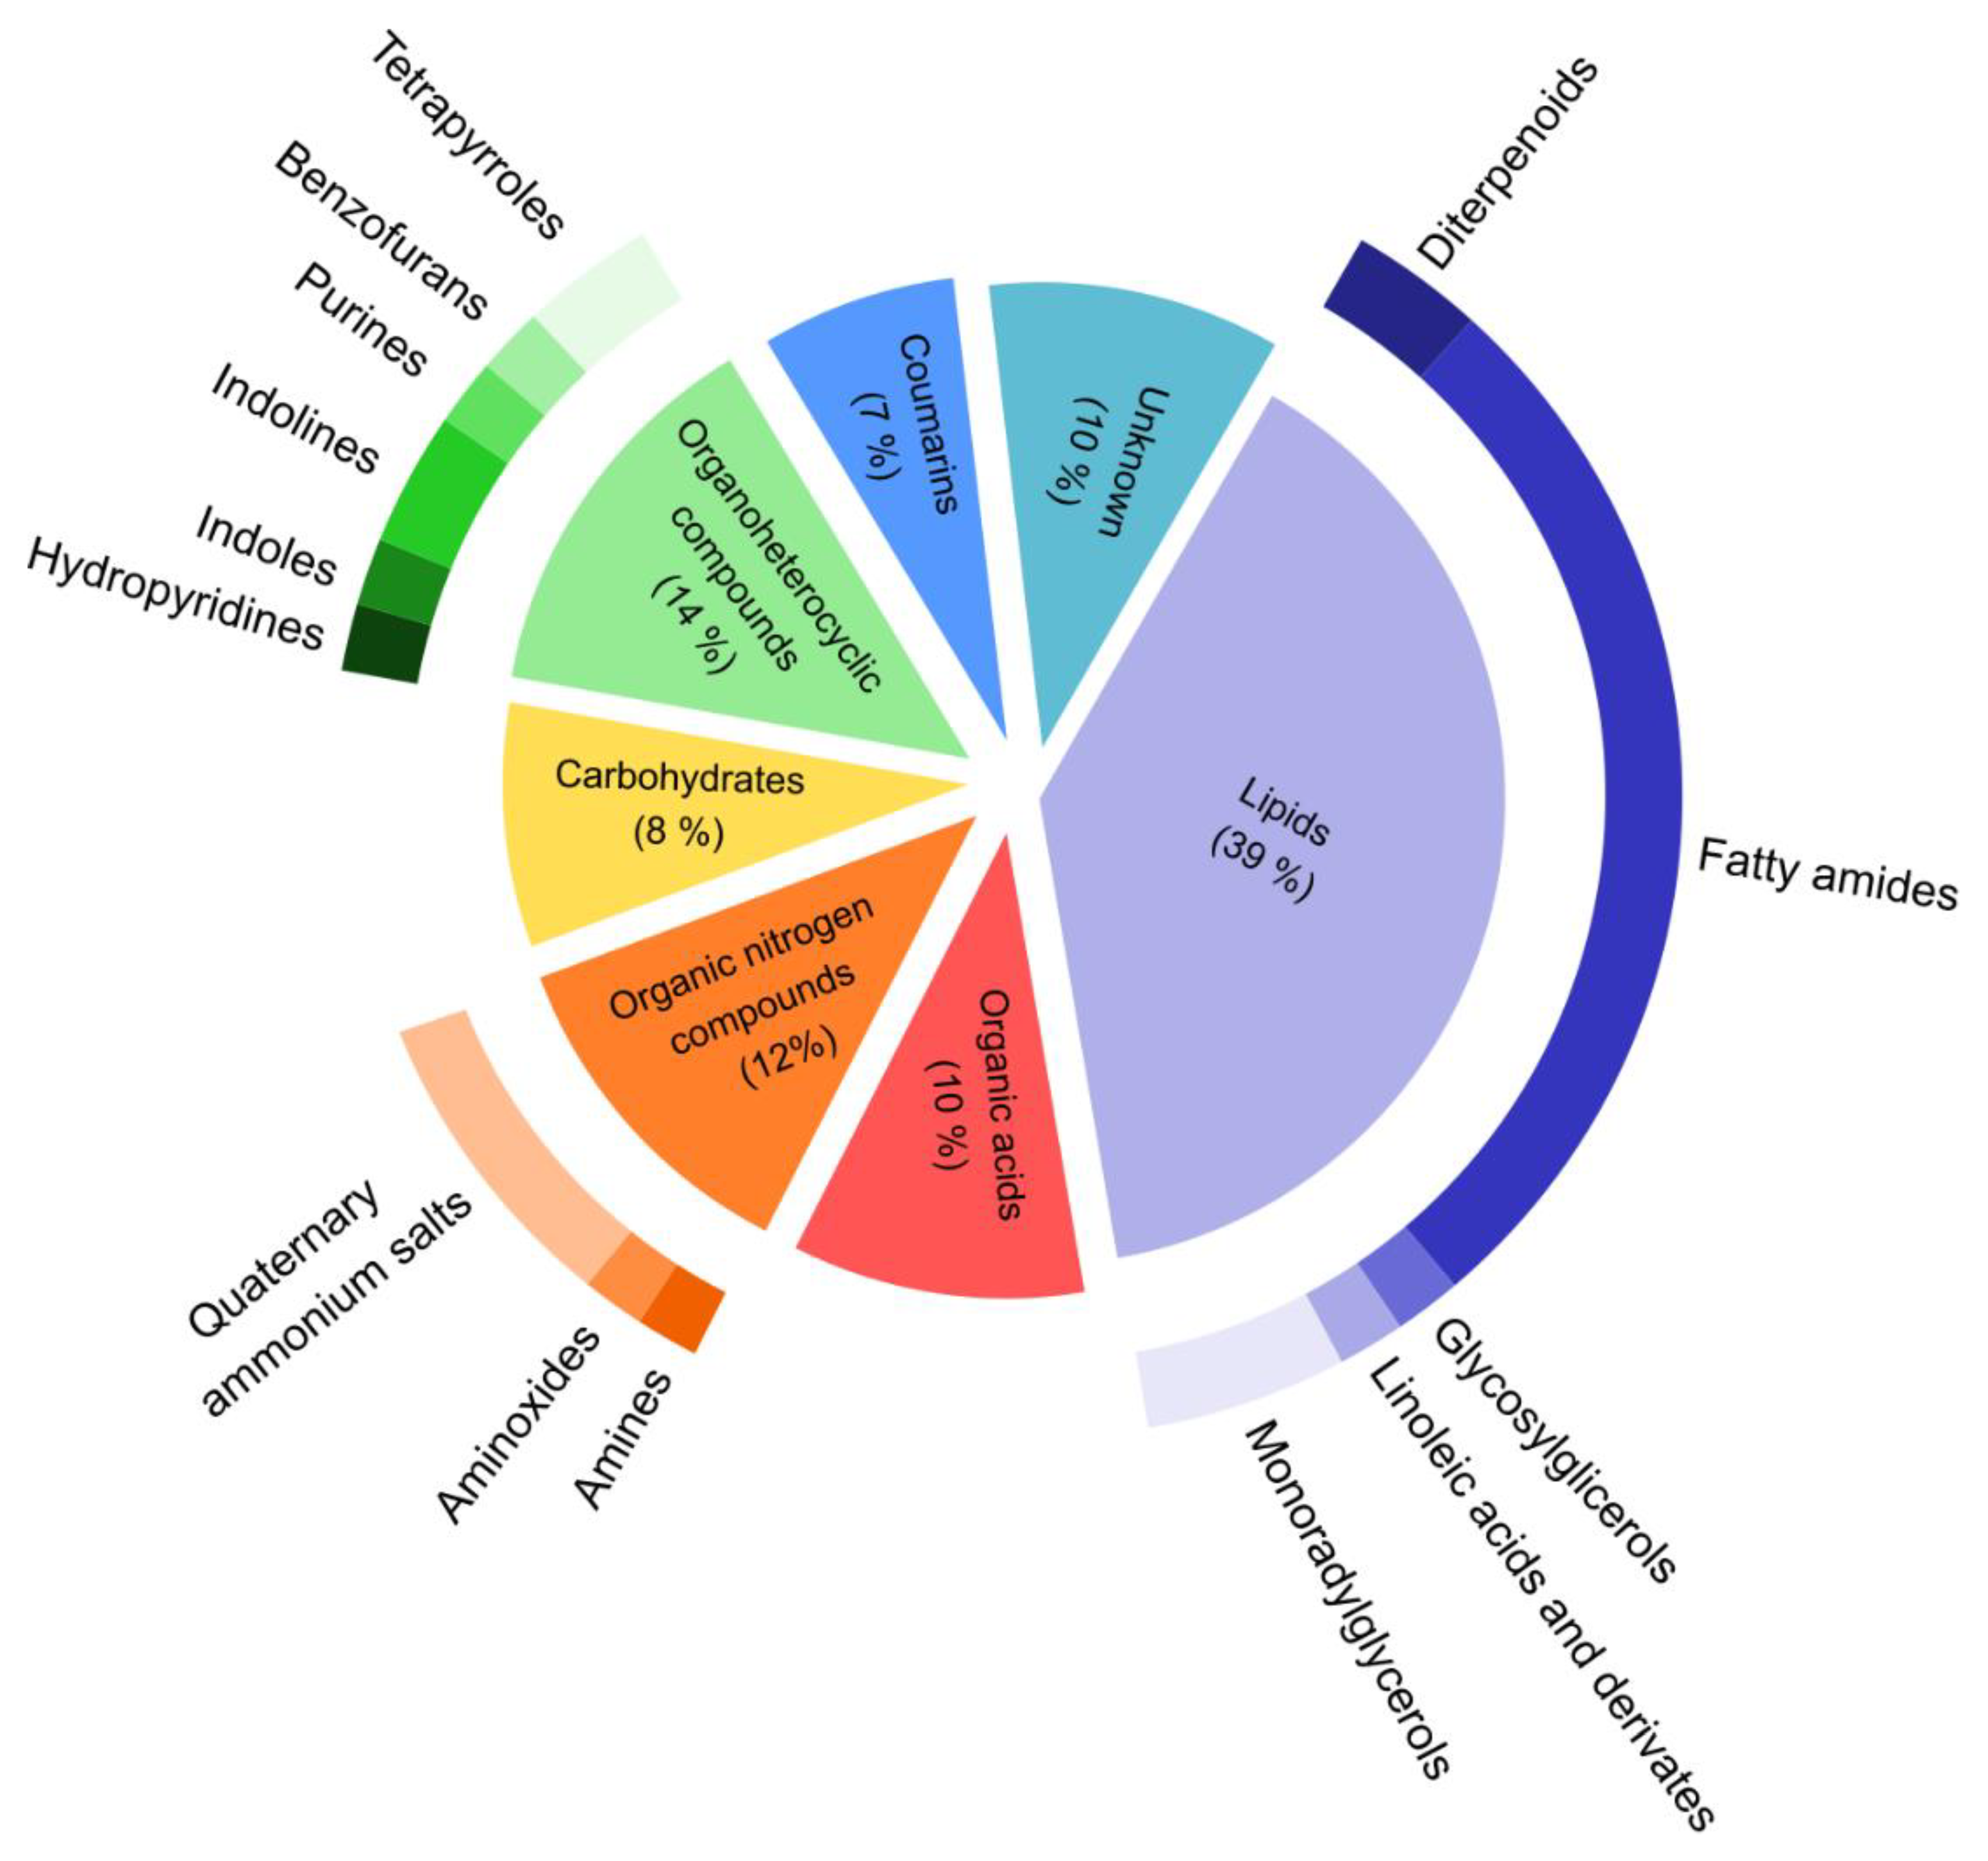
The score-plot representation of the multivariate PLS analysis shows a clear separation on the metabolomic profile of both groups of populations at low temperatures, whereas the separation at the control conditions is less clear (Figure 3a,b). Features with a VIP score > 2 were hand filtered and features an intensity correlation coefficient > 0.6 among the samples and a ΔRT < 0.8 s was carefully studied to remove those that were most likely due to the in-source fragmentation of real metabolites. Finally, we identified 71 putative metabolites with a higher relevance on the PLS model at a cold temperature. A molecular formula was assigned to 56. This molecular formula was used to search on the publicly available metabolites databases (see M&M). We were able to associate a putative unique compound name to 54 features. Based on the chemical classification of the web database ClassyFire (http://classyfire.wishartlab.com/ (accessed on 23 June 2022)) [26], these compounds were grouped on six major chemical classes (Figure 4).
Almost 40% of these compounds are classified as lipids and lipid-like compounds. Most of these lipids are fatty amides, although monoradylglycerols, diterpenes, glycosylglycerols, linoleic acids and derivatives are also present. Organoheterocyclic and nitrogenous organic compounds account for a 14 and 12% of the cold differentially expressed compounds, respectively. The organoheterocyclic group includes tetrapyrroles, indolines, benzofurans, purines, indoles and hydropyridines. Within the group of nitrogenous compounds, we detected quaternary ammonium salts, aminoxides and amines. The remaining quarter of the compounds are organic acids, carbohydrates and coumarins. Ten per cent of these features could not be assigned to any chemical class.
In order to identify the core metabolomic response to low temperatures in plants with a high GSL content, those features that are also relevant in the comparison between populations with a high and low GSL content at the control conditions have been removed from the list. Overall, 46 features show a common behaviour at both conditions (control vs. cold treatments). The remaining 25 compounds are listed on Table 1; the fold changes of these compounds are listed in Table S1.

4. Discussion

Like the rest of the species of the Brassicaceae family, B. oleracea plants are characterized by the presence of a type of secondary metabolites, specific to the Brassicales order and practically exclusive to the Brassicaceae family, called GSLs. The role of these compounds against biotic stresses have been extensively studied. When plants undergo a tissue breakdown, GSLs are degraded to biological active compounds (i.e., nitriles or isothiocyanates) that have an antibiotic activity. Intact GSLs accumulate in the plant chloroplasts of healthy tissues. Such an accumulation could be considered as a reservoir of the biological active derivates. It has been shown that GSLs can act as a sulphur reservoir, so an increase in the GSL concentration can lead to higher availability of this compound and a further growth under stress conditions [28]. However, more and more different studies suggest that intact GSLs may play a role in the plant metabolism. Some studies have shown that abiotic stresses have an impact on the accumulation of these compounds. Salinity, drought and increases in the ultraviolet radiation levels produce a considerable increase in the accumulation of GSLs in plants of different species of the Brassica genus [29], while high temperatures produce the opposite effect [23]. Ludwing-Müller et al. [20] reported that the tu8 mutant of Arabidopsis shows a defective phenotype when grown at high temperatures. This mutant is also defective in the synthesis of GSLs, though the tu8 mutation does not directly affect the biosynthesis of GSLs.
In the present paper, four B. oleracea populations obtained from the divergent selection by a mass selection program have been used for the two major GSLs quantified in kale (GBS and SIN) [22] to elucidate the role of GSLs conferring thermal protection to brassica plants. The two populations with a higher GSL content increased their cold hardiness, whereas no differences were observed on the populations grown at high temperatures. The performance of the populations with a high GBS and high SIN content was similar at both thermal conditions. Since the four populations come from the same original kale population, and therefore have the same genetic background, this protecting effect is most likely due to the accumulation of GSLs in these genotypes. Interestingly, both populations selected for their high GSL content showed a significant accumulation of GBS and SIN under cold conditions, supporting the hypothesis that these GSLs may play a protective role under thermal stress. Under cold conditions, all populations increased the synthesis of indolic GSLs. Ljubej et al. [30] also reported an increase in the accumulation of indolic GSLs despite being under freezing temperatures. This may indicate that, although GSLs may be correlated with a protective effect at low temperatures, they show different accumulation patterns, and their mechanisms of action should be further studied. The complexity of the GSLs response to abiotic stresses is reflected in the bibliography, since different types of GSLs respond differentially to different magnitudes of stress. For example, only the gluconapin and glucobrassicin levels increase under severe salt stress in B. rapa [31], while high temperatures produce significant increases in glucoraphanin and glucoiberin synthesis in B. oleracea [23].
To elucidate how the metabolome is reorganized on high-GSLs containing plants under cold conditions we performed in an untargeted metabolomic study. A multivariant supervised statistical analysis allow for an identification of a group of 71 compounds that respond differentially in plants with a high GSL content under cold conditions. Among these compounds, we may highlight the presence of lipids and lipid-like molecules, amino acids, phenolics (coumarins), phytoanticipins, photosynthesis-related metabolites and osmotically active compounds. These results are part of a normal plant response to stress conditions. Osmotically active compounds include soluble sugars such as trehalose (C4H6O5). Several studies have described that during different abiotic stresses such as cold [32], heat, salt stress and desiccation [33], its concentration increases significantly. Its function is to maintain the membrane integrity, stabilize cell membrane and cellular organelles [32,34,35,36]. Some of the metabolites have been associated with a favourable response to abiotic stress conditions, such as phytoalexins (spirobrassininin and cyclobrassinin) and phytoanticipins (methoxyglucobrassicin) [37]; phenolic compounds such as coumarins [38]; and amino acids such as homocysteine thiolactone and phenylalanine [39]. Spirobrassinin and cyclobrassinin are biosynthesized from indolic GSLs. We observed a swift in the accumulation of these compounds under cold conditions, as reflected in the fold change results (Table S1). Populations with a high GSL content accumulate more spirobrassinin and cyclobrassinin than populations with low GSLs content under cold conditions, whereas at the control conditions, we observed the opposite results. This may be an indication of a different usage of GSLs in the plant metabolism under both conditions.
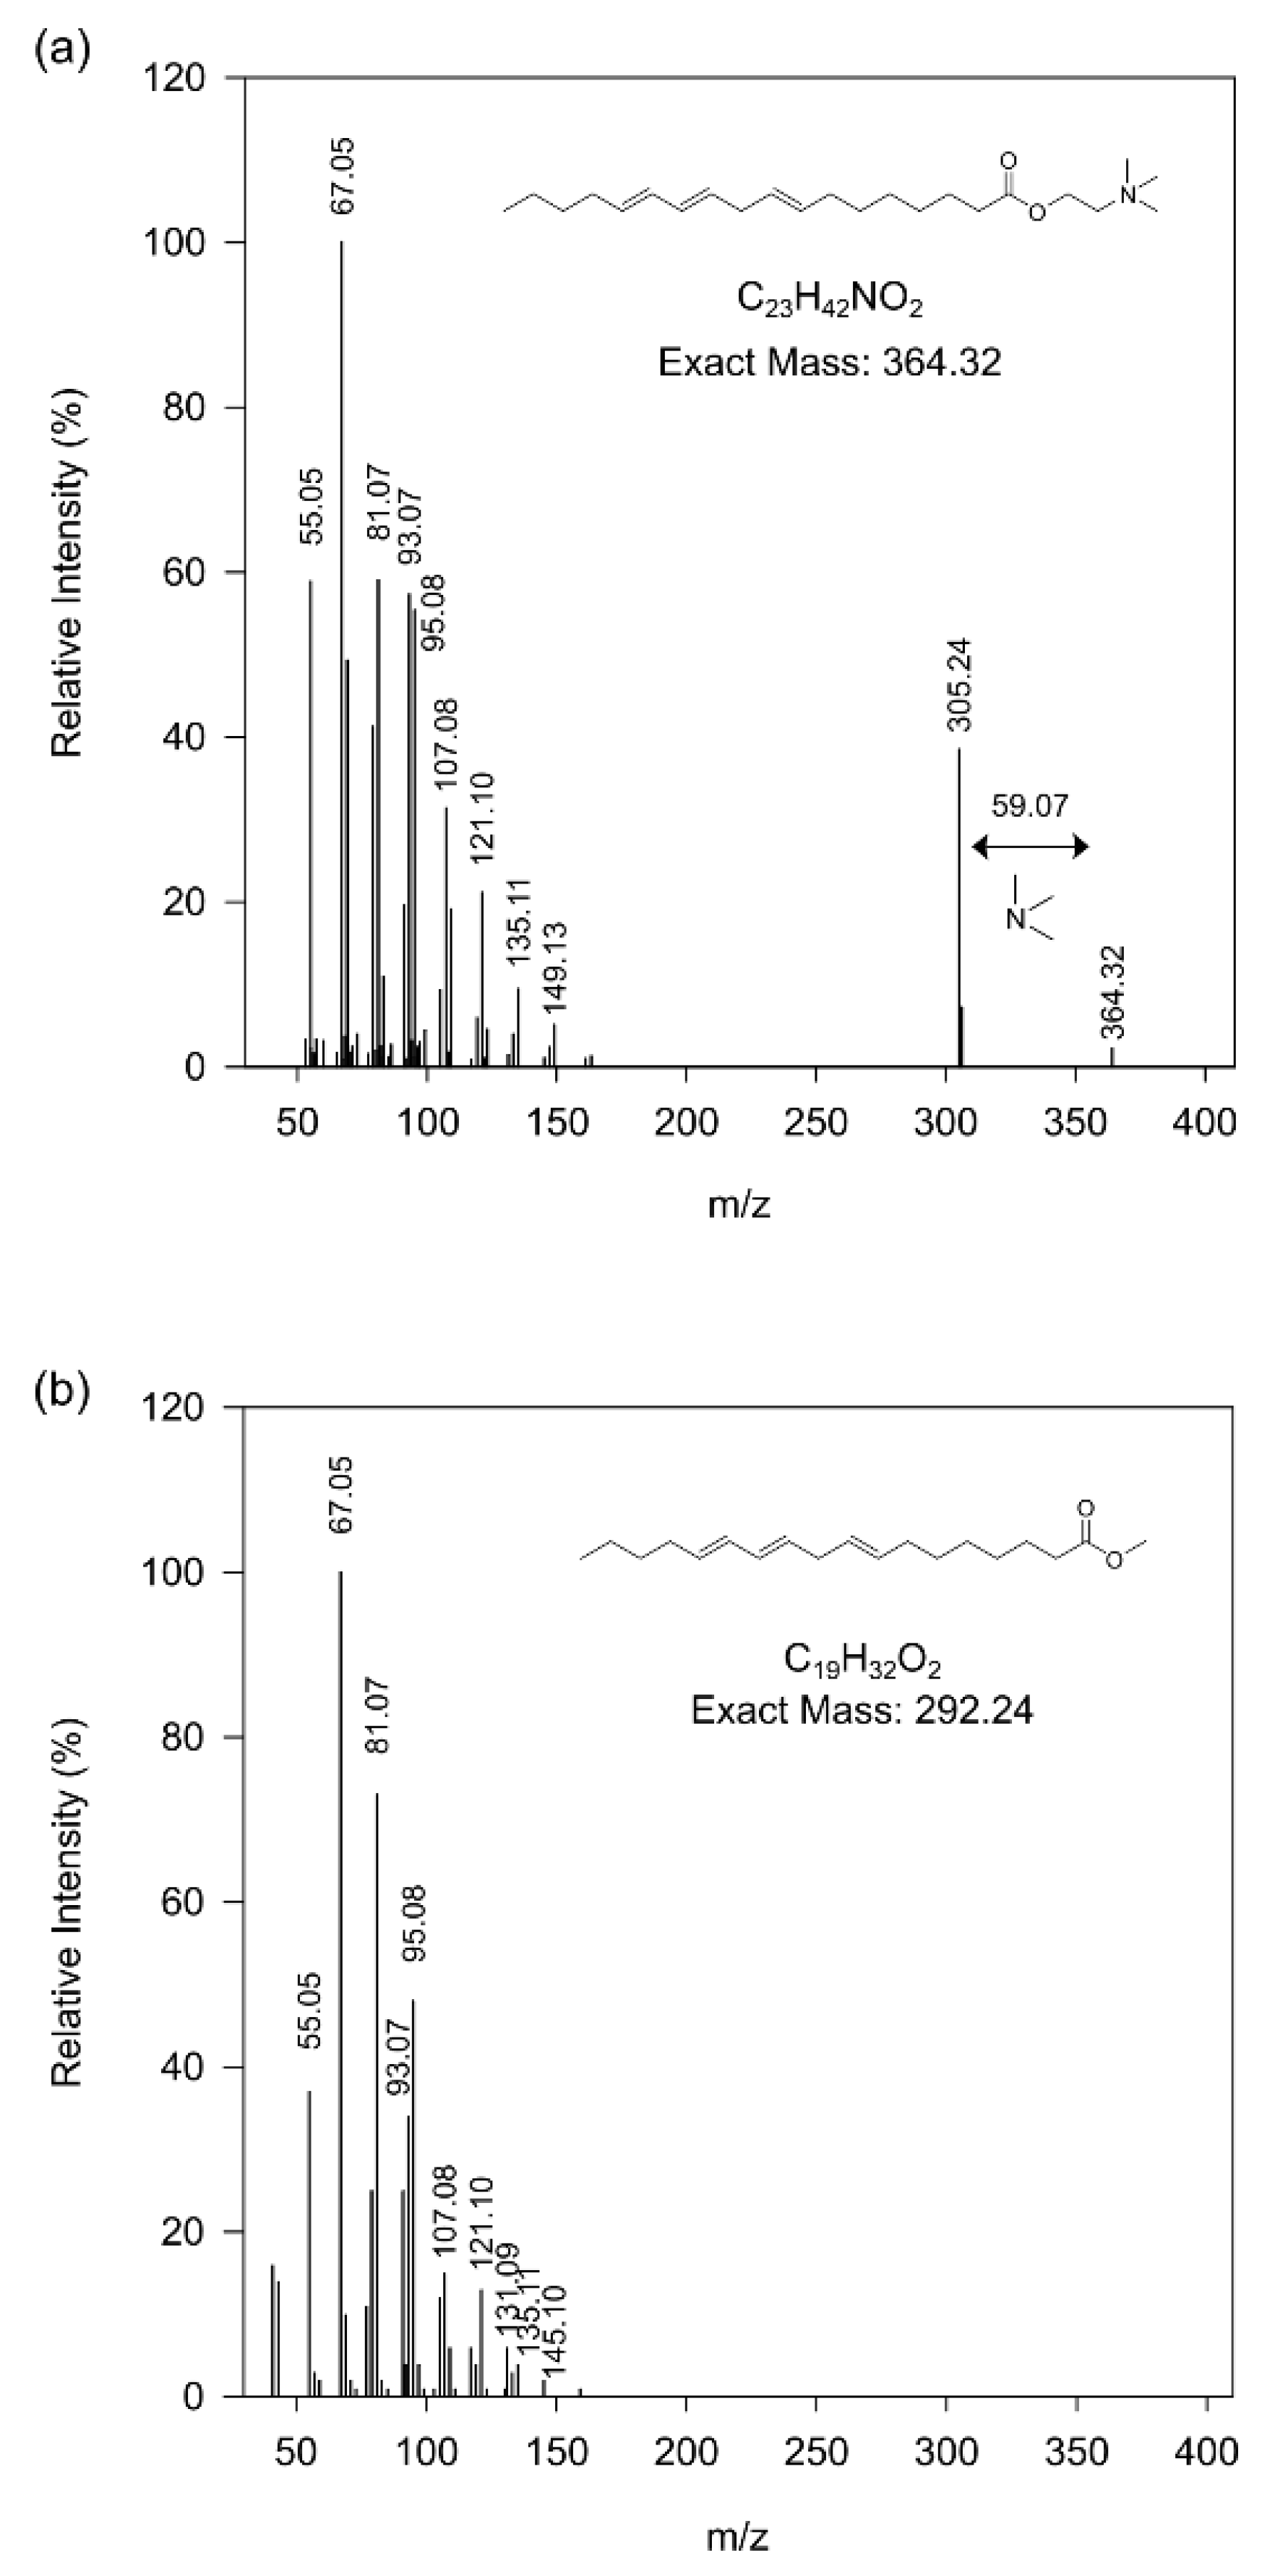
The reorganization of the lipid metabolism may be due to biochemical changes in cellular membranes. When plants are subjected to temperatures below 15 °C, changes in cellular membranes occur to maintain functionality, since low temperatures affect their fluidity, ion transport, photosynthesis, etc. In particular, we detected an enrichment in fatty amides (oleamide, linoleoyl ethanolamide and linoleamide), which stand out as endogenous signalling molecule in animals and are gaining relevance in signalling in plants and in plant–microbe interactions [40]. Among these linoleic acid derivatives, the MS/MS fragmentation pattern shows the presence of a putative linoleyl-choline (Figure 5). To the best of our knowledge the presence of choline acylated with unsaturated fatty acids has not been described previously in plants. Nevertheless, the presence of acetylcholine in Arabidopsis seeds has been demonstrated [41], opening the possibility that choline acetyltransferases in plants could also esterify choline to longer fatty acids.
The core metabolomic response to cold temperature in populations with a high content of GSLs is constituted by 25 metabolites that are identified exclusively in the analysis at low temperatures. Lipids are still the predominant molecules that specifically respond to cold temperatures, accounting for 50% of the identified compounds. Most of these lipids are fatty acid amines and glycosylated linolenic (18:3) and linoleic (18:2) acids. Two putative enantiomers of the diterpenoid, dehydroabietic acid, were also identified. The second major groups of compounds, organoheterocyclic compounds, includes defensive molecules such as phytoalexins (spirobrassininin and cyclobrassinin), intermediates of chlorophyll catabolism (pyropheophorbide a) and a purine nucleotide (adenine). Curiously, one derivate of GBS, methoxyglucobrassicin, was also identified, specifically under cold conditions.

5. Conclusions

Our results indicate that some GSLs have a positive effect on the adaptation of B. oleracea plants to cold stress conditions. Populations with a higher GSL content showed a better adaptation to the cold, reflected in a higher vegetative development. The levels of GBS and SIN were significantly higher in plants grown at cold temperatures, supporting the hypothesis that these GSLs may play a role protecting the plant from physiological damage at low temperatures. The mechanisms involved in this process seem to be specific since plants with a high and low GSL content performed in a similar way under high temperatures, and no clear pattern of accumulation of GBS or SIN was observed under these conditions. When exposed to cold temperatures, B. oleracea plants undergo an extensive metabolome reorganization that is somehow driven by GSLs accumulation. Most of the metabolites involved in this reorganization were identified as lipid or lipid-like molecules, highlighting a previously undescribed compound in plants, linoleoyl-choline and cold protective molecules such as coumarins or phytoalexins. Although the exact mechanism by which they influence plant physiology is unknown, our recent results point to a profound reorganisation of the lipid metabolism that could act as a triggering signal to activate the cold-protective metabolic pathways.

Supplementary Materials

The following supporting information can be downloaded at: https://www.mdpi.com/article/10.3390/agronomy12112652/s1, Figure S1: Content of individual glucosinolates in four kale populations from two divergent selections for glucosinolate content grown at cold (12 °C) conditions. Figure S2: Score-plot of the three principal components from a PLSD analysis under control (20°) and cold (12 °C) conditions. Ten biological replicates were used per population. Table S1: Fold change of compounds listed on Table 1 comparing population with high (H) and low (L) glucosinolates content under control and cold conditions.

Author Contributions

Conceptualization, V.M.R. and P.V.; methodology, V.M.R. and P.V.; formal analysis, V.M.R. and M.D.-U.; resources, M.E.C. and P.V.; writing—original draft preparation, M.D.-U. and V.M.R.; writing—review and editing, P.V. and M.E.C.; funding acquisition, M.E.C. All authors have read and agreed to the published version of the manuscript.

Funding

This research and APC was funded by the Ministry of Science and Innovation, of the Government of Spain, grant number PID2021-126472OB-100.

Data Availability Statement

Data available on request from the authors.

Acknowledgments

We thanks Rosaura Abilleira for technical help with metabolomics analysis and Ruth Welti (Kansas State University) for help with lipid identification.

Conflicts of Interest

The authors declare no conflict of interest.

References

  1. Körner, C. Significance of temperature in plant life. In Plant Growth and Climate Change; Morison, J.I.L., Morecroft, M.D., Eds.; Blackwell Publishing: Oxford, UK, 2007; pp. 48–69. ISBN 1405131926. [Google Scholar]
  2. Mittler, R.; Finka, A.; Goloubinoff, P. How do plants feel the heat? Trends Biochem. Sci. 2012, 37, 118–125. [Google Scholar] [CrossRef] [PubMed]
  3. Ruelland, E.; Zachowski, A. How plants sense temperature. Environ. Exp. Bot. 2010, 69, 225–232. [Google Scholar] [CrossRef]
  4. Chen, M.; Thelen, J.J. ACYL-LIPID DESATURASE2 is required for chilling and freezing tolerance in Arabidopsis. Plant Cell 2013, 25, 1430–1444. [Google Scholar] [CrossRef] [PubMed] [Green Version]
  5. Miquel, M.; James, D., Jr.; Dooner, H.; Browse, J. Arabidopsis requires polyunsaturated lipids for low-temperature survival. Proc. Natl. Acad. Sci. USA 1993, 90, 6208–6212. [Google Scholar] [CrossRef] [PubMed] [Green Version]
  6. Saidi, Y.; Finka, A.; Goloubinoff, P. Heat perception and signalling in plants: A tortuous path to thermotolerance. New Phytol. 2011, 190, 556–565. [Google Scholar] [CrossRef]
  7. Miura, K.; Furumoto, T. Cold Signaling and Cold Response in Plants. Int. J. Mol. Sci. 2013, 14, 5312–5337. [Google Scholar] [CrossRef] [Green Version]
  8. Park, S.; Lee, C.-M.; Doherty, C.J.; Gilmour, S.J.; Kim, Y.; Thomashow, M.F. Regulation of the Arabidopsis CBF regulon by a complex low-temperature regulatory network. Plant J. 2015, 82, 193–207. [Google Scholar] [CrossRef] [Green Version]
  9. Park, S.; Gilmour, S.J.; Grumet, R.; Thomashow, M.F. CBF-dependent and CBF-independent regulatory pathways contribute to the differences in freezing tolerance and cold-regulated gene expression of two Arabidopsis ecotypes locally adapted to sites in Sweden and Italy. PLoS ONE 2018, 13, e0207723. [Google Scholar] [CrossRef] [Green Version]
  10. Baniwal, S.K.; Bharti, K.; Chan, K.Y.; Fauth, M.; Ganguli, A.; Kotak, S.; Mishra, S.K.; Nover, L.; Port, M.; Scharf, K.-D.; et al. Heat stress response in plants: A complex game with chaperones and more than twenty heat stress transcription factors. J. Biosci. 2004, 29, 471–487. [Google Scholar] [CrossRef]
  11. Kaplan, F.; Kopka, J.; Haskell, D.W.; Zhao, W.; Schiller, K.C.; Gatzke, N.; Sung, D.Y.; Guy, C.L. Exploring the temperature-stress metabolome of Arabidopsis. Plant Physiol. 2004, 136, 4159–4168. [Google Scholar] [CrossRef]
  12. Hoermiller, I.I.; Naegele, T.; Augustin, H.; Stutz, S.; Weckwerth, W.; Heyer, A.G. Subcellular reprogramming of metabolism during cold acclimation in Arabidopsis thaliana. Plant. Cell Environ. 2017, 40, 602–610. [Google Scholar] [CrossRef]
  13. Olenichenko, N.A.; Zagoskina, N.V.; Astakhova, N.V.; Trunova, T.I.; Kuznetsov, Y. V Primary and secondary metabolism of winter wheat under cold hardening and treatment with antioxidants. Appl. Biochem. Microbiol. 2008, 44, 535. [Google Scholar] [CrossRef]
  14. Jeschke, V.; Kearney, E.E.; Schramm, K.; Kunert, G.; Shekhov, A.; Gershenzon, J.; Vassão, D.G. How glucosinolates affect generalist lepidopteran larvae: Growth, development and glucosinolate metabolism. Front. Plant Sci. 2017, 8, 1995. [Google Scholar] [CrossRef] [Green Version]
  15. Sotelo, T.; Lema, M.; Soengas, P.; Cartea, M.E.; Velasco, P. In vitro activity of glucosinolates and their degradation products against brassica-pathogenic bacteria and fungi. Appl. Environ. Microbiol. 2015, 81, 432–440. [Google Scholar] [CrossRef] [Green Version]
  16. Badenes-Pérez, F.R.; Cartea, M.E. Glucosinolate induction and resistance to the cabbage moth, Mamestra brassicae, differs among kale genotypes with high and low content of sinigrin and glucobrassicin. Plants 2021, 10, 1951. [Google Scholar] [CrossRef]
  17. Santolamazza-Carbone, S.; Sotelo, T.; Velasco, P.; Cartea, M.E. Antibiotic properties of the glucosinolates of Brassica oleracea var. acephala similarly affect generalist and specialist larvae of two lepidopteran pests. J. Pest Sci. 2016, 89, 195–206. [Google Scholar] [CrossRef]
  18. Bohinc, T.; Trdan, S. Environmental factors affecting the glucosinolate content in Brassicaceae. J. Food Agric. Environ. 2012, 10, 357–360. [Google Scholar]
  19. Engelen-Eigles, G.; Holden, G.; Cohen, J.D.; Gardner, G. The effect of temperature, photoperiod, and light quality on gluconasturtiin concentration in watercress (Nasturtium officinale R. Br.). J. Agric. Food Chem. 2006, 54, 328–334. [Google Scholar] [CrossRef]
  20. Ludwig-Müller, J.; Krishna, P.; Forreiter, C. A glucosinolate mutant of Arabidopsis is thermosensitive and defective in cytosolic Hsp90 expression after heat stress. Plant Physiol. 2000, 123, 949–958. [Google Scholar] [CrossRef] [Green Version]
  21. Poveda, J.; Velasco, P.; de Haro, A.; Johansen, T.J.; McAlvay, A.C.; Möllers, C.; Mølmann, J.A.B.; Ordiales, E.; Rodríguez, V.M. Agronomic and metabolomic side-effects of a divergent selection for indol-3-ylmethylglucosinolate content in kale (Brassica oleracea var. acephala). Metabolites 2021, 11, 684. [Google Scholar] [CrossRef]
  22. Sotelo, T.; Velasco, P.; Soengas, P.; Rodríguez, V.M.; Cartea, M.E. Modification of leaf glucosinolate contents in Brassica Oleracea by divergent selection and effect on expression of genes controlling glucosinolate pathway. Front. Plant Sci. 2016, 7, 1012. [Google Scholar] [CrossRef] [PubMed]
  23. Rodríguez, V.M.; Soengas, P.; Cartea, E.; Sotelo, T.; Velasco, P. Suitability of a European nuclear collection of Brassica oleracea L. landraces to grow at high temperatures. J. Agron. Crop Sci. 2014, 200, 183–190. [Google Scholar] [CrossRef] [Green Version]
  24. Chong, J.; Wishart, D.S.; Xia, J. Using MetaboAnalyst 4.0 for comprehensive and integrative metabolomics data analysis. Curr. Protoc. Bioinform. 2019, 68, e86. [Google Scholar] [CrossRef] [PubMed]
  25. Dührkop, K.; Fleischauer, M.; Ludwig, M.; Aksenov, A.A.; Melnik, A.V.; Meusel, M.; Dorrestein, P.C.; Rousu, J.; Böcker, S. SIRIUS 4: A rapid tool for turning tandem mass spectra into metabolite structure information. Nat. Methods 2019, 16, 299–302. [Google Scholar] [CrossRef] [PubMed] [Green Version]
  26. Djoumbou Feunang, Y.; Eisner, R.; Knox, C.; Chepelev, L.; Hastings, J.; Owen, G.; Fahy, E.; Steinbeck, C.; Subramanian, S.; Bolton, E.; et al. ClassyFire: Automated chemical classification with a comprehensive, computable taxonomy. J. Cheminform. 2016, 8, 61. [Google Scholar] [CrossRef] [Green Version]
  27. Velasco, P.; Francisco, M.; Moreno, D.A.; Ferreres, F.; García-Viguera, C.; Cartea, M.E. Phytochemical fingerprinting of vegetable Brassica oleracea and Brassica napus by simultaneous identification of glucosinolates and phenolics. Phytochem. Anal. 2011, 22, 144–152. [Google Scholar] [CrossRef] [Green Version]
  28. Sugiyama, R.; Li, R.; Kuwahara, A.; Nakabayashi, R.; Sotta, N.; Mori, T.; Ito, T.; Ohkama-Ohtsu, N.; Fujiwara, T.; Saito, K.; et al. Retrograde sulfur flow from glucosinolates to cysteine in Arabidopsis thaliana. Proc. Natl. Acad. Sci. USA 2021, 118, e2017890118. [Google Scholar] [CrossRef]
  29. Variyar, P.S.; Banerjee, A.; Akkarakaran, J.J.; Suprasanna, P. Chapter 12-Role of Glucosinolates in Plant Stress Tolerance; Ahmad, P., Rasool, S., Eds.; Academic Press: San Diego, CA, USA, 2014; pp. 271–291. ISBN 978-0-12-800876-8. [Google Scholar]
  30. Ljubej, V.; Radojčić Redovniković, I.; Salopek-Sondi, B.; Smolko, A.; Roje, S.; Šamec, D. Chilling and freezing temperature stress differently influence glucosinolates content in Brassica oleracea var. acephala. Plants 2021, 10, 1305. [Google Scholar] [CrossRef]
  31. KeLing, H.; Zhujun, Z. Effects of different concentrations of sodium chloride on plant growth and glucosinolate content and composition in pakchoi. Afr. J. Biotechnol. 2010, 9, 4428–4433. [Google Scholar]
  32. Pramanik, M.H.R.; Imai, R. Functional identification of a trehalose 6-phosphate phosphatase gene that is involved in transient induction of trehalose biosynthesis during chilling stress in rice. Plant Mol. Biol. 2005, 58, 751–762. [Google Scholar] [CrossRef]
  33. Redillas, M.C.F.R.; Park, S.H.; Lee, J.W.; Kim, Y.S.; Jeong, J.S.; Jung, H.; Bang, S.W.; Hahn, T.R.; Kim, J.K. Accumulation of trehalose increases soluble sugar contents in rice plants conferring tolerance to drought and salt stress. Plant Biotechnol. Rep. 2012, 6, 89–96. [Google Scholar] [CrossRef]
  34. Pirzadah, T.B.; Malik, B.; Ul Rehman, R.; Hakeem, K.R.; Irfan Qureshi, M. Signaling in response to cold stress. Plant Signal. Underst. Mol. Crosstalk 2014, 9788132215424, 193–226. [Google Scholar] [CrossRef]
  35. Fernandez, O.; Béthencourt, L.; Quero, A.; Sangwan, R.S.; Clément Christophe, C. Trehalose and plant stress responses: Friend or foe? Trends Plant Sci. 2010, 15, 409–417. [Google Scholar] [CrossRef]
  36. Fu, J.; Miao, Y.; Shao, L.; Hu, T.; Yang, P. De novo transcriptome sequencing and gene expression profiling of Elymus nutans under cold stress. BMC Genom. 2016, 17, 870. [Google Scholar] [CrossRef] [Green Version]
  37. Pedras, M.S.C.; Zheng, Q.A.; Gadagi, R.S.; Rimmer, S.R. Phytoalexins and polar metabolites from the oilseeds canola and rapeseed: Differential metabolic responses to the biotroph Albugo candida and to abiotic stress. Phytochemistry 2008, 69, 894–910. [Google Scholar] [CrossRef]
  38. Döll, S.; Kuhlmann, M.; Rutten, T.; Mette, M.F.; Scharfenberg, S.; Petridis, A.; Berreth, D.C.; Mock, H.P. Accumulation of the coumarin scopolin under abiotic stress conditions is mediated by the Arabidopsis thaliana THO/TREX complex. Plant J. 2018, 93, 431–444. [Google Scholar] [CrossRef] [Green Version]
  39. Arasimowicz-Jelonek, M.; Floryszak-Wieczorek, J.; Gzyl, J.; Chmielowska-Bak, J. Homocysteine over-accumulation as the effect of potato leaves exposure to biotic stress. Plant Physiol. Biochem. 2013, 63, 177–184. [Google Scholar] [CrossRef]
  40. Sun, L.; Lu, Y.; Kronzucker, H.J.; Shi, W. Quantification and enzyme targets of fatty acid amides from duckweed root exudates involved in the stimulation of denitrification. J. Plant Physiol. 2016, 198, 81–88. [Google Scholar] [CrossRef]
  41. Murata, J.; Watanabe, T.; Sugahara, K.; Yamagaki, T.; Takahashi, T. High-resolution mass spectrometry for detecting Acetylcholine in Arabidopsis. Plant Signal. Behav. 2015, 10, e1074367. [Google Scholar] [CrossRef]
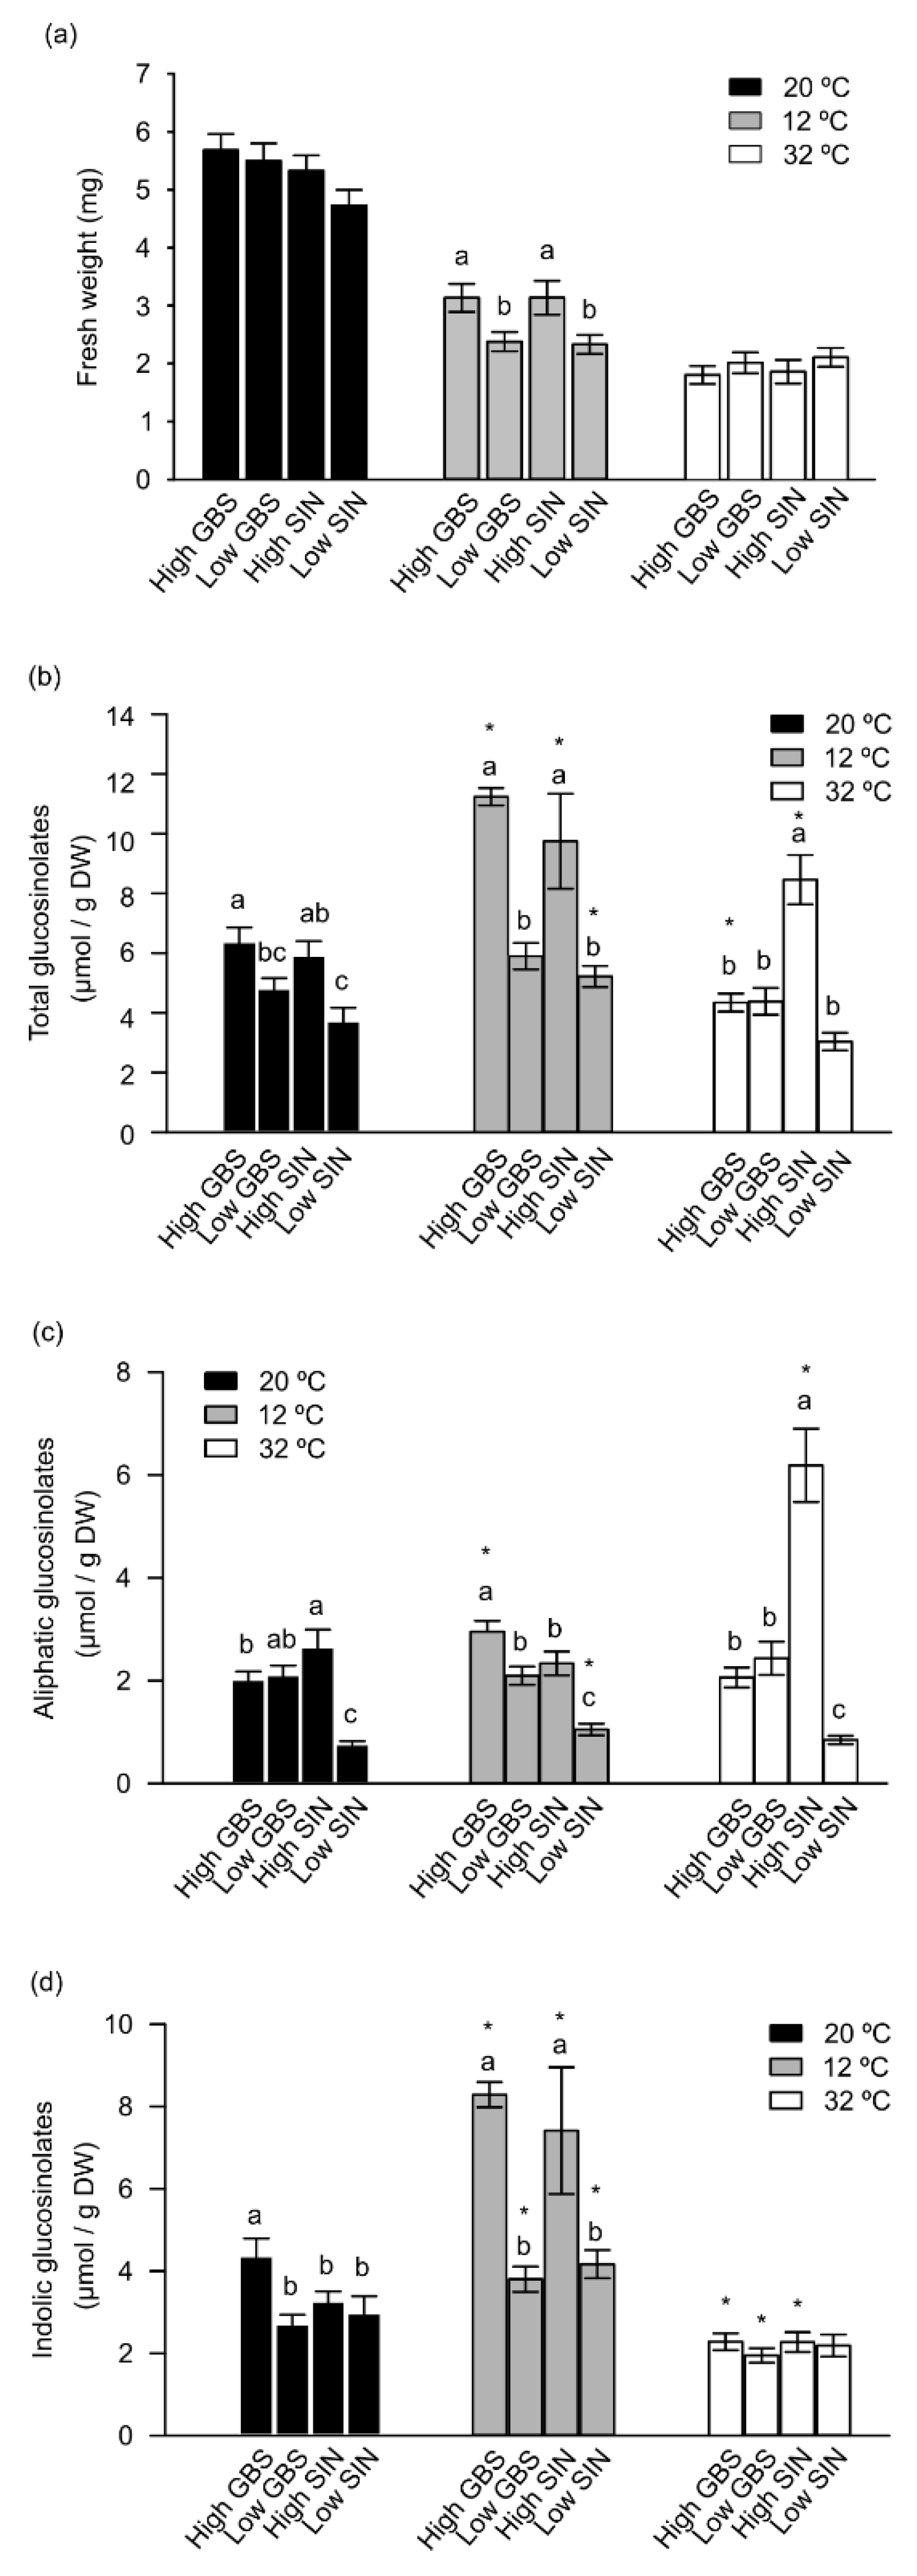
Figure 1. Effect of air temperatures on fresh weight and glucosinolates content on four kale populations from two divergent selections. (a) Bars represent the mean of the weight of 25 biological replicates per genotype and temperatures. Error bars represent ± SE. Different letters above the bar within each temperature [control (20), 12 and 32 °C] indicate significant differences (p ≤ 0.05, ONE-way ANOVA). (bd) Glucosinolates content in four populations from two divergent selections for sinigrin (SIN) and glucobrassicin (GBS) content. Bars represent the mean content of 10 biological replicates per genotype and temperature. Error bars represent ± SE. Means with a * indicate significant differences between temperature treatment and control within each population (p ≤ 0.05, T-test). Different letters above the bar within each temperature indicate significant differences among populations (p ≤ 0.05, one-way ANOVA).
Agronomy 12 02652 g001
Figure 2. Glucobrassicin (GBS) and sinigrin (SIN) content in four kale populations from two divergent selections for glucosinolate content evaluated at control (20 °C), 12 and 32 °C. Error bars represent ± SE. Means with a * indicate significant differences between cold and control treatments within each population (p ≤ 0.05, t-test).
Agronomy 12 02652 g002
Figure 3. Untargeted metabolomics analysis on kale populations with high and low glucosinolates content evaluated at control (20 °C) and cold (12 °C) temperatures. (a) Score-plot of the three principal components from a PLSD analysis under control (20 ° control (20 °C)) conditions. Ten biological replicates were used per population. (b) Score-plot of the three principal components from a PLSD analysis under cold (12 °C) conditions. Ten biological replicates were used per population.
Agronomy 12 02652 g003
Figure 4. Chemical classification of compounds identified at low temperature (12 °C). Structural classification of metabolites differentially accumulated between populations with high and low glucosinolates content at cold (12 °C) computed using the ClassyFire web-based application.
Agronomy 12 02652 g004
Figure 5. Identification of fatty-choline differentially accumulated on kale populations with high and low glucosinolates content (a) MS/MS spectrum of the putative linoleyl-choline. (b) MS/MS spectrum of linoleic acid methyl ester obtained from METLIN.
Agronomy 12 02652 g005
Table 1. Putative identification of metabolites identified in a multivariant supervised analysis (PLS-DA) with a VIP-score > 2 specifically under cold (12 °C) conditions.
m/zNeutral MassRT 1IonizationMolecular FormulaTheoretical MassMass Deviation (ppm)Putative Identification
381.0803342.11661.01[M+K]+C12H22O11342.1162−0.98Glucose disaccharide
136.0629135.05511.45[M+H]+C5H5N5135.0545−4.70Adenine
166.0868165.07903.48[M+H]+C9H11NO2165.079−0.07Phenylalanine
146.0818145.07404.31[M+H]+C6H11NO3145.0739−0.60L-Allysine
477.0641478.07198.92[M−H]C17H22N2O10S2478.0716−0.69Methoxyglucobrassicin
225.1566224.14889.44[M+H]+
251.0322250.024414.85[M+H]+C11H10N2OS2250.0235−3.73Spirobrassinin
181.1229180.115115.51[M+H]+C11H16O2180.115−0.28Dihydroactinidiolide
671.3268648.337116.54[M+Na]+C31H52O14648.3357−2.20Digalactosylmonoacylglycerol (DGMG; 16:3)
200.2377199.229916.72[M+H]+C13H29N199.230.45Tridecanamine
299.2008300.208616.75[M−H]C20H28O2300.208931.10Dehydroabietic acid
294.2431293.235317.09[M+H]+C18H31NO2293.23550.71Hexadecatrienoic acid ethanol amide
301.2162300.208417.43[M+H]+C20H28O2300.20891.90Dehydroabietic acid
235.0365234.028717.65[M+H]+C11H10N2S2234.0285−0.55Cyclobrassinin
338.3045338.304518.32[M]+C21H40NO2338.30594.189,12-Hexadecadienoylcholine
368.3526367.344820.16[M+H]+
375.2510352.261320.26[M+Na]+C21H36O4352.26140.11Glyceryl linolenate (enantiomer2)
324.2898323.282020.45[M+H]+C20H37NO2323.28241.42Linoleoyl ethanolamide
375.2516352.261820.48[M+Na]+C21H36O4352.2614−1.37Glyceryl linolenate (enantiomer1)
377.2664354.276621.47[M+Na]+C21H38O4354.2771.27Glyceryl linoleate
601.4235600.415721.64[M+H]+C31H52N8O4600.4112−7.60N-[2-[2-(2-Aminoethoxy)ethoxy]ethyl]-4-[[[4-[(4-hydroxycyclohexyl)amino]-6-(octylamino)-1,3,5-triazin-2-yl]amino]methyl]benzamide (YTC_000721)
282.2788281.271022.3[M+H]+C18H35NO281.27193.07Oleamide
296.2952295.287423.14[M+H]+C19H37NO295.28750.28Palmitic amide propyl ester
535.2704534.262623.31[M+H]+C33H34N4O3534.26310.99Pyropheophorbide A
607.2917606.283924.12[M+H]+
1 Retention time in reverse-phase liquid chromatography.
Publisher’s Note: MDPI stays neutral with regard to jurisdictional claims in published maps and institutional affiliations.