Abstract
Using bioactive inducers to enhance rice resistance is an effective means of green prevention and control of diseases during rice production. In a previous study, we found that foliar sprays of pyrroloquinoline quinone (PQQ) as the bioactive inducer could remarkably reduce the occurrence index of rice sheath blight (ShB) Rhizoctonia solani and increase the grain yield of rice under field conditions. However, little information is available on the mechanism of PQQ-induced rice resistance to ShB. In this study, the phenotype and mechanism of foliar sprayed PQQ-induced rice resistance to ShB were investigated by artificial inoculation method, RNA-seq technology, and quantitative real-time PCR (qRT-PCR) assay in the laboratory. The results showed that at 144 h after inoculation (hai) with the ShB C30 strain, many disease spots occurred obviously in a susceptible variety, Lemont (L), treated by 1.0 μmol/L PQQ (P+) with the disease score (DS) of 4.36, and almost all plants were withered and died under the ddH2O (P−) treatment alone, with the DS of 8.39. By comparison, the DS of a resistant variety, Gaopin 6 (G), was only 0.88 in the P+ treatment and 3.82 in the P− treatment. The results of hormone determination showed that jasmonic acid (JA) contents in the G and L varieties treated by P+ were increased significantly, by 78% and 197% respectively, at 48 hai. There was no significant difference in salicylic acid (SA) contents in these varieties between P+ and ddH2O (P−) treatments during the period of 48 hai. These results suggest that JA may play a key role in PQQ-induced rice resistance to ShB. The transcriptome analysis of the leaf sheath of the G and L varieties indicated that 165 and 250 differentially expressed genes (DEGs) were found in the intersection of LP− vs. LP+ and GP− vs. GP+ at 24 and 48 hai, respectively. Kyoto encyclopedia of genes and genomes analysis showed that these DEGs were related to plant–pathogen interaction, ribosome, plant hormone signaling transduction, mitogen-activated protein kinas signaling pathway, and phenylpropanoid biosynthesis. For ten highly expressed genes related to disease resistance, the results of qRT-PCR assay showed that eight genes, especially OsAOS2 and OsOSM1, were regulated positively, and two genes, OsGF14e and OsWRKY72, were regulated negatively. Among these, four up-regulated genes, OsOSM1, OsAOS2, OsHI-LOX, and OsLOX1, and one down-regulated gene, OsWRKY72, belonging to the JA signaling pathway, may be involved in PQQ-induced rice resistance to ShB. These results provide valuable information for green prevention and control of ShB by PQQ foliar spraying in the field.
1. Introduction
Rice sheath blight (ShB) disease, caused by the soil borne fungus Rhizoctonia solani, is one of the foremost devastating pathogens of rice worldwide. Plant pathogens are classified typically as necrotrophic or biotrophic pathogens based on their infection strategy, such as necrotrophic R. solani and hemibiotrophic Xanthomonas oryzae pv. oryzae (Xoo) and Pyricularia oryzae/Magnaporthe oryzae [1,2,3]. Synergistic and antagonistic interactions between different signaling pathways induced by phytohormones and their effect on resistance induction to biotrophic or necrotrophic pathogens have been well documented [4]. Salicylic acid (SA), as one of the main immunity-related phytohormones, is essential for defense in plants against biotrophic pathogens. The increased levels of SA in plants could induce the expression of pathogenesis-related (PR) genes, thereby enhancing plant resistance to invading pathogens [5]. Since the plant immune-priming compounds targeting the SA signaling pathway in plants have not developed resistance to pathogens, they provide lasting protection for crops [6,7]. Additionally, plant defense activators including thiabendazole, tiadinil, and isotianil induce the systemically acquired resistance in the plants to control rice blast disease caused by biotrophic fungi [8]. Jasmonic acid (JA) is critical to defense in plants against necrotrophic pathogens [9]. Attack by the necrotrophic pathogen Botrytis cinerea induces the JA accumulation and activated JA signaling molecules [10]. Research on the plant Arabidopsis thaliana led to a model in which JA mainly activated defense responses to necrotrophic pathogens such as Fusarium oxysporum [11]. Similarly, recent studies reported that several pathogen- and JA-inducible WRKY genes, including OsWRKY30 and OsWRKY4, are positive regulators in rice resistance to R. solani [12].
Pyrroloquinoline quinone (PQQ) is the third coenzyme discovered after nicotinamide and flavonoid nucleotides [13]. PQQ is only produced by a plethora of Gram-negative bacteria; however, it can be obtained indirectly through prokaryotes in animals and plants [14]. PQQ plays an important role in several physiological and biological processes [15,16], such as classical vitamin/cofactor functions for anti- and pro-oxidant potential [17]. The quinoline model reaction was constructed in which PQQ acted as an electron transfer catalyst from various organic substrates to molecular oxygen (O2) [18]. Electrons were transferred to ubiquinone from the various dehydrogenases via PQQ, PQQ plus cytochrome c, or flavin adenine dinucleotide [19]. PQQ was reduced to pyrroloquinolinequinol (PQQH2) by reacting with reducing agents such as NADPH, NaBH4, glutathione, or cysteine [20]. In the reduced form, the aroxyl radical-scavenging activity of PQQ is 7.4-fold that of vitamin C, suggesting that water-soluble PQQ is the most active antioxidant [21]. The antioxidant effect of PQQ depends on its concentration. The concentration of PQQ < 10 μmol/L indicates it to be a form of antioxidant; and its concentration > 50 μmol/L indicates it as a pro-oxidant [22].
We previously found that foliar sprays of PQQ in the 3–4 leaf stage of rice can significantly improve the resistance to ShB and grain yield of rice, and the induced effect depends on its concentration [23]. PQQ at the concentration of 1 μmol/L can induce rice resistance to ShB, but its induction ability was not reflected at 0–0.1 μmol/L. When its concentration was over 10 μmol/L, the induced disease resistance significantly decreased (data not shown). However, little information about the mechanism of PQQ that induces rice resistance to ShB was found. In this study, the phenotype of PQQ-induced rice resistance to ShB was identified using the artificial inoculation method. The differences in transcriptome and PQQ-responsive genes in rice resistance to ShB were identified based on RNA-seq technology. Subsequently, highly differentially expressed genes (DEGs) related to ShB resistance were verified by quantitative real-time PCR (qRT-PCR) assay. This study will provide valuable information to clarify the mechanism of PQQ-induced rice resistance to ShB, and for green prevention and control of ShB in the field.
2. Materials and Methods
2.1. Material Source and Rice Cultivation
Gaopin 6 (G) is a new cultivar with resistance to ShB, which was bred previously in our laboratory. It is derived from the isolated offspring of the Q28 (female) × R8006 (male) hybrid. After five consecutive years of breeding, the traits have stabilized. Lemont (L) is a recognized susceptible variety, which was provided by the State Key Laboratory of Hunan Hybrid Rice Research Center. The strain C30 of R. solani with strong pathogenicity was provided by Professor Li Xiaoxiang, Hunan Rice Research Institute, Hunan Academy of Agricultural Sciences. PQQ (a.i. ≥ 98%) was provided by Shanghai Medical Life Science Research Center.
The rice seeds were sterilized with 1% sodium hypochlorite for 20 min, the residual sodium hypochlorite on their shells was washed off with sterile water, and these seeds were soaked for 24 h and germinated at 30 °C for 48 h in a growth chamber (RXZ-500C, Ningbo Dongnan Instrument Co., Ltd., Ningbo, China), with a photoperiod 14:10 h (light: dark), relative humidity (RH) 70%, and light intensity 20,000 Lx. The germinated seeds with buds of about half a grain of rice, twenty-four seeds per 96-well plate, were evenly seed on the 96-well plates (length 11.8 cm, width 7.7 cm, height 2.1 cm) (Supplementary Figure S1a,b). According to the standard recommended by International Rice Research Institute, Yoshida rice nutrient salts (460.85 mg/L, pH = 5.5–5.8; Coolaber Science & Technology Co., Ltd., Beijing, China) were used for the culture medium of rice. The culture conditions were set at 28–30 °C with a photoperiod 14:10 h (light: dark), RH 70% and light intensity 20,000 Lx in the RXZ-500C growth chamber.
2.2. Experimental Treatment and Inoculation of Sheath Blight
When the rice plants grew to the 3–4 leaf stage about 3 weeks after rice seeded, they were foliar sprayed by 1.0 μmol/L PQQ (P+), referring to the result of our previous study [23], with a 3WP-2000 spray tower (96 mm/R, distance 1200 mm, forward speed 482 mm/s, return speed 150 mm/s; Nanjing Agricultural Mechanization Research Institute, Nanjing, China), and foliar sprayed by ddH2O (P−) as the control. Each treatment was repeated three times. Three 96-well plates were used for each treatment. Then, they were placed in the RXZ-500C growth chamber under the same conditions mentioned above for further cultivation. At 72 h after PQQ or ddH2O foliar sprays, the sclerotia of R. solani with the same size and age (Supplementary Figure S1c) were inoculated by clamping on the leaf sheath of the first leaf (Supplementary Figure S1d). After inoculation, the rice seedlings were cultivated continuously about one week in the self-made device (length 36.0 cm, width 19.6 cm, height 50.0 cm) (Supplementary Figure S1e), which was covered with plastic wrap to maintain high RH, and then transferred to the RXZ-500C growth chamber under the same conditions mentioned above. The phenotype of rice against ShB was identified at 144 h after inoculation (hai) and evaluated with the disease score (DS), which was calculated using the following equation:
DS = (length of disease spot/height from the surface of the culture medium to the highest leaf pillow of main stem of rice) × 9.
2.3. Hormone Determination
Eight-centimeter-long leaf sheaths of rice plants at 3 days post-treatment by PQQ or ddH2O foliar sprays were sampled next to the inoculation sites at 0, 12, 24, and 48 hai with the sclerotia of R. solani. These samples were flash-frozen in liquid nitrogen and stored at −80 °C for the determination of SA and JA contents.
Plant hormone extraction and purification referred to the method of Peng et al. (2013) [24]. Samples were powdered in a mortar with pestle under liquid nitrogen. Then, 0.2 g was transferred to a 2 mL centrifuge tube, and supplemented with 1 mL of 80% methanol, 10 μL of 10 μg/mL 2H4-SA, and 10 μL of 10 μg/mL 2H5-JA. They were mixed by ultrasound shock and kept at 4 °C overnight. The supernatant was moved and then centrifuged for 10 min at 4 °C, 15,200× g. The sediment was dipped twice with 1 mL of 80% methanol, and then the supernatant was pooled and concentrated to dry by frozen centrifugation. Dry samples were redissolved with 200 μL of 60% methanol, sonicated to complete dissolution, and the supernatant was transferred to an autosampler for LC-MS/MS (LCMS-8060, Shimadzu, Co., Ltd., Chiyoda-ku, Tokyo, Japan) analysis. Each treatment was repeated six times.
Liquid-phase conditions of LC-MS/MS: Mobile phase A was 0.1% formic acid in water and mobile phase B was 0.1% formic acid in methanol. Mobile phase B was used at 60%, followed by a linearly programmed gradient to 80% of mobile phase B from 0 to 2 min; 80% of mobile phase B was maintained from 2 to 6 min; 80% of mobile phase B was gradually reduced to 60% from 6 to 7 min; 60% of mobile phase B was maintained from 7 to 12 min. The mass spectrum conditions of LC-MS/MS were set as follows: negative ion mode first-order full scan TOF MS (100–1000 m/z) + secondary IDA (100–1000 m/z). The temperature of the ion source (TEM) was 500 °C, the first stage DP-80, CE-10; the second stage DP-80, CE-30, CES-10.
2.4. Total RNA Extraction
In this experiment, several key factors, including rice varieties (G and L), treatment application (P+ and P−), and time after inoculation (24 and 48 hai) were investigated. Each treatment was repeated three times. Samples of leaf sheath were conducted according to the procedure of “Hormone determination”. These samples were flash-frozen in liquid nitrogen and stored at −80 °C until use. Total RNA was extracted with TRIGene Reagent (GenStar Biosolutions Co., Ltd., Beijing, China) according to the manufacturer’s manual. Total RNA was treated with RQ1 RNase-free DNase (Promega, Madison, WI, USA) to avoid potential genomic DNA contamination. The quantity and quality of total RNA were determined by spectrophotometer (Thermo Fisher Scientific Inc., Pittsburgh, PA, USA) and 1% non-denaturing agarose gel electrophoresis, respectively.
2.5. RNA Sequence including Data Processing, Mapping, and Annotation of the Clean Reads
The steps of transcriptome sequencing were as follows: library construction and sequencing, comparison of transcriptome data with reference genome sequence, and quality evaluation of transcriptome library. The sequencing work was completed by BioMarker Co., Ltd. (Beijing, China). The Fragments Per Kilobase of transcript per Million fragments mapped (FPKM) method was used as an indicator to measure the transcription or gene expression level by the StringTie maximum flow algorithm.
The difference in gene expression in the samples was analyzed using DESeq2 software, and then the p-values of DEGs were calculated. When the number of DEGs was large, the p-value should be combined with fold change to screen DEGs, and the conditions are p < 0.05 and |log2 fold change| > 1. Kyoto Encyclopedia of Genes and Genomes (KEGG) is the most important public database in pathways. The false discovery rate (FDR) < 0.05 indicated that the pathway was enriched significantly in DEGs.
2.6. Validation of the DEGs by Quantitative Real-Time PCR
The partial genes related to disease resistance, which were highly expressed in the transcriptome, were selected as candidate genes to be tested by qRT-PCR assay. According to the mRNA sequence of the tested genes, the specific primers (Table S1) were designed by Primer Premier 5.0 (PREMIER Biosoft International, Palo Alto, CA, USA) and synthesized by Sangon Biotech (Shanghai) Co., Ltd. (Shanghai, China). The total RNA was reverse transcribed by Reverse Transcription Kit (GenStar Biosolutions Co., Ltd.). The qRT-PCR assay was performed on an ABI QuantStudio3 (Thermo Fisher Scientific Inc.) in a reaction volume of 20 μL containing 1.0 μL first-strand cDNA, 10.0 μL 2 × RealStar Green Fast Mixture (GenStar Biosolutions Co., Ltd.), 0.5 μL forward and reverse primers (10 μM), 0.4 μL ROX Reference Dye II (GenStar Biosolutions Co., Ltd.), and 7.6 μL RNase-free water (GenStar Biosolutions Co., Ltd.). The thermal cycle procedure followed: 95 °C for 2 min, then 40 cycles of 95 °C for 15 s, and 60 °C for 30 s. The housekeeping gene of ubiquitin fusion protein (Ubq, Os03g0234200) was selected as an internal standard to eliminate variations in the quality and quantity of mRNA and cDNA. Each sample was conducted in triplicate and dissociation curve analysis of amplified products was performed at 95 °C for 10 s and 60 °C for 1 min, added as a final step to confirm that the PCR product was specific and unique. The average value of cycle threshold (CT) was used to calculate the relative expression levels of genes in different samples based on 2−△△CT method [25].
2.7. Data Analyses
The experimental data were processed by Microsoft Excel 2010 software, and the different significance was analyzed by SPSS Version 22 software (SPSS Inc., Chicago, IL, USA). A p-value of less than 0.05 was considered to represent statistically significant differences using a one-way ANOVA followed by Duncan’s new multiple range test (DMRT). GraphPad Prism 8.0.1 (GraphPad Software, San Diego, CA, USA) was used for mapping.
3. Results
3.1. Effects of PQQ Treatment on the Incidence of ShB in the G and L Varieties after Inoculation
Disease resistance of R. solani analysis was conducted at the rice seedling stage in the G and L varieties using a hydroponic microchamber method. Based on our observation, the ShB sclerotia recovered to germinate the hyphal at about 8 hai. The obvious hyphal and disease spots could be seen next to the inoculation sites at 96 hai (Figure 1a). The different incidence levels of ShB disease occurred in the tested varieties at 144 hai (Figure 1b,c). For example, the leaf sheath did not have the obvious disease spots and remained green in the GP+ treatment with the DS of 0.88; while it was straight and dehydrated in the GP− treatment with the DS of 3.82, and had some withered leaves (Figure 1b). However, many disease spots could be observed obviously in the LP+ treatment with the DS of 4.36, while almost all plants, especially the leaf sheath, were withered in the LP− treatment with the DS of 8.39 (Figure 1c).
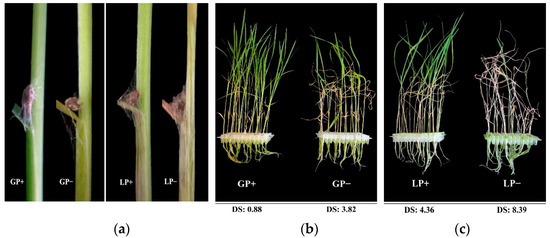
Figure 1.
Phenotype of rice treated by different treatments at 96 (a) and 144 (b), (c) hours after inoculation with ShB sclerotia. GP+, GP−, LP+ and LP− indicate PQQ and ddH2O treatments in the G and L variety, respectively. DS indicates disease score.
3.2. Effects of PQQ Treatment on SA and JA Contents in the G and L Varieties after Inoculation
As shown in Figure 2, the SA content in the G and L varieties at 3 days after P+ and P− treatments decreased gradually with the prolonged inoculation time. No significant difference was observed between two treatments, except for 24 hai, suggesting that SA may not be the dominant effect on rice resistance to ShB.
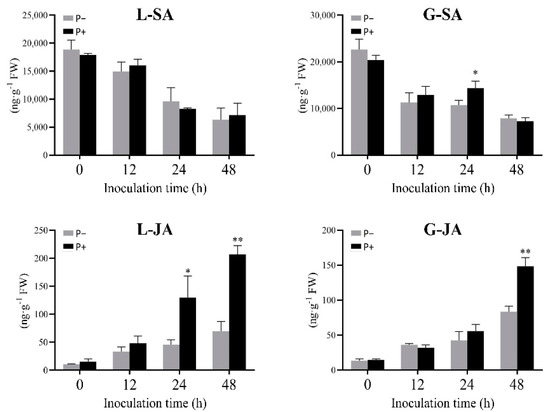
Figure 2.
Changes in SA and JA contents in the G and L varieties treated with PQQ and ddH2O after inoculation. Asterisks indicate significant differences among different treatments (* p < 0.05, ** p < 0.01).
The differentially increased content of JA was observed in P+ treatment, especially the significant increase in the L variety, compared with that in the control (P−). For example, it was increased by 185.5% and 197.0% in the P+ treatment at 24 and 48 hai, respectively. However, in the G variety, the JA content was not remarkably different between the two treatments before 24 hai, but it increased by 78.0% in the P+ treatment relative to that of the control at 48 hai. Therefore, JA may play a key role in PQQ-induced rice resistance to ShB, which is similar with the results previously reported by Peng et al. (2012) and Zhong (2019) [26,27].
3.3. Analysis of DEGs by RNA-seq
The results of principal competent analysis (PCA) showed that the biological replicates of each treatment were assembled significantly, suggesting that the results of transcriptome analysis were highly reliable. The main variation of PC1 (59.7%) was caused by inoculation time, and PC2 (14.9%) by different rice varieties. These results indicate there were obvious transcriptome differences among different treatments (Figure 3a). A Venn diagram showed that 165 and 250 DEGs were observed in the cross of LP− vs. LP+ and GP− vs. GP+ at 24 and 48 hai, respectively (Figure 3b). These shared DEGs at these two timepoints were most likely involved in PQQ-induced rice resistance to ShB.
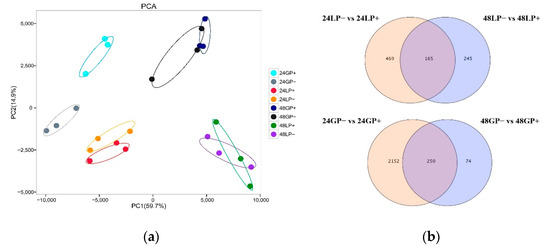
Figure 3.
Transcriptome sequencing results of G and L varieties under PQQ treatment. (a) Principal component analysis (PCA) of transcriptome samples. “24 or 48” represent hours after inoculation, “P+ or P−” represent PQQ or ddH2O treatment, respectively. (b) Venn diagram showing the intersection of DEGs.
In the L variety treated by P+ vs. P−, 216 DEGs were annotated by the KEGG database and classified into 78 pathways with 34 (15.74%) and 24 (11.11%) DEGs being in the pathways of “plant-pathogen interaction” and “plant hormone signal transduction” at 24 hai, respectively (Figure 4a); however, 151 DEGs were annotated by the KEGG database and classified into 65 pathways with 33 (21.85%) and 25 (16.56%) DEGs being in the pathways of “plant-pathogen interaction” and “plant hormone signal transduction” at 48 hai, respectively (Figure 4b). In the G variety treated by P+ vs. P−, 760 DEGs were annotated by the KEGG database and classified into 123 pathways with 120 (15.79%) and 105 (13.82%) DEGs being in the pathways of “plant-pathogen interaction” and “plant hormone signal transduction” at 24 hai, respectively (Figure 4c); however, 91 DEGs were annotated by the KEGG database and classified into 51 pathways with 21 (23.08%) and 15 (16.48%) DEGs being in the pathways of “plant-pathogen interaction” and “plant hormone signal transduction” at 48 hai, respectively (Figure 4d).
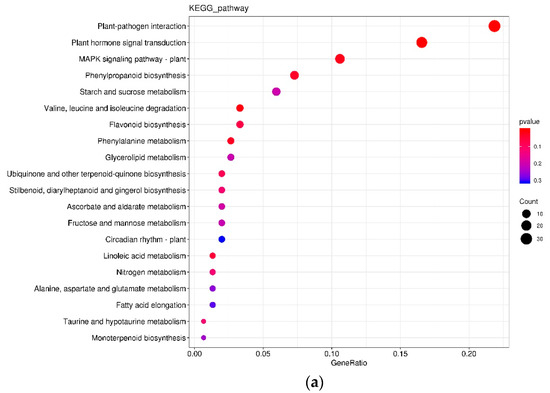
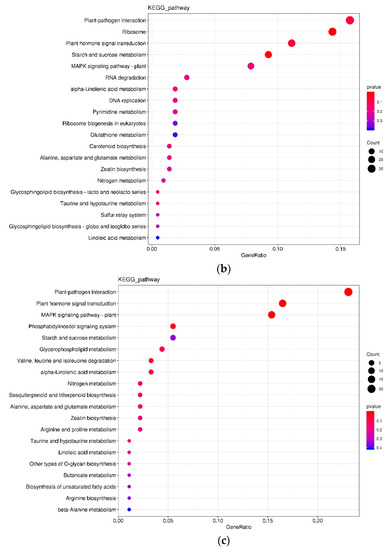
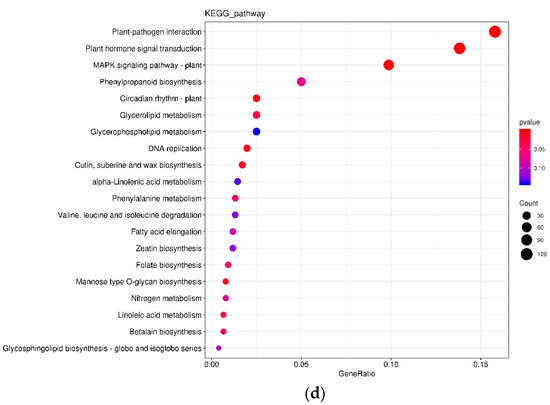
Figure 4.
KEGG comparison of DEGs in different treatments. (a) 24LP− vs. 24LP+. (b) 48LP− vs. 48LP+. (c) 24GP− vs. 24GP+. (d) 48GP− vs. 48GP+. Fold enrichment, depicted by circle size, which was calculated by GeneRatio/BgRatio; p. adjust, shown by color, indicates significance level of enrichment results from blue to red. KEGG and DEGs indicate Kyoto Encyclopedia of Genes and Genomes and differentially expressed genes, respectively.
3.4. Verification of the DEGs by qRT-PCR Assay
According to the data of RNA-seq, 35 highly expressed DEGs related to plant disease resistance were selected for heatmap analysis (p < 0.05). As shown in Figure 5a, the expressions of OsGF14e (Os02g0580300), OsMPK1 (Os06g0154500), OsFOR1 (Os07g0568700), OsJMT1 (Os06g0314600), and OsJAR2 (Os01g0221100) were regulated positively, but the expressions of Osmyb2 (Os12g0175400), OsLOX1(Os02g0194700), OsLOX3 (Os03g0699700), OsOSM1 (Os12g0596500), and OsWRKY44 (Os03g0335200) were regulated negatively. Additionally, several jasmonate signaling factors were identified after annotating DEGs associated with the JA signal transduction pathway (Figure 5b). Jasmonate ZIM-domain proteins (JAZ), as a family of proteins, play a ubiquitous role in plant development and defense response, and are key inhibitors of the JA signal transduction pathway [28]. In this study, 11 JAZ genes were differentially expressed and annotated as OsJAZ (Figure 5b). The transcript levels of Os03g0180900, Os03g0181100, Os03g0402800, Os09g0401300, Os09g0439200, Os10g0391400, and Os10g0392400 were lower in the P+ treatment than those in the P- treatment. The Jas domain located at the C end of the JAZ protein is primarily responsible for binding to transcriptional activators such as COI1 and MYC2 in the receptor complex [29]. Os01g0853400, Os03g0265500, and Os05g0449500 were annotated as OsCOI1, and Os10g0575000 was annotated as OsMYC2. Their transcript levels were less variable in response to the PQQ treatment in the different rice varieties.
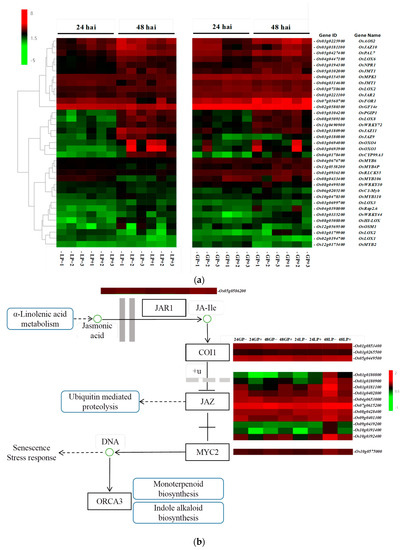
Figure 5.
Heatmap of DEGs related to plant disease resistance (a) and JA signal transduction pathway (b). Heatmap was generated using the values [log2(FPKM)], representing the relative expression levels of DEGs in the leaf sheath of rice. The color bar indicates the expression values as an increasing intensity gradient (green, low expression; red, high expression).
Based on the results of the heatmap analysis (Figure 5a), ten representative genes including one gene (OsPAL7, Os05g0427400) of phenylalanine metabolism pathway, five genes (OsHI-LOX, Os08g0508800; OsLOX1; OsOSM1; OsAOS2, Os03g0225900; OsWRKY72, Os11g0490900) of JA signaling pathway, one gene (OsGF14e) of defense response and abiotic stress response functional genes, one gene (Rap2.6, Os04g0398000) of ethylene signaling pathway, one gene (OsOXO3, Os03g0693900) of oxalate catabolism, and one gene (Osmyb2) of cellulose synthesis and secondary wall formation were selected for the validation by qRT-PCR assay. The expressions of eight genes, namely, OsPAL7, OsHI-LOX, OsOSM1, OsLOX1, OsAOS2, Osmyb2, OsRap2.6, and OsOXO3 were up-regulated in the P+ treatment (Figure 6). The number of genes with up-regulated expression was eight at 48 hai, and significantly higher than four at 24 hai. The P+ treatment significantly up-regulated OsAOS2 expression in the G variety at 24 hai and the expressions of OsOSM1, Osmyb2, OsRap2.6, and OsOXO3 at 48 hai, respectively, compared with the P− treatment. In addition, the OsWRKY72 and OsGF14e expressions were down-regulated in the P+ treatment, especially for the significantly decreased expression of the former in the G and L varieties at 48 hai, and of the latter only in the L variety at 24 hai (Figure 6).
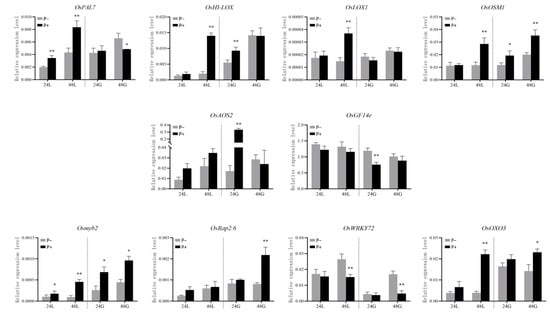
Figure 6.
The relative expression levels of ten genes in the G and L varieties treated with PQQ and ddH2O treatments at 24 and 48 h after inoculation. Values shown are the means ± standard errors (SEs) of three biological replicates. Asterisks indicate significant differences among different treatments (* p < 0.05, **p < 0.01).
As for the same treatment, the relative expression levels of OsPAL7, OsHI-LOX, Osmyb2, and OsOXO3 in the G variety were higher than those in the L variety after inoculation, but OsWRKY72 and OsGF14e expressions in the former were lower than those in the latter. As for the L variety, the P+ treatment differentially increased the expressions of OsPAL7, OsHI-LOX, OsLOX1, OsOSM1, Osmyb2, and OsOXO3, and significantly up-regulated the OsPAL7 and Osmyb2 expressions at 24 hai, compared with the P− treatment. The P+ treatment also significantly up-regulated the expressions of the above-mentioned six genes at 48 hai. In addition, the overall change in the expression levels of up-regulated genes at 48 hai was higher than that at 24 hai. Under PQQ induction treatment, the G variety exhibited the significantly up-regulated expressions of Osmyb2, OsAOS2, OsHI-LOX, and OsOXO3 at 24 hai, and of OsRap2.6 and Osmyb2 at 48 hai, compared with the L variety. However, it significantly down-regulated the expression of OsGF14e at 24 hai and of OsWRKY72 at 48 hai.
4. Discussion
The highly cost-effective management strategy for ShB disease is mainly dependent on the application of chemical fungicides, such as difenoconazole, epoxiconazole, hexaconazole, propiconazole, luopyram, thifluzamide, and azoxystrobin. However, R. solani has developed different levels of resistance towards the majority of conventional chemical fungicides, which have been excessively used. Additionally, some chemical fungicides are also not environment-friendly and tend to raise lots of concerns regarding public health [30]. Consequently, rice growers must replace the conventional chemicals used for the control of ShB disease with novel compounds, such as bioactive substances. Previous studies demonstrated that application of bioactive substances to the induced disease resistance of rice is one of the most effective ways to avoid rice yield losses caused by ShB [31,32]. Leng and Song (2014) found that an extremely low concentration of PQQ promoted pollen germination and pollen tube growth of apple, and also significantly promoted the growth of tomato and cucumber and increased the number of fruits [33]. Li et al. (2020) showed that it could increase the contents of indoleacetic acid and zeatin, enhance cell metabolism, shorten the growth arrest period, and promote the growth of tobacco [34]. Kuang et al. (2017) reported that PQQ effectively improved the chlorophyll content and photosynthetic capacity of rice, and enhanced the activities of nitrate reductase and glutamine transaminase, so as to reduce pistil abortion in the tassel and increase rice yield [35]. We previously found that PQQ foliar sprays at different growth stages of rice had concentration-control efficacy effects on ShB for the L and G varieties [23]. In this study, the results of phenotype identification indicated that the effect of PQQ foliar spray-induced resistance of the L variety to ShB was higher than that of the G variety. Therefore, PQQ not only functions as an effector to promote the growth of plants, but also enhances the ability of the stress tolerance of plants. However, little information was available about the mechanism of PQQ-induced plant resistance to pathogens.
Physiological and biochemical reactions and phenotypic changes of plants in response to pathogen infection are determined by the related genes in plants. In recent years, RNA-seq technology has been widely used to analyze the DEGs, and even to study the gene function and resistance molecular mechanisms of plant–pathogen interaction. In this study, RNA-seq was used to analyze the expression differences of PQQ responsive genes in a new disease-resistant germplasm of rice. The mechanism of rice resistance to ShB was explored by comparison of the changed gene expressions in the G and L varieties treated by PQQ (P+, induction) or ddH2O (P−, non-induction) at different times after inoculation with ShB C30 strain. The results of KEGG enrichment analysis showed that the reliable pathways with high coincidence and significant enrichment among different treatments were involved in “plant-pathogen interaction”, “mitogen-activated protein kinas (MAPK) signaling pathway” and “plant hormone signal transduction”. Plant–pathogen interaction is a multifaceted process mediated by the pathogen- and plant-derived molecules including proteins, sugars, and lipopolysaccharides [36]. The MAPK family is a group of serine/threonine kinases including the p38 MAPK pathway, which plays a critical role in apoptosis, cytokine production, transcription regulation, and cytoskeletal reconstruction [37].
It is well known that JA and SA are important phytohormones for regulating plant resistance against diseases [38]. JA regulates plant responses to necrotrophic pathogens, while SA regulates plant responses to biotrophic pathogens and systemic acquired resistance [39,40,41]. In the present study, the JA content gradually increased as the expressions of JA biosynthesis genes increased, but the SA content gradually decreased, suggesting that the obvious antagonism was observed between the JA and SA pathways. The interaction between these signaling pathways has been well documented; there are more cases of JA and SA antagonization than cooperation [42]. A large number of studies have shown that SA is closely related to disease resistance in the plants, while JA mainly plays an important role in the defense of mechanical damage caused by insects. Since ShB is a typical necrotrophic fungus, when it infects plant cells, it can form an infestation spike to destroy the cell wall of plant, which is similar to the plants in response to mechanical damage. Therefore, JA might be closely related to ShB resistance. The results of this study further confirmed that JA plays a key role in rice resistance to ShB infection. This was consistent with the finding that the increase in rice resistance to ShB was mainly due to the enhanced content of JA [26].
In this study, the results of qRT-PCR assay indicated that eight of ten genes related to rice resistance against ShB were regulated positively, and two of them were regulated negatively. Specifically, for the up-regulated eight genes, the expressions of OsAOS2 and OsOSM1 belonging to the JA signaling pathway were increased significantly, suggesting that their overexpression may be involved in PQQ-induced rice resistance to ShB. Xue et al. (2016) reported that OsOSM1 expression was up-regulated by JA, and its overexpression enhanced rice resistance to ShB under field conditions [43]. In addition, early work on disease resistance demonstrated that OsAOS expression could affect the rice resistance to pathogens, including Xoo and M. oryzae. For example, Mei et al. (2006) found that the transgenic rice lines carrying the OsAOS2 gene under the regulation of a strong pathogen-inducible promoter PBZ1 exhibited the enhanced activation of some PR genes such as PR1a, PR3, and PR5, and then increased M. oryzae resistance [44]. Liu et al. (2015) reported that the overexpression of OsAOS significantly increased the JA content and the resistance to Xoo and M. oryzae in the transgenic rice lines [45].
In this study, OsGF14e and OsWRKY72, as the negatively regulated genes, had lower expression levels, both in the G variety and in the P+ treatment. The results are similar to those proposed by other researchers [46,47]. Manosalva et al. (2011) reported that GF14e-silenced rice plants showed higher levels of resistance to a virulent strain of Xoo and R. solani than non-silenced plants, suggesting that OsGF14e negatively affects the induction of broad-spectrum resistance in rice [46]. Hou et al. (2019) found that OsWRKY72 directly binding to the cis-element W-box in the promoter of JA biosynthesis gene OsAOS1 increased DNA methylation levels of OsAOS1 and decreased its transcription levels, leading to a lower content of endogenous JA and a greater susceptibility to Xoo [47].
5. Conclusions
In summary, the results of hormone determination showed that the SA content was not changed significantly after PQQ-induction treatment, but the JA content significantly increased during 24–48 hai, especially in the L variety. It is speculated that JA plays a dominant role in the resistance to ShB. KEGG enrichment analysis showed that “plant-pathogen interaction”, “plant hormone signal transduction”, and “MAPK signaling pathway” are three major pathways in the interaction of rice and ShB after PQQ treatment based on RNA-seq technology. The results of qRT-PCR assays showed that up-regulated genes including OsAOS2 and OsOSM1 and down-regulated genes including OsGF14e and OsWRKY72 may contribute significantly to PQQ-induced rice resistance to ShB. Additionally, other up-regulated genes, including OsHI-LOX and OsLOX1 belonging to the JA signaling pathway, also possibly participate in PQQ-induced rice resistance to ShB. These findings suggested that PQQ can significantly induce rice resistance to ShB in the resistant (G) and susceptible (L) varieties, and will help provide valuable information for green prevention and control of ShB in the field.
Supplementary Materials
The following supporting information can be downloaded at: https://www.mdpi.com/article/10.3390/agronomy12112660/s1, Figure S1: A schematic diagram of the operation process of inoculation with Rhizoctonia solani sclerotinia; Table S1: Primer information for qRT-PCR assay.
Author Contributions
Y.Z. designed the study. S.L. performed experiments. S.L. and T.T. and analyzed the RNA-seq data and drafted the manuscript. G.M., D.L. and Y.P. revised the manuscript. All authors have read and agreed to the published version of the manuscript.
Funding
This work was supported by the National Natural Science Foundation of China (No. 32102239), the Key Research and Development Program of Hunan Province (No. 2020NK2046), and the Natural Science Foundation of Changsha (No. kq2014176).
Institutional Review Board Statement
Not applicable.
Informed Consent Statement
Not applicable.
Data Availability Statement
The datasets generated for this study can be found in the online repositories. The names of the repository/repositories and accession number(s) can be found below: https://www.ncbi.nlm.nih.gov/ (accessed on 27 September 2022), PRJNA869553.
Acknowledgments
The authors are grateful to the Department of Hunan Rice Research Institute, Hunan Academy of Agricultural Sciences, for providing pathogen of R. solani and all the members of the State Key Laboratory of Hybrid Rice for technical assistance.
Conflicts of Interest
All other authors declare no conflict of interest.
References
- Glazebrook, J. Contrasting mechanisms of defense against biotrophic and necrotrophic pathogens. Ann. Rev. Phytopathol. 2005, 43, 205–227. [Google Scholar] [CrossRef] [PubMed]
- Pétriacq, P.; Stassen, J.H.M.; Ton, J. Spore density determines infection strategy by the plant pathogenic fungus Plectosphaerella cucumerina. Plant Physiol. 2016, 170, 2325–2339. [Google Scholar] [CrossRef] [PubMed]
- Yin, Y.J.; Chen, C.J.; Guo, S.W.; Li, K.M.; Ma, Y.N.; Sun, W.M.; Xu, F.R.; Cheng, Y.X.; Dong, X. The fight against Panax notoginseng root-rot disease using Zingiberaceae essential oils as potential weapons. Front. Plant Sci. 2018, 9, 1346. [Google Scholar] [CrossRef] [PubMed]
- Eshraghi, L.; Anderson, J.P.; Aryamanesh, N.; McComb, J.A.; Shearer, B.; Hardy, G.S. Suppression of the auxin response pathway enhances susceptibility to Phytophthora cinnamomi while phosphite-mediated resistance stimulates the auxin signalling pathway. BMC Plant Biol. 2014, 14, 68. [Google Scholar] [CrossRef]
- Gong, Q.; Yang, Z.; Wang, X.; Butt, H.I.; Chen, E.; He, S.; Zhang, C.; Zhang, X.; Li, F. Salicylic acid-related cotton (Gossypium arboreum) ribosomal protein GaRPL18 contributes to resistance to Verticillium dahliae. BMC Plant Biol. 2017, 17, 59. [Google Scholar] [CrossRef]
- Noutoshi, Y.; Okazaki, M.; Kida, T.; Nishina, Y.; Morishita, Y.; Ogawa, T.; Suzuki, H.; Shibata, D.; Jikumaru, Y.; Hanada, A.; et al. Novel plant immune-priming compounds identified via high-throughput chemical screening target salicylic acid glucosyltransferases in Arabidopsis. Plant Cell. 2012, 24, 3795–3804. [Google Scholar] [CrossRef] [PubMed]
- Mikami, K.; Mori, I.C.; Matsuura, T.; Ikeda, Y.; Kojima, M.; Sakakibara, H.; Hirayama, T. Comprehensive quantification and genome survey reveal the presence of novel phytohormone action modes in red seaweeds. J. Appl. Phycol. 2016, 28, 2539–2548. [Google Scholar] [CrossRef]
- Ahn, I.P. Glufosinate ammonium-induced pathogen inhibition and defense responses culminate in disease protection in bar-transgenic rice. Plant Physiol. 2008, 146, 213–227. [Google Scholar] [CrossRef] [PubMed]
- Thomma, B.P.H.J.; Eggermont, K.; Tierens, K.F.M.J.; Broekaert, W.F. Requirement of functional ethylene-insensitive 2 gene for efficient resistance of Arabidopsis to infection by Botrytis cinerea. Plant Physiol. 1999, 121, 1093–1101. [Google Scholar] [CrossRef] [PubMed]
- Lv, T.; Li, X.; Fan, T.; Luo, H.; Xie, C.; Zhou, Y.; Tian, C.E. The calmodulin-binding protein IQM1 interacts with CATALASE2 to affect pathogen defense. Plant Physiol. 2019, 181, 1314–1327. [Google Scholar] [CrossRef] [PubMed]
- Journot-Catalino, N.; Somssich, I.E.; Roby, D.; Kroj, T. The transcription factors WRKY11 and WRKY17 act as negative regulators of basal resistance in Arabidopsis thaliana. Plant Cell 2006, 18, 3289–3302. [Google Scholar] [CrossRef]
- Peng, X.; Wang, H.; Jang, J.C.; Xiao, T.; He, H.; Jiang, D.; Tang, X. OsWRKY80-OsWRKY4 module as a positive regulatory circuit in rice resistance against Rhizoctonia solani. Rice. 2016, 9, 63. [Google Scholar] [CrossRef]
- Lisdat, F. PQQ-GDH–Structure, function and application in bioelectrochemistry. Bioelectrochemistry 2020, 134, 107496. [Google Scholar] [CrossRef]
- Koehn, E.M.; Latham, J.A.; Armand, T.; Evans III, R.L.; Tu, X.; Wilmot, C.M.; Iavarone, A.T.; Klinman, J.P. Discovery of hydroxylase activity for PqqB provides a missing link in the pyrroloquinoline quinone biosynthetic pathway. J. Am. Chem. Soc. 2019, 141, 4398–4405. [Google Scholar] [CrossRef]
- Ludueña, L.M.; Anzuay, M.S.; Magallanes-Noguera, C.; Tonelli, M.L.; Ibañez, F.J.; Angelini, J.G.; Fabra, A.; McIntosh, M.; Taurian, T. Effects of P limitation and molecules from peanut root exudates on pqqE gene expression and pqq promoter activity in the phosphate-solubilizing strain Serratia sp. S119. Res. Microbiol. 2017, 168, 710–721. [Google Scholar] [CrossRef]
- Bharwad, K.; Rajkumar, S. Modulation of PQQ-dependent glucose dehydrogenase (mGDH and sGDH) activity by succinate in phosphate solubilizing plant growth promoting Acinetobacter sp. SK2. 3 Biotech 2020, 10, 5. [Google Scholar] [CrossRef]
- Tchaparian, E.; Marshal, L.; Cutler, G.; Bauerly, K.; Chowanadisai, W.; Satre, M.; Harris, C.; Rucker, R.B. Identification of transcriptional networks responding to pyrroloquinoline quinone dietary supplementation and their influence on thioredoxin expression, and the JAK/STAT and MAPK pathways. Biochem. J. 2010, 429, 515–526. [Google Scholar] [CrossRef]
- Tao, R.; Karliner, J.S.; Simonis, U.; Zheng, J.; Zhang, J.; Honbo, N.; Alano, C.C. Pyrroloquinoline quinone preserves mitochondrial function and prevents oxidative injury in adult rat cardiac myocytes. Biochem. Biophys. Res. Commun. 2007, 363, 257–262. [Google Scholar] [CrossRef][Green Version]
- Richhardt, J.; Luchterhand, B.; Bringer, S.; Büchs, J.; Bott, M. Evidence for a key role of cytochrome bo3 oxidase in respiratory energy metabolism of Gluconobacter oxydans. J. Bacteriol. 2013, 195, 4210–4220. [Google Scholar] [CrossRef]
- Ouchi, A.; Ikemoto, K.; Nakano, M.; Nagaoka, S.; Mukai, K. Kinetic study of aroxyl radical scavenging and α-tocopheroxyl regeneration rates of pyrroloquinolinequinol (PQQH2, a reduced form of pyrroloquinolinequinone) in dimethyl sulfoxide solution: Finding of synergistic effect on the reaction rate due to the coexistence of α-tocopherol and PQQH2. J. Agric. Food Chem. 2013, 61, 11048–11060. [Google Scholar] [CrossRef]
- Geng, Q.; Gao, H.; Yang, R.; Guo, K.; Miao, D. Pyrroloquinoline quinone prevents estrogen deficiency-induced osteoporosis by inhibiting oxidative stress and osteocyte senescence. Int. J. Biol. Sci. 2019, 15, 58–68. [Google Scholar] [CrossRef]
- He, K.; Nukada, H.; Urakami, T.; Murphy, M.P. Antioxidant and pro-oxidant properties of pyrroloquinoline quinone (PQQ): Implications for its function in biological systems. Biochem. Pharmacol. 2003, 65, 67–74. [Google Scholar] [CrossRef]
- Li, S.F.; Ouyang, R.; Liu, Y.; Kuang, W.; Zhu, J.W.; Liu, D.C.; Ouyang, X.; Ma, G.L.; Peng, Y.J.; Zhang, Y.Z. Inducer PQQ for Control of Rice Sheath Blight Under Field Conditions and Its Effects on Yield and Quality of Rice. Hybrid Rice 2022, in press. [CrossRef]
- Peng, Q.; Wang, H.; Tong, J.; Kabir, M.H.; Huang, Z.; Xiao, L. Effects of indole-3-acetic acid and auxin transport inhibitor on auxin distribution and development of peanut at pegging stage. Sci. Hortic. 2013, 162, 76–81. [Google Scholar] [CrossRef]
- Livak, K.J.; Schmittgen, T.D. Analysis of relative gene expression data using real-time quantitative PCR and the 2−△△CT method. Methods 2001, 25, 402–408. [Google Scholar] [CrossRef]
- Peng, X.; Hu, Y.; Tang, X.; Zhou, P.; Deng, X.; Wang, H.; Guo, Z. Constitutive expression of rice WRKY30 gene increases the endogenous jasmonic acid accumulation, PR gene expression and resistance to fungal pathogens in rice. Planta 2012, 236, 1485–1498. [Google Scholar] [CrossRef]
- Zhong, Q. Mechanism of Resistance of Rice to Sheath Blight Induced by Exogenous Ethylene and Jasmonic Acid. Master Dissertation, Northeast Agricultural University, Harbin, China, 2019. [Google Scholar]
- Chini, A.; Fonseca, S.; Fernández, G.; Adie, B.; Chico, J.M.; Lorenzo, O.; García-Casado, G.; López-Vidriero, I.; Lozano, F.M.; Ponce, M.R.; et al. The JAZ family of repressors is the missing link in jasmonate signalling. Nature 2007, 448, 666–671. [Google Scholar] [CrossRef]
- Chung, H.S.; Howe, G.A. A critical role for the TIFY motif in repression of jasmonate signaling by a stabilized splice variant of the JASMONATE ZIM-domain protein JAZ10 in Arabidopsis. Plant Cell 2009, 21, 131–145. [Google Scholar] [CrossRef]
- Miao, W.; Wang, X.; Li, M.; Song, C.; Wang, Y.; Hu, D.; Wang, J. Genetic transformation of cotton with a harpin-encoding gene hpaXoo confers an enhanced defense response against different pathogens through a priming mechanism. BMC Plant Biol. 2010, 10, 67. [Google Scholar] [CrossRef]
- Li, T.; Huang, Y.; Xu, Z.S.; Wang, F.; Xiong, A.S. Salicylic acid-induced differential resistance to the tomato yellow leaf curl virus among resistant and susceptible tomato cultivars. BMC Plant Biol. 2019, 19, 173. [Google Scholar] [CrossRef]
- Tian, D.; Chen, Z.; Chen, Z.; Zhou, Y.; Wang, Z.; Wang, F.; Chen, S. Allele-specific marker-based assessment revealed that the rice blast resistance genes Pi2 and Pi9 have not been widely deployed in Chinese indica rice cultivars. Rice 2016, 9, 19. [Google Scholar] [CrossRef] [PubMed]
- Leng, C.L.; Song, J. Biological function of pyrroloquinoline quinine: Research progress. J. East. Liaoning Univ. (Nat. Sci.) 2014, 21, 103–108. [Google Scholar] [CrossRef]
- Li, Z.; Luo, J.; Zhang, Q.Z.; Xu, S.J.; Luo, F.F.; Liu, S.C.; Song, L.D.; Li, X. Effects of pyrroloquinoline quinone on tobacco growing soil and tobacco growth. Hunan Agric. Sci. 2020, 14–18. [Google Scholar] [CrossRef]
- Kuang, W.; Liu, Y.; Li, Q.; Zhang, Y.Z.; Zhu, G.Q. Effects of PQQ on yield composition and main agronomic characters of rice. Hunan Agric. Sci. 2017, 40–42. [Google Scholar] [CrossRef]
- Ntambo, M.S.; Meng, J.Y.; Rott, P.C.; Henry, R.J.; Zhang, H.L.; Gao, S.J. Comparative transcriptome profiling of resistant and susceptible sugarcane cultivars in response to infection by Xanthomonas albilineans. Int. J. Mol. Sci. 2019, 20, 6138. [Google Scholar] [CrossRef]
- Yu, X.; Wang, X.; Wang, X.; Zhou, Y.; Li, Y.; Wang, A.; Wang, T.; An, Y.; Sun, W.; Du, J.; et al. TEOA inhibits proliferation and induces DNA damage of diffuse large B-cell lymphoma cells through activation of the ROS-dependent p38 MAPK signaling pathway. Front. Pharmacol. 2020, 11, 554736. [Google Scholar] [CrossRef]
- Thatcher, L.F.; Anderson, J.P.; Singh, K.B. Plant defence responses: What have we learnt from Arabidopsis? Funct. Plant Biol. 2005, 32, 1–19. [Google Scholar] [CrossRef]
- Farmer, E.E.; Alméras, E.; Krishnamurthy, V. Jasmonates and related oxylipins in plant responses to pathogenesis and herbivory. Curr. Opin. Plant Biol. 2003, 6, 372–378. [Google Scholar] [CrossRef]
- Bari, R.; Jones, J.D. Role of plant hormones in plant defence responses. Plant Mol. Biol. 2009, 69, 473–488. [Google Scholar] [CrossRef]
- Vlot, A.C.; Dempsey, D.A.; Klessig, D.F. Salicylic acid, a multifaceted hormone to combat disease. Ann. Rev. Phytopathol. 2009, 47, 177–206. [Google Scholar] [CrossRef]
- Hu, Q.; Min, L.; Yang, X.; Jin, S.; Zhang, L.; Li, Y.; Ma, Y.; Qi, X.; Li, D.; Liu, H.; et al. Laccase GhLac1 modulates broad-spectrum biotic stress tolerance via manipulating phenylpropanoid pathway and jasmonic acid synthesis. Plant Physiol. 2018, 176, 1808–1823. [Google Scholar] [CrossRef]
- Xue, X.; Cao, Z.X.; Zhang, X.T.; Wang, Y.; Zhang, Y.F.; Chen, Z.X.; Pan, X.B.; Zuo, S.M. Overexpression of OsOSM1 enhances resistance to rice sheath blight. Plant Dis. 2016, 100, 1634–1642. [Google Scholar] [CrossRef] [PubMed]
- Mei, C.; Qi, M.; Sheng, G.; Yang, Y. Inducible overexpression of a rice allene oxide synthase gene increases the endogenous jasmonic acid level, PR gene expression, and host resistance to fungal infection. Mol. Plant Microbe Interact. 2006, 19, 1127–1137. [Google Scholar] [CrossRef] [PubMed]
- Liu, Z.; Zhang, S.; Sun, N.; Liu, H.; Zhao, Y.; Liang, Y.; Zhang, L.; Han, Y. Functional diversity of jasmonates in rice. Rice 2015, 8, 42. [Google Scholar] [CrossRef]
- Manosalva, P.M.; Bruce, M.; Leach, J.E. Rice 14-3-3 protein (GF14e) negatively affects cell death and disease resistance. Plant J. 2011, 68, 777–787. [Google Scholar] [CrossRef]
- Hou, Y.; Wang, Y.; Tang, L.; Tong, X.; Wang, L.; Liu, L.; Huang, S.; Zhang, J. SAPK10-mediated phosphorylation on WRKY72 releases its suppression on jasmonic acid biosynthesis and bacterial blight resistance. iScience 2019, 16, 499–510. [Google Scholar] [CrossRef] [PubMed]
Publisher’s Note: MDPI stays neutral with regard to jurisdictional claims in published maps and institutional affiliations. |
© 2022 by the authors. Licensee MDPI, Basel, Switzerland. This article is an open access article distributed under the terms and conditions of the Creative Commons Attribution (CC BY) license (https://creativecommons.org/licenses/by/4.0/).