Article

Growth, Nitrogen Uptake, and Nutritional Value of a Diverse Panel of Shrub Willow (Salix spp.) Genotypes in Response to Nitrogen Fertilization

1
Horticulture Section, School of Integrative Plant Science, Cornell University, Cornell AgriTech, Geneva, NY 14456, USA
2
Department of Natural Resources, Institute of Plant Sciences, Agricultural Research Organization, Volcani Center, P.O. Box 6, Beit Dagan 50250, Israel
*
Author to whom correspondence should be addressed.
Agronomy 2022, 12(11), 2678; https://doi.org/10.3390/agronomy12112678
Submission received: 31 August 2022 / Revised: 6 October 2022 / Accepted: 24 October 2022 / Published: 28 October 2022

Abstract

:
Riparian buffers are a practical strategy to reduce N runoff. Shrub willows (Salix spp.) are a well-suited natural means to manage water quality due to dense aboveground biomass growth, diffuse root systems at a shallow depth, and low water- and nutrient-use efficiencies that will maximize uptake. Perennial forage crops in the margins of agricultural lands could provide biomass for fodder. The response of fifty genotypes to a single N level of fertilizer under standard conditions at a very high nutrient loading level (500 ppm N, delivered weekly) was compared with water-only controls. Irrigation with excess N caused greater aboveground growth measured as biomass, stem length, and diameter, as well as morphological properties that varied significantly by genotype, indicating a potential for selection in a breeding program. SPAD was a reliable indicator of the effect of fertilizer on foliar crude protein and showed different effects of fertilizer on N uptake and nutritional value among genotypes. We identified genotypes that display high N uptake and good relative feed value. This intentional design for environmental benefits could have a dual purpose should this potentially nutrient-dense biomass by used as fodder for small ruminants.

1. Introduction

Nitrogen (N) is a critical factor in sustaining higher crop yield and is one of the most expensive fertilizers to supply. Since N is one of the most reactive and mobile elements, its management is complex, where significant losses can be produced by surface runoff and subsurface leaching in watersheds [1]. Presently, 50–70% of the nitrogen applied to soil worldwide is lost to the environment [2]. Nitrate leaching is a loss to agricultural cropping systems and contributes to the widespread and devastating eutrophication of water bodies worldwide [3].
Riparian buffers are a practical strategy to reduce N and P losses by 73% and 82%, respectively, and [4,5] reported that growing deep-rooted perennial crops reduces NO3 leaching by 25% on marginal lands. In addition, sustainably integrating perennial biomass crops reduced fertilizer costs due to retaining otherwise-leached nutrients and reduced the need for the expensive removal of fertilizer leaching from the water supply [6]. Willows are native to riparian zones and are known for their ability to take up large amounts of water and nutrients [7]. Willows (Salix spp.) are a well-suited natural means to manage water quality due to dense aboveground biomass growth, large, diffuse root systems at a shallow depth, and low water- and nutrient-use efficiencies that encourage greater uptake, which allow plants to survive in areas where nutrient and water resources are excessive [8,9]. These characteristics make willow suitable for removing excess nutrients from agricultural lands that might otherwise contaminate surface or groundwater. Identifying genotypes that display a high luxury uptake of nutrients would maximize their effectiveness in riparian buffers, while also producing foliage with good relative feed value due to the accumulation of protein.
The biomass produced in perennial buffer systems may also provide additional ecosystem services if managed correctly. Specific browse and woody species contain secondary metabolites that can dramatically decrease parasite burden and ruminal methane production and enhance animal welfare when used as fodder [10,11,12,13]. Willow fodder has similar nutritional value to pasture grazing [14] and can provide forage for livestock during the summer [15] or under drought conditions [16]. In New Zealand, the use of willow as a feed supplement for ewes grazing in droughted pasture increased both dry matter (DM) intake and the number of lambs born per ewe [17]. Although specialized metabolites in willow may have a deleterious effect on herbivory [18], the presence and production levels of these secondary compounds vary by species and can be manipulated through breeding [19]. Additionally, browsing willow leaves was associated with reduced CH4 emissions in young sheep, and [20,21] concluded that willow could be used most effectively if fed to goats, followed by deer, with sheep as the least efficient targeted species. Thus, integrating perennial forage crops in the margins of agricultural lands could provide biomass for fodder and potential improvements in the sustainability of commodity crop production.
Integrating willows as perennial fodder crops in agricultural lands could provide biomass as forage and potential improvements in the sustainability of crop production, improving watershed quality, and providing other environmental benefits. However, the effectiveness of willows as riparian buffers has not yet been optimized, since genotypes have not been explicitly selected for luxury nutrient accumulation.
The context of this work is in riparian buffers in watersheds that suffer from excess nutrient runoff due to fertilizer applications for agriculture. In this setting, the soils have excess nutrients and are not prone to impaired soil fertility in the upper layers (in fact, the opposite—the upper layers have excess nutrients). We sought to select for genotypes with maximum luxury nutrient uptake (low nitrogen-use efficiency) and high transpiration (low water-use efficiency) to maximize N removal and biomass production. We then determined the relationship between N availability and forage quality. The results of this study will identify willow genotypes that exhibit luxury N uptake, thus, supporting breeding efforts aimed at the adaptation of willows as multifunction riparian buffers.

2. Materials and Methods

2.1. Plant Material and Experimental Design

To identify shrub willow genotypes with a luxury accumulation of N, we screened a diverse collection of genotypes with and without supplemental fertilizer in the greenhouse, using SPAD as a measure of N accumulation.
In order to select willow with low nutrient-use efficiency but high biomass production to maximize luxury N uptake, we surveyed a collection of 50 genotypes of diverse willow species and hybrid progeny produced through controlled breeding that exhibited a variety of growth forms and leaf characteristics (Table A1). These were selected based on high biomass yield under high and low nutrient conditions to maximize nutrient uptake and potentially foliar protein content.
To determine the relationship between N availability and forage quality, we applied a single rate of N fertilizer under standard conditions in the greenhouse at a very high nutrient loading level (500 ppm N, delivered weekly through a Dosatron fertilizer injector) compared with a water-only control. The plants were watered to maintain sufficient moisture in each pot, proportional to the water use by each plant. The trial was conducted with single plant plots (10 L pots) in a randomized complete block design, replicated four times (N = 400). In winter 2020, 1-year-old shoots of the 50 individuals were collected from nursery beds and processed into 20 cm cuttings, then stored in a freezer at −4 ℃ until planting. On 18 February 2020, a single cutting was planted in each 10 L plastic pot filled with a standard peat-based potting mix and arranged randomly across eight benches in a greenhouse, with two benches representing each replicate block. The greenhouse was maintained at 28 °C with supplemental lighting for 16 h days and 18 °C during 8 h nights.

2.2. Growth and Physiological Measurements

Twenty-three biomass-related traits were measured during the greenhouse trial (Table 1). The cuttings were planted on 18 February 2020. After budbreak and continuing every two days, the vegetative phenology stage of each pot was observed on each plant. The final measurements were performed on 13 March 2020. Leaf chlorophyll content was estimated four times during the experiment using a SPAD Chlorophyll Meter (Apogee Instruments Inc, model MC-100, Logan, UT, USA). Five fully-expanded healthy leaves were measured on each plant in the most productive portion of the canopy. Three representative leaves from the mid-canopy of each plant were removed and measured for leaf area (LA) using a handheld leaf area scanner (model CI-203; CID Bio-Science, Camas, WA, USA). These leaves were placed into paper envelopes and dried at 65 °C to a constant mass. Each leaf was then weighed, and specific leaf area (SLA) was calculated as the ratio of leaf area to dry mass. On 22 May 2020, every shoot from each plant was removed from the original cutting, the length measured for mean stem length (MSL) and sum of stem lengths (SSL), and the diameter measured for mean stem diameter (MSD) and sum of stem diameters (SSD). We measured the proportional sylleptic branching (PSB) as the length of the branch divided by the number of sylleptic branch nodes, and stem bending (SB), which was measured as the stem projection angle relative to vertical, ranging from 90 (when the stem was horizontal and touching the edge of the pot) to 0 for an upright stem. The leaves and stems were partitioned into paper bags and weighed for fresh weight, then placed in a drying oven at 65 °C and dried to a constant mass for leaf and stem dry weight. The dried stem and leaf tissues were recombined into a single total aboveground biomass (BDW) sample for each plant and commutated in a knife mill to pass a 1.0 mm mesh.
To measure root biomass, we used root electrical capacitance (REC) using a DCM3 digital capacitance meter (UEi Test Instruments, Beaverton, Oregon, USA) with conductance ranges of 200 pF to 20 mF, and a ±1% reading and digital accuracy below 2000 μF, as described by [22], who found strong linear and positive correlations between REC and root dry biomass (r = 0.88), which can provide an efficient and non-destructive technique to indirectly quantify the root biomass of shrub willow genotypes.
A total of 160 combined aboveground biomass samples representing three replicates of the fertilized plants (n = 150), plus 10 water control plants were submitted for forage quality analyses to a commercial laboratory for nutritional analyses (Dairy One Forage Laboratory, Ithaca, NY, USA). The package of wet chemistry analysis and calculated indices included dry matter, crude protein (CP), acid detergent fiber (ADF), neutral detergent fiber with α-amylase and sodium sulfite (aNDF), non-fiber carbohydrates (NFC), relative feed value (RFV), total digestible nutrients (TDN), net energy for lactation (NEl), net energy for maintenance (NEm), net energy for gain (NEg), and digestible energy (DE). The Dairy One Forage Laboratory participates in the Regular Check Sample program of the Association of American Feed Control Officials.
To define and estimate nutrient-use efficiency, we used nitrogen uptake (g), calculated as plant weight (g) multiplied by nitrogen percentage in the plant.

2.3. Statistical Analysis

For the traits collected just once at the end of the experiment, a one-way analysis of variance (ANOVA) with a significance level of 5% was conducted on traits with genotype and treatment as fixed effects. A post hoc Tukey honestly significant difference (HSD) verified the impact of the treatment and genotypes on the traits. The statistical model consisted of two treatments (control and excess fertilization), 50 genotypes, and 4 replicate blocks as random factors. The normality of the residuals was assessed visually with quantile-quantile plots. All tests were conducted using JMP 14 (SAS Institute, Cary, NC, USA).
We used Test Slices to test if the significant interaction effects are due to crossover or caused by variation in the magnitude of the difference between control and fertilizer.
SPAD was measured at four time points during the trial. The data were analyzed with a repeated measures model using SAS version 9.4 [23]. Genotype, treatment, and time were considered fixed effects, with time modeled as a continuous variable, while the block effect was considered random, as performed by [24]. Preliminary analyses indicated a curvilinear response over time for the main effects, so a quadratic time effect was added to the model. The initial model runs indicated that there were no significant (at the p ≤ 0.05 level) third-order interactions involving treatment, genotype and time, or quadratic time.
A number of variance-covariance structures were tested to model the repeated effects with pot serving as the subject, and model fit was assessed using the AIC and BIC. While the unstructured analysis provided the best overall fit, the heterogeneous Toeplitz (TOEPH) structure was second best, with far fewer variance-covariance parameters to be estimated. We applied log transformation to the original data of REC, then performed the statistical analysis.

3. Results

3.1. Biomass Productivity and Growth Development

Fertilizer treatment and genotype had a significant effect on all biomass productivity traits (p < 0.0001). The biomass dry weight (BDW) of the fertilized plants was eight-fold greater than the water-only control (Figure 1, Table 2; p < 0.0001). The dry matter content (DMC) and stem:leaf ratio (SLR) were significantly greater (p < 0.0001) in the water control than the fertilized treatment. Mean stem length (MSL), sum of stem lengths (SSL), mean stem diameter (MSD), and sum of stem diameters (SSD) were all significantly greater for the fertilized plants compared with the water-only control (Table 2; p < 0.0001). Four traits showed a highly significant interaction between treatment and genotype (p < 0.0001) and three traits were significant at the p < 0.001 level (Table A2). According to Test Slices, the significant interaction effects are not due to crossover, but are caused by variation in the magnitude of the difference between the control and fertilizer for some genotypes, whereas SLR with one genotype 01-05-102 had more SLR in fertilizer than the control (0.87 ± 0.06, 0.49 ± 0.1, respectively), in contrast to other genotypes.

3.2. Morphological Characteristics

The fertilizer and genotypes effected almost all morphological characteristics traits. Leaf area (LA) and specific leaf area (SLA) were significantly greater (p < 0.0001) in the fertilized treatment than in the water control. Stem number (SN) was also significantly greater (p < 0.0001) for the fertilized plants than for the control. The stems were significantly more upright for the water control plants and were growing distinctly horizontal for the fertilized plants (p < 0.0001). There were significantly more sylleptic branches in fertilized plants compared with almost no sylleptic branching in water-only control plants (p < 0.0001). Root electrical capacitance (REC) was significantly greater (p < 0.0001) for the fertilized plants than the water control plants (Table 2). Six traits showed a significant interaction between treatment and genotype (Table A3). The significant interaction effects are not due to crossover but are caused by variation in the magnitude of the difference between the control and fertilizer for some genotypes.

3.3. Nutritional Value

The main effect of genotype was significant for all traits. For the main effect of treatment, four traits associated with N and NFC were significant. Percent CP was significantly greater (p < 0.0001) in all genotypes given excess fertilization compared to the water control (19.9 ± 0.19 and 4.54 ± 0.18). In contrast, DE (Mcal∙lb−1) and % NFC, which were low in excess fertilization compared to the water control (1.01 ± 0.005: 1.12 ± 0.01; 23.47 ± 0.34: 38.43 ± 1.16, respectively). Seven traits associated with fibrous carbohydrates (fiber), which are compounds that make up cell walls, were not significant by fertilizer treatment (Table A4).

3.4. SPAD Value

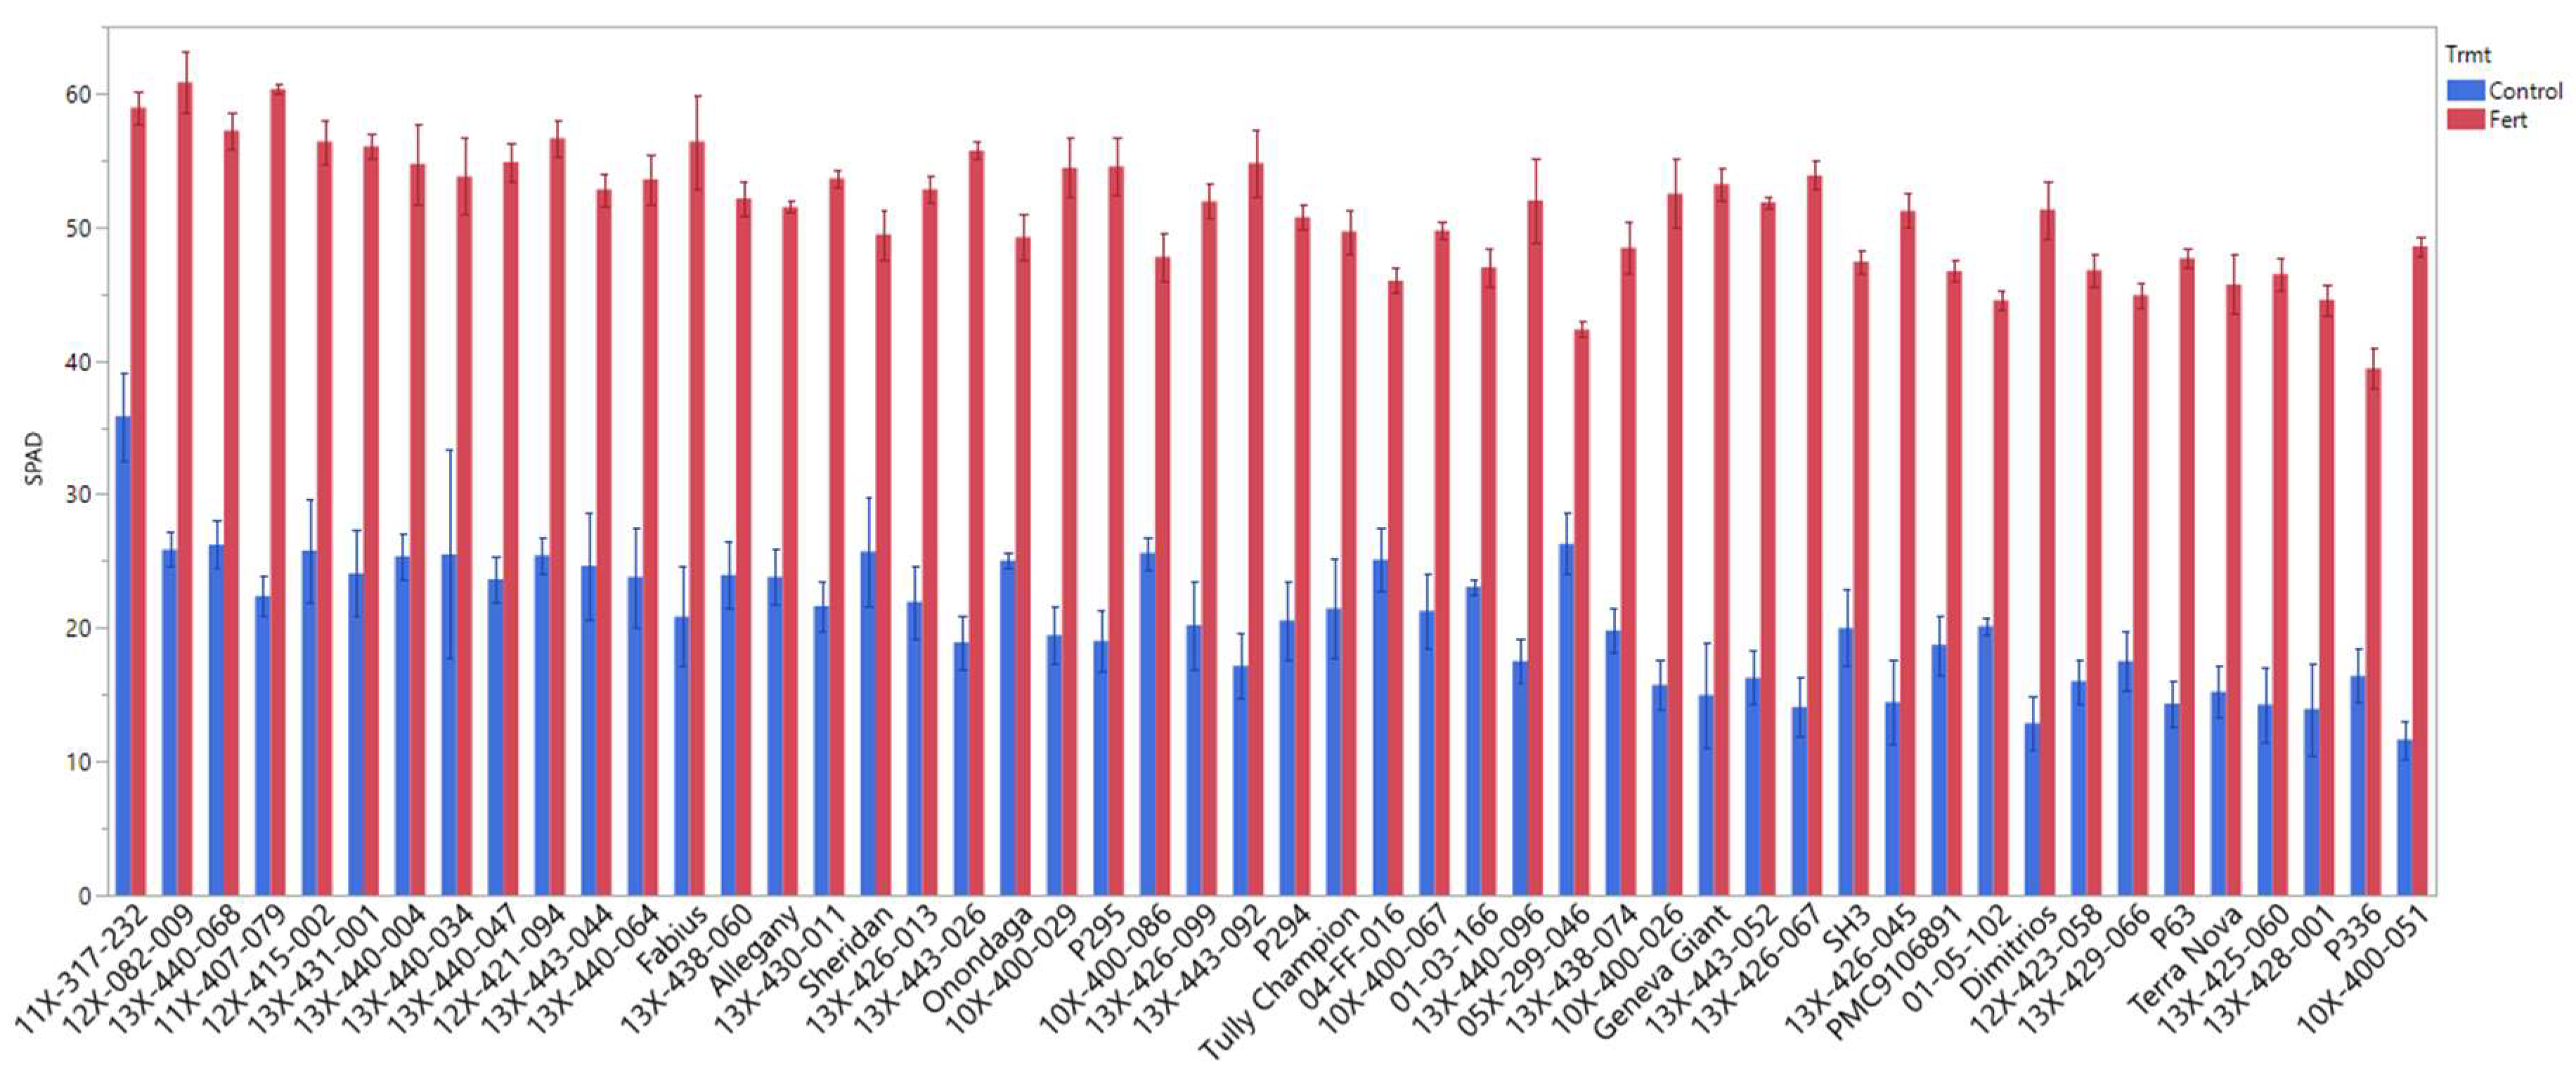
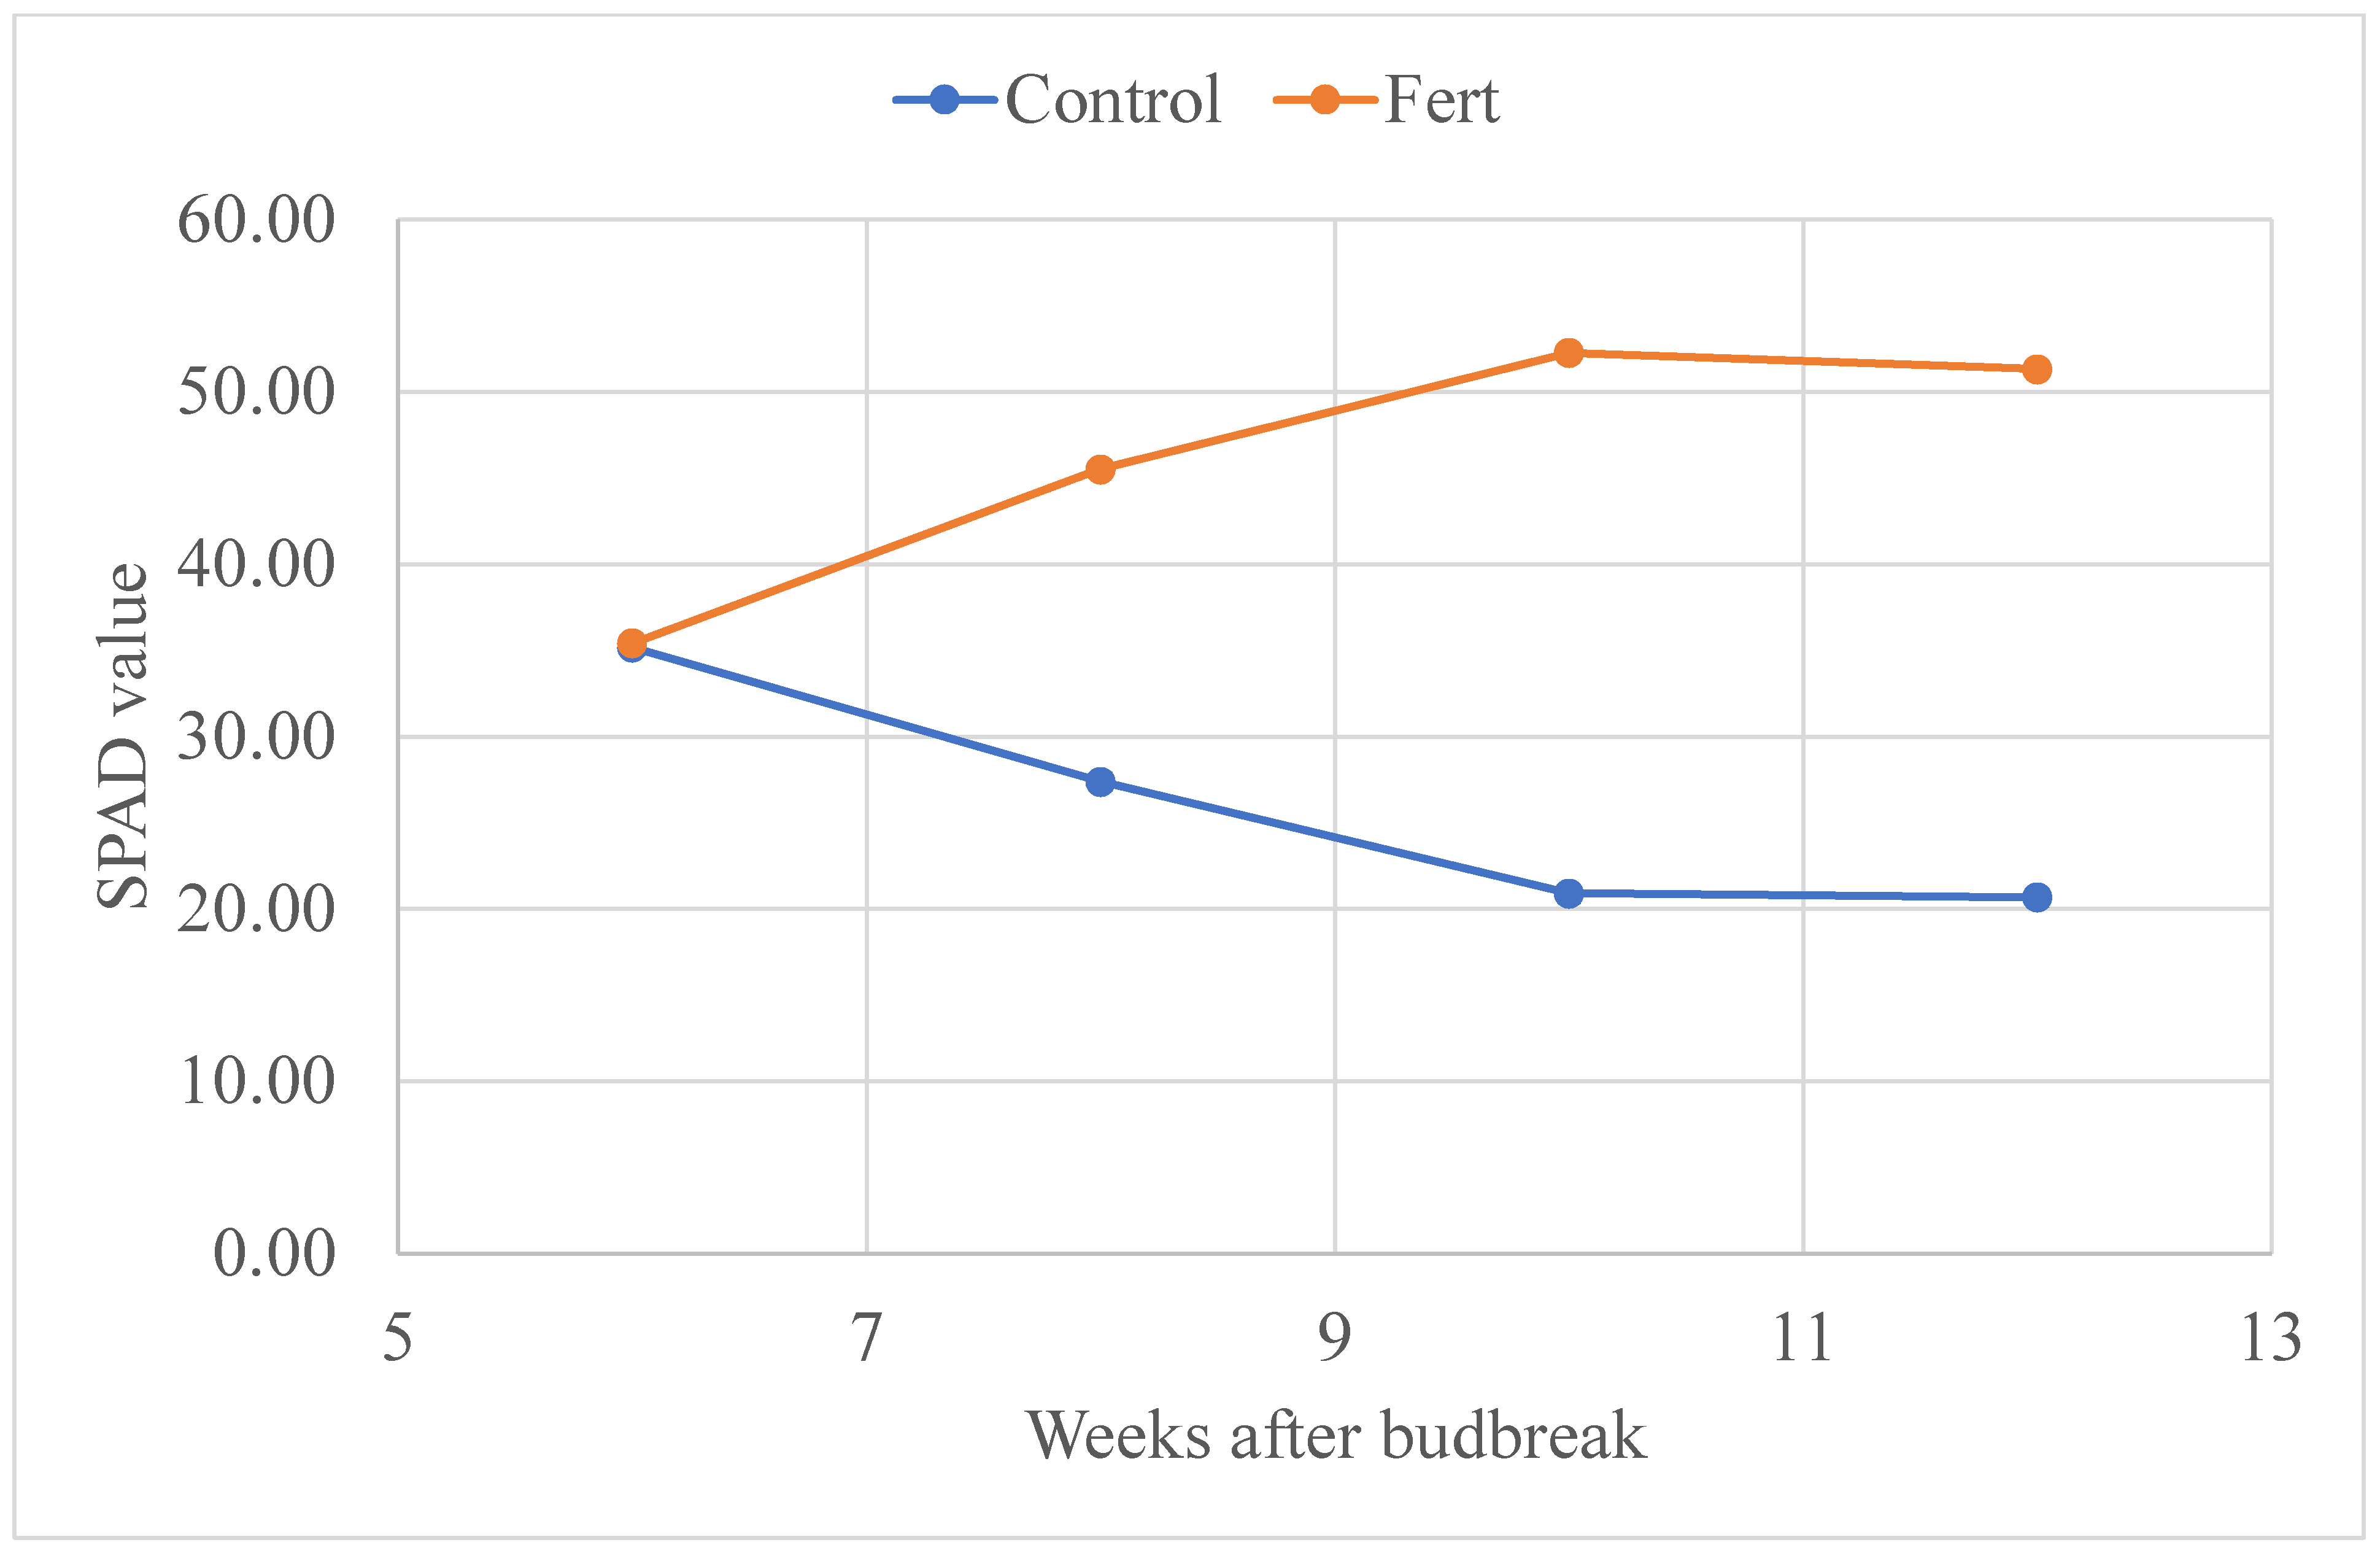
SPAD was measured at four time points during the trial and showed a curvilinear response over time (Figure 2). Both the linear and quadratic effects of time were highly significant, indicating that modeling SPAD response across time as a polynomial function was justified. SPAD generally increased for the fertilized plants over time and decreased for the water control plants over 10 weeks after budbreak, and then stabilized. SPAD values for the fertilized plants were similar to the water control plants for the first time point, but by the second time point, the SPAD of the fertilized plants became significantly greater than the control (Figure 3). The interaction between genotype/treatment and the quadratic effect of time was highly significant, indicating that there were significant differences in the decline rate among genotypes and between treatments (Table 3). These initial results indicated that there were significant differences among genotypes as well as a fertilizer treatment effect on biomass production and SPAD value (Figure 2 and Figure 3).

3.5. Correlation between Traits

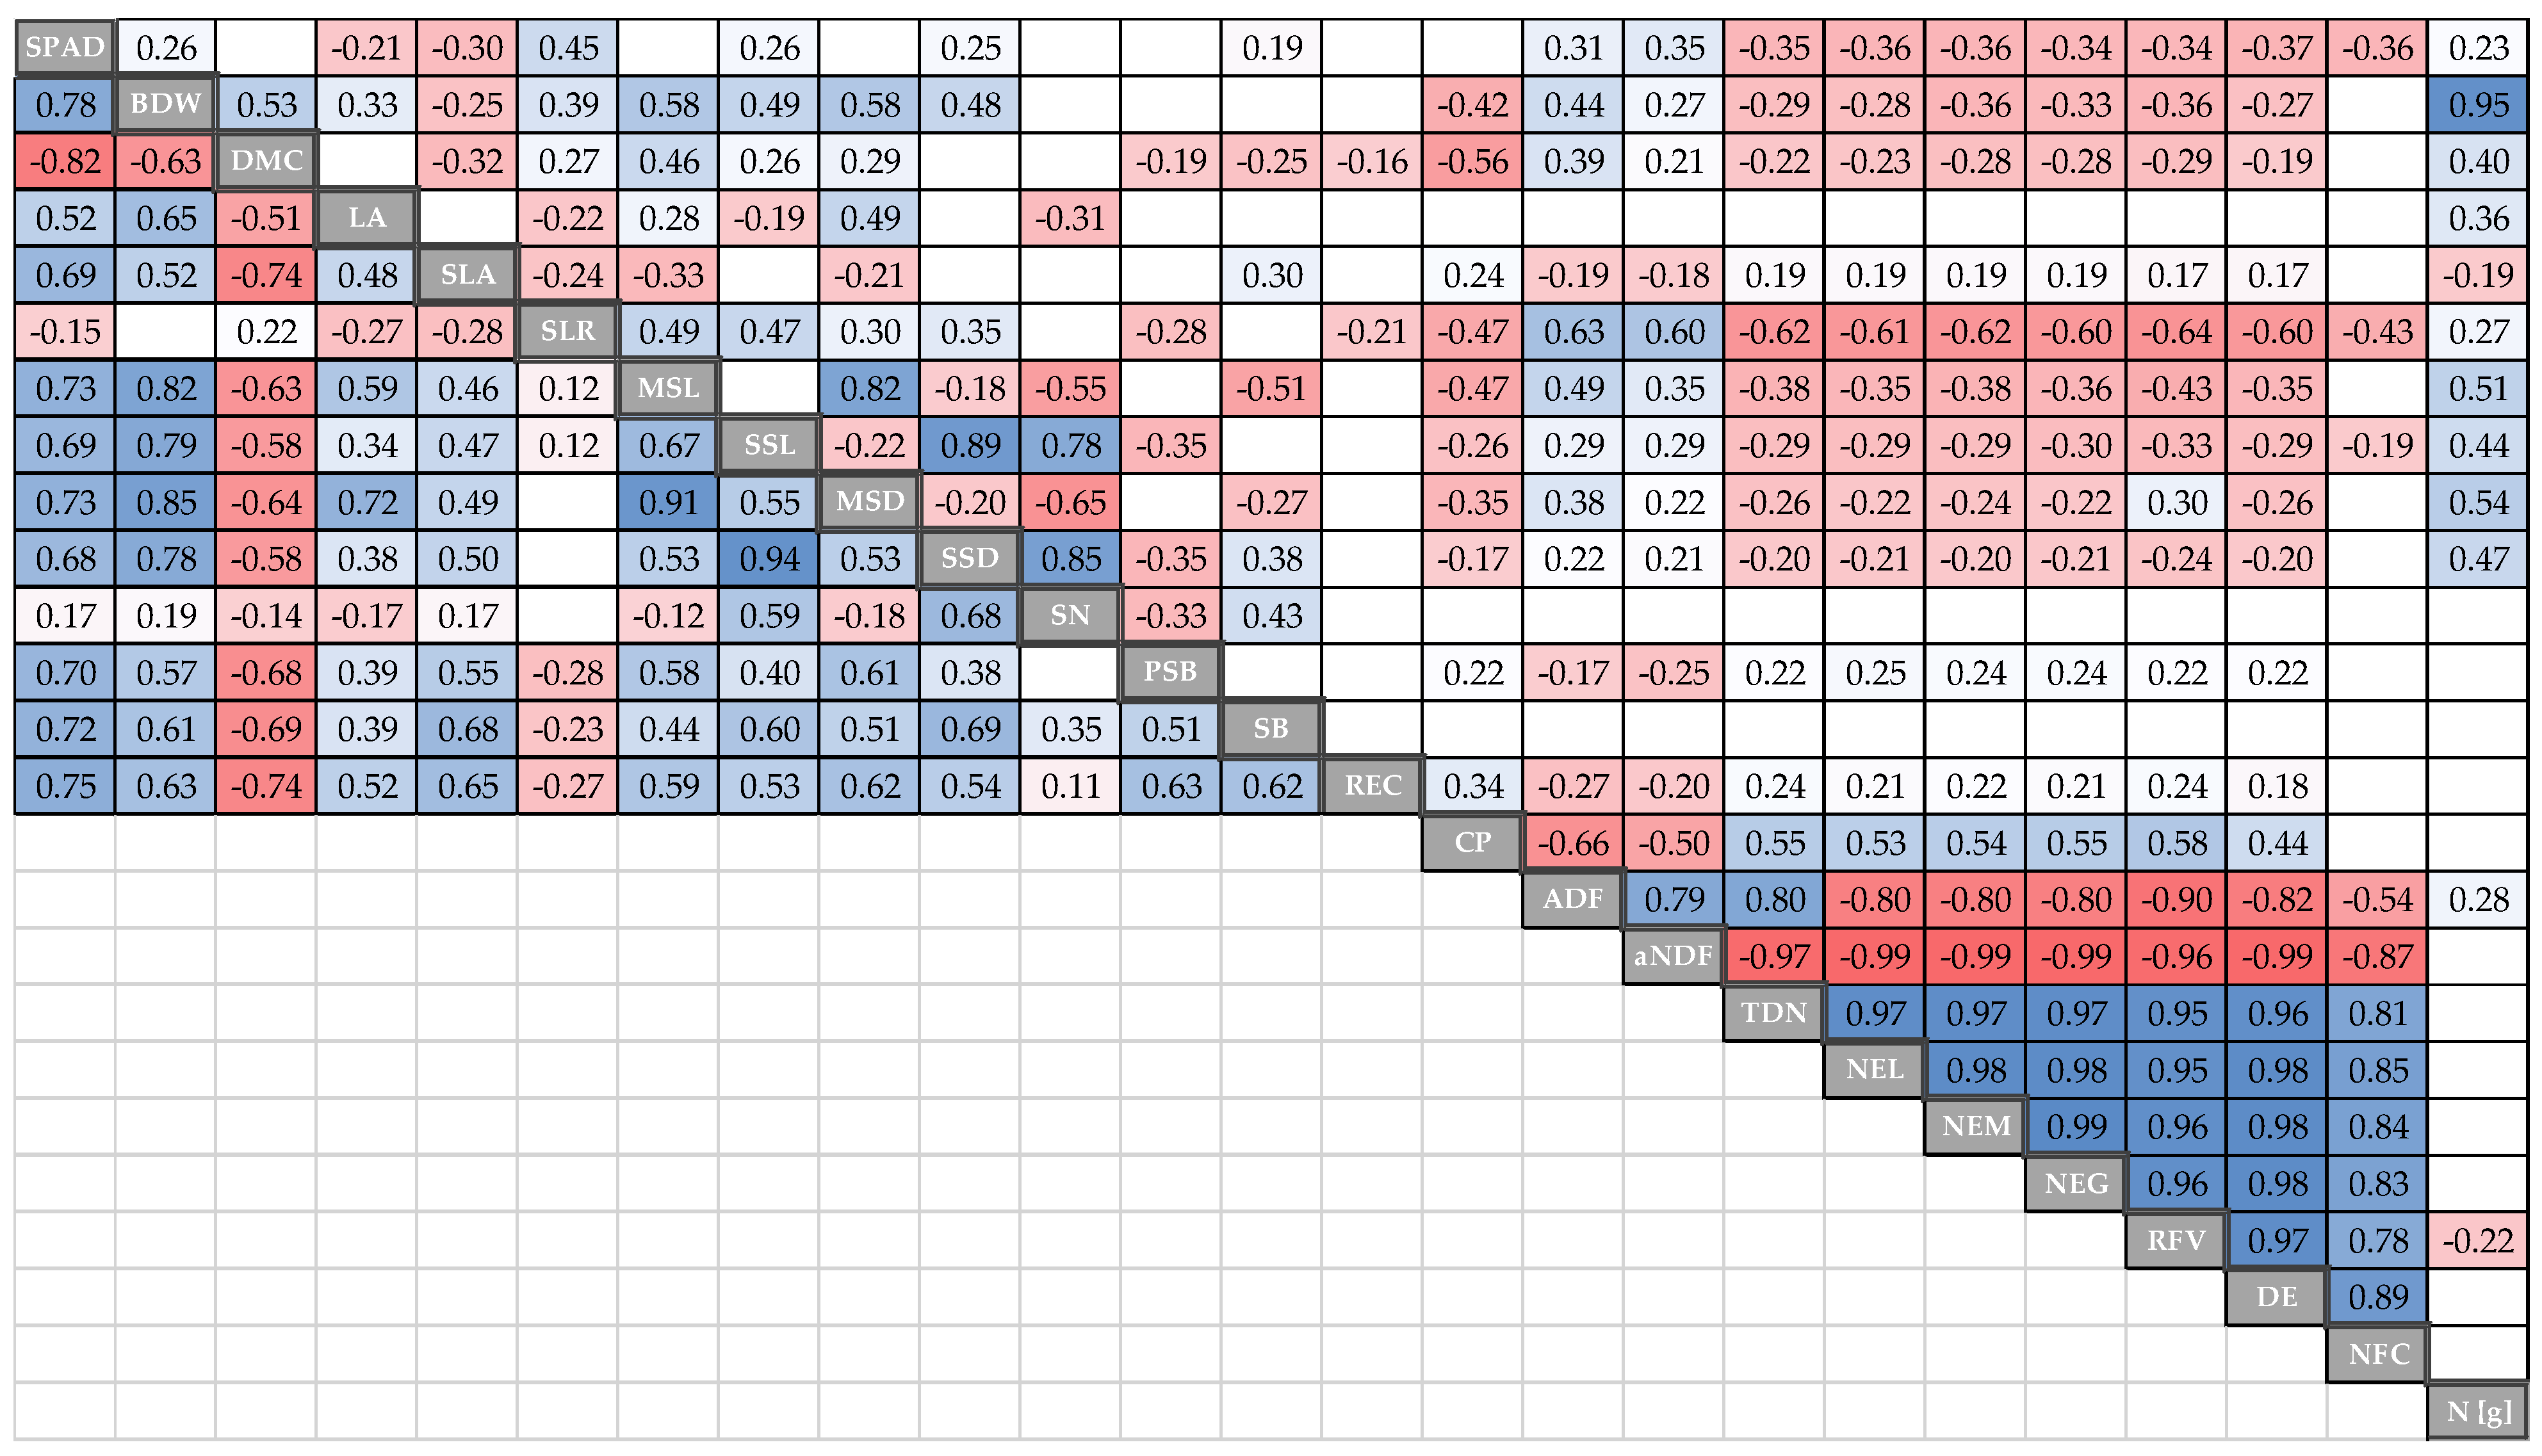
The different responses of the plants to the two fertility treatments affected the correlation between the various traits, and there are significant differences between the two groups in the correlation and the significance between the traits (Figure 4).
For the fertilizer group (upper diagonal), all the traits of biomass production and morphology had a negative correlation with the nutritional value traits other than ADF and aNDF, which the correlation was positive. Differences are due to the negative collusion of ADF and aNDF with the rest of the nutritional value. In response to an increase in ADF and aNDF, the nutritional value of the plants decreases.

3.6. Performance of Genotypes under High Fertilizer and Their Response to Low Fertilizer (Control)

The experimental design allowed us to directly compare the yield response of 50 willow genotypes with a well-fertilized treatment relative to a water control (Figure 5). The overall mean fertilization effect was an 11.7-fold increase in biomass yield over control treatments, with a 95% CI between 10.3 and 13.2. All genotypes had consistently greater mean yields for fertilized treatments over control treatments (i.e., 95% CI does not overlap with zero). Clone 01-05-102 had the most positive response to fertilization with a 44.5-fold increase in yield with fertilization, with a 95% CI between 24.2 and 64.9. Clone 13X-428-001 had the lowest response to fertilization with only a 3.4-fold increase in yield with fertilization, with a 95% CI between 2.6 and 4.2.
Integrating the forage quality analysis with yield response displays the performance of genotypes under high fertilization to the variation in the N and RFV (Figure 6). The points were divided into four quadrants using the mean values of both N and RFV (1.6 ± 0.1 and 117.7 ± 1.8, respectively) as a crossing point for the axes. Quadrant II shows the best genotypes, which had values above the mean for both traits. ‘Dimitrios’ had the best results, besides high biomass production, followed by ‘Terra Nova’, 13X-425-060 and 13X-426-013.
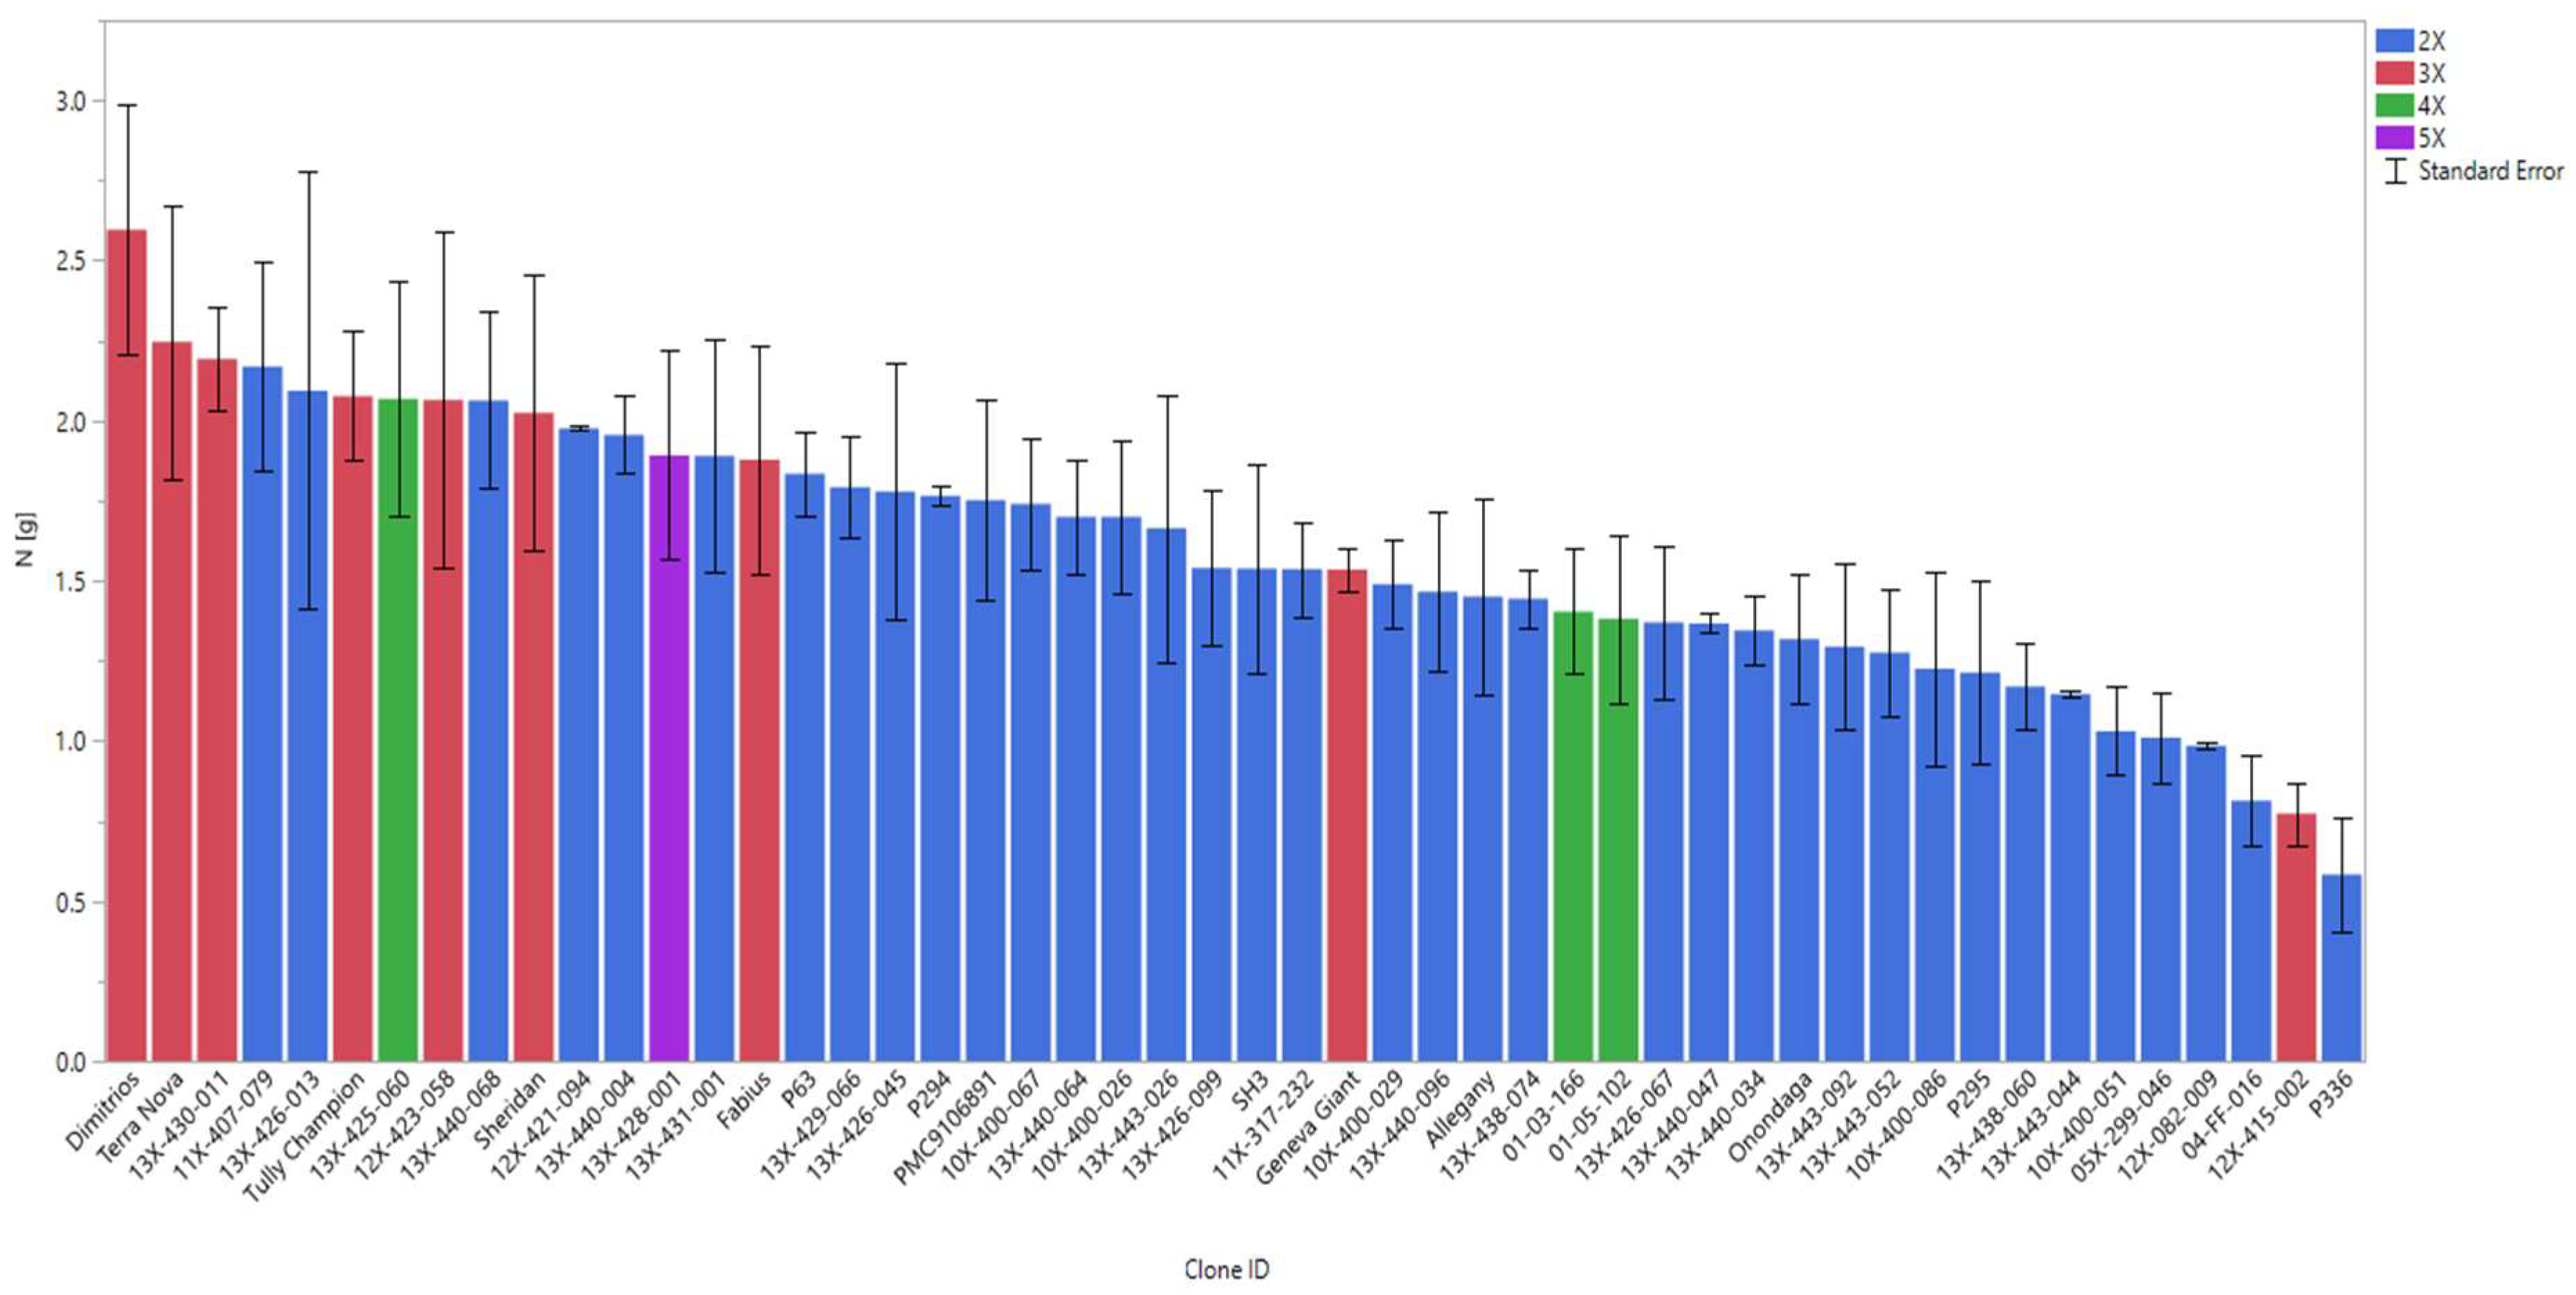
We found that ‘Dimitrios’ followed by ‘Terra Nova’ had the greatest nitrogen uptake, while P336 and 12X-415-002 had the lowest nitrogen-use efficiency at around five-fold less than the highest genotypes (Figure 6 and Figure 7). With luxury N fertilizer, ‘Dimitrios’ followed by 13X-425-060 had the greatest biomass production, while P336 and 12X-415-002 had the lowest production, which was four-fold less than the highest genotypes. Clone 13X-425-060 (Salix miyabeana) appears promising as a candidate selection for forage production with both high aboveground biomass and nitrogen uptake, although it had only medium SLR and RFV. ‘Dimitrios’ had greater biomass production than others with high RFV, IU, and low SLR, which confirms earlier results for this cultivar of high leaf biomass [24]. Notably, the yields of ‘Dimitrios’ in field trials can be low when there is pressure from herbivores, including deer and beetles, suggesting the need to extend greenhouse trials to actual field conditions.

4. Discussion

In this study, we examined the nutritional value of genotypes in a controlled environment supplied with excess nutrient availability. There was a significant difference among genotypes, but no effect of the ploidy (diploid and triploid) on the nutritional value was observed, in contrast to previous studies [24,25]. One of the main reasons why we do not see the effect of ploidy could have been that in our experiment, we analyzed biomass containing a mix of leaves and stems together and not just stems, as in other studies. An additional reason is a vast variance in the stem-to-leaf ratio among cultivars that may further blur the effect of ploidy.
The application of excess nitrogen resulted in significantly greater aboveground biomass compared to the water control group in the various growth traits (biomass, stem length, stem diameter), as well as morphological properties (leaf area, specific leaf area, number of stems, sylleptic branch, and stem bending), which has been observed in other greenhouse studies [26]. All the above traits were also different between genotypes, which suggests that there is potential to breed for cultivars with varying responses to N fertilization. While extra fertilizer enhanced biomass production and other traits, it resulted in lower SLR due to the increase in leaf biomass per stem and more stems. The SLR can be a major determinant of the nutritional value in willow, since leaves can contain twice as much CP and be 50% more digestible than stems [12]. Cultivars with low SLR that are used as forage can remove more N from the soil compared to those with high SLR that may lose a large fraction of the N taken up during the growing season via leaf abscission in autumn.
Until now, the selection criteria for willow breeding for bioenergy purposes was aimed at producing more woody biomass with low SPAD, high SLR, and high nutrient-use efficiency. In selecting willows for forage and nutrient management applications, we seek the opposite, because the desired outcome is more leaves with higher SPAD and, therefore, more CP resulting from luxury N uptake. Low SLR and low nutrient-use efficiency will generate improved quality forage containing leaves with more nitrogen content and less woody material, with a final outcome of the improved digestibility of the forage. Stem length and diameter traits are associated with biomass production in both groups. In this experiment we measured the biomass of leaves and stems, but the results were consistent with the reporting of stem biomass from another shrub willow greenhouse trial [24]. Stem length was associated with nutritional value traits in growth under conditions of nutrient deficiency more than with excess fertilization. Leaf area was also associated with nutritional value traits, but in inverse proportion to stem length. Belowground biomass was significantly greater in the fertilizer treatment compared with the control, as indicated by REC [22], while there was small difference by genotype, perhaps because the large effect of the treatment made the variation by genotype negligible.
In other experiments, controlled environment biomass production was significantly correlated with that of field-grown plants in short rotation coppice [27,28,29]. However, in our case, the biomass was assessed as total leaves and stems, rather than just stem biomass. As leaves contain twice as much CP and are 50% more digestible than stems [12] there is a significant influence of any foliar damage on total biomass quality and quantity. For example, ‘Dimitrios’, which produced the greatest biomass in our controlled environment experiment, had the lowest stem biomass among field-grown plants due to the loss of leaves to herbivory and the lowest SLR [24].
The effect of fertilizer was evident in the SPAD readings among genotypes. SPAD was a reliable measure to monitor nitrogen status as it reported the increasing nitrogen deficiency trend over time in the control group compared with the fertilizer treated plants. SPAD can be used as an estimate of leaf N content for Salix [30]. This experiment provides baseline values for forage quality across many diverse genotypes, although additional analysis from field plots is needed. The effect of fertilizer on CP values was significant with over six-fold greater CP compared with the control. The values were uniform among genotypes and NFC was high. This suggests that the harvest of well-fertilized field plots at a reasonably immature stage would contribute to higher digestibility values. The TDN estimates indicate reasonably good digestibility, but the TDN values and all energy values are predicted by regression from the components that were measured.
The mean CP, ADF, and NDF were greater in the fertilizer-treated plants compared with the analyses of willow forage reported in the literature [12,31]. This may indicate the effects of cultivation with excess nitrogen under nearly ideal controlled environment conditions compared with the stresses and limitations of conditions in the field. On average, the fertilized willow biomass from this trial had comparable CP, NDF, TDN, net energy, and NFC to grass and corn silage or hay [32]. The forage quality analysis of the fertilizer treatment biomass from this trial showed mixed results in comparison with fodder from three willow genotypes (Salix acmophylla), with greater CP and RFV, but lower NDF and comparable ADF [12]. In summary, the fodder produced in this trial had quality that is within the range of other fodder materials in use. Moreover, it may provide benefits when fed as part of a more diverse diet. It should be noted that willow plants contain condensed tannins and other secondary metabolites from the salicylate group that can improve parasite management, improve health and well-being, and increase animal productivity [13,33].
The ranking of the SPAD in the fertilization group differs from the ranking in the control group. On the other hand, some of the genotypes maintained the same ranking in the two groups, the most prominent of which were the four first-ranked genotypes (Figure A1A). In contrast, a reversible trend was observed in the biomass ranking (Figure A1B). Genotypes that were ranked high in the fertilizer group moved to a low rating in the control group. At the same time, the high-ranked genotypes in the control group were downgraded in the fertilization group, indicating various factors that control biomass production in the presence and absence of nitrogen. The same reversal trend was observed in the ranking of genotypes within and between groups and even more clearly in the SLR (Figure A1C). Therefore, there is no correlation between the ranking of the genotypes in the two groups, which makes it critical to select the appropriate genotype matched with the expected fertility conditions, whether provided through runoff or direct field amendment. Our results confirm the earlier results of [27] that variable response to environment is a strong argument for the choice of clones matched to site conditions and application.
In selecting improved genotypes for forage production, an index that accounts for biomass yield, LSR, and forage quality values needs to be developed. In general, breeding for forage quality requires combining in a single genotype superior yield under luxury N with maximum leaf production and the greatest CP accumulation. Genotypes selected in this way could provide farmers with a dual-purpose crop that will take up maximum surplus nutrients in buffers designed to reduce fertilizer runoff, while also producing a good forage that can be fed to animals. Nitrogen uptake and nutritional value were significantly different among genotypes in this controlled environment experiment. This is a first step to developing a comprehensive selection index that can inform future breeding efforts targeting high biomass production, water quality management performance, and improved forage quality.

Author Contributions

H.M., E.S.F. and L.B.S. conceived and designed the experiment. H.M. and E.S.F. carried out the experiment, analyzed the data, and prepared the manuscript. L.B.S. reviewed and commented on the manuscript. All authors have read and agreed to the published version of the manuscript.

Funding

Partial funding for this project was provided by a grant from the United States Department of Agriculture National Institute for Food and Agriculture (USDA NIFA) award 2018-68005-27925 and from Federal Capacity Funds through the New York State Agricultural Experiment Station. Hussein Muklada’s efforts were funded by BARD, the United States–Israel Binational Agricultural Research and Development Fund, Vaadia-BARD Postdoctoral Fellowship Award No. FI-591-2019.

Data Availability Statement

Not applicable.

Conflicts of Interest

The authors declare no conflict of interest.

Appendix A

Table A1. Pedigree, sex, and ploidy of 50 selected shrub willow genotypes for the greenhouse screening trial.
Clone IDEpithetPedigreeSexPloidy
01-03-166 Salix cinereaF4X
01X-266-016SheridanS. viminalis × (S. viminalis × S. miyabeana)F3X
05X-281-068Geneva Giant(S. koriyanagi × S. purpurea) × S. miyabeanaF3X
05X-299-046 S. eriocephalaF2X
99202-004FabiusS. viminalis × S. miyabeanaF3X
99202-011Tully ChampionS. viminalis × S. miyabeanaF3X
99239-015AlleganyS. koriyanagi × S. purpureaF2X
P294 S. suchowensisF2X
P295 S. suchowensisF2X
P336 S. integraF2X
SH3 S. koriyanagiF2X
-Terra Nova(S. viminalis × S. triandra) × S. miyabeanaF3X
PMC9106891 S. sericeaF?2X
01-05-102 S. cinereaM4X
04-FF-016 S. koriyanagiM2X
99113-012OnondagaS. koriyanagi × S. purpureaM2X
-Dimitrios(S. schwerinii × S. viminalis) × S. aeygyptiacaM3X
P63 S. suchowensisM2X
10X-400-026 S. purpurea × S. suchowensisM2X
10X-400-029 S. purpurea × S. suchowensisF2X
10X-400-051 S. purpurea × S. suchowensisM2X
10X-400-067 S. purpurea × S. suchowensisF2X
10X-400-086 S. purpurea × S. suchowensisM2X
11X-317-232 S. purpureaM2X
11X-407-079 S. purpurea × S. viminalisF2X
12X-082-009 S. purpureaF2X
12X-415-002 S. purpurea × S. miyabeanaF3X
12X-421-094 S. viminalis × S. purpureaF2X
12X-423-058 S. viminalis × S. miyabeanaF3X
13X-425-060 S. miyabeanaF4X
13X-426-013 S. integra × S. purpureaF2X
13X-426-045 S. integra × S. purpureaF2X
13X-426-067 S. integra × S. purpureaF2X
13X-426-099 S. integra × S. purpureaF2X
13X-428-001 S. miyabeana × S. dasycladosNA5X
13X-429-066 S. koriyanagi × S. suchowensisNA2X
13X-430-011 S. miyabeana × S. viminalisF3X
13X-431-001 (S. koriyanagi × S. purpurea) × S. suchowensisNA2X
13X-438-060 S. purpurea × S. koriyanagiM2X
13X-438-074 S. purpurea × S. koriyanagiF2X
13X-440-004 S. suchowensis × S. purpureaM2X
13X-440-034 S. suchowensis × S. purpureaF2X
13X-440-047 S. suchowensis × S. purpureaM2X
13X-440-064 S. suchowensis × S. purpureaM2X
13X-440-068 S. suchowensis × S. purpureaF2X
13X-440-096 S. suchowensis × S. purpureaM2X
13X-443-026 S. suchowensis× S. purpureaM2X
13X-443-044 S. suchowensis× S. purpureaM2X
13X-443-052 S. suchowensis× S. purpureaF2X
13X-443-092 S. suchowensis× S. purpureaF2X
Table A2. Mixed-model ANOVA fixed-effects F-test statistics with significance levels and random effects variance components for treatment and genotype on biomass traits.
DFBDWSLRDMCMSLSSLMSDSSD
Fixed effects
Treatment11241.8 ***81.7 ***1548.5 ***1024.3 ***681.2 ***1161.9 ***616.1 ***
Genotype492.9 ***11.9 ***2.8 ***5 ***4.9 ***5.9 ***4.5 ***
Interaction492.3 ***3.5 ***1.9 **2.6 ***2.1 **2.1 ***1.9 **
Random effects,
Block 𝜎2 (%) 22.115.90.416.616.212.811.5
Error 𝜎2 (%) 77.984.199.683.483.887.288.5
** p < 0.01, *** p < 0.001 Biomass dry weight (BDW), dry matter content (DMC), stem:leaf ratio (SLR), mean stem length (MSL), sum of stem lengths (SSL), mean stem diameter (MSD), and sum of stem diameters (SSD).
Table A3. Mixed-model ANOVA fixed-effects F-test statistics with significance levels and random effects variance components for treatment and genotype on morphological characteristics.
DFLASLASNSAPSBSPADREC
Fixed effects
Treatment11257.1 ***849.7 ***17.4 ***899.8 ***915.5 ***2674 ***2904 ***
Genotype4928.6 ***4.8 ***5.9 ***5.5 ***4.3 ***10.8 ***2.2 ***
Interaction499.9 ***2.1 ***0.1 ns2.5 ***4.3 ***1.8 *1.8 ***
Random effects,
Block 𝜎2 (%) 1.90.82.13.90.28.914.6
Error 𝜎2 (%) 98.199.297.996.199.891.185.4
* p < 0.05, *** p < 0.001, ns not significant, Leaf area (LA), specific leaf area (SLA), stems number (SN), proportional sylleptic branching (PSB), SPAD, and root electrical capacitance (REC).
Table A4. Mixed-model ANOVA fixed-effects F-test statistics with significance levels and random effects variance components for treatment and genotype on nutritional value traits.
DFCPADFaNDFTDNNELNEMNEGRFVDENFCN (g)
Fixed effects
Treatment1516.6 ***0.1 ns3.7 ns0.4 ns1.8 ns0.8 ns0.9 ns1.7 ns27.5 ***224.6 ***117.9 ***
Genotype492.9 ***3.1 ***3.7 ***3.4 ***3.8 ***3.5 ***3.5 ***3.5 ***3.9 ***3.7 ***3.1 ***
Interaction
Random effects,
Block 𝜎2 (%) 40.918.323.224.322.223.722.323.221.824.622.3
Error 𝜎2 (%) 59.181.776.875.777.876.377.776.878.275.477.7
*** p < 0.001, ns not significant, Crude protein (CP), acid detergent fiber (ADF), neutral detergent fiber with α-amylase and sodium sulfite (aNDF), no fiber carbohydrates (NFC), relative feed value (RFV), total digestible nutrients (TDN), net energy for lactation (NEl), net energy for maintenance (NEm), net energy for gain (NEg), digestible energy (DE).
Figure A1. Ranking genotypes by (A) SPAD reading, (B) biomass dry weight (BDW), and (C) stem:leaf ratio (SLR).
Agronomy 12 02678 g0a1

References

  1. Alva, A.K.; Paramasivam, S.; Fares, A.; Delgado, J.A.; Mattos, D., Jr.; Sajwan, K. Nitrogen and irrigation management practices to improve nitrogen uptake efficiency and minimize leaching losses. J. Crop Improv. 2006, 15, 369–420. [Google Scholar] [CrossRef]
  2. Hodge, A.; Robinson, D.; Fitter, A. Are microorganisms more effective than plants at competing for nitrogen? Trends Plant Sci. 2000, 5, 304–308. [Google Scholar] [CrossRef]
  3. Robertson, G.P.; Vitousek, P.M. Nitrogen in agriculture: Balancing the cost of an essential resource. Annu. Rev. Environ. Resour. 2009, 34, 97–125. [Google Scholar] [CrossRef] [Green Version]
  4. Zhou, X.; Helmers, M.J.; Asbjornsen, H.; Kolka, R.; Tomer, M.D.; Cruse, R.M. Nutrient removal by prairie filter strips in agricultural landscapes. J. Soil Water Conserv. 2014, 69, 54–64. [Google Scholar] [CrossRef] [Green Version]
  5. Ssegane, H.; Negri, M.C.; Quinn, J.; Urgun-Demirtas, M. Multifunctional landscapes: Site characterization and field-scale design to incorporate biomass production into an agricultural system. Biomass Bioenergy 2015, 80, 179–190. [Google Scholar] [CrossRef] [Green Version]
  6. Ssegane, H.; Zumpf, C.; Cristina Negri, M.; Campbell, P.; Heavey, J.P.; Volk, T.A. The economics of growing shrub willow as a bioenergy buffer on agricultural fields: A case study in the Midwest Corn Belt. Biofuels Bioprod. Biorefining 2016, 10, 776–789. [Google Scholar] [CrossRef]
  7. Stettler, R.F. Cottonwood and the River of Time; University of Washington Press: Seattle, DC, USA, 2009. [Google Scholar]
  8. Rytter, R.; Hansson, A. Seasonal amount, growth and depth distribution of fine roots in an irrigated and fertilized Salix viminalis L. plantation. Biomass Bioenergy 1996, 11, 129–137. [Google Scholar] [CrossRef]
  9. Crow, P.; Houston, T. The influence of soil and coppice cycle on the rooting habit of short rotation poplar and willow coppice. Biomass Bioenergy 2004, 26, 497–505. [Google Scholar] [CrossRef]
  10. Tedeschi, L.O.; Muir, J.P.; Naumann, H.D.; Norris, A.B.; Ramírez-Restrepo, C.A.; Mertens-Talcott, S.U. Nutritional Aspects of Ecologically Relevant Phytochemicals in Ruminant Production. Front. Vet. Sci. 2021, 8, 155. [Google Scholar] [CrossRef]
  11. Villalba, J.J.; Provenza, F.D.; Gibson, N.; López-Ortíz, S. Veterinary medicine: The value of plant secondary compounds and diversity in balancing consumer and ecological health. In Sustainable Food Production Includes Human and Environmental Health; Springer: Dordrecht, The Netherlands, 2014; pp. 165–190. [Google Scholar] [CrossRef]
  12. Muklada, H.; Klein, J.D.; Glasser, T.A.; Dvash, L.; Azaizeh, H.; Halabi, N.; Davidovich-Rikanati, R.; Lewinsohn, E.; Landau, S.Y. Initial evaluation of willow (Salix acmophylla) irrigated with treated wastewater as a fodder crop for dairy goats. Small Rumin. Res. 2018, 163, 76–83. [Google Scholar] [CrossRef]
  13. Muklada, H.; Voet, H.; Deutch, T.; Zachut, M.; Kra, G.; Blum, S.E.; Krifuks, O.; Glasser, T.A.; Klein, J.D.; Davidovich-Rikanati, R.; et al. The effect of willow fodder feeding on immune cell populations in the blood and milk of late-lactating dairy goats. Animal 2020, 14, 2511–2522. [Google Scholar] [CrossRef] [PubMed]
  14. Kemp, P.D.; Barry, T.N.; Douglas, G.B. Edible forage yield and nutritive value of poplar and willow. NZGA Res. Pract. Ser. 2003, 10, 53–63. [Google Scholar] [CrossRef]
  15. Douglas, G.B.; Bulloch, B.T.; Foote, A.G. Cutting management of willows (Salix spp.) and leguminous shrubs for forage during summer. N. Z. J. Agric. Res. 1996, 39, 175–184. [Google Scholar] [CrossRef] [Green Version]
  16. Moore, K.M.; Barry, T.N.; Cameron, P.N.; Lopez-Villalobos, N.; Cameron, D.J. Willow (Salix spp.) as a supplement for grazing cattle under drought conditions. Anim. Feed Sci. Technol. 2003, 104, 1–11. [Google Scholar] [CrossRef]
  17. McWilliam, E.L.; Barry, T.N.; Lopez-Villalobos, N.; Cameron, P.N.; Kemp, P.D. Effects of willow (Salix) versus poplar (Populus) supplementation on the reproductive performance of ewes grazing low quality drought pasture during mating. Anim. Feed Sci. Technol. 2005, 119, 69–86. [Google Scholar] [CrossRef]
  18. Boeckler, G.A.; Gershenzon, J.; Unsicker, S.B. Phenolic glycosides of the Salicaceae and their role as anti-herbivore defenses. Phytochemistry 2011, 72, 1497–1509. [Google Scholar] [CrossRef]
  19. Orians, C.M.; Griffiths, M.E.; Roche, B.M.; Fritz, R.S. Phenolic glycosides and condensed tannins in Salix sericea, S. eriocephala and their F1 hybrids: Not all hybrids are created equal. Biochem. Syst. Ecol. 2000, 28, 619–632. [Google Scholar] [CrossRef]
  20. Ramírez-Restrepo, C.A.; Barry, T.N.; Marriner, A.; López-Villalobos, N.; McWilliam, E.L.; Lassey, K.R.; Clark, H. Effects of grazing willow fodder blocks upon methane production and blood composition in young sheep. Anim. Feed Sci. Technol. 2010, 155, 33–43. [Google Scholar] [CrossRef]
  21. McCabe, S.M.; Barry, T.N. Nutritive value of willow (Salix spp.) for sheep, goats and deer. J. Agric. Sci. 1988, 111, 1–9. [Google Scholar] [CrossRef]
  22. Carlson, C.H.; Smart, L.B. Electrical capacitance as a predictor of root dry weight in shrub willow (Salix; Salicaceae) parents and progeny. Appl. Plant Sci. 2016, 4, 1600031. [Google Scholar] [CrossRef]
  23. SAS Institute Inc. The SAS System for Windows; SAS Institute Inc.: Cary, NC, USA, 2013. [Google Scholar]
  24. Fabio, E.S.; Smart, L.B. Effects of nitrogen fertilization in shrub willow short rotation coppice production—A quantitative review. GCB Bioenergy 2013, 10, 548–564. [Google Scholar] [CrossRef]
  25. Serapiglia, M.J.; Gouker, F.E.; Smart, L.B. Early selection of novel triploid hybrids of shrub willow with improved biomass yield relative to diploids. BMC Plant Biol. 2014, 14, 74. [Google Scholar] [CrossRef] [PubMed] [Green Version]
  26. Mamashita, T.; Larocque, G.R.; DesRochers, A.; Beaulieu, J.; Thomas, B.R.; Mosseler, A.; Major, J.; Sidders, D. Short-term growth and morphological responses to nitrogen availability and plant density in hybrid poplars and willows. Biomass Bioenergy 2015, 81, 88–97. [Google Scholar] [CrossRef]
  27. Weih, M.; Nordh, N.E. Characterising willows for biomass and phytoremediation: Growth, nitrogen and water use of 14 willow clones under different irrigation and fertilisation regimes. Biomass Bioenergy 2002, 23, 397–413. [Google Scholar] [CrossRef]
  28. Bonosi, L.; Ghelardini, L.; Weih, M. Growth responses of 15 Salix genotypes to temporary water stress are different from the responses to permanent water shortage. Trees 2010, 24, 843–854. [Google Scholar] [CrossRef]
  29. Fabio, E.S.; Leary, C.J.; Smart, L.B. Tolerance of novel inter-specific shrub willow hybrids to water stress. Trees 2019, 33, 1015–1026. [Google Scholar] [CrossRef]
  30. Weih, M.; Rönnberg-Wästjung, A.C. Shoot biomass growth is related to the vertical leaf nitrogen gradient in Salix canopies. Tree Physiol. 2007, 27, 1551–1559. [Google Scholar] [CrossRef]
  31. Kemp, P.D.; Mackay, A.D.; Matheson, L.A.; Timmins, M.E. The forage value of poplars and willows. Proc. N. Z. Grassl. Assoc. 2001, 63, 115–119. [Google Scholar] [CrossRef]
  32. Hoffman, P.; Shaver, R. A Quick Guide to Understanding Forage Test Results. Available online: https://fyi.extension.wisc.edu/forage/a-quick-guide-to-understanding-forage-test-results/ (accessed on 3 August 2022).
  33. Ramírez-Restrepo, C.A.; Barry, T.N. Alternative temperate forages containing secondary compounds for improving sustainable productivity in grazing ruminants. Anim. Feed Sci. Technol. 2005, 120, 179–201. [Google Scholar] [CrossRef]
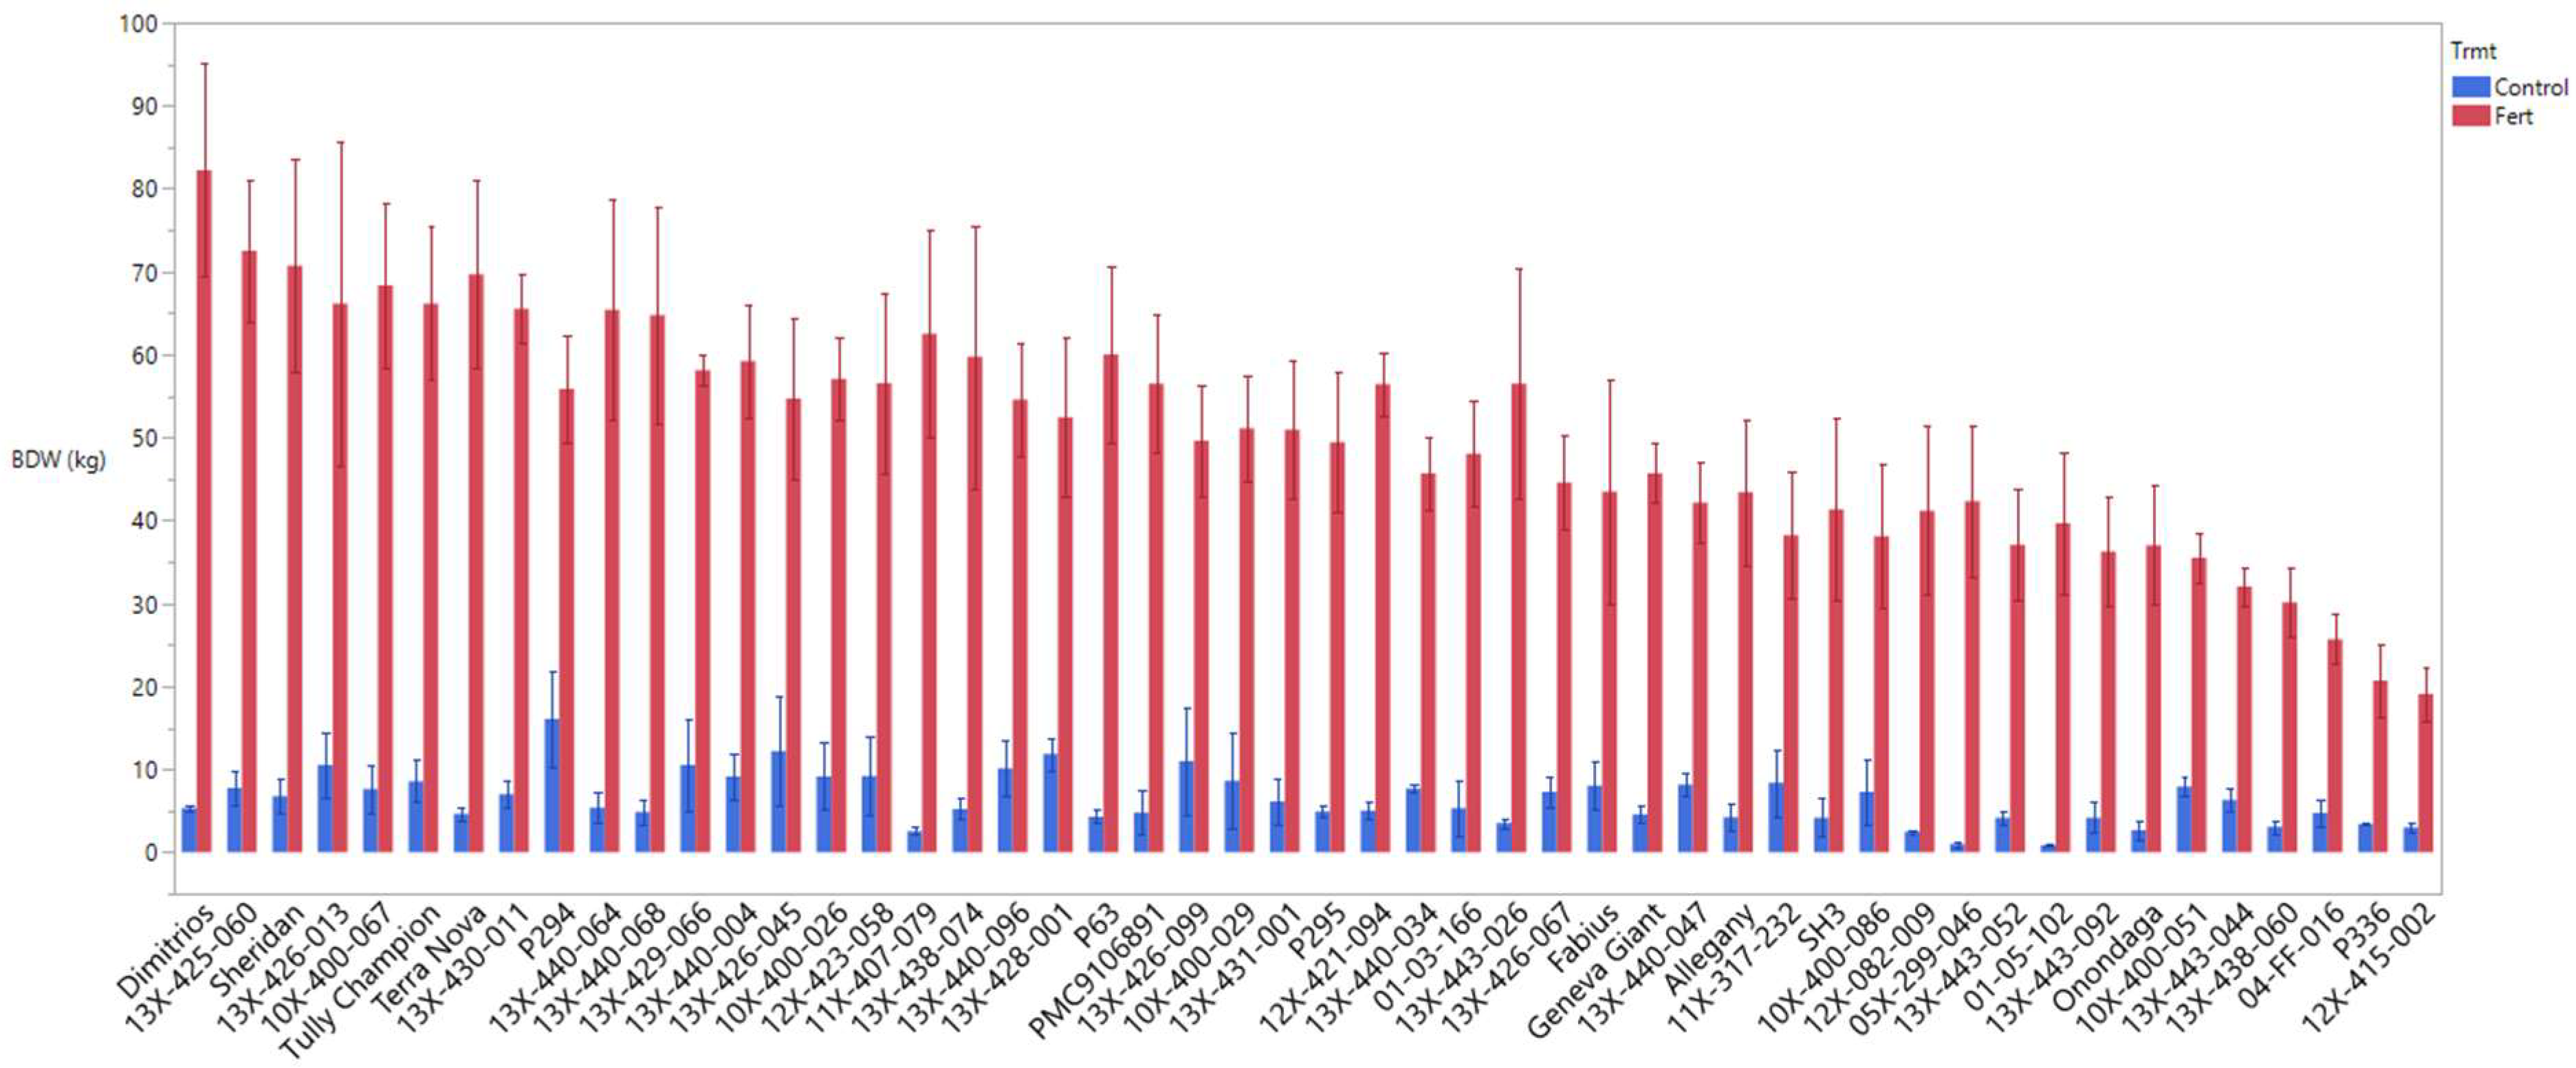
Figure 1. Mean values (± standard error) of total aboveground biomass dry weight (BDW) of shrub willow genotypes in greenhouse trial for fertilized treatment (red) and water control (blue).
Agronomy 12 02678 g001
Figure 2. Mean values (±standard error) of four SPAD measurements of shrub willow genotypes in a greenhouse trial for fertilized treatment (red) and water control (blue).
Agronomy 12 02678 g002
Figure 3. Mean values (±standard error) of SPAD readings over time for fertilized treatment (Fert) and water control.
Agronomy 12 02678 g003
Figure 4. Correlation analysis for control group (below diagonal) and fertilizer group (above diagonal) among biomass productivity traits, morphological characteristics, and nutritional value. Significant correlations were set at a confidence level of 0.95, and blank cells represent no significant correlations. See Table 2 for abbreviations.
Agronomy 12 02678 g004
Figure 5. Analysis of biomass-increase among genotypes in aboveground yield response to excess fertilization.
Agronomy 12 02678 g005
Figure 6. Performance of N uptake with relative feed value (RFV) under high N fertilizer. Quadrant (Q)I, high performance, low quality, QII high performance and quality, QIII, low performance and quality, QIV, low performance, high quality.
Agronomy 12 02678 g006
Figure 7. Mean values (± standard error) of nitrogen uptake (g) of shrub willow genotypes in the fertilizer treatment group shaded according to their ploidy; diploid_2X (blue), triploid_3X (red), tetraploid_4X (green), and pentaploid_5X (purple).
Agronomy 12 02678 g007
Table 1. List of biomass-related variables including their descriptions and units.
Trait AbbreviationDescriptionUnitsMeasured [Weeks]No. of Observations
Biomass productivity
SPADSPADSPAD units6, 8, 10, 121600
BDWAboveground biomass dry weightg plant−112400
SSLSum stem lengthcm12931
MSLMean stem lengthcm12931
PSBProportional sylleptic branch12931
SAStem angledegree12931
SNStem number-12400
MSDMean stem diametermm12931
SSDSum stem diametermm12931
LALeaf areacm2121200
SLASpecific leaf areacm2 g−1121200
SLRStem: leaf ratiog g−112400
DMCDry matter contentg g−112400
Belowground
RECRoot electrical capacitancenF12400
Table 2. Mean values (±standard error) of various traits under two experimental treatments. Biomass traits: biomass dry weight (BDW), dry matter content (DMC), stem:leaf ratio (SLR), mean stem length (MSL), sum of stem lengths (SSL), mean stem diameter (MSD), and sum of stem diameters (SSD); morphological traits: leaf area (LA), specific leaf area (SLA), stems number (SN), proportional sylleptic branching (PSB), SPAD, and root electrical capacitance (REC); nutritional value traits: crude protein (CP), acid detergent fiber (ADF), neutral detergent fiber with α-amylase and sodium sulfite (aNDF), no fiber carbohydrates (NFC), relative feed value (RFV), total digestible nutrients (TDN), net energy for lactation (NEl), net energy for maintenance (NEm), net energy for gain (NEg), digestible energy (DE).
TraitControlFertilizer
Biomass productivityMean + SE
n = 200
Mean + SE
n = 200
BDW6.43 ± 0.41***51.15 ± 1.57
DMC0.39 ± 0.01***0.26 ± 0.001
SLR1.06 ± 0.02***0.92 ± 0.02
SML52.57 ± 1.91***121.39 ± 2.2
SSL110.59 ± 4.51***285.05 ± 7.56
MSD3.99 ± 0.08***7.68 ± 0.13
SSD8.4 ± 0.22***17.97 ± 0.44
Morphological characteristicsn = 200 n = 200
LA6.3 ± 0.29***20.64 ± 0.91
SLA118.55 ± 1.79***180.09 ± 1.99
SN2.18 ± 0.06***2.49 ± 0.07
SA3.69 ± 0.68***34.46 ± 1.18
PSB0.01 ± 0.01***0.31 ± 0.01
SPAD 5/2020.67 ± 0.47***51.31 ± 0.38
SPAD27.82 ± 0.38***44.45 ± 0.32
REC8.68 ± 0.23***56.29 ± 1.66
Nutritional valuen = 10 n = 150
CP4.54 ± 0.18***19.46 ± 0.19
ADF40.33 ± 1.12 38.75 ± 0.36
NDF47.01 ± 1.11 47.07 ± 0.39
TDN60.4 ± 0.4 60.9 ± 0.12
NEL0.61 ± 0.01 0.61 ± 0.002
NEM0.57 ± 0.01 0.58 ± 0.002
NEG0.32 ± 0.01 0.32 ± 0.002
RFV114.4 ± 4.31 117.75 ± 1.44
DE 1.12 ± 0.01***1.07 ± 0.005
NFC38.43 ± 1.16***23.47 ± 0.34
N17.84 ± 1.35***161.39 ± 4.85
*** p < 0.001 Biomass traits: biomass dry weight (BDW), dry matter content (DMC), stem:leaf ratio (SLR), mean stem length (MSL), sum of stem lengths (SSL), mean stem diameter (MSD), and sum of stem diameters (SSD); morphological traits: leaf area (LA), specific leaf area (SLA), stems number (SN), proportional sylleptic branching (PSB), SPAD, and root electrical capacitance (REC); nutritional value traits: crude protein (CP), acid detergent fiber (ADF), neutral detergent fiber with α-amylase and sodium sulfite (aNDF), no fiber carbohydrates (NFC), relative feed value (RFV), total digestible nutrients (TDN), net energy for lactation (NEl), net energy for maintenance (NEm), net energy for gain (NEg), digestible energy (DE).
Table 3. Repeated measures quadratic polynomial analysis of variance results for SPAD measurement.
EffectDFF Valuep Value
Clone4911.79<0.0001
Trmt15153.15<0.0001
Time15.810.0201
Time × Trmt13561.32<0.0001
Time × Clone492.88<0.0001
Clone × Trmt492.33<0.0001
Time × Time124.08<0.0001
Time × Time × Trmt1663.25<0.0001
Time × Time × Clone491.510.0223
Time × Time × Clone × Trmt492.61<0.0001
Publisher’s Note: MDPI stays neutral with regard to jurisdictional claims in published maps and institutional affiliations.