Article

Metabolome and Transcriptome Analysis Reveal the Accumulation Mechanism of Carotenoids and the Causes of Color Differences in Persimmon (Diospyros kaki Thunb.) Fruits

Research Institute of Non-Timber Forestry, Chinese Academy of Forestry, Zhengzhou 450003, China
*
Authors to whom correspondence should be addressed.
Agronomy 2022, 12(11), 2688; https://doi.org/10.3390/agronomy12112688
Submission received: 9 September 2022 / Revised: 20 October 2022 / Accepted: 26 October 2022 / Published: 29 October 2022
(This article belongs to the Special Issue Omics Approaches and Applications in Fruit Crops Improvement)

Abstract

:
To explore the mechanisms of the color formation of different colored persimmon fruits, we used two different colored persimmon cultivars (yellow-peeled persimmon fruit ‘Zhongshi No.6’ and red-peeled persimmon fruit ‘Hongdenglong’) as materials to study the synthesis and accumulation of carotenoids in three stages (full green, color transition, and full yellow or red) using targeted metabolomic and transcriptomic methods. A total of 14 carotenoids and 30 carotenoid lipids were identified in the peel of the two persimmon cultivars. After analysis, it was found that the total carotenoid content of the red persimmon cultivar was higher than that of the yellow persimmon cultivar. The contents of lycopene, α-carotenoid, β-carotenoid, (E/Z)-phytoene, and β-cryptoxanthin are the main reasons for the difference in total carotenoid content between the two persimmon cultivars, especially lycopene. Twelve structural genes involved in the metabolism of carotenoids were also found in this study. In comprehensive metabolome and transcriptome analysis, we found that, between the two persimmon cultivars, lycopene was the key metabolite responsible for the color difference, and PSY, LCYE, and ZDS were the key genes that regulated the differences in lycopene accumulation. The results of this study provide us with new information regarding persimmon fruit synthesis and accumulation. In addition, they also provide a theoretical foundation for improving persimmon fruit germplasm.

1. Introduction

Persimmon belongs to the Diospyros genus, an important cultivated fruit crop that is considered native to China and is extensively grown in tropical, subtropical, and temperate climate regions around the globe, particularly in China, Korea, Japan, Southeast Asia, Oceania, etc. [1,2]. There are hundreds of persimmon cultivars, most of which are yellow or red when they reach commercial maturity. With pharmacological and edible value, persimmon fruit is well known for its economic and nutritional benefits [3]. Its relatively high content of health-promoting bioactive constituents (dietary fibers, total and major phenolics, main minerals, and trace elements) makes persimmon preferable for a healthy diet [4]. As a well-known “woody grain” and “iron crop” tree species, it is considered one of the important cash trees in China and other developing countries, and it serves as a powerful driving force for poverty alleviation in deprived mountainous and underdeveloped rural economies due to its strong resistance and high yield. Therefore, the persimmon industry has great potential for development.
Now, with the improvement in living standards, people have begun to pursue fruit quality. As the core of evaluating the quality of fresh food and the appearance quality of fruit, color is an important agronomic characteristic formed by the long-term evolution of plants. It is also one of the key elements influencing producers’ and customers’ decisions [5]. The fruit’s degree of coloring affects its economic value and serves as a key signal of the fruit’s maturity [6,7]. Fruit products with vivid colors will be more valuable and competitive on the market. Thus, breeders have long focused on enhancing fruit color. The type and relative content of pigments in the peel are the material basis for the formation of fruit color. The color pigments in the peel are primarily composed of chlorophylls, carotenoids, flavonoids, and betalains [8]. Early scholars have proven that the color formation of persimmon fruit is chiefly due to the degradation of chlorophylls and the accumulation of carotenoids [9,10].
Carotenoids, a type of natural pigments, are tetraterpenes (C40) made up of eight isoprenoid units and containing hydrocarbons (carotenes) and their oxygenated derivatives (xanthophylls) [11]. Carotenoids have a large number of conjugated double bonds in their structure, allowing them to absorb visible light at 400–500 nm, giving fruits and flowers their eye-catching colors of yellow, orange, and red [12]. At the same time, carotenoids also have an important effect on the photosynthesis of plants (as an auxiliary pigment, it participates in the collection and transfer of plant light energy, protects photosynthetic organs, and prevents photo-oxidative damage) [11,13]. In addition to improving the nutritional content of fruits and vegetables, carotenoids also serve as a precursor for the production of some vitamin A and plant hormones (ABA [14] and strigolactone [15]). Moreover, carotenoids are essential to the human diet, possess potent antioxidant qualities, and help prevent and cure several chronic illnesses, including cancer, cardiovascular disease, and age-related eye problems [14]. Therefore, carotenoids, as important secondary metabolites, have become the focus of research in the latest biological and horticultural industries and are also a hotspot of fruit quality. The primary carotenoid metabolic route was first suggested in 1950 [16] and has steadily improved with the growth of relevant studies. Carotenoids are created from the 5-carbon compound isopentenyl diphosphate, similar to other isoprenoids (IPPs) [17]. Then, using IPPs as the precursor, various carotenoids, including lycopene and alpha, beta, gamma, and delta carotenoids, are produced through the catalytic action of enzymes such as isoprene pyrophosphate isomerase (IPI), geranylgeranyl diphosphate synthase (GGPS), phytoene synthase (PSY), and phytoene desaturase (PDS) [12].
Studies have shown that different types and contents of carotenoids can lead to fruit color differences. Ma used HPLC technology to discover that the yellow color of “Tainong No.1” mango pulp is caused by the contents of β-carotene and α-carotene [18]. Zhou found that the primary metabolites responsible for the distinction between apricots with yellow and white flesh are β-carotene and (E/Z)-phytoene [19]. In citrus cultivars with different pulp colors, β, ε-carotenoid and β, β-carotenoid are the main carotenoids in yellow pulp [20]. At the same time, related papers have demonstrated that the color formation of red pulp papaya fruit is mostly due to the accumulation of lycopene and β-carotenoid [21], while in red-skinned citrus C30, apocarotenoids are responsible for the red coloration of citrus peel [22].
In this study, two cultivars of persimmon fruit, red-skinned persimmon fruit ‘Hongdenglong’ and yellow-skinned persimmon fruit ‘Zhongshi No.6’, were used as research materials. Additionally, we carried out corresponding research on the color difference between persimmon fruit and carotenoid metabolism via phenotypic, metabolome, and transcriptome comprehensive analyses. The results identified carotenoid-related differential metabolites by targeted metabolomics and differential genes related to carotenoid biosynthesis by transcriptomics. In conclusion, our findings reveal the underlying mechanism of the formation of color differences in persimmon fruits and offer a theoretical foundation for the development of new persimmon cultivar germplasms.

2. Materials and Methods

2.1. Plant Material and Sampling

Two persimmon fruit (Diospyros kaki L.) cultivars, yellow-skinned persimmon fruit ‘Zhongshi No.6’ and red-skinned persimmon fruit ‘Hongdenglong’, were planted in the Mengzhou long-term experimental station (N 34°51′30.37″, E 112°42′54″) of the Research Institute of Non-timber Forestry, Chinese Academy of Forestry, and were used in this study (same field and under standard conditions: the garden has a continental monsoon climate with an average annual temperature of 12.4 degrees Celsius, 620.2 mm of precipitation, 209 days of frost-free time, and 2493 h of sunlight per year. The garden’s elevation is 108.5 m above sea level, the soil is sandy loam, the tree age is 8 years, the cultivation row spacing is 5 m by 3 m, and the soil fertilization and water management are moderate). The skin of the persimmon fruit changed from completely green to completely yellow or red during the process of ripening. Three stages were used to separate the fruit development and ripening processes (A, B, and C). In the full green, color transition, and full yellow or red periods, groups A, B, and C were collected. Groups A, B, and C of ‘Zhongshi No.6’ were collected at 80 days after anthesis (DAA, full green), 100 DAA (color transition), and 130 DAA (mature stage, full yellow), while groups A, B, and C of ‘Hongdenglong’ were collected at 100 DAA (full green), 130 DAA (color transition), and 160 DAA (full red), respectively. The sampling time (8:00~9:00 am) in each stage was consistent. Each repeat comprised at least 5 healthy medium-sized fruits collected from 3 persimmon trees of the same age. Then, after cleaning the surface with ultra-clean water, all of the persimmon fruit samples were separated into flesh and peel. All the peel was collected, chopped, and mixed for further experiments. All samples were immediately frozen in liquid nitrogen and stored until use at a temperature of −80 °C. For the LC-MS/MS and RNA-Seq analyses at each time point, three biological replicates were used. In this study, the fruit peel samples of ‘Zhongshi No.6’ and ‘Hongdenglong’ at different stages were named ZS6PA, ZS6PB, ZS6PC, HDLPA, HDLPB, and HDLPC, respectively.

2.2. Physiological Indexes

The 10 tested fruits were weighed using an electronic balance (accuracy 0.01 g), and the average value was taken as the single fruit weight. Fruit firmness was measured by a GY-3 hardness tester (probe size: 3.5 mm; indentation depth 10 mm). Each fruit was measured at three positions on the equator of the fruit, and 10 fruits were measured in total. Then, the mean value was calculated as the firmness of the fruit. The peel color was measured using a color analyzer (CR-410, Konica Minolta, Japan) based on the international commission on an illumination color solid scale (CIE L*, a*, b*) mode for a minimum of 10 persimmon fruits. The data were described as L* (Lightness), a* (redness), and b* (yellowness). The Hue angle (h* = arctan(b*/a*)) is a quantity generated from the two letters a* and b*. The components a* and b* were combined to form a color’s chroma (C*): C* = √(a*2 + b*2). The average for each value was 10 fruits. The equation CI = 1000a*/(L*b*) was used to determine the color index (CI) [23].

2.3. Quantification and Extraction of Carotenoids

The peel tissue was crushed into powder after being freeze-dried and vacuumed in a drier (MM 400, Retsch; conditions: 30 Hz, 1.5 min). First, 50 milligrams of the powder were weighed. Next, the internal standard was placed in the proper quantity. Finally, the powder was extracted with 0.5 mL of a combination solution of n-hexane, acetone, and ethanol (1:1:1, v/v/v), which included 0.1% (v/v) butylated hydroxytoluene (BHT). The extract was vortexed at room temperature for 20 min. After centrifuging at 12,000 rpm for 5 min at 4 °C, the supernatants were collected, and the extraction process was conducted twice. Afterward, it was dried by evaporation before being reconstituted in a 1:1 v/v mixture of methanol (MeOH) and methyl tert-butyl ether (MTBE) mixtures. For further liquid chromatography-tandem mass spectrometry (LC-MS/MS) analysis, the solution was filtered via a 0.22 μm filter. A UPLC-APCI-MS/MS system (UHPLC, ExionLCTMAD; MS, Applied Biosystems 6500 Triple Quadrupole) was then used to analyze the sample extracts. The MS conditions included 350 °C temperature, 25 psi air curtain pressure (CRU), and atmospheric pressure chemical ionization (APCI). Each ion pair was scanned inside the Q-trap 6500+ in accordance with an optimal depolymerization potential (DP) and collision energy (CE). HPLC analysis was conducted using a YMC C30 (3 m, 2 mm, 100 mm) column. Samples were eluted using a gradient from solvent A, which included methanol:acetonitrile (1:3, v/v) adding 0.01% BHT and 0.1% formic acid, to solvent B, which contained 0.01% BHT, and the analysis was carried out at 28 °C with an injection volume of 2 μL and a flow rate of 0.8 mL/min [24]. Based on the AB Sciex QTRAP6500 LC-MS/MS platform, carotenoids were determined by Metware Biotechnology Co., Ltd. (Wuhan, China).

2.4. RNA Extraction, Illumine Sequencing, and RNA-Seq Analysis

The persimmon fruit peel was fully ground in liquid nitrogen. Following the manufacturer’s instructions, total RNA was extracted using the RNA prep FinePure Plant RNA Kit (polysaccharides and polyphenolics-rich, TIANGEN, Beijing, China). The mRNA library of each sample was constructed using the NEBNext® UltraTM RNA Library Prep Kit for Illumina® (NEB, Harvard, MA, USA), and the samples were then sequenced using the Illumina NovaSeq 6000 platform. Clean reads were acquired for further analysis after the raw data was processed by Fastp, and the Q20, Q30, and GC content distributions were computed. Next, using Hisat2 v2.0.5, clean reads were aligned to the reference genome (Diospyros oleifera Cheng; PRJNA532832). Fragments per kilobase of exon per million fragments mapped (FPKM) was used to quantify the gene/transcript level. Based on the original count data, differentially expressed genes (DEGs) between samples were analyzed using DESeq2 software, and the filter condition was |log2 Fold Change| >= 1, and false discovery rate (FDR) < 0.05. To identify significantly enriched metabolic pathways and GO keywords, DEGs were subjected to gene ontology (GO) and the Kyoto Encyclopedia of Genes and Genomes (KEGG). GO enrichment analysis was performed using the goseq R software package (http://www.r-project.org/ (accessed on 1 August 2022)), and KEGG pathway analysis was performed by KEGG Orthology software (http://kobas.cbi.pku.edu.cn/ (accessed on 15 August 2022)). The WGCNA analysis was carried out on the R platform using the WGCNA package (version 1.6.6).

2.5. Experimental Validation of Candidate Genes

Using real-time quantitative PCR (RT-qPCR), which comprised 9 differentially expressed structural genes, candidate gene expression analyses were performed on three separate biological replicates. Approximately 100 mg of sample were taken from each material and ground with liquid nitrogen, and an RNAprep Pure Plant Kit was used to extract the RNA (TIANGEN, Beijing, China). Then, 1 μg of each RNA extracted above was accurately pipetted to perform reverse transcription experiments with the Prime Script RT reagent kit (TaKaRa, Dalian, China) to obtain cDNA for subsequent real-time quantitative PCR experiments. Reactions were performed on a Roche LightCycler 96 qRT-PCR detection system (Roche, CA, USA). The RT-qPCR expression analysis of associated genes was performed in the following sequence: 3 min at 94 degrees Celsius for denaturation, followed by 94 degrees Celsius for 10 s, 58 degrees Celsius for 20 s, and then 40 cycles at 72 degrees Celsius for 20 s. Additionally, the 2−ΔΔCT method was employed to analyze quantitative data. The GAPDH (glyceraldehyde-3-phosphate dehydrogenase) gene [25] was used as the internal control to indicate that the amount of template in the PCR had been normalized. Table S1 displays the primers and GAPDH gene.

2.6. Statistical Analysis

The data were processed using Excel 2019 (Microsoft, Washington, DC, USA), GraphPad Prism 9.0 (GraphPad Software, San Diego, CA, USA), and SPSS 23.0 (IBM, New York, NY, USA) and represented as the means ± SD. After one-way ANOVA, Tukey’s test for statistically significant differences was run at p < 0.01 and p < 0.05. On the Metware cloud platform (Matware, Wuhan, China), statistics for metabolome data and transcriptome sequencing as well as various tables and figures, were created.

3. Results

3.1. Physiological Changes Indicators during Development and Maturation

The two cultivars of persimmon ranged in color from stage A to stage C, which corresponded to the green fruit stage, the color transition stage, and the full yellow or red stage, respectively (Figure 1 and Figure S1). With the growth and maturation of the fruit, the single fruit weight of the two cultivars steadily increased (Figure 1a). At stage C, ‘Zhongshi No. 6’ had a significantly higher single fruit weight than ‘Hongdenglong’ (p < 0.01). The fruit firmness of the two cultivars showed a gradual downward trend with fruit development, but the firmness of ‘Hongdenglong’ in the three periods was greater than that of ‘Zhongshi No. 6’ (p < 0.01) (Figure 1b). Additionally, we estimated the color indicators (L*, a*, b*, h, and C) and assessed the fruit’s color index value. The redness value (a*) of the two persimmon cultivars was negative in stages A and B but positive in stage C. Additionally, the redness value of ‘Hongdenglong’ in stages B and C was significantly higher than that of ‘Zhongshi No. 6’ (p < 0.01) (Figure 1c). The yellowness values (b*) of ‘Zhongshi No. 6’ were all significantly higher than those of ‘Hongdenglong’ during fruit development (Figure 1d). In order to describe the color change of the fruit more vividly, we introduced the color index formula. The color index (CI) is a common evaluation standard for evaluating the red and yellow color of the fruit, which can accurately express the difference between the colors. In the first two growth stages, both cultivars had negative CI values, but by stage three, both had positive CI values. The CI value of ‘Zhongshi No. 6’ was significantly higher than that of ‘Hongdenglong’ in phase A, but in phase C, the CI value of ‘Hongdenglong’ was significantly higher than that of ‘Zhongshi No. 6’ (Figure 1e).

3.2. Carotenoids in Fruit Peel Change during Development and Ripening

In this study, the carotenoid contents of two persimmon cultivars at three stages were detected, and 30 carotenoid lipids and 14 carotenoids altogether were discovered. The 14 carotenoids are α-carotene, β-carotene, ε-carotene, lycopene, γ-carotene, (E/Z)-phytoene, capsaicin, zeaxanthin, violaxanthin, neoxanthin, lutein, β-cryptoxanthin, α-cryptoxanthin, and antheraxanthin. During fruit development, different carotenoid contents in the peel showed different trends (Figure 2). The total carotenoid content of ‘Hongdenglong’ was greater in stages A to C than that of ‘Zhongshi No. 6’, particularly in stage C. ‘Hongdenlong’ had 2.6 times the total carotene content of ‘Zhongshi No. 6’ at the C stage (Figure 2o). The two cultivars’ pericarps’ violaxanthin, neoxanthin, and lutein contents exhibited a decreasing trend from A to C (Figure 2i–k). Additionally, the carotenoids change charts show that the key contributors to the difference in total carotenoids content between the two cultivars are α-carotenoid, β-carotenoid, lycopene, (E/Z)-phytoene, and β-cryptoxanthin (Figure 2a,b,d,f,l). We further analyzed the proportion of these carotenoids in the total carotenoids, and the results showed that the carotenoid accumulation in yellow persimmon fruits was mainly composed of α-carotene (11.7%), β-carotene (7.6%), zeaxanthin (7.2%), β-cryptoxanthin (5.2%), and lutein (4.1%), while the red persimmon fruit was mainly composed of lycopene (18.6%), α-carotene (10.8%), β-carotene (6.7%), zeaxanthin (4.2%), and β-cryptoxanthin (2.6%). The content of lycopene in the peel of the red persimmon fruit ‘Hongdenglong’ was relatively high, especially in the C period, and its lycopene content accounted for 18.6% of its total carotenoid content. However, the content of lycopene in ‘Zhongshi No. 6’ was relatively low, accounting for only 2% of its total carotenoid content in period C (Figure 2d). Therefore, we speculate that lycopene is the major cause of the color difference between the two persimmon cultivars. Additionally, during the course of the three phases, 30 carotenoid lipids were found in the peels of the two persimmon cultivars (Table S2). These lipids included lutein myristate, lutein dimyristate, violaxanthin dibutyrate, violaxanthin myristate, violaxanthin dimyristate, zeaxanthin dimyristate, lutein dilaurate, lutein dioleate, violaxanthin palmitate, violaxanthin-myristate-laurate, and zeaxanthin-laurate-palmitate and were found in two cultivars at each of the three phases, whereas the others were only discovered in B stage or C stage.

3.3. RNA Sequencing and Sample Transcriptome Mapping

3.3.1. Sequencing Data Quality Assessment

To further explore the molecular regulatory mechanism of color difference between the two cultivars of persimmons, RNA sequencing in two cultivars of persimmon peel at three stages was performed. Each sample had three replicates with independent library construction and sequencing (Table S3). A total of 4.42–6.79 million raw data were obtained in this study, and 4.13–6.57 million clean data were obtained after filtering. Each sample had clean reads that totaled more than 6.19 GB, the percentages of Q20 and Q30 bases were over 97.4% and 92.92%, respectively, and the average GC content was 44.43%. The Diospyros oleifera Cheng genome database [26] was used as a reference genome, onto which 80.76–82.33% of the clean reads were mapped (Table S4). The uniquely mapped reads comprised 75.31–77.76% of the total mapped reads. Overall, these results suggested that the sample RNA sequencing was accurate and suitable for use in further research.

3.3.2. Analyzing the Differential Expression of Genes

Individuals have biological differences in how their genes are expressed, and the degree of these differences varies from gene to gene. Thus, we conducted a study of the correlation between samples using the Pearson correlation coefficient (r). The results showed that the correlation index (r2) between each sample was near 1, which indicates that our results were credible in this study (Figure 3a). We also performed clustering heat map analysis of all DEGs (Figure 3b).
To investigate the causes behind the two persimmon cultivars’ different colors, DESeq R software was used to assess the fragment per kilobase of exon per million fragments mapped (FPKM) values for each gene in two cultivars of persimmon at various developmental phases (based on false discovery rate ≤ 0.01, and fold change ≥ 2). A total of 2045 (downregulated 1555, upregulated 490), 3422 (downregulated 1674, upregulated 1748), 4798 (downregulated 2012, upregulated 2786), and 5936 (downregulated 3828, upregulated 2108) DEGs were discovered in pairwise comparisons of ZS6PA and ZS6PB, ZS6PB and ZS6PC, HDLPA and HDLPB, as well as HDLPB and HDLPC, respectively (Figure 4a). Venn diagram analysis was used to identify 701 DEGs in yellow peel persimmon ‘Zhongshi No.6’ at various phases of development (Figure 4b) and 2434 DEGs by comparing ‘Hongdenglong’ red peel persimmon at different development stages (Figure 4b). These results suggest that these genes play an important role in the formation of fruit color in the two cultivars. We also analyzed three pairwise comparisons at the same stage of two cultivars (ZS6PA vs. HDLPA, ZS6PB vs. HDLPB, ZS6PC vs. HDLPC) and drew the Venn diagram between these comparison groups, a total of 1397 share DEGs were obtained (Figure 4a,c). The findings indicate that these genes may be responsible for the color differences between the two cultivars.
Then, based on the results of the Venn diagram analysis, we conducted GO enrichment analysis on these DEGs that were shared. The shared DEGs during the development of ‘Zhongshi No. 6’ (ZS6PA vs. ZS6PB and ZS6PB vs. ZS6PC) were mainly enriched in 30 biological process categories (BPs), 8 cellular component categories (CCs), and 12 molecular function categories (MFs) (Figure S2a). For ‘Hongdenglong’, these DEGs were primarily enriched in 31BPs, 9CCs, and 12MFs (Figure S2b). These DEGs were three pairwise comparisons at the same stage of two cultivars (ZS6PA vs. HDLPA, ZS6PB vs. HDLPB, and ZS6PC vs. HDLPC) mainly enriched in 28BPs, 11CCs, and 11MFs (Figure S2c).
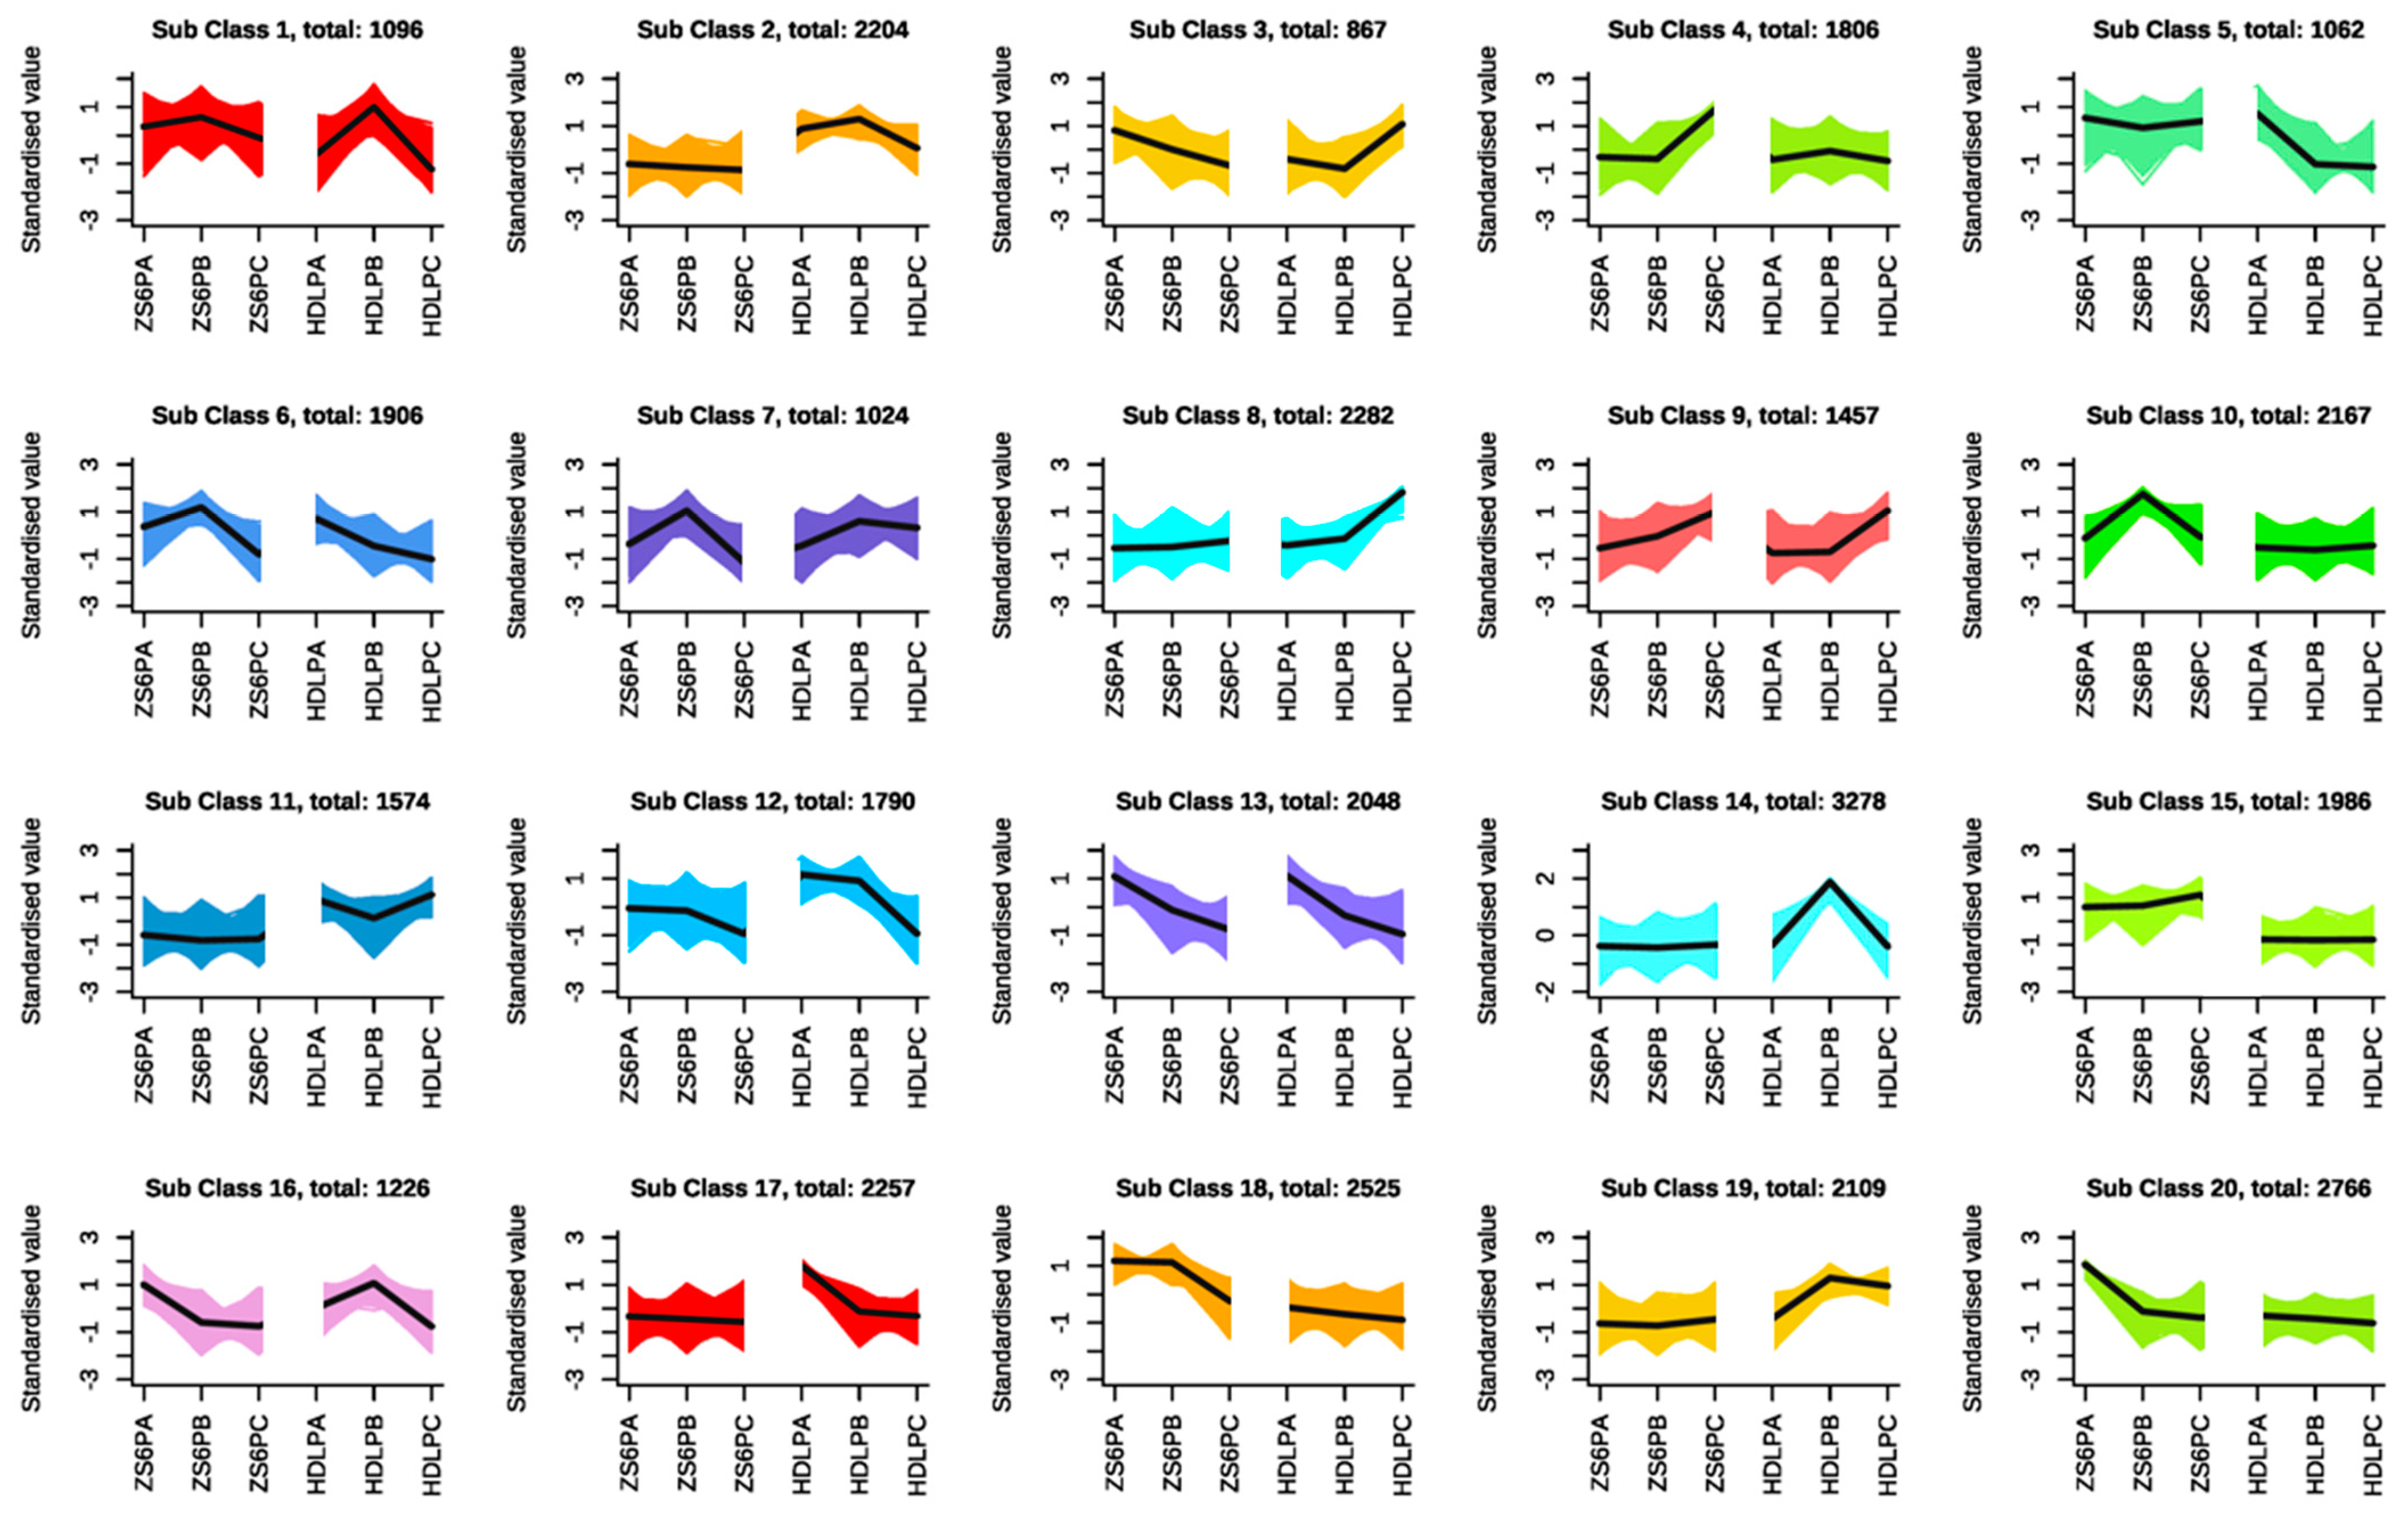
To further investigate the different expression patterns between ‘Zhongshi No. 6’ and ‘Hongdenglong’ during fruit development, gene FPKM values were first centralized and standardized, followed by K-means clustering analysis. All the genes were classified into several distinct clusters, which shows that there are a lot of differences in how genes are expressed in different samples. The genes showed similar expression trends, suggesting that they may have similar functions. In this study, we performed K-means analysis on 6 groups of data and then obtained 20 sub-classes or types, as shown in Figure 5. We found that the expression trends of the two cultivars were quite different in the gene clusters of Sub Class 3, 4, 5, 8, 11, 15, and 19, which indicated that these genes played a vital role in the formation of persimmon fruit color. Additionally, the significant difference in the gene expression trend at stage C is likely to be the vital stage in the formation of persimmon fruit color phenotype differences. These genes with different expression patterns will help in subsequent gene candidate research.
A global categorization system for gene function is called gene ontology (GO). To clarify the biological function of the gene clusters of Sub Class 3, 4, 5, 8, 11, 15, and 19, GO enrichment analysis was performed using the Blast2GO tool (Figure S3). These genes were assigned to 50 functional groupings (36 biological process categories (BPs), 8 cellular component categories (CCs), and 6 molecular function categories (MFs). The multicellular organism development, regulation of nitrogen compound metabolic process, and developmental process involved in reproduction were the most abundant terms in the BP categories. The most typical terms in the CC categories are organelle envelope, plasmodesma, and vesicle. The terms ATPase activity, coupled with transmembrane movement of substances, are used most commonly in the MF categories.
Different gene products in organisms perform biological functions by way of interactions, and differentially expressed genes can be analyzed for pathway annotation to learn more about the roles of the genes. Thus, all DEGs were assigned to KEGG pathways to further investigate the biological processes of different genes. As shown in Figure S4, the carotenoid biosynthesis (ko00906) pathway was significantly enriched in the five comparison groups.

3.3.3. WGCNA Module Analysis

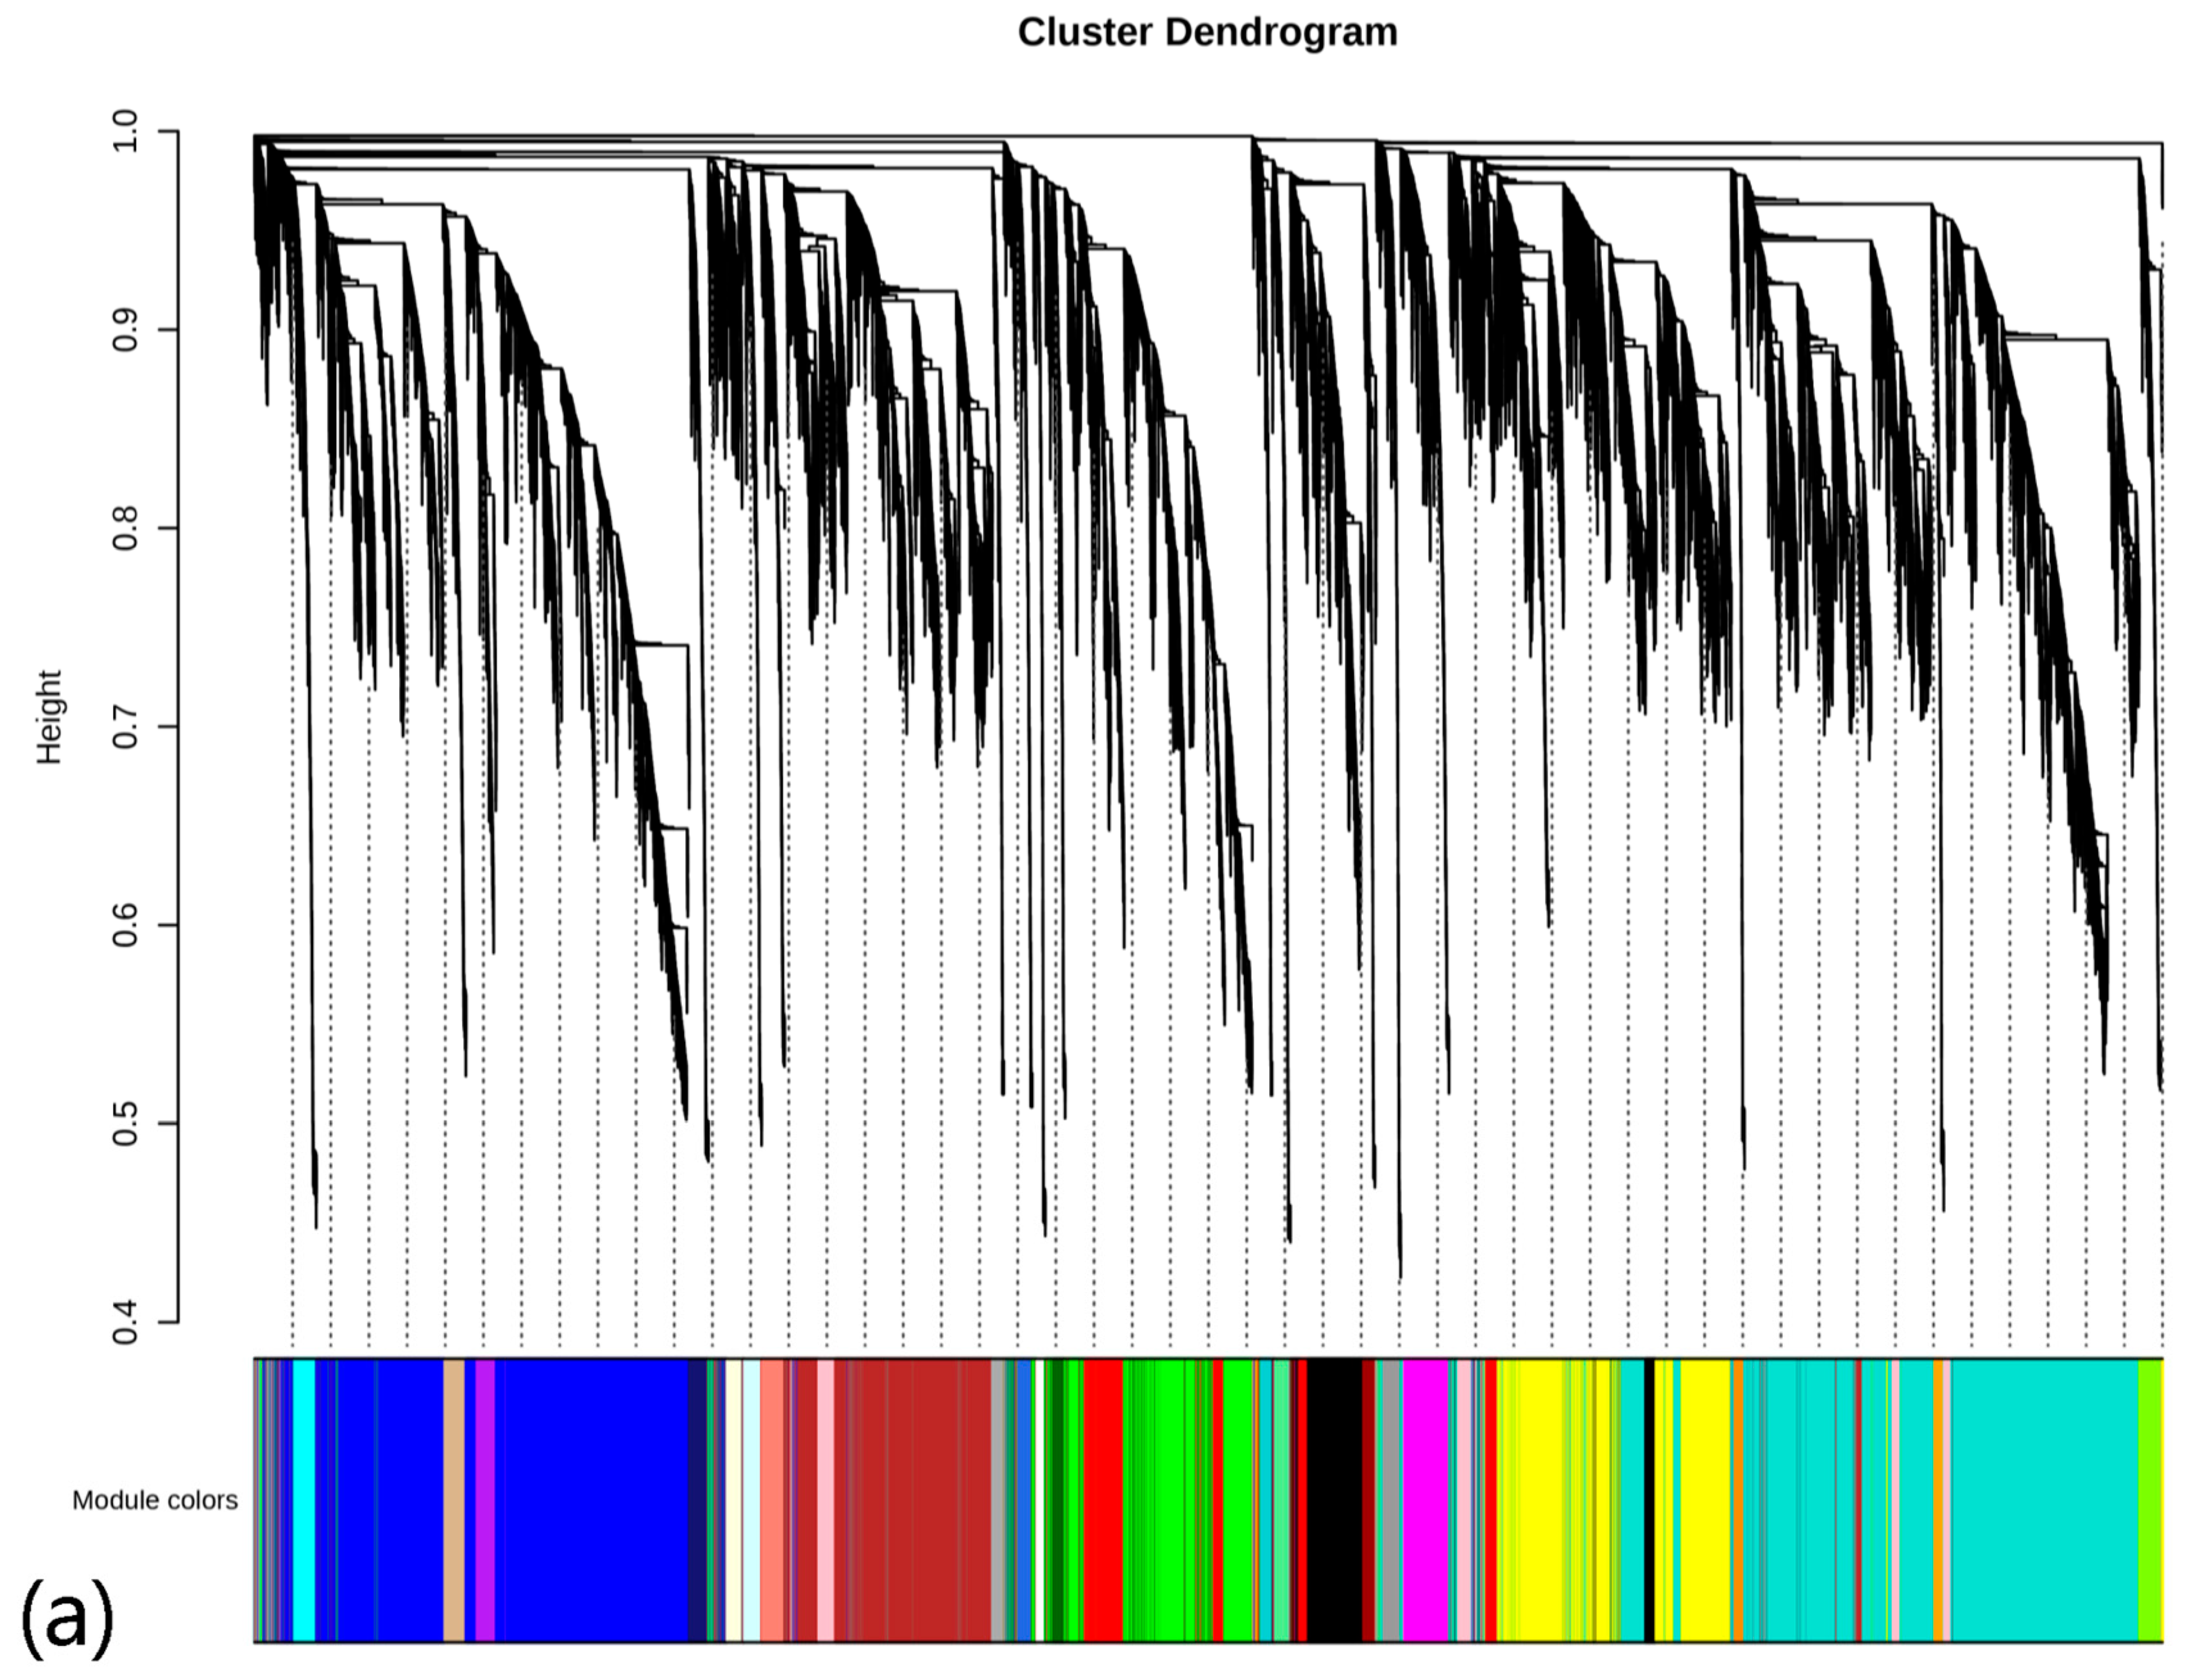
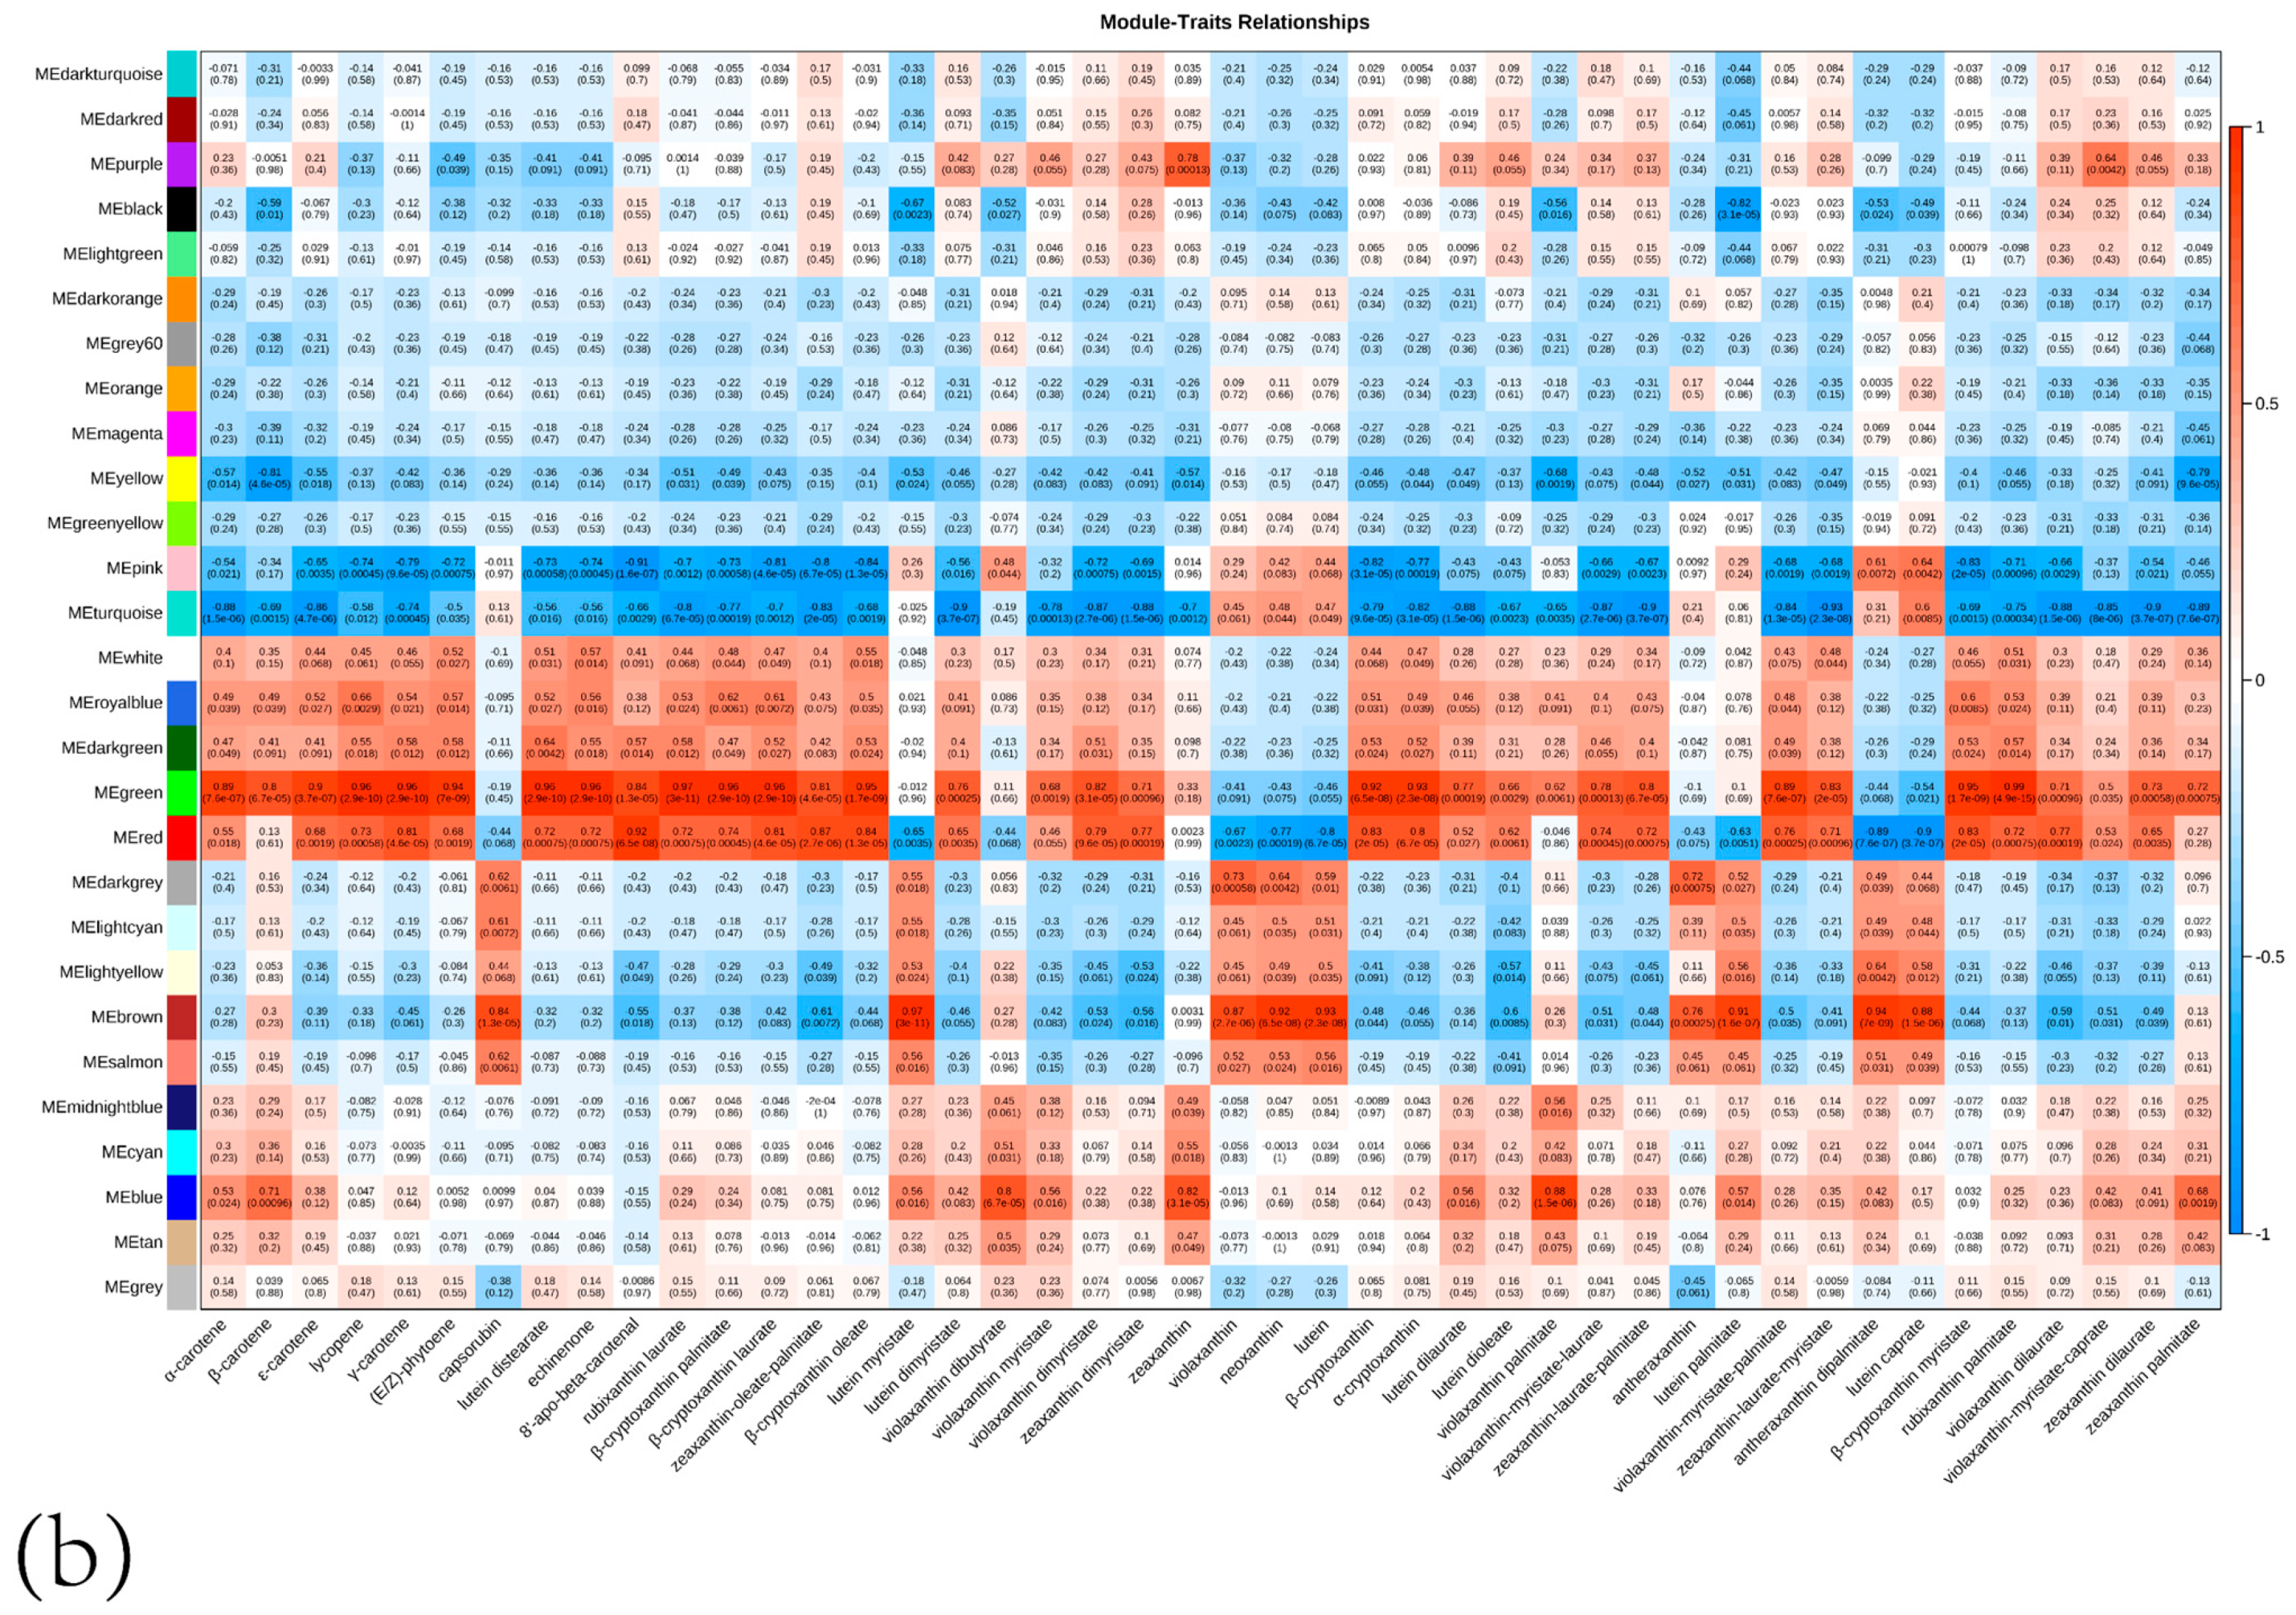
Based on gene FPKM values, the WGCNA method was used to analyze co-expressed gene modules and investigate the relationships between the genes in these modules and metabolites. We set the threshold of the square of the correlation coefficient to 0.8 to determine the optimal soft threshold β for further analysis (Figure S5). WGCNA examined 36,778 genes in all, based on their expression patterns, which were divided into 28 different modules (Figure 6). Each line in Figure 6a represents a gene, while the clustering-generated branches indicate several modules. The analysis of the association between the gene matrices of various modules and the findings of carotenoid detection was displayed in a digital format at the intersection of modules and carotenes (Figure 6b). The “green” module exhibited a substantial positive connection with lycopene (r2 = 0.96), γ-carotene (r2 = 0.96), (E/Z)-phytoene (r2 = 0.94), echinenone (r2 = 0.96), α-cryptoxanthin (r2 = 0.93), β-cryptoxanthin (r2 = 0.92), ε-carotene (r2 = 0.9), α-carotene (r2 = 0.89), and β-carotene (r2 = 0.8). Zeaxanthin and 8’-apo-beta-carotenal both had a strong favorable correlation with the “red” module (r2 = 0.99 and 0.92, respectively). Neoxanthin (r2 = 0.92), violaxanthin (r2 = 0.87), capsorubin (r2 = 0.84), lutein (r2 = 0.93), zeaxanthin (r2 = 0.82), and antheraxanthin (r2 = 0.76) all had positive correlations with the “brown” module.
Based on WGCNA data analysis, we conducted green, red, and brown modules for the modules significantly correlated with carotenoid accumulation and further performed correlation heat maps and KEGG analysis (Figure S6). Although all three modules were significantly associated with carotenoid synthesis, the heatmap results indicated that gene expression trends were different in the three modules. The three heatmaps of the “green modules” revealed that the gene expression levels in the C period of ‘Hongdenglong’ were much greater than those in the three other periods of ‘Zhongshi No. 6’ and the other periods of ‘Hongdenglong’. At the same time, the KEGG pathways of the red module and the brown module were not enriched in the carotenoid synthesis pathway, while the green module was significantly enriched in pathways related to carotenoid synthesis and metabolism. We will further analyze these results.

3.3.4. Metabolic Pathway Analysis of Carotenoids

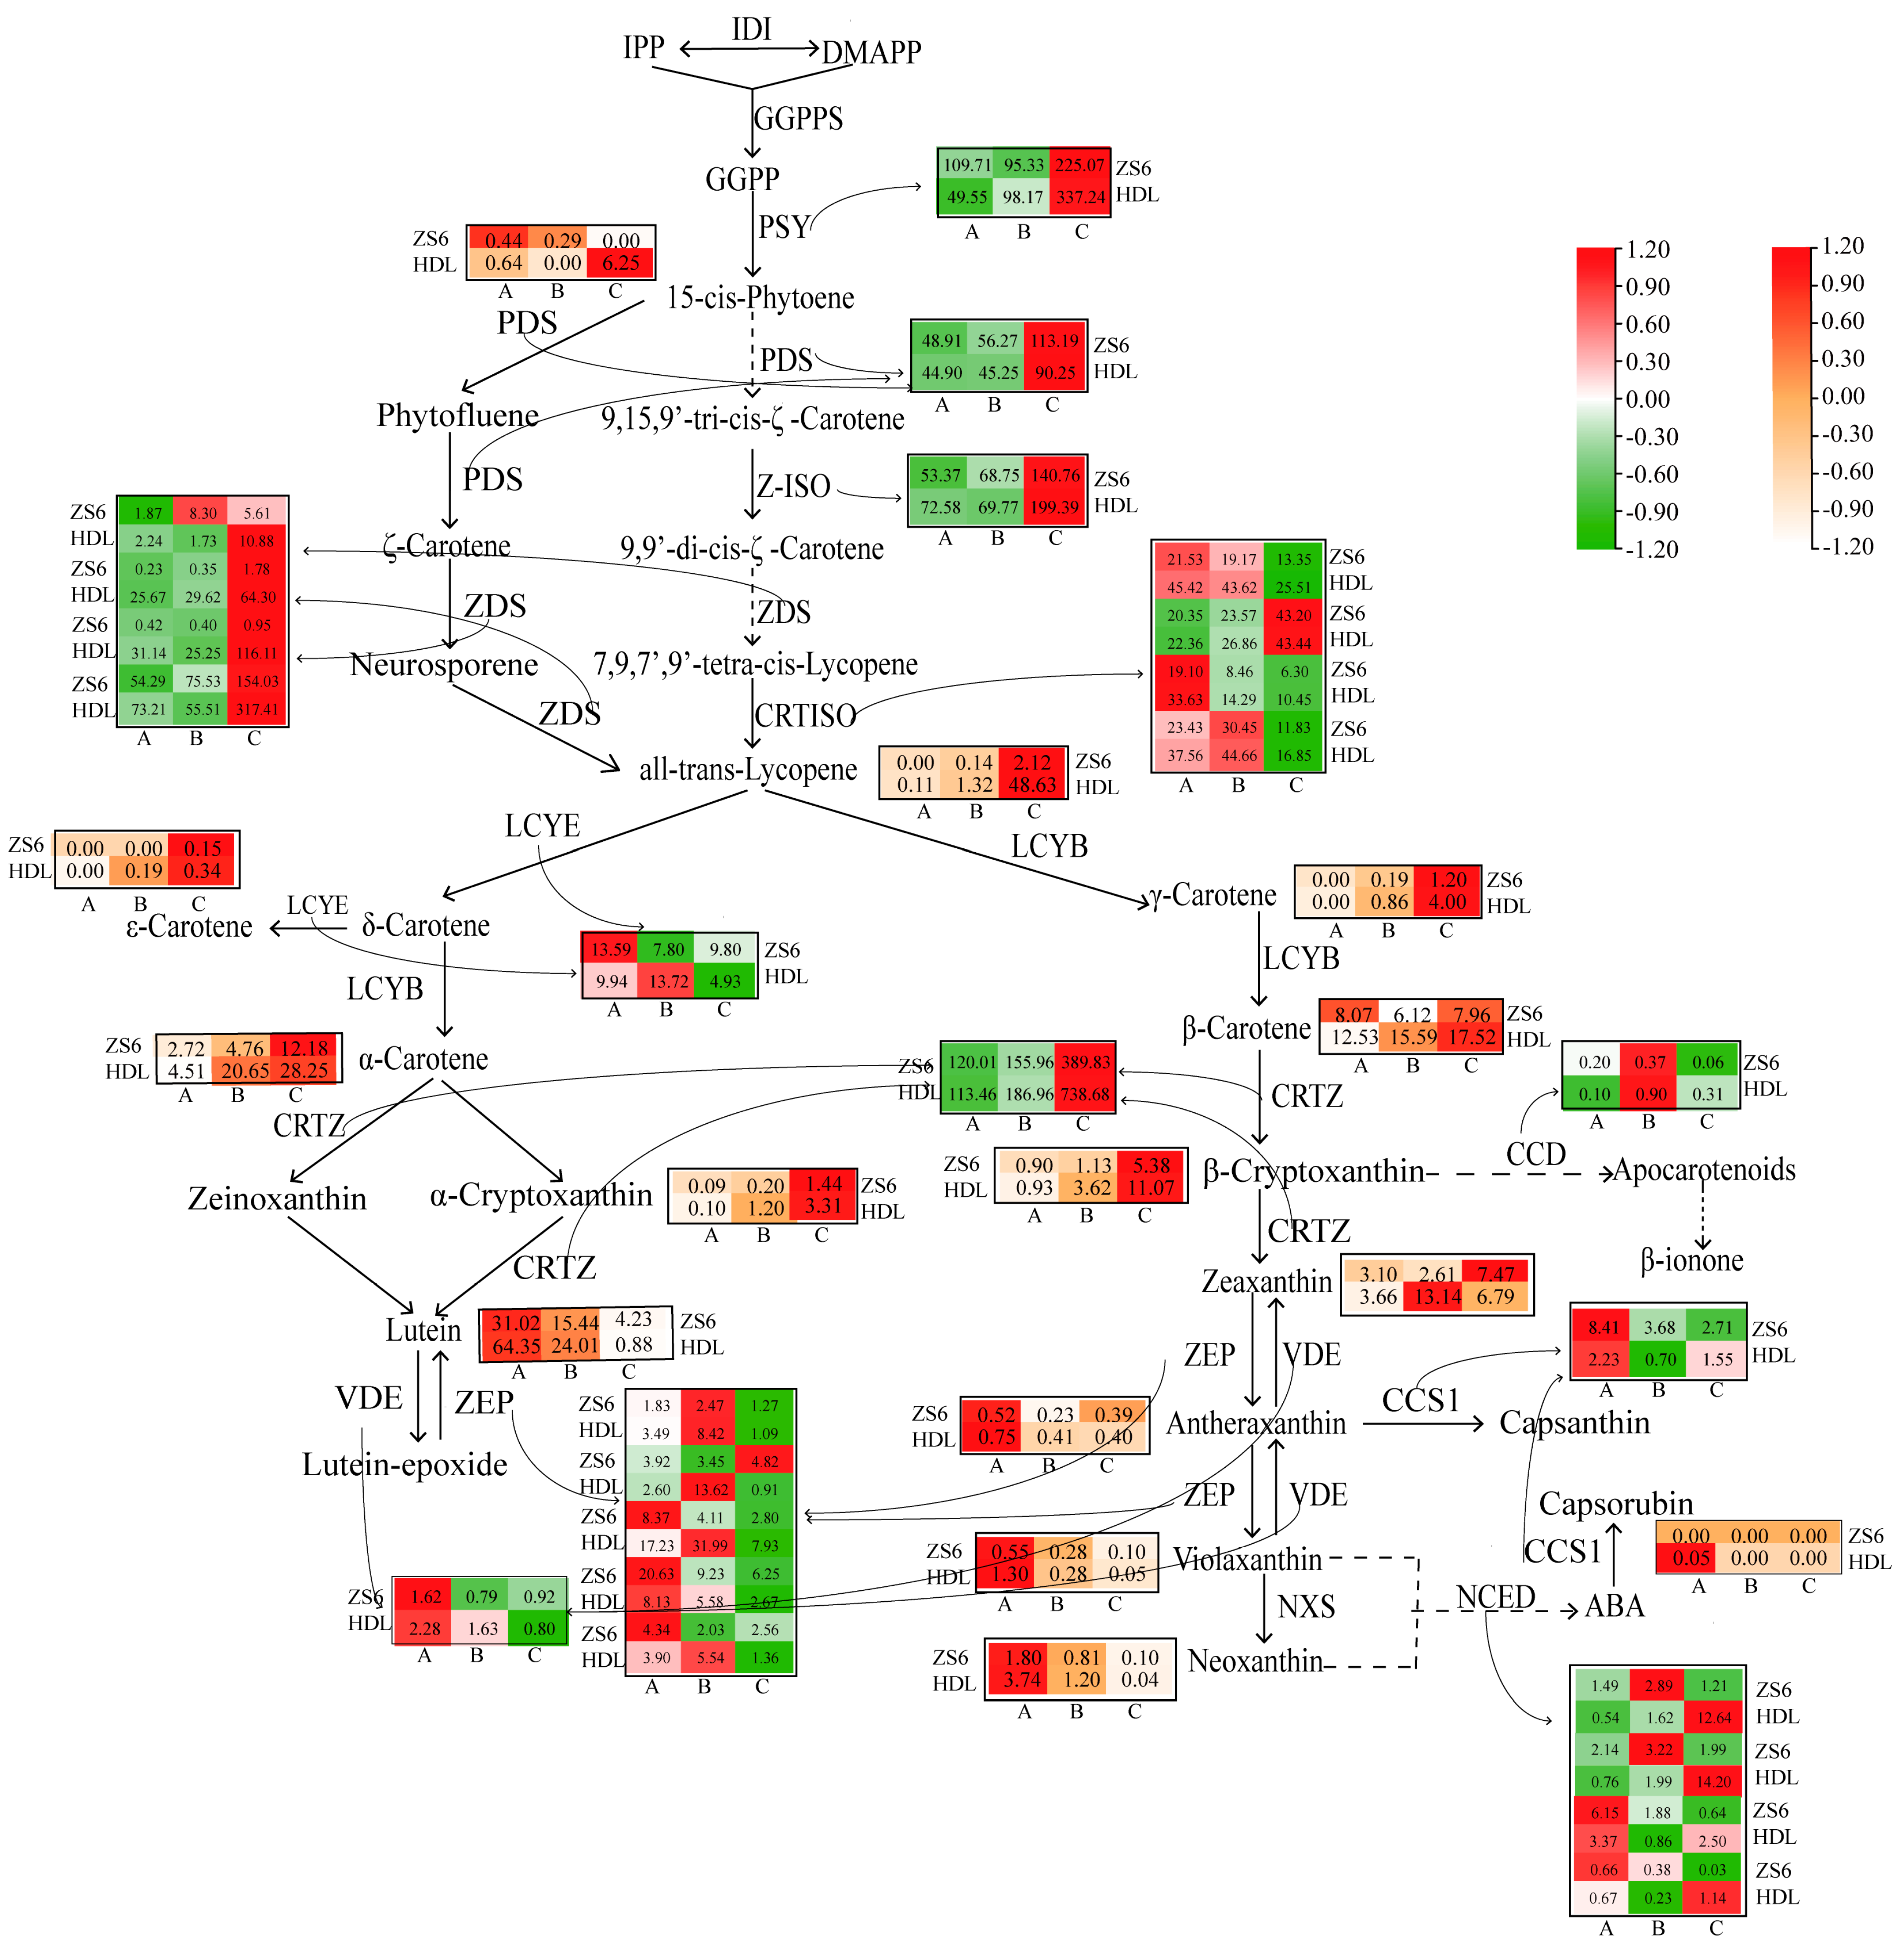
To better understand the relationship between metabolites and genes in carotenoid biosynthesis, we combined the findings of all carotenoid-related metabolites and carotenoid genes to construct a network of their metabolic regulation, aiming to more intuitively show the connection between gene expression and metabolite accumulation (Figure 7). We analyzed the genes related to differentially accumulated carotenoid synthesis in the peel of persimmon fruit at different ripening stages; 35 candidate genes encoding 12 carotenoid metabolism-related enzymes were identified (Table S5). Carotenoid synthesis-related genes include PSY (phytoene synthase), PDS (phytoene desaturase), Z-ISO (ζ-carotene isomerase), ZDS (ζ-carotene desaturase), CRTISO (carotenoid isomerase), LYCE (Lycopene ε-cyclase), CRTZ (beta-carotene 3-hydroxylase), ZEP (zeaxanthin epoxidase), VDE (violaxanthin dehydration) cyclooxygenase), NCED (carotenoid cleaving dioxygenase), CCS1 (capsanthin/capsorubin synthase), and CCD (carotenoid epoxidase). These genes had various patterns of expression.
The PSY gene is the first carotenoid biosynthesis gene isolated from plants. Its function is to catalyze the head-to-head joining of two GGPP molecules to generate symmetrical C40 phytoene, which is the first key reaction in the carotenoid biosynthesis pathway. The PSY gene of ‘Zhongshi No. 6’ was found to be highly expressed in stage A, while the expression level was higher in stages B and C of ‘Hongdenglong’, which could be the primary factor for the higher accumulation of total carotenoids in ‘Hongdenglong’ compared to ‘Zhongshi No.6’. The genes of PDS, ZDS, Z-ISO, and CRTSO are related to lycopene synthesis, whereas the LCYE gene is related to the breakdown of lycopene. The accumulation of lycopene was affected by differential patterns of gene expression in the two cultivars. Among these, the largest difference was in the ZDS gene. In the whole developmental stage, ZDS gene expression in the ‘Hongdenglong’ was significantly higher than that in the ‘Zhongshi No. 6’. For LCYE downstream of lycopene, the expression trend is more complicated. The expression level of ‘Zhongshi No. 6’ was higher than that of ‘Hongdenglong’ in stages A and C, which indicates that the decomposition of lycopene in the C stage of ‘Hongdenglong’ has less decomposition. Concurrently, the difference in lycopene content between the two cultivars also supports this conclusion. In summary, during the fruit’s maturation and development, the expression of genes associated with lycopene synthesis in ‘Hongdenglong’ was high, and the expression of genes related to decomposition was low, causing lycopene to accumulate in ‘Hongdenglong’, thus showing a red fruit phenotype.
For the yellow fruit ‘Zhongshi No. 6’, the accumulation of carotenoids mainly consisted of α-carotene, Lutein, β-carotene, β-cryptoxanthin, and zeatin. The accumulation of α-carotene was formed by lycopene as a substrate and catalyzed by the LCYE gene. From the B to C stage, LCYE gene expression gradually increased, and α-carotene accumulation gradually increased in ‘Zhongshi No. 6’. As the fruit ripened, the gene expression of CRTZ steadily increased, causing an accumulation of β-carotene, β-cryptoxanthin, and zeaxanthin, which gave ‘Zhongshi No. 6’ its yellow color. In this study, the genes NCED, CCS1, and CCD were also identified. During fruit ripening, NCED gene expression gradually increased, and the expression trend of ‘Hongdenglong’ was significantly stronger than that of ‘Zhongshi No. 6’. For the CCS1 gene, the expression trend of ‘Zhongshi No. 6’ gradually decreased, and the expression trend of ‘Hongdenglong’ showed a downward trend and then increased. In terms of CCD, both cultivars showed a trend of first increasing (A to B) and then decreasing (B to C).

3.3.5. qRT-PCR Analysis

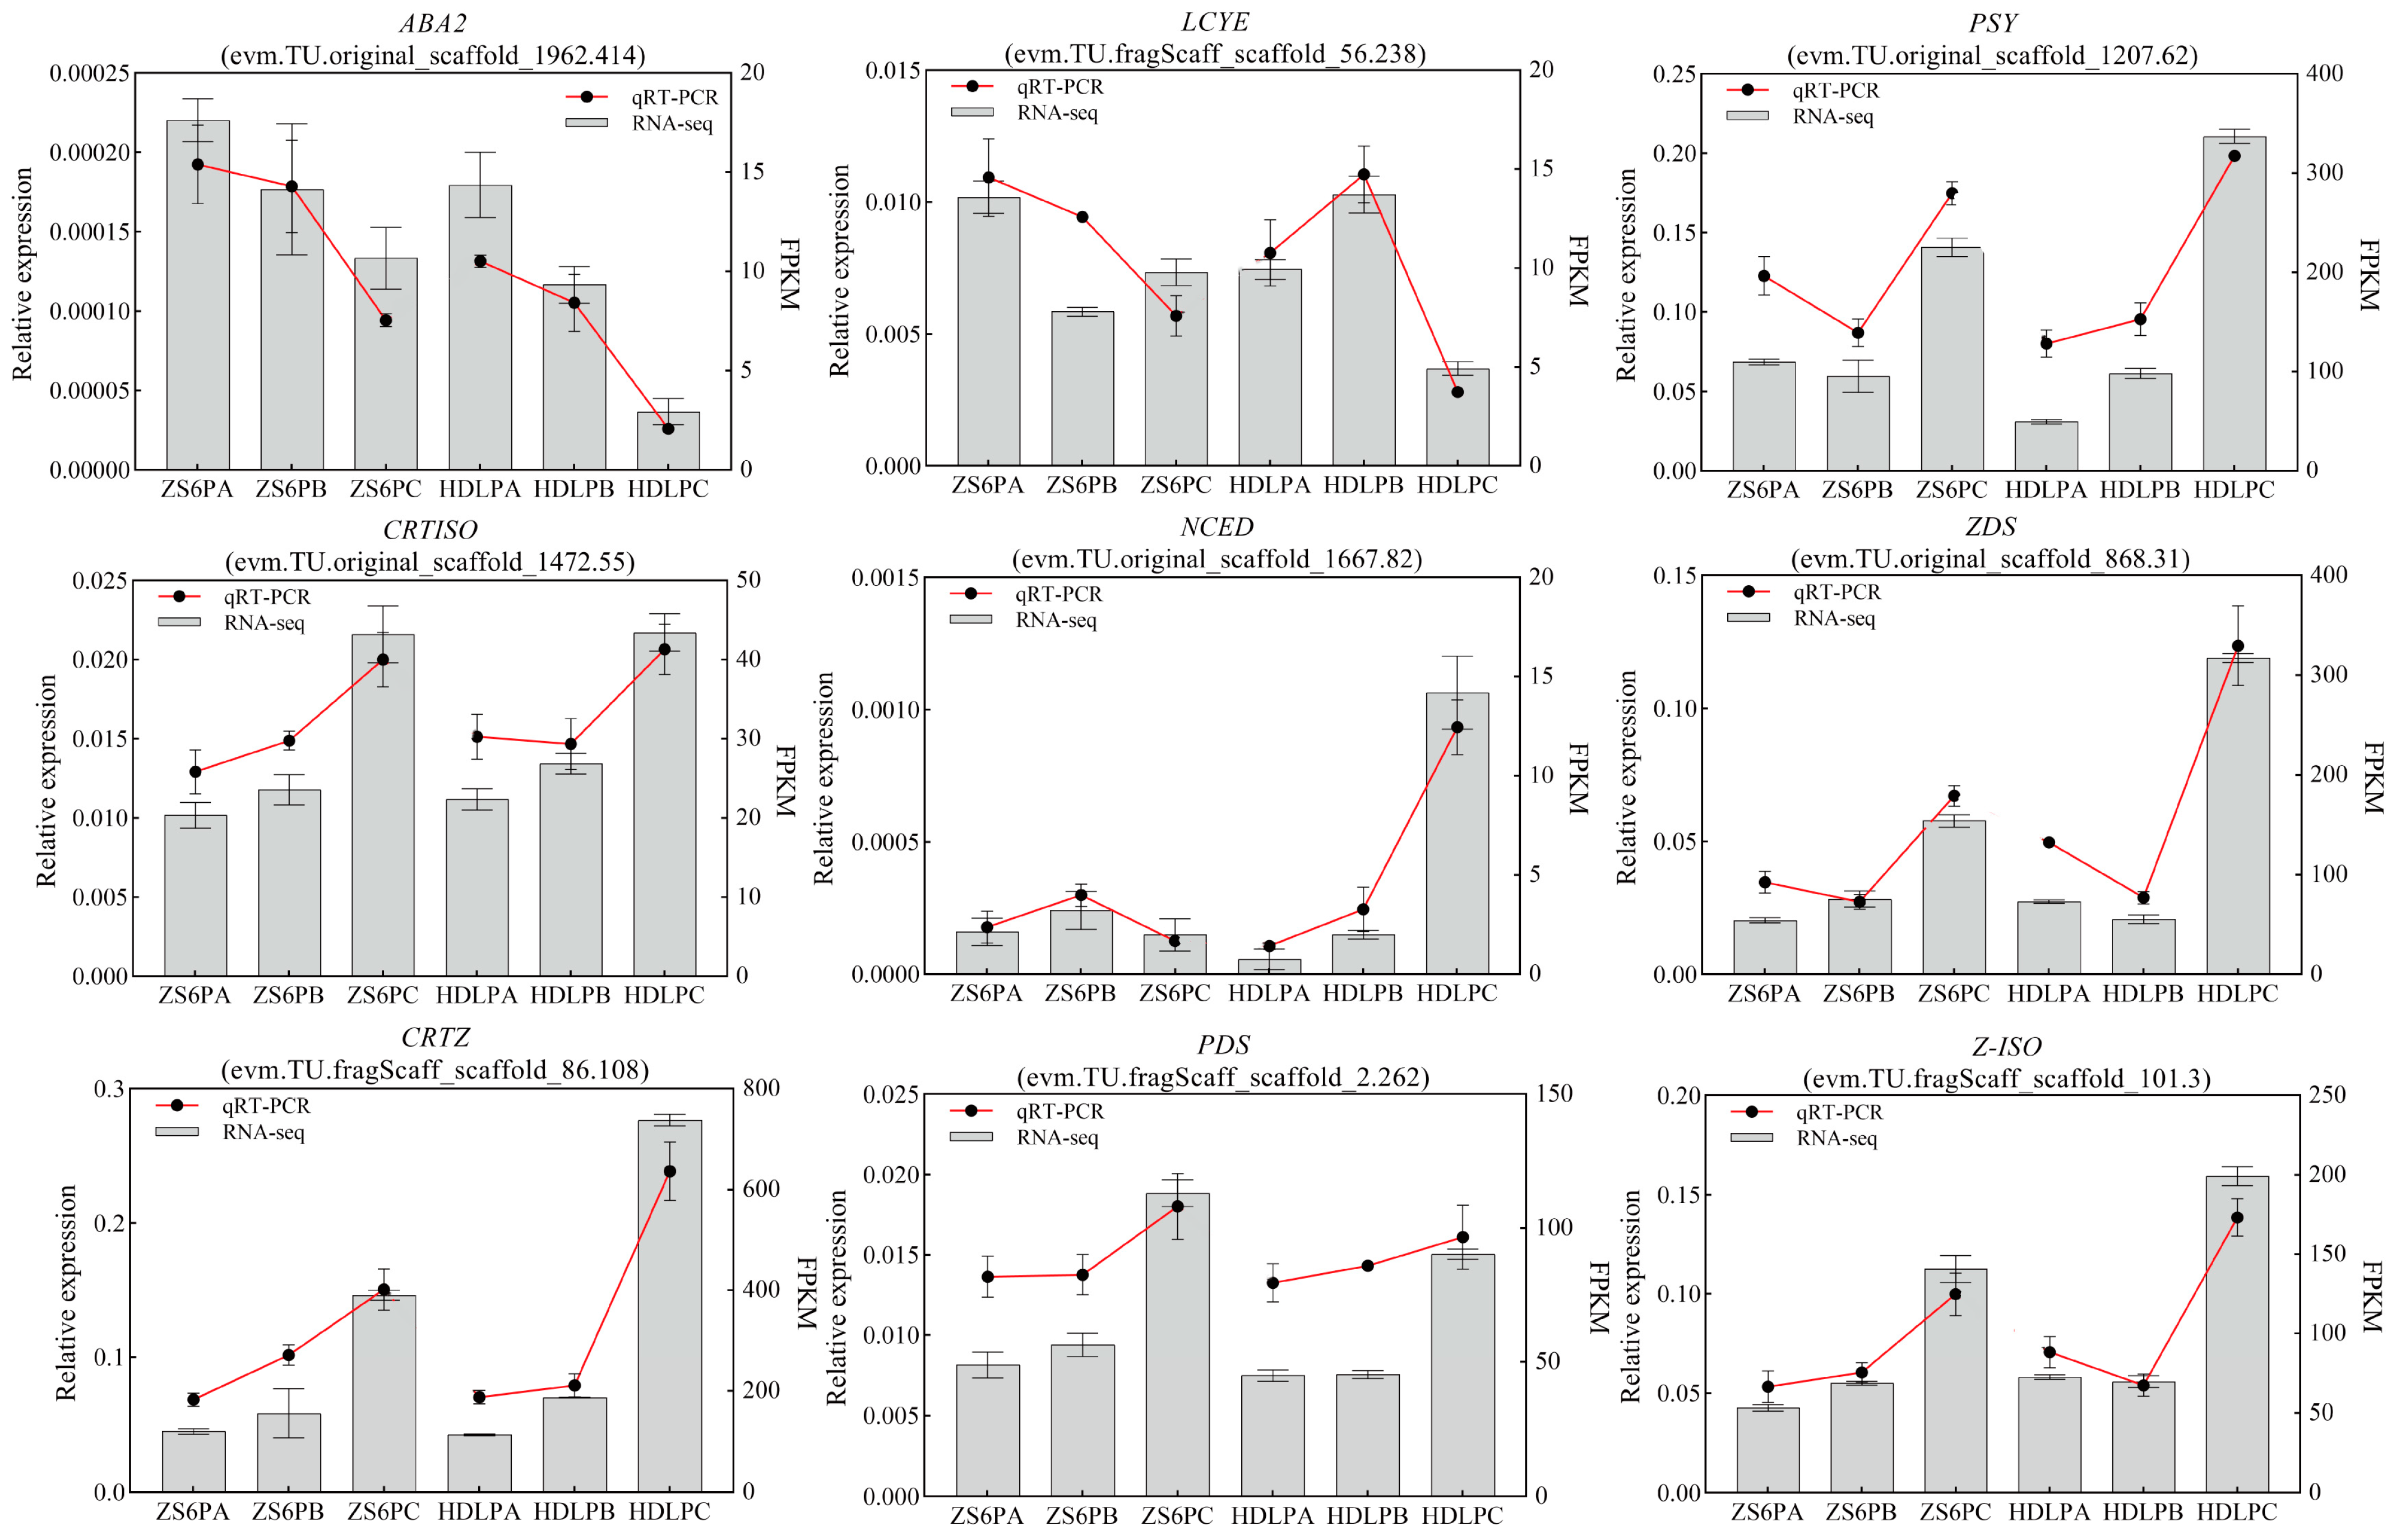
To further substantiate the reliability of the RNA-Seq results, nine structure differentially expressed genes associated with carotenoid biosynthesis were picked to study and validate their expression profiles. Furthermore, we used the qRT-PCR method to investigate the expression levels of the two persimmon cultivars at three distinct developmental phases. Expression patterns of the candidate genes are in agreement with those of the transcriptome. The reliability and consistency of the transcriptome data utilized in this study were validated by these findings (Figure 8).

4. Discussion

Carotenoids are widespread in nature, mainly concentrated in plants, algae, fungi, and bacteria [27]. The human body cannot manufacture carotenoids by itself, so they must be replenished from food [12]. The bright yellow, orange, and red that can be displayed in many horticultural crops are also due to differences in the carotenoid types and contents [28]. Thus, in recent years, research on carotenoids has been favored by scientists, especially in the color improvement of horticultural crops. Carotenoids have been well-studied in other horticultural crops, such as loquat [29], banana [30], corn [24], mango [31], and citrus [31]. Although research on carotenoids in persimmon fruit started earlier, there has been a lack of research on carotenoid synthesis and accumulation in the development of persimmon fruit. The lycopene and zeaxanthin in persimmon fruits were reported as early as 1932 [32], but subsequent related research mostly focused on the changes of carotenoids in the postharvest process [10,33,34,35]. Moreover, owing to the restricted technologies available for identifying carotenoids, fewer investigations of the carotenoids found in persimmon fruit have been conducted. This study detected the carotenoid-targeted metabolome during the development of two main types of persimmon cultivars (red-skinned persimmon fruit and yellow-skinned persimmon fruit) and identified the types and contents of carotenoids in the peels of the two colors. Subsequently, in combination with transcriptome technology, key regulatory genes were discovered, which systematically explained the pattern of carotenoid accumulation during persimmon fruit development. Meanwhile, it offered an explanation for the reasons why the two persimmon cultivars had different colors and provided a fresh viewpoint for breeding persimmon fruit color enhancement.
Known as “plant gold” [36], lycopene is a naturally occurring red molecule with strong antioxidant properties [27]. Lycopene is found in a broad range of plants, mostly in mature fruits. In addition to ripe tomatoes [37] and watermelon [38], lycopene is also found in plants such as guavas [39], grapefruit [40], mango [18], and papaya [41]. Previous research has shown that lycopene content can affect fruit color changes. In tomatoes, the downregulation of a gene regulating lycopene results in a decrease in lycopene content, which results in a change in tomato color [42]. In citrus, red citrus is formed because of its higher lycopene content than yellow citrus [43]. Ripe red carrots have higher levels of lycopene than yellow carrots [44]. In watermelon, the content of lycopene in watermelon changes due to the change in the abundance of ClLCYB protein, which results in watermelon pulp exhibiting yellow and white pulp types other than red pulp [45]. Therefore, the amount of lycopene content is the main reason why most fruits appear red, and our findings reveal that the color of the two cultivars of persimmon is also different for this reason.
In plant tissues, the PSY gene is a crucial factor affecting carotenoid accumulation [46]. It functions as a rate-limiting enzyme in the metabolism of carotenes and is essential for the integration of several signaling pathways that regulate the accumulation of lycopene [47]. The LCYE gene is also a key gene in the carotenoid pathway, which can utilize lycopene as the substrate for α-carotene synthesis. Earlier studies have identified PSY and LCYE as important genes associated with lycopene accumulation. Wang [48] found that the lycopene content in autumn olive fruit is strongly connected to the expression pattern of PSY and the silencing of LCYE. Wang [46] found that the expression of LCYE in lycopene-rich red carrot cultivars was lower than that in yellow carrot cultivars. In tomatoes, Paul D [49] found that PSY and PDS were expressed in breaker and ripe fruits but hardly in green fruits; Pecker [50] found that the expression of the LCYE gene was low in tomatoes during the ripening stage, leading to lycopene accumulation in fruits. According to Yuan’s research [51], the tomato’s yellow flesh phenotype is closely related to PSY variation, and low PSY gene expression reduces the lycopene content in fruits. Ma [52] found that LCYE was silenced in tomatoes, resulting in more lycopene accumulation. Luo [42] found that the SGR gene can affect PSY activity and can effectively regulate the accumulation of tomato red. ZDS is also a key enzyme in carotenoid synthesis [53], acting on downstream δ-carotene, catalyzing yellow delta-carotene to produce red lycopene [54]. In this research, it was discovered that the expression levels of PSY and ZDS in the red persimmon fruit ‘Hongdenglong’ were significantly higher than those in the yellow persimmon fruit ‘Zhongshi No. 6’ at the mature stage (C stage), while the expression trend of LCYE was the opposite. In conclusion, the color difference between the two persimmon cultivars is mostly due to this result’s impact on lycopene accumulation.

5. Conclusions

The purpose of this research was to shed light on the mechanism of carotenoid accumulation as well as the underlying causes of the color difference between red-peeled and yellow-peeled persimmon fruit. In general, the total carotenoid content of red persimmon fruit was higher than that of yellow persimmon fruit. Combined with the analysis of phenotype and metabolome, we found that the content of lycopene was the main contributor to the color difference between the two cultivars of persimmon. We also identified 12 structural genes involved in carotenoid metabolism in the differential genes of the two cultivars and three periods by analysis of transcriptome data. Through comprehensive metabolome and transcriptome analysis, we found that PSY, LCYE, and ZDS are the key genes that regulate differences in lycopene accumulation between the two persimmon cultivars. In conclusion, it was found that the important metabolite of persimmon fruit color difference is lycopene, and the important genes affecting lycopene accumulation are PSY, LCYE, and ZDS. The high PSY and ZDS gene expression and low LCYE gene expression caused the difference in lycopene accumulation between the two cultivars, which made them show the difference in color. Our results laid a theory for the genetic improvement of persimmon cultivars and opened a fresh window for the investigation of the internal mechanism of the color formation of persimmon fruit.

Supplementary Materials

The following supporting information can be downloaded at: https://www.mdpi.com/article/10.3390/agronomy12112688/s1, Figure S1: A comparison of two persimmon varieties’ peel color difference index readings taken at various stages of fruit development. ** denotes significant variations between the two cultivars at the 0.01 significance level for the same time frame; Figure S2: GO terms that were enriched for those DEGs. (a) the shared DEGs during the development of “Zhongshi No. 6” (ZS6PA vs. ZS6PB and ZS6PB vs. ZS6PC); (b) the shared DEGs during the development of “Hongdenglong” (HDLPA vs. ZHDLPB and HDLPB vs. HDLPC); (c) The share DEGs at the same stage of two cultivars (ZS6PA vs. HDLPA, ZS6PB vs. HDLPB, and ZS6PC vs. HDLPC; Figure S3: GO enrichment analysis that was enriched for those genes of sub Class 3, 4, 5, 8, 11, 15, and 19; Figure S4: Comparison of persimmon fruit development between two cultivars using a DEG KEGG enrichment distribution map; KEGG enrichment distribution map of DEGs in ZS6PA vs. ZS6PB, ZS6PB vs. ZS6PC, HDLPA vs. HDLPB, HDLPB vs. HDLPC, ZS6PA vs. HDLPA, ZS6PB vs. HDLPB, and ZS6PC vs. HDLPC; Figure S5: Determination of soft-thresholding power (β); Figure S6: Genes in three modules were put together using a heat map and KEGG analysis. (a) green; (b) red; (c) brown. Table S1: Primer sequences for the genes studied in this research; Table S2: Statistics on carotenoid lipid contents in two persimmon cultivars; Table S3: Statistics on the RNA-Seq libraries output and quality; Table S4: Comparative statistical table with the reference genome; Table S5: List of structural genes involved in carotenoid biosynthesis whose expression levels vary across cultivars.

Author Contributions

Visualization, P.S., Y.W. and L.Y.; validation, Y.S., H.L., J.Y. and L.Y.; methodology, W.H., Y.M. and L.Y.; writing—original draft, L.Y.; writing—review and editing, S.D. and J.F. All authors have read and agreed to the published version of the manuscript.

Funding

This research was funded by the National Key R&D Program of China (2019YFD1001201).

Institutional Review Board Statement

Not applicable.

Informed Consent Statement

Not applicable.

Data Availability Statement

Raw sequencing data were deposited in the NCBI Bioproject database (accession number: PRJNA872881).

Conflicts of Interest

The authors declare no conflict of interest.

References

  1. Miraei Ashtiani, S.; Salarikia, A.; Golzarian, M.R.; Emadi, B. Non-Destructive estimation of mechanical and chemical properties of persimmons by ultrasonic spectroscopy. Int. J. Food Prop. 2016, 19, 1522–1534. [Google Scholar] [CrossRef] [Green Version]
  2. Luo, Z.; Wang, R. Persimmon in China: Domestication and traditional utilization of genetic resources. Adv. Hortic. Sci. 2008, 22, 1000–1005. [Google Scholar]
  3. Yu, X.; Wang, J.; Gao, R.; Gong, B.; Ai, C. Integrated Metabolomic-Transcriptomic analysis reveals diverse resource of functional ingredients from persimmon leaves of different varieties. Front. Plant Sci. 2022, 13, 904208. [Google Scholar] [CrossRef] [PubMed]
  4. Yang, Z.; Xu, M.; Li, Q.; Wang, T.; Zhang, B.; Zhao, H.; Fu, J. The beneficial effects of polysaccharide obtained from persimmon (Diospyros kaki L.) on the proliferation of Lactobacillus and gut microbiota. Int. J. Biol. Macromol. 2021, 182, 1874–1882. [Google Scholar] [CrossRef] [PubMed]
  5. Wang, Z.; Zhou, J.; Xu, X.; Perl, A.; Chen, S.; Ma, H. Adoption of table grape cultivars: An attribute preference study on Chinese grape growers. Sci. Hortic. -Amst. 2017, 216, 66–75. [Google Scholar] [CrossRef]
  6. Wei, X.; Wu, L.; Ge, D.; Yao, M.; Bai, Y. Prediction of the maturity of greenhouse grapes based on imaging technology. Plant Phenomics 2022, 2022, 1–14. [Google Scholar] [CrossRef]
  7. Xu, Y.; Liu, Y.; Li, W.; Yang, C.; Lin, Y.; Wang, Y.; Chen, C.; Wan, C.; Chen, J.; Gan, Z. The Effects of Bagging on Color Change and Chemical Composition in ‘Jinyan’ Kiwifruit (Actinidia chinensis). Horticulturae 2022, 8, 478. [Google Scholar] [CrossRef]
  8. Ranganath, K.G. Pigments that colour our fruits: An overview. Erwerbs-Obstbau 2022. [Google Scholar] [CrossRef]
  9. Qi, Y.; Liu, X.; Zhang, Q.; Wu, H.; Yan, D.; Liu, Y.; Zhu, X.; Ren, X.; Yang, Y. Carotenoid accumulation and gene expression in fruit skins of three differently colored persimmon cultivars during fruit growth and ripening. Sci. Hortic. -Amst. 2019, 248, 282–290. [Google Scholar] [CrossRef]
  10. Homnava, A.U.O.G.; Payne, J.; Koehler, P.; Eitenmiller, R. Characterization of changes during ripening of oriental persimmon. J. Food Qual. 1991, 14, 425–434. [Google Scholar] [CrossRef]
  11. Luan, Y.; Fu, X.; Lu, P.; Grierson, D.; Xu, C. Molecular mechanisms determining the differential accumulation of carotenoids in plant species and varieties. Crit. Rev. Plant Sci. 2020, 39, 125–139. [Google Scholar] [CrossRef]
  12. Yuan, H.; Zhang, J.; Nageswaran, D.; Li, L. Carotenoid metabolism and regulation in horticultural crops. Hortic. Res. 2015, 2, 15036. [Google Scholar] [CrossRef] [Green Version]
  13. Rodriguez-Concepcion, M.; Avalos, J.; Bonet, M.L.; Boronat, A.; Gomez-Gomez, L.; Hornero-Mendez, D.; Limon, M.C.; Melendez-Martinez, A.J.; Olmedilla-Alonso, B.; Palou, A.; et al. A global perspective on carotenoids: Metabolism, biotechnology, and benefits for nutrition and health. Prog. Lipid Res. 2018, 70, 62–93. [Google Scholar] [CrossRef] [Green Version]
  14. Walter, M.H.; Strack, D. Carotenoids and their cleavage products: Biosynthesis and functions. Nat. Prod. Rep. 2011, 28, 663–692. [Google Scholar] [CrossRef]
  15. Al-Babili, S.; Bouwmeester, H.J. Strigolactones, a novel Carotenoid-Derived plant hormone. Annu. Rev. Plant Biol. 2015, 66, 161–186. [Google Scholar] [CrossRef] [PubMed]
  16. Porter, J.W.; Lincoln, R.E. 1. Lysopersicon selections containing a high content of carotenes and colorless polyenes. 2. The mechanism of carotene biosynthesis. Arch. Biochem. 1950, 27, 390–403. [Google Scholar]
  17. Liu, Y.; Lv, J.; Liu, Z.; Wang, J.; Yang, B.; Chen, W.; Ou, L.; Dai, X.; Zhang, Z.; Zou, X. Integrative analysis of metabolome and transcriptome reveals the mechanism of color formation in pepper fruit (Capsicum annuum L.). Food Chem. 2020, 306, 125629. [Google Scholar] [CrossRef] [PubMed]
  18. Ma, X.; Zheng, B.; Ma, Y.; Xu, W.; Wu, H.; Wang, S. Carotenoid accumulation and expression of carotenoid biosynthesis genes in mango flesh during fruit development and ripening. Sci. Hortic. -Amst. 2018, 237, 201–206. [Google Scholar] [CrossRef]
  19. Zhou, W.; Zhao, S.; Xu, M.; Niu, Y.; Nasier, M.; Fan, G.; Quan, S.; Zhang, S.; Wang, Y.; Liao, K. Identification of key genes controlling carotenoid metabolism during apricot fruit development by integrating metabolic phenotypes and gene expression profiles. J. Agric. Food Chem. 2021, 69, 9472–9483. [Google Scholar] [CrossRef] [PubMed]
  20. Kato, M.; Ikoma, Y.; Matsumoto, H.; Sugiura, M.; Hyodo, H.; Yano, M. Accumulation of carotenoids and expression of carotenoid biosynthetic genes during maturation in citrus fruit. Plant Physiol. 2004, 134, 824–837. [Google Scholar] [CrossRef] [Green Version]
  21. Blas, A.L.; Ming, R.; Liu, Z.; Veatch, O.J.; Paull, R.E.; Moore, P.H.; Yu, Q. Cloning of the papaya Chromoplast-Specific lycopene β-Cyclase, CpCYC-b, controlling fruit flesh color reveals conserved microsynteny and a recombination hot spot. Plant Physiol. 2010, 152, 2013–2022. [Google Scholar] [CrossRef] [Green Version]
  22. Zheng, X.; Zhu, K.; Sun, Q.; Zhang, W.; Wang, X.; Cao, H.; Tan, M.; Xie, Z.; Zeng, Y.; Ye, J.; et al. Natural variation in CCD4 promoter underpins Species-Specific evolution of red coloration in citrus peel. Mol. Plant 2019, 12, 1294–1307. [Google Scholar] [CrossRef] [PubMed]
  23. Luo, T.; Xu, K.; Luo, Y.; Chen, J.; Sheng, L.; Wang, J.; Han, J.; Zeng, Y.; Xu, J.; Chen, J.; et al. Distinct carotenoid and flavonoid accumulation in a spontaneous mutant of ponkan (Citrus reticulata blanco) results in yellowish fruit and enhanced postharvest resistance. J. Agric. Food Chem. 2015, 63, 8601–8614. [Google Scholar] [CrossRef]
  24. Wang, H.; Huang, Y.; Xiao, Q.; Huang, X.; Li, C.; Gao, X.; Wang, Q.; Xiang, X.; Zhu, Y.; Wang, J.; et al. Carotenoids modulate kernel texture in maize by influencing amyloplast envelope integrity. Nat. Commun. 2020, 11, 5346. [Google Scholar] [CrossRef] [PubMed]
  25. Wang, L.; Li, H.; Sun, P.; Suo, Y.; Han, W.; Diao, S.; Mai, Y.; Li, F.; Fu, J. Effects of Plant Growth Regulators, Soil Moisture Contents, and Carbon/Nitrogen Ratios on Sex Differentiation in Persimmon (Diospyros kaki Thunb.) Flowers. J. Plant Growth Regul. 2021, 40, 1121–1138. [Google Scholar] [CrossRef]
  26. Suo, Y.; Sun, P.; Cheng, H.; Han, W.; Diao, S.; Li, H.; Mai, Y.; Zhao, X.; Li, F.; Fu, J. A high-quality chromosomal genome assembly of Diospyros oleifera Cheng. GigaScience 2020, 9, giz164. [Google Scholar] [CrossRef] [PubMed] [Green Version]
  27. Wang, Y.; Zhang, R.; Yin, Y.; Tan, G.; Wang, G.; Liu, H.; Zhuang, J.; Zhang, J.; Zhuang, F.; Xiong, A. Advances in engineering the production of the natural red pigment lycopene: A systematic review from a biotechnology perspective. J. Adv. Res. 2022; in press. [Google Scholar] [CrossRef]
  28. Li, L.; Yuan, H. Chromoplast biogenesis and carotenoid accumulation. Arch. Biochem. Biophys. 2013, 539, 102–109. [Google Scholar] [CrossRef] [PubMed]
  29. Zou, S.; Shahid, M.Q.; Zhao, C.; Wang, M.; Bai, Y.; He, Y.; Lin, S.; Yang, X. Transcriptional analysis for the difference in carotenoids accumulation in flesh and peel of white-fleshed loquat fruit. PLoS ONE 2020, 15, e233631. [Google Scholar] [CrossRef]
  30. Heng, Z.; Sheng, O.; Huang, W.; Zhang, S.; Fernie, A.R.; Motorykin, I.; Kong, Q.; Yi, G.; Yan, S. Integrated proteomic and metabolomic analysis suggests high rates of glycolysis are likely required to support high carotenoid accumulation in the banana pulp. Food Chem. 2019, 297, 125016. [Google Scholar] [CrossRef]
  31. Petry, F.C.; Mercadante, A.Z. Composition by LC-MS/MS of new carotenoid esters in mango and citrus. J. Agric. Food Chem. 2016, 64, 8207–8224. [Google Scholar] [CrossRef]
  32. Karrer, P.; Morf, R.; Krauss, V.E.; Zubrys, A. Pflanzenfarbstoffe XXXIX. Vermischte beobachtungen über carotinoide (α-carotin, zeaxanthin, carotinoide aus kaki_x0002_früchten). Helv. Chim. Acta 1932, 15, 490–493. [Google Scholar] [CrossRef]
  33. Novillo, P.; Besada, C.; Tian, L.; Bermejo, A.; Salvador, A. Nutritional composition of ten persimmon cultivars in the “Ready-to-Eat crisp” stage. Effect of deastringency treatment. Food Nutr. Sci. 2015, 6, 1296–1306. [Google Scholar] [CrossRef] [Green Version]
  34. Brossard, J.; Mackinney, G. Fruit pigments, carotenoids of Diospyros kaki (Japanese persimmons). J. Agric. Food Chem. 1963, 11, 501–503. [Google Scholar] [CrossRef]
  35. Jeanagross, G.E. Carotenoid changes in the peel of ripening persimmon (Diospyros kaki) cv triumph. Phytochemistry 1984, 24, 29–32. [Google Scholar]
  36. Cheng, J.; Miller, B.; Balbuena, E.; Eroglu, A. Lycopene protects against Smoking-Induced lung cancer by inducing base excision repair. Antioxidants 2020, 9, 643. [Google Scholar] [CrossRef]
  37. Baranska, M.; Schutze, W.; Schulz, H. Determination of lycopene and beta-carotene content in tomato fruits and related products: Comparison of FT-Raman, ATR-IR, and NIR spectroscopy. Anal. Chem. 2006, 78, 8456–8461. [Google Scholar] [CrossRef] [PubMed]
  38. Perkins-Veazie, P.; Collins, J.K.; Pair, S.D.; Roberts, W. Lycopene content differs among red-fleshed watermelon cultivars. J. Sci. Food Agric. 2001, 81, 983–987. [Google Scholar] [CrossRef]
  39. Polinati, R.M.; Teodoro, A.J.; Correa, M.G.; Casanova, F.A.; Passos, C.; Silva, J.L.; Fialho, E. Effects of lycopene from guava (Psidium guajava L.) derived products on breast cancer cells. Nat. Prod. Res. 2022, 36, 1405–1408. [Google Scholar] [CrossRef] [PubMed]
  40. Liu, W.; Ye, Q.; Jin, X.; Han, F.; Huang, X.; Cai, S.; Yang, L. A spontaneous bud mutant that causes lycopene and β-carotene accumulation in the juice sacs of the parental Guanxi pummelo fruits (Citrus grandis (L.) Osbeck). Sci. Hortic.-Amst. 2016, 198, 379–384. [Google Scholar] [CrossRef]
  41. Zhou, D.; Shen, Y.; Zhou, P.; Fatima, M.; Lin, J.; Yue, J.; Zhang, X.; Chen, L.; Ming, R. Papaya CpbHLH1/2 regulate carotenoid biosynthesis-related genes during papaya fruit ripening. Hortic. Res. 2019, 6, 80. [Google Scholar] [CrossRef] [PubMed] [Green Version]
  42. Luo, Z.; Zhang, J.; Li, J.; Yang, C.; Wang, T.; Ouyang, B.; Li, H.; Giovannoni, J.; Ye, Z. A STAY-GREEN protein SlSGR1 regulates lycopene and β-carotene accumulation by interacting directly withSlPSY 1 during ripening processes in tomato. New Phytol. 2013, 198, 442–452. [Google Scholar] [CrossRef]
  43. Alquézar, B.; Zacarías, L.; Rodrigo, M.J. Molecular and functional characterization of a novel chromoplast-specific lycopene β-cyclase from Citrus and its relation to lycopene accumulation. J. Exp. Bot. 2009, 60, 1783–1797. [Google Scholar] [CrossRef]
  44. Wang, Y.; Li, T.; Zhang, R.; Khadr, A.; Tian, Y.; Xu, Z.; Xiong, A. Transcript profiling of genes involved in carotenoid biosynthesis among three carrot cultivars with various taproot colors. Protoplasma 2020, 257, 949–963. [Google Scholar] [CrossRef] [PubMed]
  45. Zhang, J.; Sun, H.; Guo, S.; Ren, Y.; Li, M.; Wang, J.; Zhang, H.; Gong, G.; Xu, Y. Decreased protein abundance of lycopeneβ-Cyclase contributes to red flesh in domesticated watermelon. Plant Physiol. 2020, 183, 1171–1183. [Google Scholar] [CrossRef] [PubMed]
  46. Burkhardt, P.K.; Beyer, P.; Wünn, J.; Klöti, A.; Armstrong, G.A.; Schledz, M.; Lintig, J.; Potrykus, I. Transgenic rice (Oryza sativa) endosperm expressing daffodil (Narcissus pseudonarcissus) phytoene synthase accumulates phytoene, a key intermediate of provitamin a biosynthesis. Plant J. Cell Mol. Biol. 1997, 11, 1071–1078. [Google Scholar] [CrossRef] [PubMed] [Green Version]
  47. Giuliano, G. Plant carotenoids: Genomics meets multi-gene engineering. Curr. Opin. Plant Biol. 2017, 19, 125–126. [Google Scholar] [CrossRef] [PubMed] [Green Version]
  48. Wang, T.; Hou, Y.; Hu, H.; Wang, C.; Zhang, W.; Li, H.; Cheng, Z.; Yang, L. Functional validation of phytoene synthase and lycopene epsilon-Cyclase genes for high lycopene content in autumn olive fruit (Elaeagnus umbellata). J. Agric. Food Chem. 2020, 68, 11503–11511. [Google Scholar] [CrossRef] [PubMed]
  49. Paul, D.; Fraser, M.R.T.C. Carotenoid Biosynthesis during Tomato Fruit Development. Plant Physiol. 1994, 105, 405–413. [Google Scholar]
  50. Pecker, I.; Gabbay, R.; Cunningham, F.J.; Hirschberg, J. Cloning and characterization of the cDNA for lycopene beta-cyclase from tomato reveals decrease in its expression during fruit ripening. Plant Mol. Biol. 1996, 30, 807–819. [Google Scholar] [CrossRef] [PubMed]
  51. Yuan, D.; Chen, J.; Shen, H.; Yang, W. Genetics of flesh color and nucleotide sequence analysis of phytoene synthase gene 1 in a yellow-fruited tomato accession PI114490. Sci. Hortic. -Amst. 2008, 118, 20–24. [Google Scholar] [CrossRef]
  52. Ma, C.; Ma, B.; He, J.; Hao, Q.; Lu, X.; Wang, L. Regulation of carotenoid content in tomato by silencing of lycopene β/ε-Cyclase genes. Plant Mol. Biol. Rep. 2011, 29, 117–124. [Google Scholar] [CrossRef]
  53. Li, M.; Gan, Z.; Cui, Y.; Shi, C.; Shi, X. Cloning and characterization of the -Carotene desaturase gene from Chlorella protothecoides CS-41. J. Biomed. Biotechnol. 2011, 2011, 1–7. [Google Scholar] [CrossRef] [Green Version]
  54. Yan, P.; Gao, X.Z.; Shen, W.T.; Zhou, P. Cloning and expression analysis of phytoene desaturase and zeta-carotene desaturase genes in Carica papaya. Mol. Biol. Rep. 2011, 38, 785–791. [Google Scholar] [CrossRef] [PubMed]
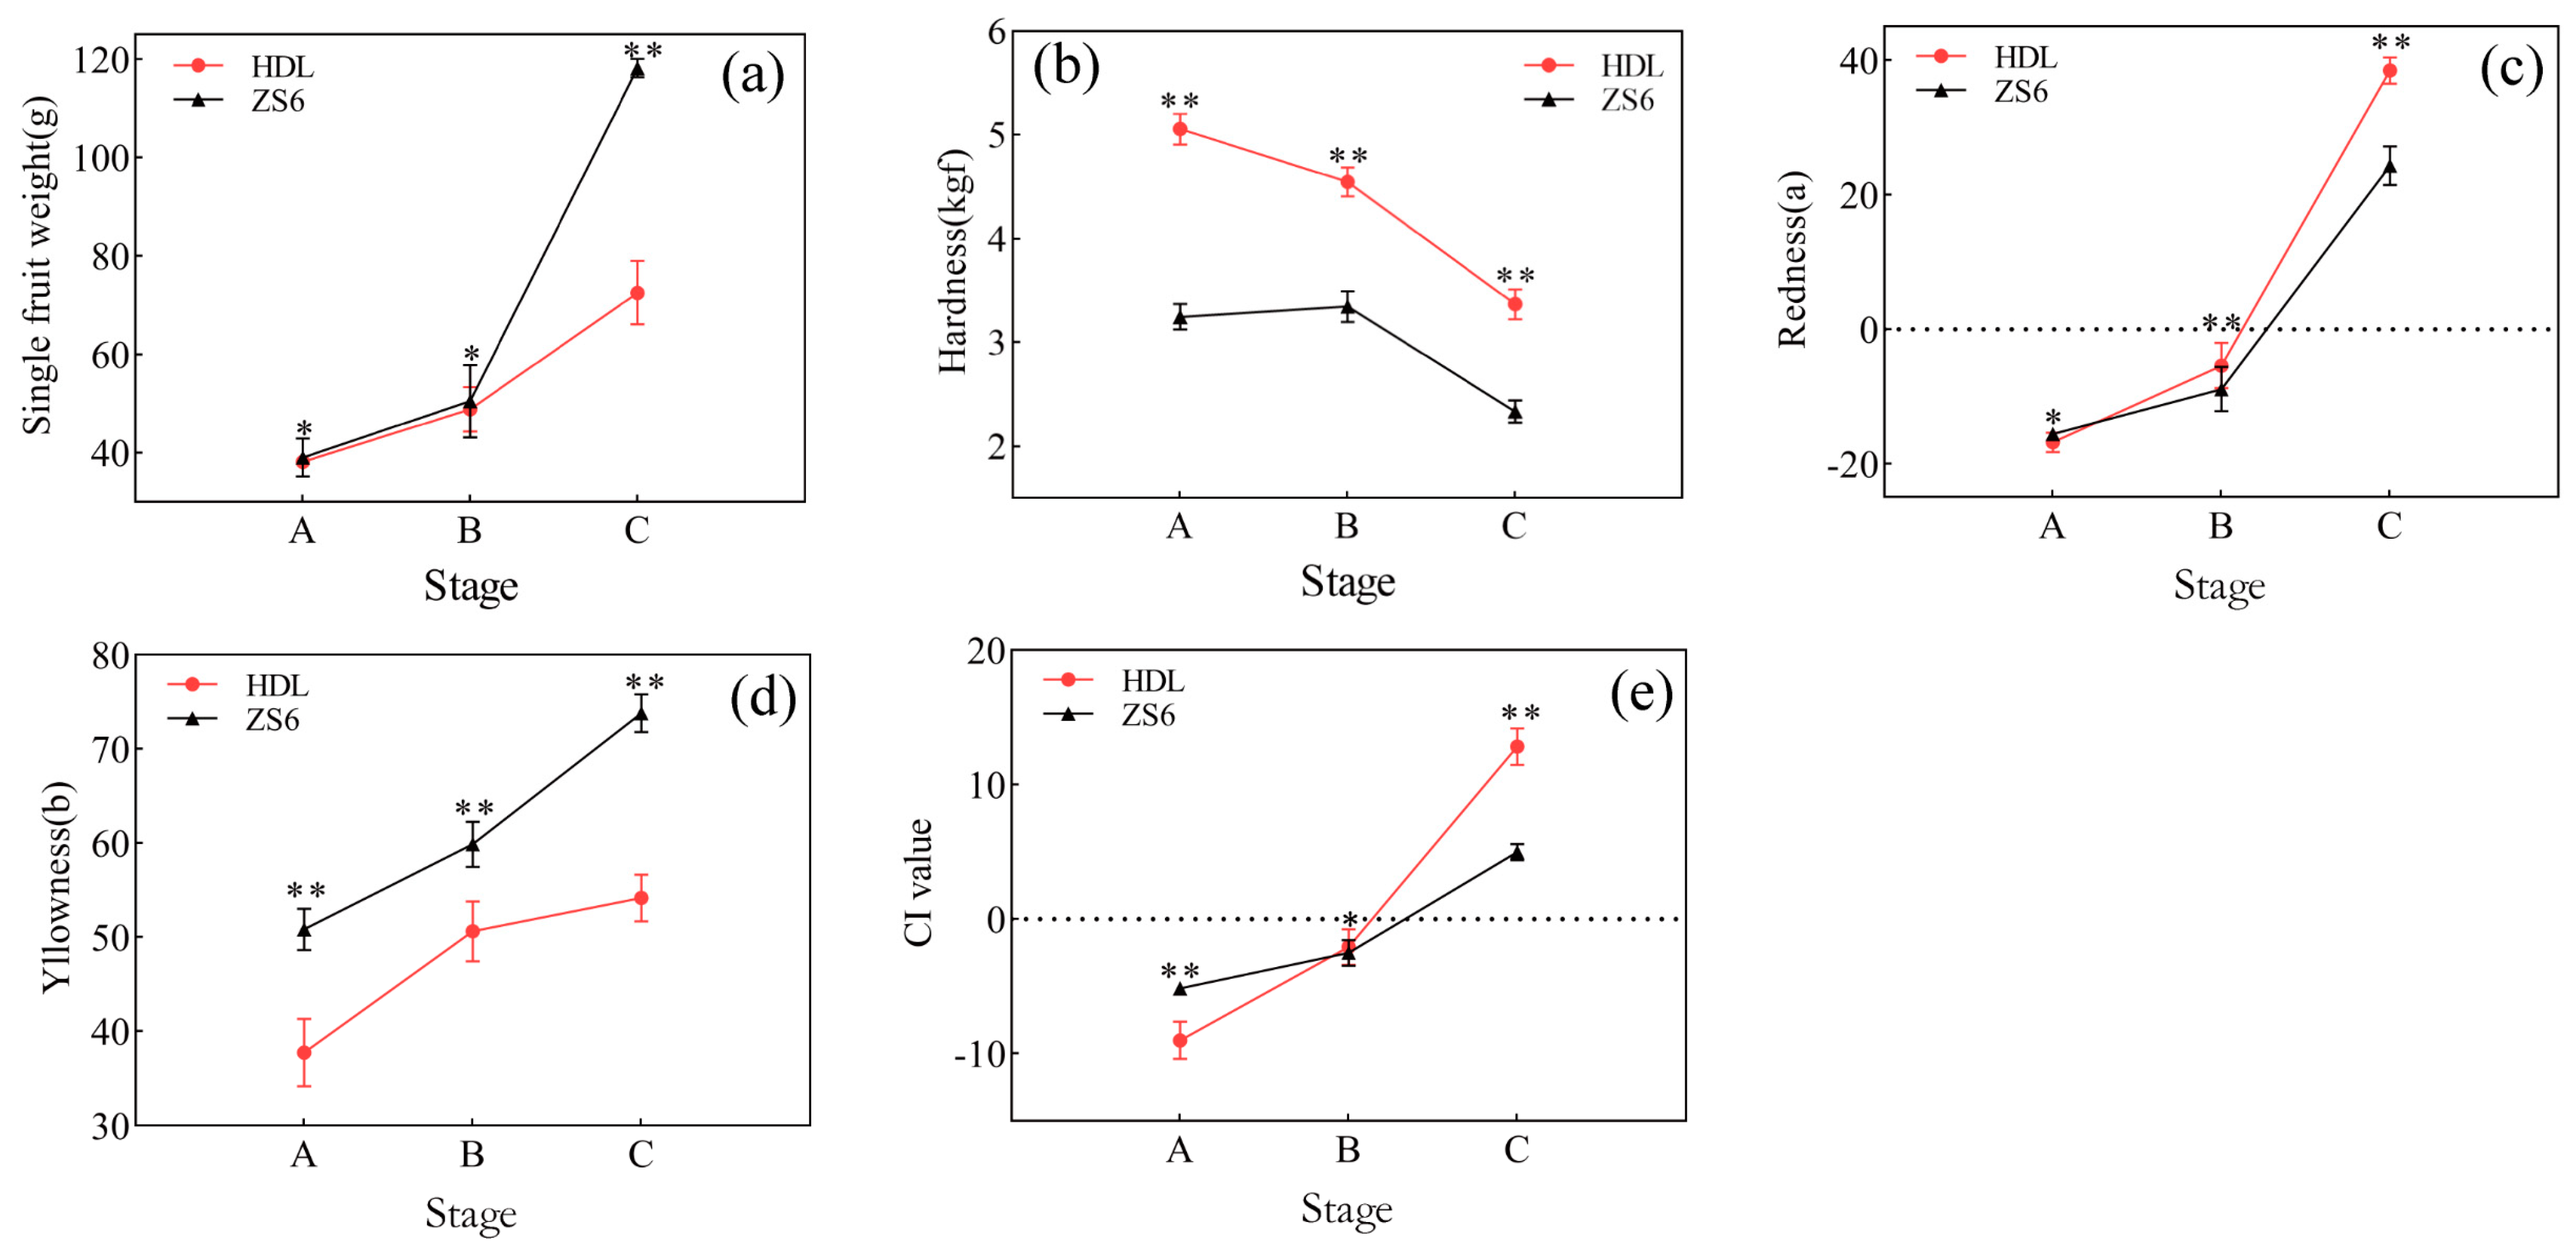
Figure 1. Basic phenotypic parameter changes between two persimmon cultivars during fruit development and maturation: (a) single-fruit weight, (b) hardness, (c) redness, (d) yellowness, and (e) CI value. A significant difference between the two persimmon cultivars at the 0.05 or 0.01 level throughout the same period is shown by the letters * or **, respectively. A, B and C on the abscissa represent stage A, stage B and stage C respectively during fruit development. ZS6 and HDL represent Zhongshi No. 6 and Hongdenglong. The same applies below.
Agronomy 12 02688 g001
Figure 2. Changes in total and individual carotenoid contents of two persimmon cultivars throughout three growth phases. The subfigure (ao) are α-carotene, β-carotene, ε-carotene, lycopene, γ-carotene, (E/Z)-phytoene, capsaicin, zeaxanthin, violaxanthin, neoxanthin, lutein, β-cryptoxanthin, α-cryptoxanthin, antheraxanthin and total carotenoids, respectively. A significant difference between the two persimmon cultivars at the 0.05 or 0.01 level throughout the same period is shown by the letters * or **, respectively.
Agronomy 12 02688 g002
Figure 3. Basic transcriptome data analysis. (a) Heatmap of correlations between groups; (b) three-stage cluster heat map of all detected DEGs. Increased and decreased amounts of gene transcripts are shown by the colors red and green, respectively.
Agronomy 12 02688 g003
Figure 4. DEG distribution in pair-wise comparisons. (a) Numbers of DEGs in pair-wise comparisons. (b,c) Venn diagram of the number of DEGs revealed by pair-wise comparisons.
Agronomy 12 02688 g004
Figure 5. Clustering gene expression profile of two persimmon cultivars fruit peel development.
Agronomy 12 02688 g005
Figure 6. In total, 36,778 unigenes were subjected to weighted gene co-expression network analysis (WGCNA). (a) WGCNA co-expressed gene module hierarchical clustering tree (cluster dendrogram). (b) Each module’s carotenoid relationship and gene distribution are indicated. Each module-trait intersection is highlighted with the Pearson correlation coefficient and e-value.
Agronomy 12 02688 g006aAgronomy 12 02688 g006b
Figure 7. Carotenoids’ metabolic pathways in persimmon fruits. At the upper right, there are two color bars. The bar from green to red indicates the level of gene expression, and the values in the colored boxes are the fpkm values of the genes. The bar from yellow to red indicates the level of metabolite accumulation, and the values in the colored boxes are the relative contents of metabolites.
Agronomy 12 02688 g007
Figure 8. FPKM values and relative expression of nine candidate genes in two persimmon cultivars at three stages. The data represent the average of three biological replicates, and error bars reflect the standard deviation.
Agronomy 12 02688 g008
Publisher’s Note: MDPI stays neutral with regard to jurisdictional claims in published maps and institutional affiliations.