Article

Varietal Variances of Grain Nitrogen Content and Its Relations to Nitrogen Accumulation and Yield of High-Quality Rice under Different Nitrogen Rates

Key Laboratory of Crop Physiology, Ecology and Genetic Breeding, Ministry of Education, School of Agricultural Sciences, Jiangxi Agricultural University, Nanchang 330045, China
*
Author to whom correspondence should be addressed.
These authors contributed equally to this work.
Agronomy 2022, 12(11), 2719; https://doi.org/10.3390/agronomy12112719
Submission received: 27 September 2022 / Revised: 24 October 2022 / Accepted: 28 October 2022 / Published: 2 November 2022
(This article belongs to the Special Issue In Memory of Professor Longping Yuan, the Father of Hybrid Rice)

Abstract

:
Nitrogen (N) management is an important strategy for improving the yield, grain quality, and N use efficiency of rice (Oryza sativa). Exploring appropriate N application rates is essential for high-quality rice production in China, especially in the context of the large extension of these varieties in recent years. Field experiments were conducted to study changes of grain N content and their correlations to yield and yield components using twenty high-quality rice varieties grown at three N application rates (105, 165 and 225 kg ha−1) in 2019 and 2020. Additionally, a micro-plot experiment based on 15N isotope tracing technique was also conducted with two contrasting high-quality rice varieties of Y-liangyou 911 and Yeiangyoulisi under two N application rates (165 and 225 kg ha−1) in 2021, with grain N accumulation, its subdivision, and N utilization investigated. We found that the grain N content of high-quality rice increased with the increase of N application rates, while there was no consistent response in grain yield. There was a significant quadratic relationship between grain yield and grain N content, while panicles m−2 and grain-setting rate had a positive and a negative correlation with grain N content, respectively, in both 2019 and 2020. Across three N application rates and two years, the coefficient of variation (CV) of grain N content ranged from 10.36% to 21.26% among twenty varieties, of which Y-liangyou 911 had the smallest CV, and six varieties, including Yexiangyoulisi, had the largest CV. The micro-plot experiment showed that, in comparison with N165, the grain N content, grain N accumulation, and N recovery rate increased under N225 in both varieties, but a significant increase in grain yield was only observed for Y-liangyou 911. Grain N accumulation derived from panicle N fertilizer and its ratios to total grain N accumulation and the N recovery rate was significantly higher than those derived from basal and tillering N fertilizers. Nevertheless, increasing N application rates had much greater effects on the grain N accumulation derived from basal and tillering fertilizers and on ratios to total grain N accumulation in Yexiangyoulisi than those in Y-liangyou 911. Our results suggested that adopting a moderate N application rate (165 kg ha−1) is conducive to maintaining an appropriate grain N content and achieving higher grain yield and N use efficiency as well as better quality of high-quality rice. Besides, moderately reducing basal and/or tillering N fertilizers is necessary for those varieties with a larger CV of grain N content.

1. Introduction

Rice is the most important cereal crop in China, and more than 60% of the population rely on rice as their staple food [1]. Thus, achieving a high and stable yield of rice plays a vital role in ensuring national food security. N fertilizer is an essential nutrient for rice growth and development. Over the past several decades, the needs of the ever-growing population in China has been driving the continuous increase of rice yield, which has partly resulted from an increase in N fertilizer input [2]. The rational application of N fertilizer can not only optimize the quality of the rice community but also improve the grain yield, quality, and N use efficiency [3,4]. However, rice farmers often apply a higher amount of N fertilizer than required to realize the maximum yield, because a large number of newly released varieties generally show higher yield potential, fertilizer responsiveness, and lodging resistance [5,6].
Recently, with the improvement of people’s living standards and the promotion of agricultural supply-side structural reform, the number of released varieties of high-quality rice has surged, with their planted areas rapidly expanding [7,8,9]. However, the unreasonable nitrogen(N) fertilizer input has been threatening the synchronous improvement of the grain yield and quality of high-quality rice varieties due to farmers’ invariable pursuit of higher yields and returns [4,10]. Although N fertilizer application has positive effects on the grain yield and quality formation of high-quality rice, it also promotes N distribution from sources to sinks, subsequently increasing grain N accumulation and protein content [11,12,13]. Many previous studies have revealed that there was a parabola relationship between rice yields and N application rates, which means the overuse of N fertilizer may result in yield stagnation and even loss [14,15,16]. In addition, excessive N application can lead to rice quality deterioration [17], lodging [18], and N loss and also induced environmental issues, such as degeneration of soil properties and environmental pollution [19,20,21]. Therefore, there is a urgent need to develop appropriate N management strategies for high-quality rice.
Grain N content and accumulation of rice are closely related to plant N uptake, which is influenced by N fertilizer managements, such as N application rate, period and the ratio [14,15,19]. Generally, grain protein content derived from grain N accumulation is significantly negatively correlated with rice quality, especially cooking and eating quality [12,17,22]. It has been shown that moderate or low N (protein) content in rice grains could be beneficial to the improvement of cooking and eating quality. Based on an assessment of the effectiveness of N managements on rice yield and eating quality, Cheng et al. [10] found that decreasing the traditional high N rates (including the amount of total N and late-stage N fertilizers) slightly decreased the grain yield but could markedly improve eating quality with a significant decrease in grain protein content. Similarly, Huang et al. [17] and Shi et al. [22] also suggested that lower N fertilizer applications reduced grain protein content and maintained the good cooking and eating quality of high-quality rice. However, there is an obvious incoordination in achieving high productivity and good quality simultaneously for high-quality rice varieties [4,10,17].
The stable 15N tracer technique has been widely used in the distribution, accumulation, and utilization of N fertilizer [23,24]. This method can clearly distinguish the labeled N from other N sources and can visually understand the N requirement of each organ of the plant and the distribution of N in the body. Lin et al. [25] found that when N was applied 150–300 kg ha−1 at different ratio of basal-N, tillering-N and panicle-N, the N recovery efficiencies of basal, tillering and panicle fertilizers were 9.1–22.8%, 17–34% and 45–82%, respectively. To establish methods for N application rate and screening rice varieties with high yield and quality, it is important to clarify the varieties difference in the varieties in terms of N content and N accumulation at different N application rates, and to quantify the subdivision of grain N accumulation derived from basal, tillering, and panicle N fertilizers. Nevertheless, most previous studies mainly focused on the effects of N fertilizer applications on grain N (protein) content and N accumulation, and their relationships with grain quality of high-quality japonica rice. However, the varietal variances of grain N content under different N fertilizer application rates and their effects on grain N accumulation, N utilization, and the yield of high-quality indica rice are still little known.
In this study, we hypothesized that there are significant varietal variances of grain N content at different N fertilizer application rates among high-qaulity indica rice varieties, and which are related to grain yield, grain N accumulation, and N utilization. In order to verify the hypothesis, two-year consecutive field experiments were conducted with twenty high-quality indica rice varieties under three N application rates, with a subsequent one-year micro-plot experiment with two contrasting varieties selected from the former experiments according to variances of grain N content conducted under two N application rates. The objectives of these studies were (1) to explore the varietal variances of grain N content and their relationships with yield and yield attributes of high-quality rice varieties under different N application rates, and (2) to quantify the subdivision of grain N accumulation derived from basal, tillering, and panicle N fertilizers. The results may provide a theoretical basis for genetic improvement and production of high-quality indica rice.

2. Materials and Methods

2.1. Site Description

Two-year consecutive field experiments were conducted in Jiangxi Shanggao Rice Science and Technology Backyard, which is located in Zengjia Village, Sixi Town, Shanggao County, Jiangxi Province (115°09′ E, 28°23′ N, 38 m altitude) in 2019 and 2020. In addition, a micro-plot experiment was also conducted at the same site in 2021. Rice plants in the three experiments were grown in the late season from June to November. The soil texture was sandy clay loam, and the properties of 0–20 cm layer were pH 5.69, 34.7 g kg−1 organic matter, 1.91 g kg−1 total N, 157.5 mg kg−1 alkaline hydrolyzable N, 18.5 mg kg−1 available P and 118.5 mg kg−1 available K in 2019; pH 5.85, 41.0 g kg−1 organic matter, 2.26 g kg−1 total N, 214.2 mg kg−1 alkaline hydrolyzable N, 19.8 mg kg−1 available P and 125.1 mg kg−1 available K in 2020; pH 5.69, 38.7 g kg−1 organic matter, 2.25 g kg−1 total N, 187.7 mg kg−1 alkaline hydrolyzable N, 18.9 mg kg−1 available P and 122.8 mg kg−1 available K in 2021.
Weather data including daily mean temperature and solar radiation were collected from an on-site automatic weather station (Vantage Pro 2, Davis instruments Corp., Hayward, CA, USA) installed close to the field site as shown in Figure 1. Averaged daily mean temperatures were 30.73 °C, 29.29 °C, and 28.81 °C from transplanting to heading, and 23.56 °C, 19.78 °C, and 22.24 °C from heading to maturity in 2019, 2020, and 2021, respectively. Averaged daily solar radiations were 21.22 MJ m−2, 16.80 MJ m−2, and 18.45 MJ m−2 from transplanting to heading, and 12.91 MJ m−2, 9.63 MJ m−2, and 12.92 MJ m−2 from heading to maturity in 2019, 2020, and 2021, respectively.

2.2. Experimental Design

The field experiments were arranged in a split-plot design with N application rates as the main plot and rice varieties as the subplot with two replications in 2019 and three replications in 2020. The N application rates were 105 kg ha−1 (N105), 165 kg ha−1 (N165), and 225 kg ha−1 (N225). The N sources were from urea with 46% N. The rice varieties were 20 high-quality late indica rice varieties released in double rice-cropping areas of the middle and lower reaches of the Yangtze River of China (Table 1). Pre-germinated seeds were sown in seedbeds on June 20 in 2019 and June 25 in 2020, respectively. Seedlings were manually transplanted on July 15 in 2019 and July 20 in 2020. The hill spacing was 25 cm × 14 cm with 2 seedlings per hill for hybrid rice and 4 seedlings per hill for inbred rice. The areas of main and split plots were 300 m2 and 15 m2, respectively. N fertilizer was applied in three splits: 50% at one day before transplanting (basal fertilizer), 30% at seven days after transplanting (tillering fertilizer), and 20% at panicle initiation (panicle fertilizer). For three N application rates, the total potassium (K2O) fertilizer was 165 kg ha−1 and applied in two splits: 50% at one day before transplanting, and 50% at panicle initiation; the total phosphate (P2O5) fertilizer was 82.5 kg ha−1 and all applied at one day before transplanting. The water regime was adopted with a sequential order of flooding, mid-season drainage, re-flooding, and moist intermittent irrigation. Weeds, insects, and pathogens were intensively controlled by chemicals to avoid yield loss.
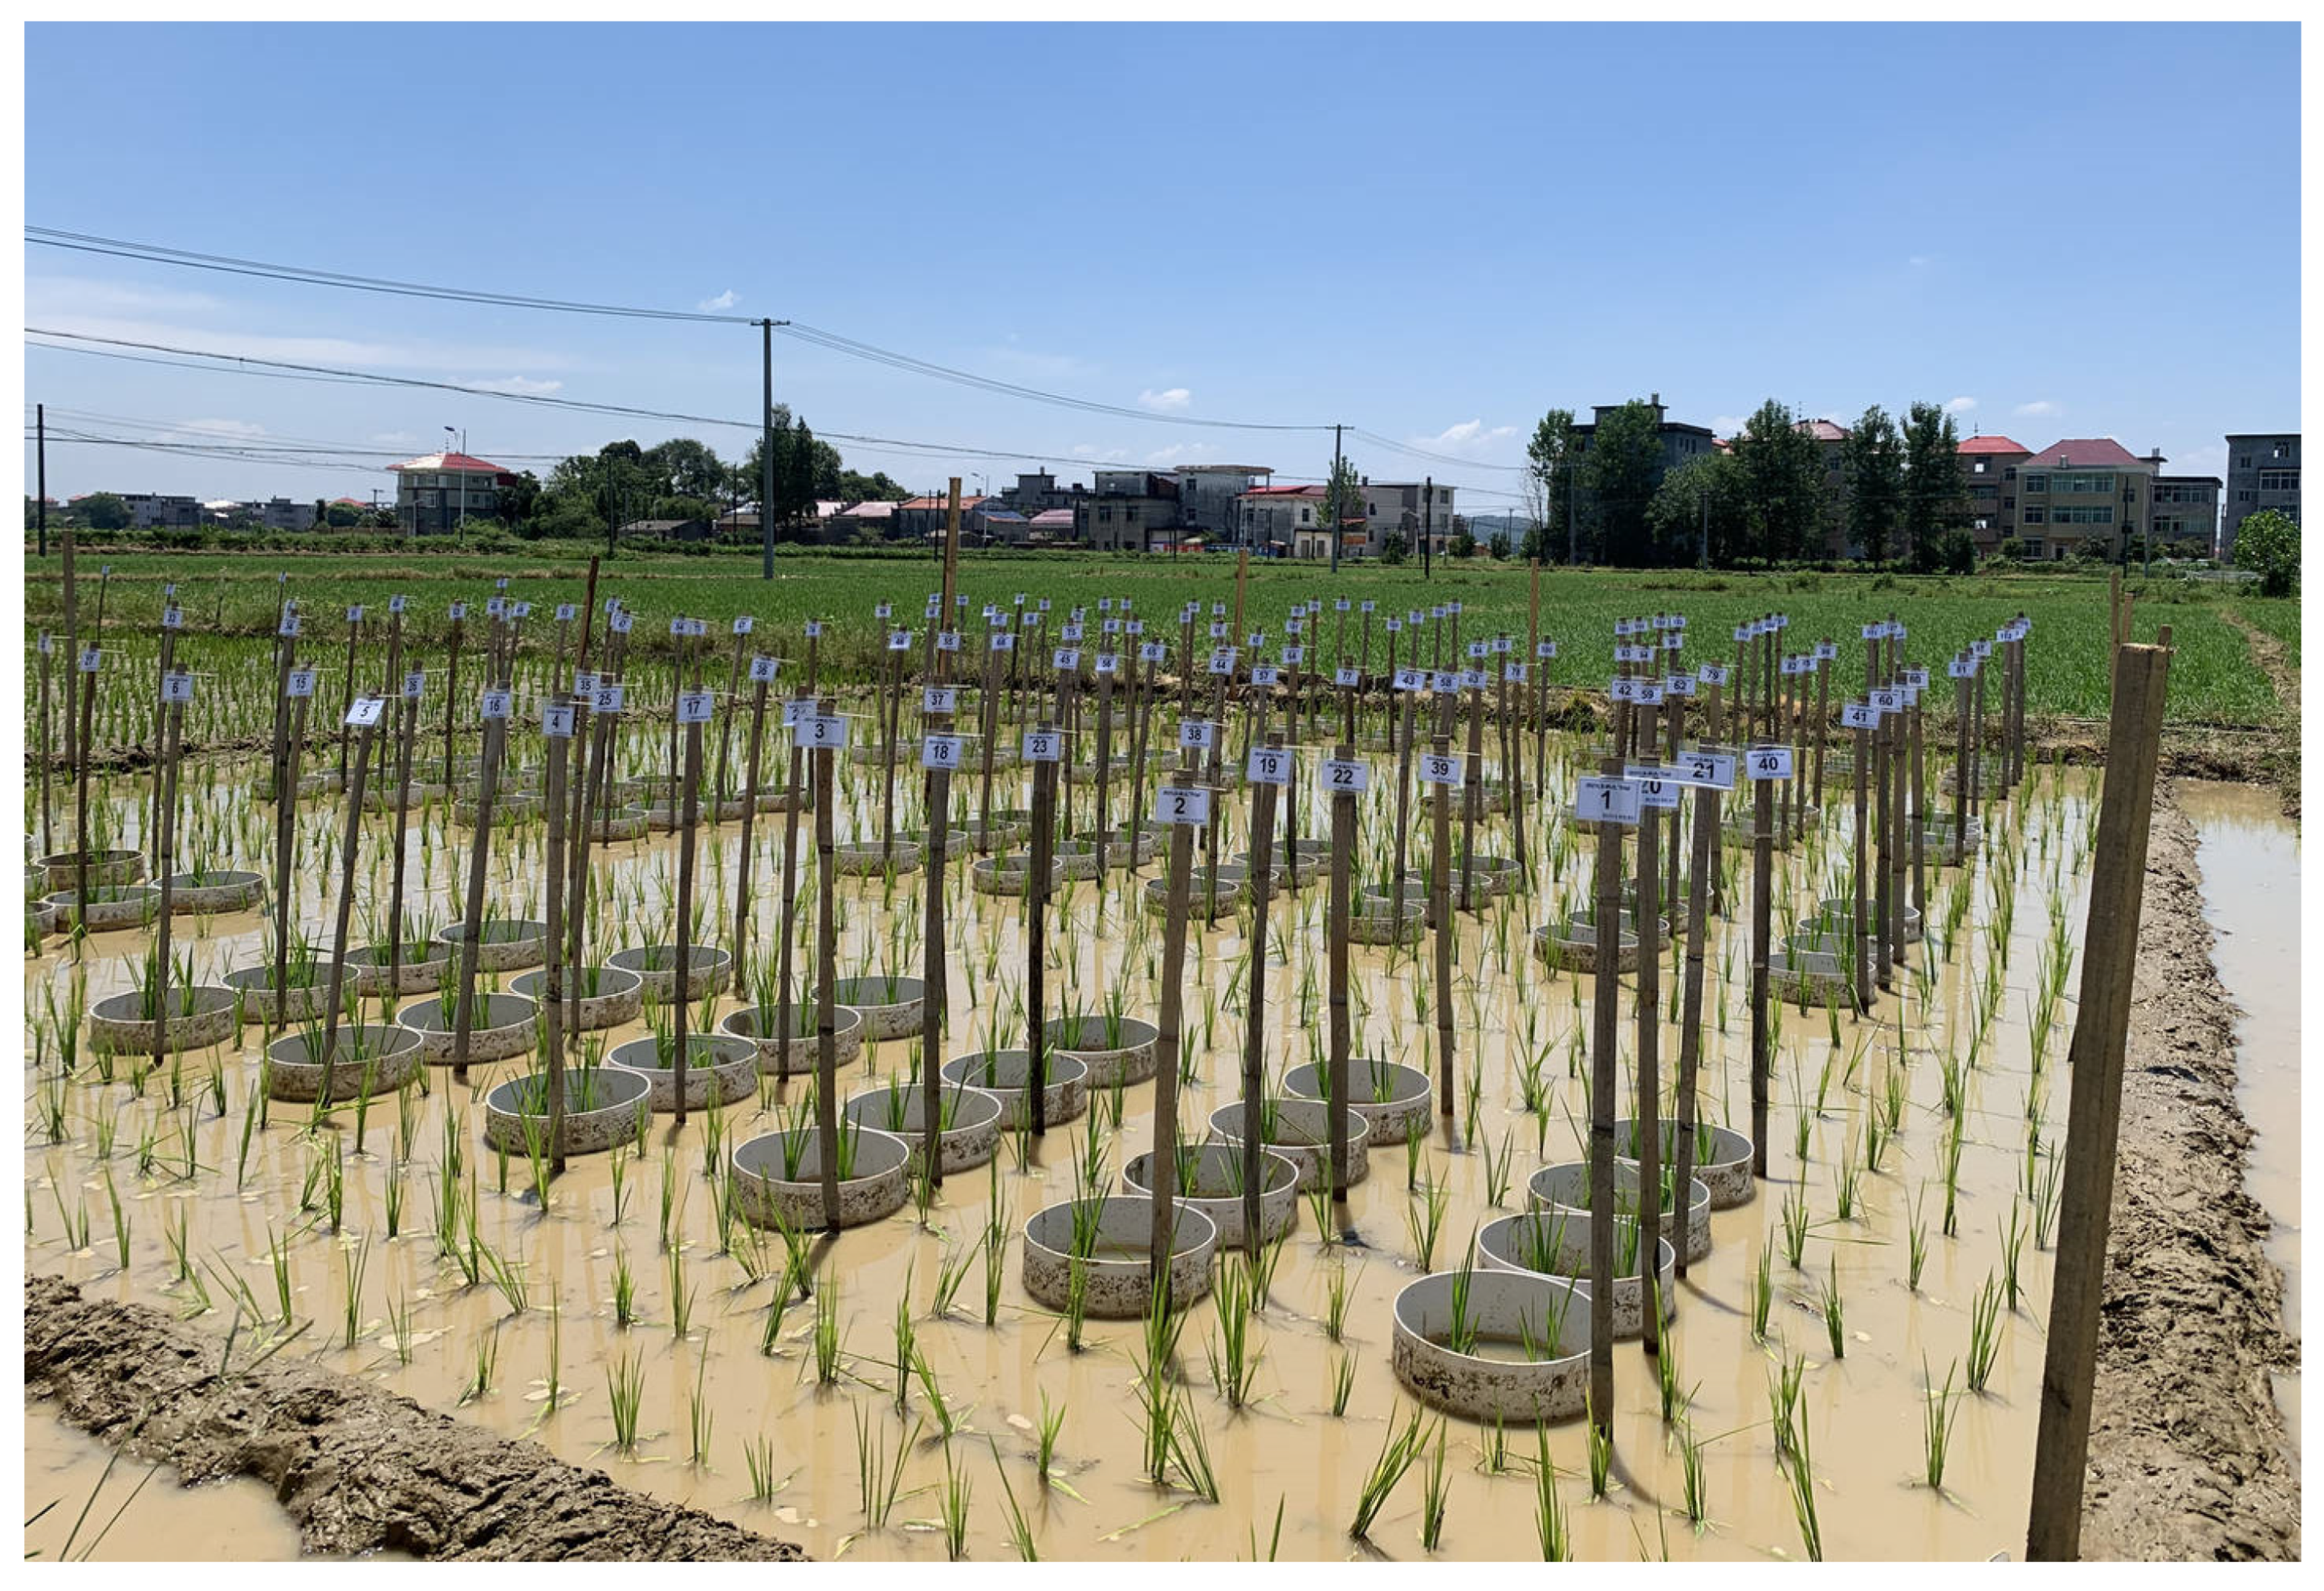
Micro-plot experiment was arranged in a split-plot design with four replications in 2021 (Figure 2). The main plots were two N application rates, including 165 kg ha−1 (N165) and 225 kg ha−1 (N225). Split plots were two contrasting varieties selected from the former field experiments according to variances of grain N content across N application rates and years, namely Y-liangyou 911 (small variance) and Yexiangyoulisi (large variance). In addition, in order to quantify the subdivision of grain N accumulation derived from basal, tillering and panicle N fertilizers, 15N-labelled urea was applied in basal fertilizer only (T1), tillering fertilizer only (T2), and panicle fertilizer only (T3). The 15N-labelled analytic urea (46% N) has an isotopic abundance of 20%, provided by the Shanghai Research Institute of Chemical Industry, China. Besides, the rest of the N sources were from the ordinary urea with 46% N. Pre-germinated seeds were sown in seedbeds on June 25. Sixty-four bottomless PVC tubess (inner diameter of 30 cm, height of 30 cm) were installed to a depth of 20 cm below the soil surface before transplanting. Uniform seedings were manually transplanted to each tube on July 20. Each tube was arranged with two hills and the hill spacing was 25 cm with 2 seedlings per hill. Meanwhile, three borders around each tube were also transplanted with corresponding planting density to minimize border effects. N fertilizer was applied in three splits: 50% at one day before transplanting, 30% at seven days after transplanting, and 20% at panicle initiation. The total potassium (K2O) fertilizer was 165 kg ha−1 and applied in two splits: 50% at one day before transplanting, and 50% at panicle initiation; the total phosphate (P2O5) fertilizer was 82.5 kg ha−1 and all applied at one day before transplanting. Field managements including water regime, weeds, insects, and pathogens were consistent with the above-mentioned field experiments.

2.3. Sampling and Measurements

At maturity, six representative hills from each split plot in field experiments and all plants in each pot in the micro-plot experiment were harvested. Panicles were counted to calculate panicle number per m2, and then threshed manually. Filled spikelets were separated from unfilled spikelets by submerging them in tap water. Dry weights of straw (including pedicels), filled and unfilled spikelets were measured after being oven-dried at 70 °C to a constant weight. Three subsamples of 30 g filled spikelets and all unfilled spikelets were taken to count the number of spikelets per panicle. Grain setting rate was calculated as 100× number of filled spikelets/total number of spikelets. In the field experiments, grain yields were determined from 50 hills in each subplot and were adjusted to the standard moisture content of 13.5%. The grain (brown rice) N content was determined by fully automatic Kjeldahl apparatus (Kjeltec 8400, FOSS Analytical A/S, Hilleroed, Denmark). The coefficients of variation (CVs) were calculated as the ratio of standard deviation to average.
In the micro-plot experiment, the filled grains (brown rice) and straw (including unfilled grains) were ground using a mixer mill homogenizer (MM 400, Retsch GmbH, Haan, Germany) to determine N content and 15N abundance with an NC analyzer (IsoPrime 100 IRMS, Isoprime Ltd., Cheadle Hulme, UK). Total N accumulation of grain or straw (dry weight of grains or straw × N concentration of grain or straw), N accumulation from 15N labelled fertilizer by grains or straw [dry weight of grain or straw × (15N abundance in grain or straw − background)/(15N abundance in fertilizer − background)] were calculated, in which background 15N abundance was 0.365%. 15N labelled fertilizer recovery rate [100 × (15N abundance in plants − background)/(15N abundance in fertilizer − background)], N harvest index of 15N labelled fertilizer [100 × (total N accumulation from 15N labelled fertilizer by grain)/(total N accumulation from 15N labelled fertilizer by plants)] and the ratio of N accumulation from 15N labeled fertilizer by grain or straw to total N accumulation [100 × (total N accumulation from 15N labelled fertilizer by grain or straw)/(total N accumulation of grain or straw)] were calculated.

2.4. Statistical Analysis

Analysis of variance (ANOVA) and Pearson correlation analysis were performed using Statistix 8.0 (Analytical Software, Tallahassee, FL, USA). Means between N application rates, varieties and their interaction were compared based on the least significant (LSD) test at the 5% level of significance. Graphs were drawn using Origin 2018 (OriginLab Corp, Northampton, MA, USA).

3. Results

3.1. Grain N Content and Its Variance

In the field experiments, N application rate, variety and their interaction had significant effects on the grain N content of high-quality rice. The grain N contents of all high-quality rice varieties increased with the increasing N application rate in 2019 and 2020 (Table 2). In 2019, the averages of grain N content across varieties were 1.01% (ranged from 0.99% to 1.11%), 1.14% (ranged from 1.03% to 1.28%), and 1.32% (ranged from 1.22% to 1.45%) at N105, N165, and N225, respectively. Correspondingly, the coefficients of variation (CVs) were 6.20%, 5.10%, and 5.09%. In 2020, the averages of grain N content across varieties were 1.20% (ranged from 1.07% to 1.45%), 1.37% (ranged from 1.23% to 1.56%), and 1.55% (ranged from 1.39% to 1.74%) at N105, N165, and N225, respectively, and the corresponding CVs were 8.21%, 8.07%, and 7.92%. Compared with N105, the average grain N content of all varieties under N165 and N225 increased by 12.87% and 30.69% in 2019, and by 14.17% and 29.17% in 2020, respectively.
The averages of grain N content of each variety across three N application rates ranged from 1.06% to 1.25% in 2019 and from 1.25% to 1.56% in 2020. Obviously, the grain N content of each variety under three N application rates was significantly higher in 2020 than that in 2019. Combined the two years and three N application rates, the grain nitrogen content of each variety was 1.17–1.38% and the corresponding CVs ranged from 10.36% to 21.26%, of which Y-liangyou 911 showed the smallest CV, and Leiyou1068, Yueyousimiao, Yexiangyoulisi, Meitezhan, Wanxiangyou 982 and Yexiangyoubasi had the largest CV, and the rest of the varieties had a medium CV.

3.2. Yield, Relationship of Grain N Content with Yield and Its Components in Field Experiments

In the field experiments, N application rate had significant effects on grain yield of high-quality rice. With the increasing N application rate, the trends of grain yield of high-quality rice varieties were not consistent between the two years (Table 3). In 2019, the averages of grain yield across varieties were 7.29 t ha−1 (ranged from 6.64 to 7.80 t ha−1), 8.04 t ha−1 (ranged from 7.31 to 8.78 t ha−1), and 8.13 t ha−1 (ranged from 7.37 to 9.47 t ha−1) at N105, N165, and N225, respectively. With the increase of N application, the yields of Taiyou 553, Meixiangzhan 2, Wanxiangyouhuazhan, Xiangyaxiangzhen, Wanxiangyou 982, Meitezhan and Yueyousimiao showed a trend of increasing and then decreasing, while the yields of other varieties showed a positive relationship with N application. In 2020, the averages of grain yield across varieties were 6.67 t ha−1 (ranged from 5.74 to 7.55 t ha−1), 7.32 t ha−1 (ranged from 6.27 to 8.26 t ha−1), and 6.77 t ha−1 (ranged from 5.32 to 8.71 t ha−1) at N105, N165, and N225, respectively. With the increase of N application, the yields of Y-liangyou 911, Changyouhuazhan, and Taoyouxiangzhan increased, while the yields of other varieties showed a trend of increasing and then decreasing. Compared with N105, the average grain yield of all varieties under N165 and N225 increased by 10.29% and 11.52% in 2019, and by 9.75% and 1.50% in 2020, respectively. Obviously, the grain yields of each variety under three N application rates were significantly higher in 2020 than those in 2019.
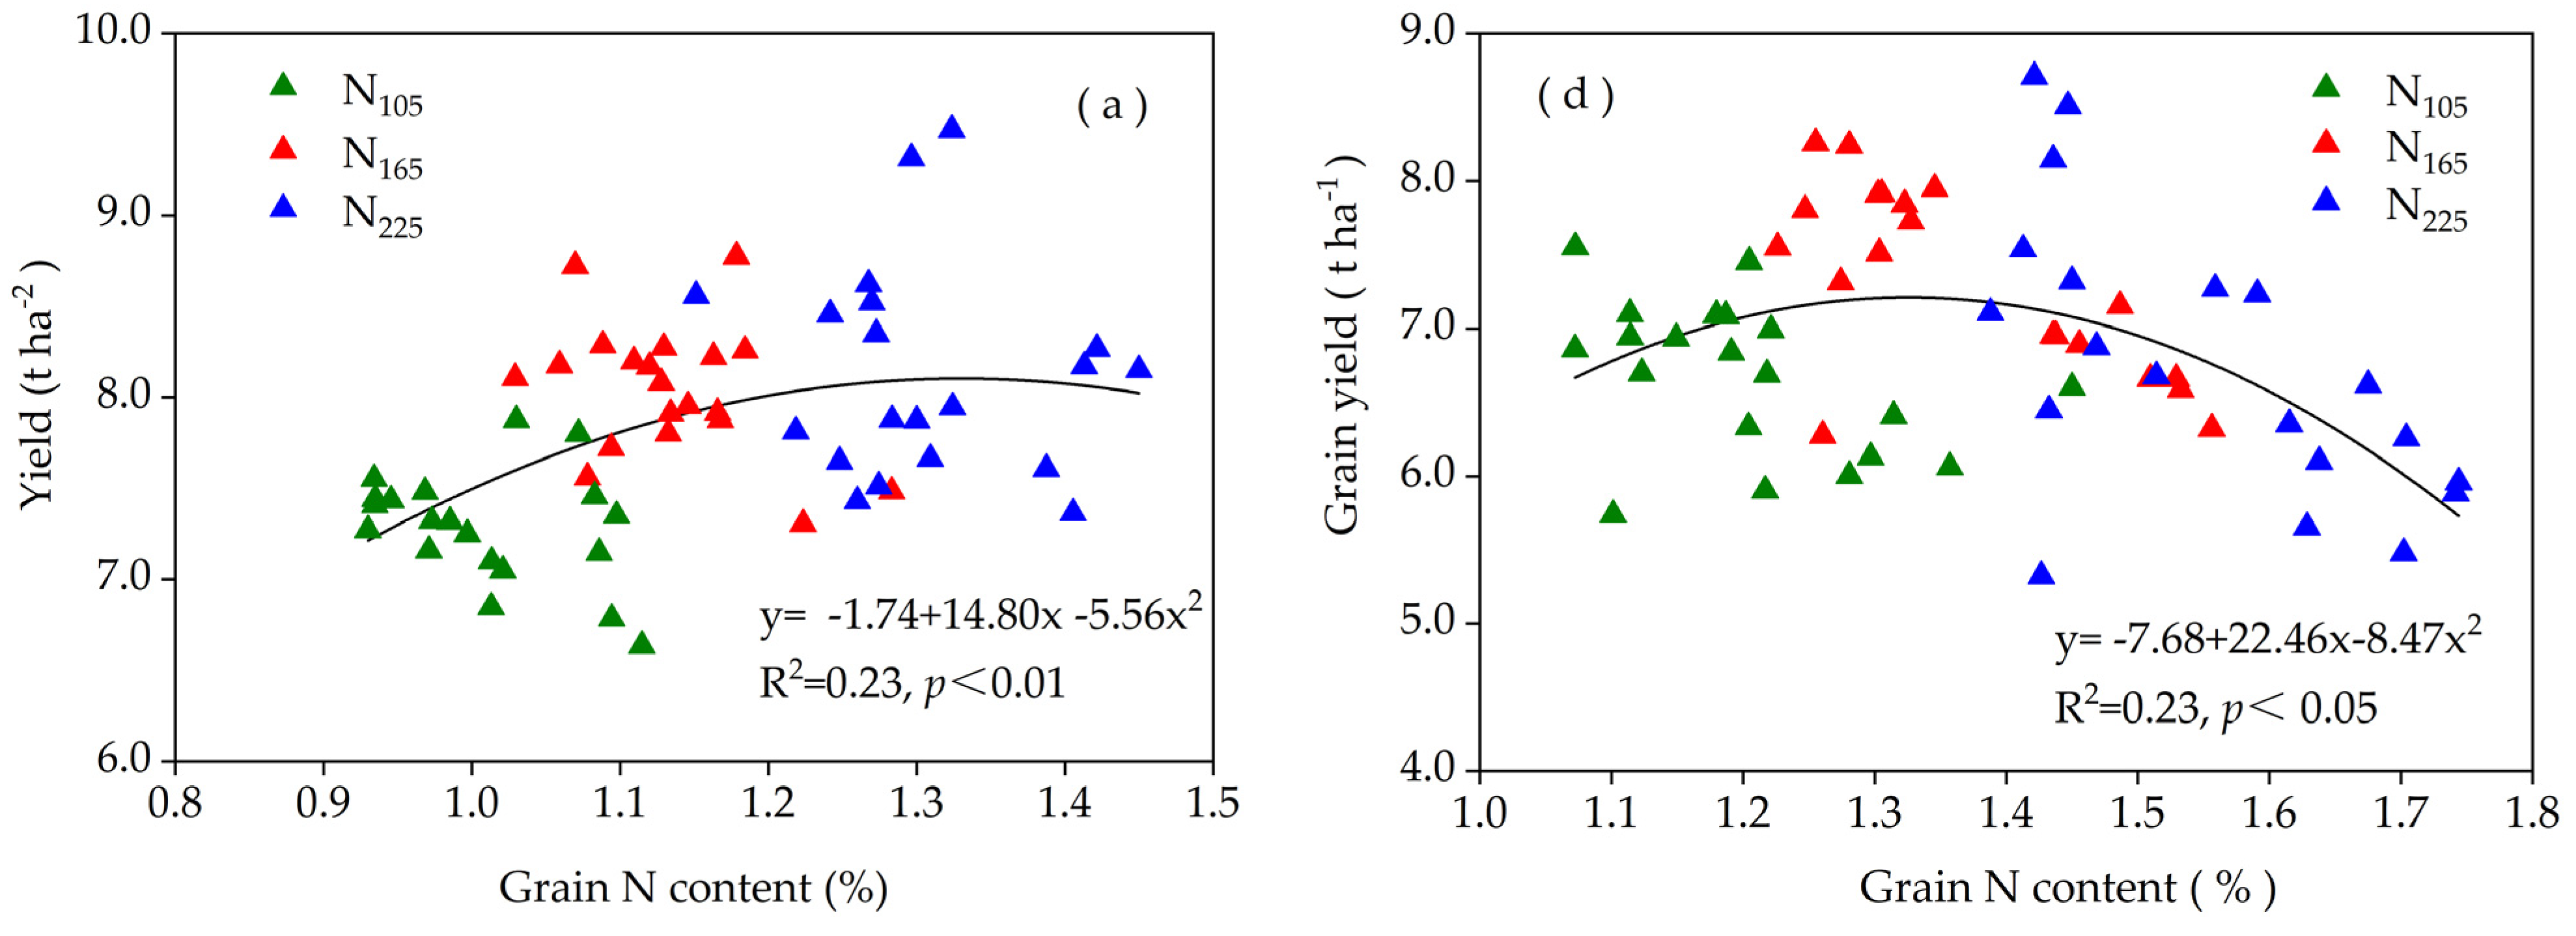
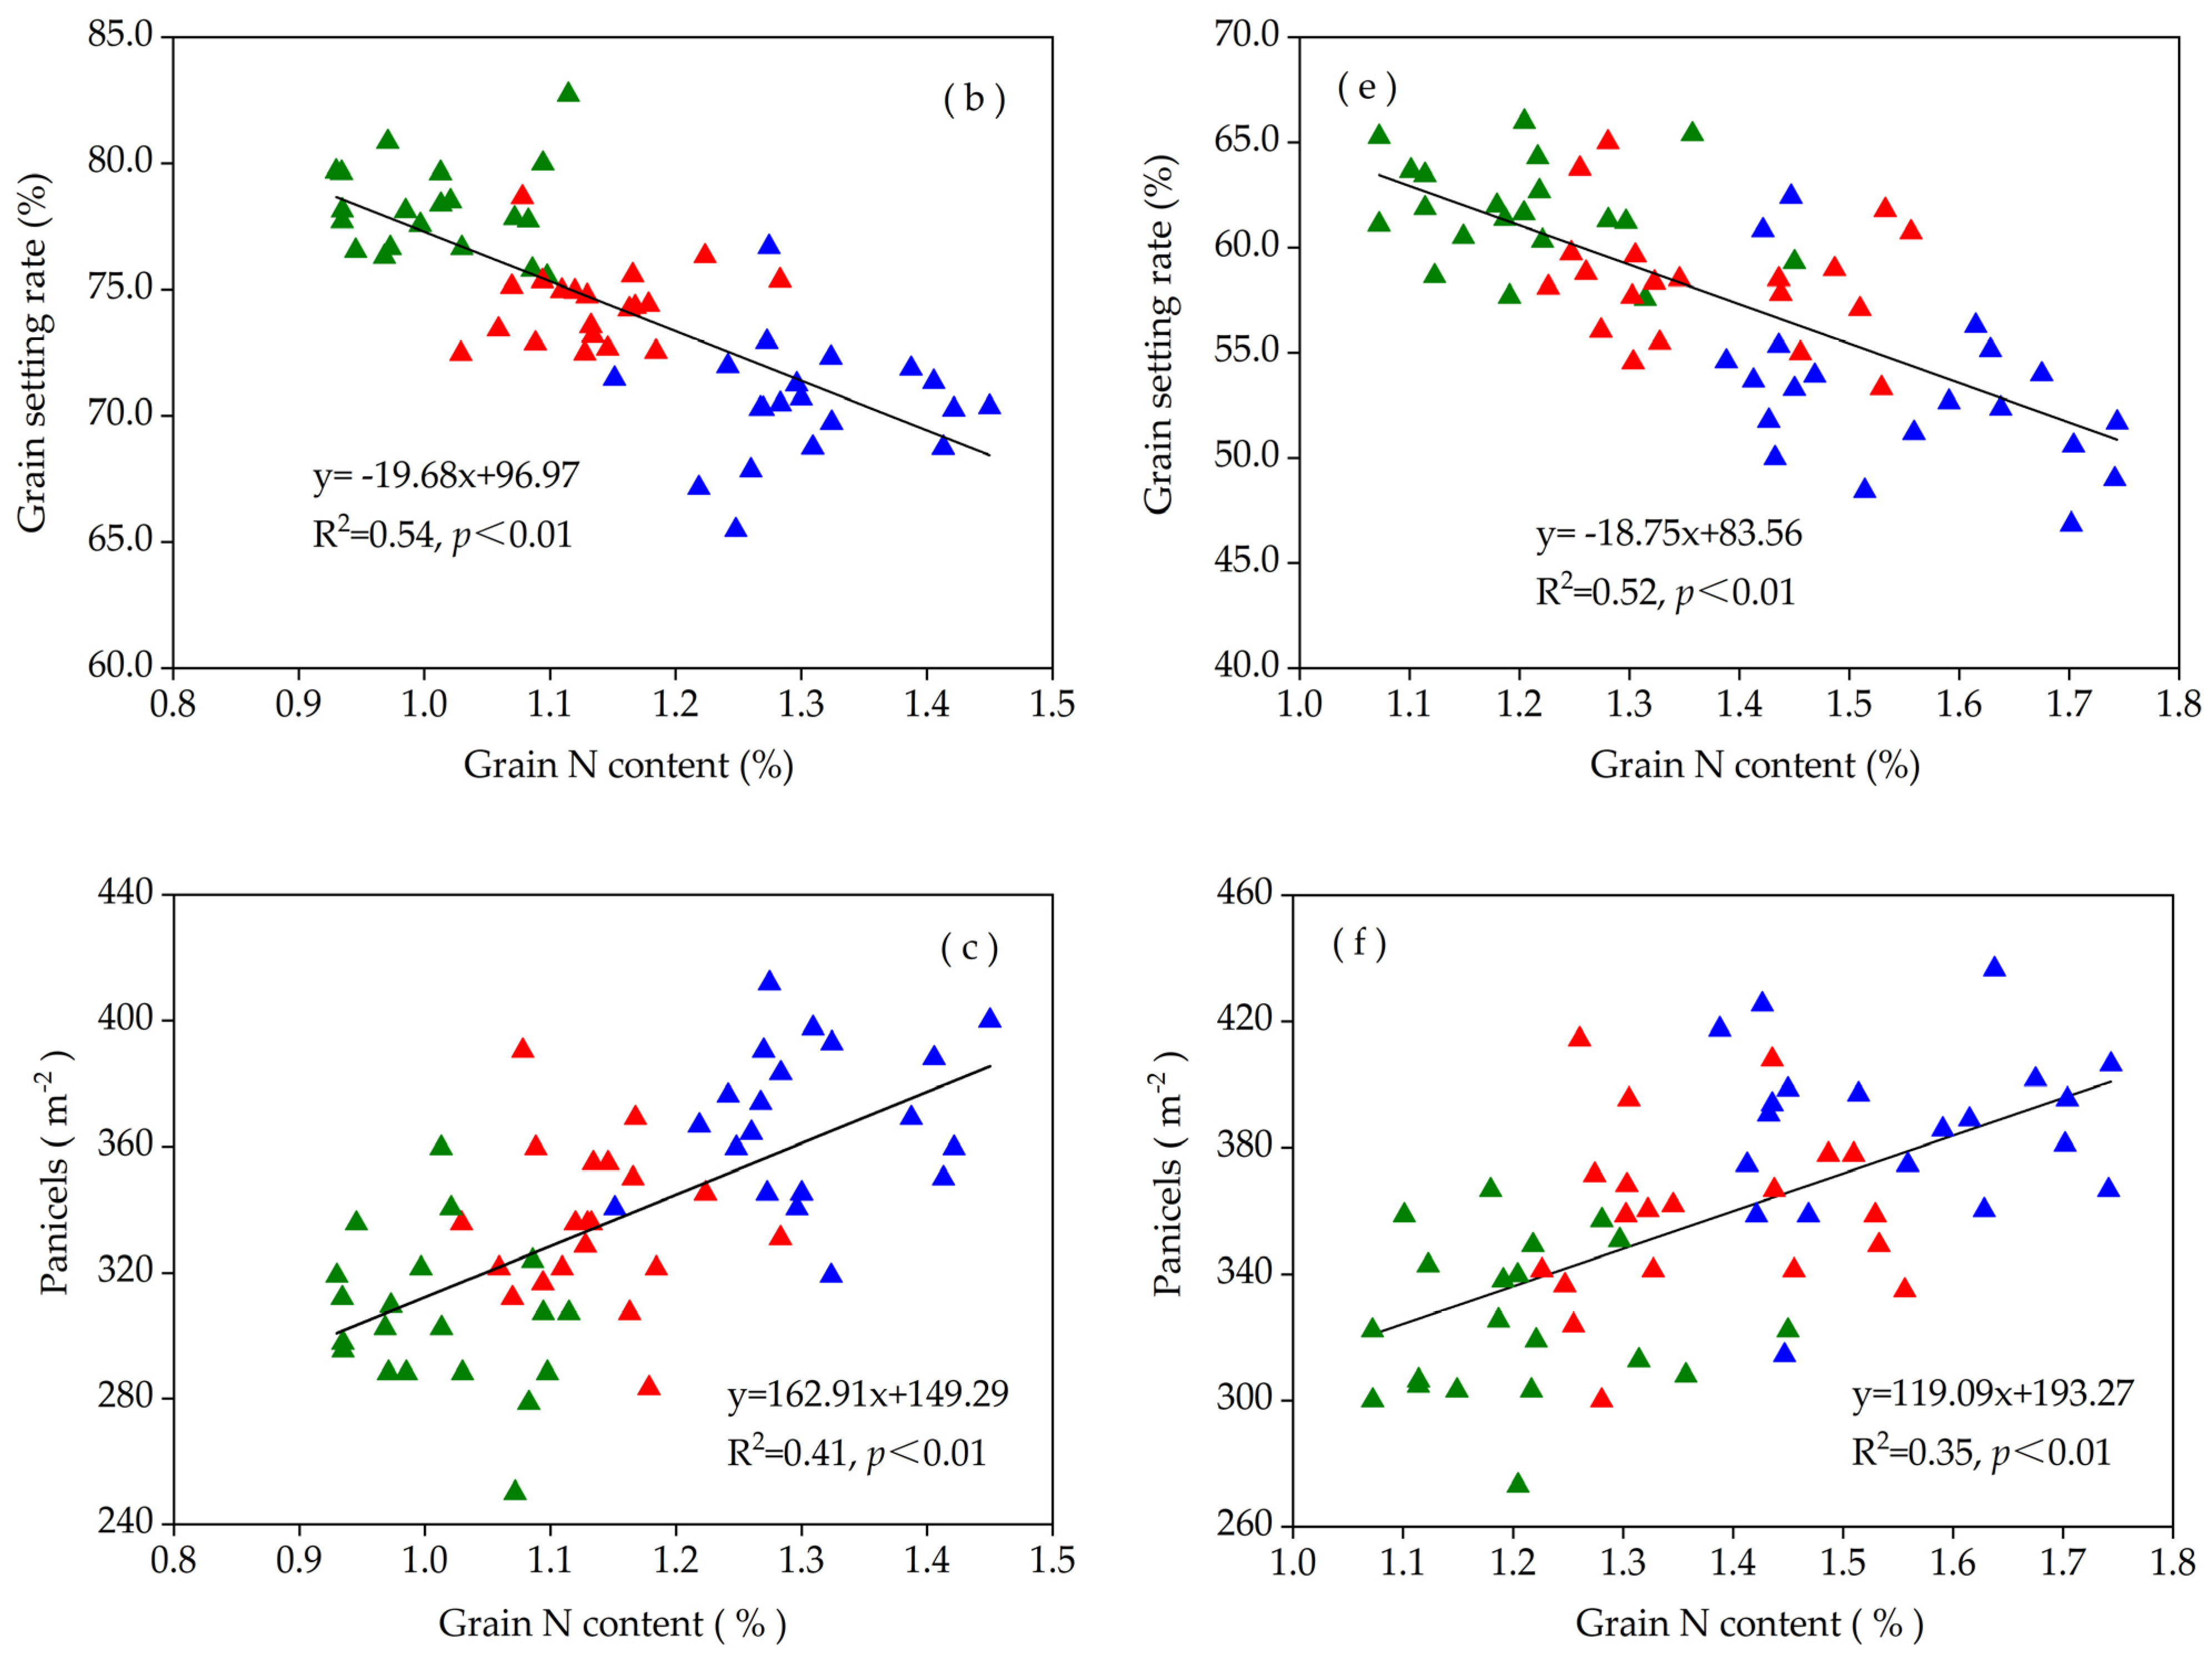
In the field experiments, there was a significant quadratic relationship between grain yield and grain N content, while panicles m−2 and grain setting rate had a positive and a negative linear correlation with grain N content, respectively, in both 2019 and 2020 (Figure 3). Except for the same coefficient of determination (R2) of grain yield and grain N content (0.23), the coefficients of determination (R2) of panicles m−2 and grain setting rate with grain N content in 2019, respectively, were larger than those in 2020. The panicles m−2 increased with the increase of grain N content at three N application rates, while the grain setting rate decreased.

3.3. Yield and Grain N Accumulation in Micro-Plot Experiment

N application rate and variety had significant effects on yield and its components, biomass and harvest index, and their interactions significantly influenced yield, spikelets per panicle, 1000-grain weight, and biomass (Table 4). Compared with N165, N225 significantly increased yield of Y-liangyou 911 by 8.22% but did not have significant effects on the yield of Yexiangyoulisi. Although N225 significantly increased panicles per m2, it also led to significant decrease in spikelets per panicle, grain setting rate, and 1000-grain weight. Compared with N165, N225 significantly increased biomass of Y-liangyou 911 and Yexiangyoulisi by 11.58% and 5.94%, respectively, while the harvest index decreased significantly by 2.9 and 3.2 percentage points, respectively. Y-liangyou 911 produced 9.89% higher yield than Yexiangyoulisi due to more spikelets per unit area (panicles per m2 × spikelets per panicle), higher grain setting rate, and heavier 1000-grain weight as well as higher biomass and harvest index.
In comparison with N165, N225 significantly increased grain N content by 9.23–11.36%, and total grain N accumulation by 12.63–21.20% for two high-quality varieties (Table 5). Meanwhile, grain N accumulation derived from basal (T1), tillering (T2), and panicle fertilizer (T3) were significantly increased by 32.35–50.56%, 59.49–83.10%, and 34.07–36.30% under N225 than those under N165, respectively. Correspondingly, the ratios of grain N accumulation derived from basal, tillering, and panicle fertilizer to total N accumulation were significantly increased by 11.82–33.58%, 35.17–61.71%, and 11.98–18.62%, respectively.
Compared with Yexiangyoulisi, Y-liangyou 911 had obviously lower grain N content by 3.19% and higher total grain N accumulation by 10.19% under N225, respectively, but slight differences were observed between two varieties under N165. On the contrary, Y-liangyou 911 had significantly higher grain N accumulation derived from basal and tillering fertilizer than Yexiangyoulisi under N165, there was no difference in grain N accumulation derived from panicle fertilizer under N165 and from all fertilizes under N225 for two varieties. Similarly, Y-liangyou 911 had significantly higher ratios of grain N accumulation from basal, tillering fertilizer to total N accumulation than Yexiangyoulisi under N165. However, the ratios of grain N accumulation derived from panicle fertilizer to total N accumulation under N165 and from all fertilizers under N225 were significantly lower in Y-liangyou 911 than in Yexiangyoulisi.
The N recovery rates of 15N-labeled basal, tillering and panicle fertilizers were significantly improved, whereas the N harvest indexes of 15N labeled fertilizers were significantly reduced under N225 than under N165 in two varieties (Table 6). Y-Liangyou 911 had significantly higher N recovery rates of 15N-labeled basal, tillering fertilizers than Yexiangyoulisi under N165, but there was no difference in N recovery rates of 15N-labeled panicle fertilizer under N165 and of 15N-labeled basal, tillering and panicle fertilizers under N225 between two varieties. Significant lower N harvest indexes of 15N-labeled basal and tillering fertilizers were observed in Y-Liangyou 911 than in Yexaingyoulisi under N225.

4. Discussion

4.1. Variances of Grain N Content and Its Correlation with Yield and Yield Components in Rice

In this study, the grain N content of each high-quality rice variety significantly increased with the increase of N application rates, and significant differences in grain N content across varieties and years were observed (Table 2). The increased grain N content and differences between varieties and years were mainly attributable to an increase in N application rate, variety characteristics and environmental factors during rice growth [17,26]. Previous studies have shown that appropriate increase of N fertilizer could increase grain N content, N use efficiency and yield of rice [27,28]. In addition, low temperature and low light stress during the grain-filling stage would increase grain N content but reduce yield and quality of rice [26,29]. We also found that the average grain N content of each high-quality variety under the three N application rates was 2.97–37.65% higher in 2020 than that in 2019. This may be attributed to obviously lower temperature (3.77 °C per day) and solar radiation (3.28 MJ m−2 per day) from heading to maturity in 2020 than in 2019.
Accordingly, averaged three N application rates and two years, the grain N content of each variety ranged from 1.17% to 1.38% and the corresponding CVs ranged from 10.36% to 21.26%, of which Y-liangyou 911 showed the smallest CV, and Leiyou1068, Yueyousimiao, and Yexiangyoulisi showed the largest CVs (Table 2). These results indicated that responses of high-quality rice varieties to N application rates and years were different. Previous studies showed that grain N content or protein content of rice had a close relationship with grain quality, either too high or too low grain N contents were all adverse to the improvement of eating quality [28,29]. Further analysis showed that panicles m−2 and grain setting rate had a positive and a negative linear correlation with grain N content, respectively, in both 2019 and 2020 (Figure 3). These results indicated that with the increase of nitrogen application, the grain N content increased, which led to the increase of panicles m−2 and the decrease of the grain-setting rate, thus affecting the stability of yield and quality. Therefore, determining the N application rate aimed to balance yield and quality should consider the CV of grain N content of high-quality rice.
Significant effects of N application rates on the yield, N use efficiency and quality of high-quality rice have been observed, but these results are not consistent because of the different N managements, genotypes, and growth conditions [30,31]. We found that the yield of each variety increased with the increase of N application, but the trend of increase was not consistent among varieties, which was consistent with the previous studies. The yields of Y-liangyou 911, Changyouhuazhan, and Taoyou xiangzhan increased with the increase of N application rates (from 105 to 225 kg N ha−1), while the rest of the varieties showed yield increase from 105 to 165 kg N ha−1 and then the yield decreased at 225 kg N ha−1. The increasing yields of these varieties with the increase of N application rates were mainly attributable to an increase in biomass with a smaller CV of grain N content. Interestingly, there was a significant quadratic relationship between grain yield and grain N content at different N application rates (Figure 3). These results indicated that the increase in grain N content of high-quality rice due to surplus N fertilizer input will lead to decline in yields and lower quality. Meanwhile, this study found that high-yielding varieties generally had lower grain N content compared to low-yielding varieties, which may be related to a dilution effect of grain N accumulation caused by the high yield achieved in high-yielding varieties.

4.2. Grain N Accumulation and Utilization under Different N Application Rates

Studies have shown that there are many factors affecting grain yield and grain N accumulation as well as NUE, including N application rates [32], fertilizer types [33], and deep placement of N fertilizer [34]. Among these, N application rate is an effective and commonly way to improve grain N accumulation and NUE. A suitable amount of N application can not only improve rice growth and yield, but also facilitate N absorption, accumulation and utilization, while a surplus N application can result in decreasing N use efficiency and severe environmental pollution [35].
In this study, grain N content, total grain N accumulation, grain N accumulation derived from fertilizers, and the ratios of grain N accumulation derived from fertilizers to total grain N accumulation were significantly higher in N225 than in N165 for Y-liangyou 911 and Yexiangyoulisi (Table 4). In addition, the grain N accumulation derived from panicle fertilizer and its ratios to total grain N accumulation were markedly comparable with those derived from basal and tillering fertilizers (Table 5). Similar results were reported by Liang et al. [32], who reported that the N application rate (210–260 kg N ha−1) remarkably improved grain yield and NUE of rice as well as maintained good rice quality. In addition, Wang et al. [36] found that no significant increase in yield and aboveground N accumulation were observed when N application rates surpassed 130 or 170 kg ha−1. These results are consistent with previous studies and suggest that applying panicle N fertilizer plays a vital role in increasing grain N accumulation [25,37]. However, except for panicle fertilizer, in comparison with N165, the grain N accumulation derived from basal and tillering fertilizers in N225 increased by 32.35–50.56% and 59.49–83.10% for Y-liangyou 911 and Yexiangyoulisi, respectively. Meanwhile, a similar trend for the ratios of grain N accumulation derived from basal and tillering fertilizers to total grain N accumulation was observed for the two varieties. These results demonstrated that Yexiangyoulisi had a greater variation in grain N content than Y-liangyou 911 mainly due to the increase of basal and/or tillering fertilizers with increasing N application levels.
Previous studies have stated that the recovery rates of basal, tillering and panicle N fertilizers in rice are 9–36%, 13–42%, and 32–82%, respectively, which were affected by rice genotypes, N and water managements [25,38]. In this study, the recovery rates of basal, tillering and panicle N fertilizers for the two varieties were 19.26–22.25%, 24.89–31.72% and 67.60–70.97%, respectively (Table 6). Nevertheless, N225 increased the recovery rates of basal, tillering and panicle N fertilizers compared with N165, which was similar to the results reported by Chen et al. [39]. On the contrary, researchers have found that almost the recovery rates of basal, tillering and panicle N fertilizer are decreased with increasing N application rates [37]. In addition, compared with Yexiangoulisi, Y-liangyou 911 had higher N recovery rates of basal and tillering fertilizers under N165, but the difference in N recovery rate of panicle fertilizer between two varieties was minor. This result indicated that Y-liangyou 911 absorbed more basal and/or tillering fertilizers N than Yexiangoulisi, which was mainly attributed to the former producing 9.89% higher yield than the latter. Wang et al. [37] also obtained a similar result that the variety with high fertilizer-N recovery efficiency (FNRE) absorbed more basal fertilizer N compared with the variety with low FNRE and had significantly greater basal-FNRE. Meanwhile, we found that the N harvest indexes of 15N labeled fertilizers were significantly reduced under N225 than under N165 in two varieties (Table 6). This is mainly because both plant and grain N accumulation increased with the increase of N application, but the increase of the former was more significant. Similar results were reported by Lin et al. [40], who reported that within the range of 150–210 kg ha−1, the N application rate increased, and the N harvest index decreased. Thus, the N application rate of 165 kg ha−1 can maintain an appropriate grain N content and achieve higher grain yield as well as agronomic N-use efficiency of high-quality rice.

5. Conclusions

The grain N content of high-quality rice increased with the increase of N application rates, while the response of yield to N application rates was inconsistent. There was a significant correlation between grain N content and grain setting rate, panicles m−2 and yield. Compared with N165, grain N content, total grain N accumulation, grain N accumulation derived from fertilizers and N recovery rate increased under N225 for two varieties with contrasting CV of grain N content. In addition, Yexiangyoulisi (with a larger CV of grain N content) had a greater response to increasing N application rates than Y-liangyou 911 (with a smaller CV of grain N content) related to grain N accumulation derived from basal and tillering N fertilizers and its ratios to total grain N accumulation. Overall, the high-quality indica rice may maintain an appropriate grain N content and obtain higher yield and N use efficiency as well as better quality at moderate N application rate (165 kg ha−1). Moderately reducing basal and/or tillering N fertilizers is very necessary for those varieties with a larger CV of grain N content.

Author Contributions

Conceptualization, X.X. and X.P.; Investigation, J.W. (Jiale Wu), R.Q., W.Q., G.D. and J.W. (Jingjing Wu); Data curation, J.W. (Jiale Wu); Writing—original draft preparation, J.W. (Jiale Wu) and R.Q.; Writing—review and editing, X.X. and W.Q.; Funding acquisition, X.X., Y.Z. and X.P. All authors have read and agreed to the published version of the manuscript.

Funding

This study was supported by the Earmarked Fund for Jiangxi Agricultural Research System (Grant No. JXARS-04), the National Natural Science Foundation of China (Grant No. 31971847), and the Science and Technology Research Project of Education Department of Jiangxi Province (Grant No. GJJ190170).

Institutional Review Board Statement

Not applicable.

Informed Consent Statement

Not applicable.

Data Availability Statement

The data reported in this study is contained within the article.

Conflicts of Interest

The authors declare no conflict of interest.

References

  1. Cheng, S.; Cao, L.; Zhuang, J.; Chen, S.; Zhan, X.; Fan, Y.; Zhu, D.; Min, S. Super hybrid rice breeding in China: Achievements and prospects. J. Integr. Plant Biol. 2007, 49, 805–810. [Google Scholar] [CrossRef]
  2. Wang, F.; Peng, S. Yield potential and nitrogen use efficiency of China’s super rice. J. Integr. Agric. 2017, 16, 1000–1008. [Google Scholar] [CrossRef] [Green Version]
  3. Cong, X.; Shi, F.; Ruan, X.; Luo, R.; Ma, Y.; Luo, Z. Effects of nitrogen fertilizer application rate on nitrogen use efficiency and grain yield and quality of different rice varieties. Chin. J. Appl. Ecol. 2017, 28, 1219–1226. [Google Scholar]
  4. Zhou, T.; Li, Z.; Li, E.; Wang, W.; Yuan, L.; Zhang, H.; Liu, L.; Wang, Z.; Gu, J.; Yang, J. Optimization of nitrogen fertilization improves rice quality by affecting the structure and physicochemical properties of starch at high yield levels. J. Integr. Agric. 2022, 21, 1576–1592. [Google Scholar]
  5. Peng, S.; Gurdev, S.K.; Parminder, V.; Tang, Q.; Zou, Y. Progress in ideotype breeding to increase rice yield potential. Field Crops Res. 2008, 108, 32–38. [Google Scholar] [CrossRef]
  6. Cui, Z.; Zhang, H.; Chen, X.; Zhang, C.; Ma, W.; Huang, C.; Zhang, W.; Mi, G.; Miao, Y.; Li, X. Pursuing sustainable productivity with millions of smallholder farmers. Nature 2018, 555, 363–366. [Google Scholar] [CrossRef]
  7. Tang, L.; Xu, Z.; Chen, W. Advances and prospects of super rice breeding in China. J. Integr. Agric. 2017, 16, 984–991. [Google Scholar] [CrossRef]
  8. Lin, H.; Wang, Z.E.Z.; Li, H.; Pang, Q. Analysis on characteristics of rice varieties registered in China in 2018. China Rice 2019, 25, 65–71. (In Chinese) [Google Scholar]
  9. Zhao, Z.; Dai, L.; Huang, J.; Pan, X.; You, A.; Zhao, Q.; Chen, G.; Zhou, Z.; Hu, W.; Ji, L. Status, problems and solution in rice industry development in the middle reaches of the Yangtze River. Chin. J. Rice Sci. 2019, 33, 553–564. (In Chinese) [Google Scholar]
  10. Cheng, B.; Jiang, Y.; Cao, C. Balance rice yield and eating quality by changing the traditional nitrogen management for sustainable production in China. J. Clean. Prod. 2021, 312, 127793. [Google Scholar] [CrossRef]
  11. Wei, H.; Meng, T.; Li, X.; Dai, Q.; Zhang, H.; Yin, X. Sink-source relationship during rice grain filling is associated with grain nitrogen concentration. Field Crops Res. 2018, 215, 23–38. [Google Scholar] [CrossRef]
  12. Kashiwagi, T. Effects of rice grain protein QTL, TGP12, on grain composition, yield components, and eating quality with different nitrogen applications. Field Crops Res. 2021, 263, 108051. [Google Scholar] [CrossRef]
  13. Zhang, J.; Tong, T.; Potcho, P.M.; Huang, S.; Ma, L.; Tang, X. Nitrogen effects on yield, quality and physiological characteristics of giant rice. Agronomy 2020, 10, 1816. [Google Scholar] [CrossRef]
  14. Che, S.; Zhao, B.; Li, Y.; Yuan, L.; Li, W.I.; Lin, Z.; Hu, S.; Shen, B. Review grain yield and nitrogen use efficiency in rice production regions in China. J. Integr. Agric. 2015, 14, 2456–2466. [Google Scholar] [CrossRef]
  15. Ju, C.; Zhu, Y.; Liu, T.; Sun, C. The effect of nitrogen reduction at different stages on grain yield and nitrogen use efficiency for nitrogen efficient rice varieties. Agronomy 2021, 11, 462. [Google Scholar] [CrossRef]
  16. Peng, J.; Feng, Y.; Wang, X.; Li, J.; Xu, G.; Somsana, P.; Luo, Q.; Han, Z.; Lu, W. Effects of nitrogen application rate on the photosynthetic pigment, leaf fluorescence characteristics, and yield of indica hybrid rice and their interrelations. Sci. Rep. 2021, 11, 7485. [Google Scholar] [CrossRef]
  17. Huang, S.; Zhao, C.; Zhu, Z.; Zhou, L.; Zheng, Q.; Wang, C. Characterization of eating quality and starch properties of two Wx alleles japonica rice cultivars under different nitrogen treatments. J. Integr. Agric. 2020, 19, 988–998. [Google Scholar] [CrossRef]
  18. Zhang, W.; Li, G.; Yang, Y.; Li, Q.; Zhang, J.; Liu, J.; Wang, S.; Tang, S.; Ding, Y. Effects of nitrogen application rate and ratio on lodging resistance of super rice with different genotypes. J. Integr. Agric. 2014, 13, 63–72. [Google Scholar] [CrossRef]
  19. Peng, S.; Buresh, R.J.; Huang, J.; Yang, J.; Zou, Y.; Zhong, X.; Wang, G.; Zhang, F. Strategies for overcoming low agronomic nitrogen use efficiency in irrigated rice systems in China. Field Crops Res. 2006, 96, 37–47. [Google Scholar] [CrossRef]
  20. Galloway, J.N.; Townsend, A.R.; Erisman, J.W.; Bekunda, M.; Cai, Z.; Freney, J.R.; Martinelli, L.A.; Seitzinger, S.P.; Sutton, M.A. Transformation of the nitrogen cycle: Recent trends, questions, and potential solutions. Science 2008, 320, 889–892. [Google Scholar] [CrossRef] [Green Version]
  21. Guo, J.; Liu, X.; Zhang, Y.; Shen, J.; Han, W.; Zhang, W.; Christie, P.; Goulding, K.; Vitousek, P.M.; Zhang, F. Significant acidification in major Chinese croplands. Science 2010, 327, 1008–1010. [Google Scholar] [CrossRef] [PubMed] [Green Version]
  22. Shi, L.; Zhang, X.; Sun, H.; Cao, X.; Liu, J.; Zhang, Z. Relationship of grain protein content with cooking and eating quality as affected by nitrogen fertilizer at late growth stage for different types of rice varieties. Chin. J. Rice Sci. 2019, 33, 541–552. (In Chinese) [Google Scholar]
  23. Haque, A.N.A.; Uddin, M.K.; Sulaiman, M.F.; Amin, A.M.; Hossain, M.; Solaiman, Z.M.; Aziz, A.A.; Mosharrof, M. Combined use of biochar with 15N labelled urea increases rice yield, N use efficiency and fertilizer N recovery under Water-saving irrigation. Sustainability 2022, 14, 7622. [Google Scholar] [CrossRef]
  24. Du, S.; Zhang, Z.; Chen, P.; Li, T.; Han, Y.; Song, J. Fate of each period fertilizer N in Mollisols under water and N management: A 15N tracer study. Agric. Water Manag. 2022, 272, 107872. [Google Scholar] [CrossRef]
  25. Lin, J.; Li, G.; Xue, L.; Zhang, W.; Xu, H.; Wang, S.; Yang, L.; Ding, Y. Subdivision of nitrogen use efficiency of rice based on 15N tracer. Acta Agron. Sin. 2014, 40, 1424–1434. (In Chinese) [Google Scholar] [CrossRef]
  26. Huang, M.; Cao, J.; Liu, Y.; Zhang, M.; Hu, L.; Xiao, Z.; Cao, F. Low-temperature stress during the flowering period alters the source–sink relationship and grain quality in field-grown late-season rice. J. Agron. Crop Sci. 2021, 207, 833–839. [Google Scholar] [CrossRef]
  27. Lan, Y.; Sui, X.; Wang, J.; Duan, Q.; Wu, C.; Ding, C.; Li, T. Effects of nitrogen application rate on protein components and yield of low-gluten rice. Agriculture 2021, 11, 302. [Google Scholar] [CrossRef]
  28. Jahan, A.; Islam, A.; Sarkar, M.I.U.; Iqbal, M.; Ahmed, M.N.; Islam, M.R. Nitrogen response of two high yielding rice varieties as influenced by nitrogen levels and growing seasons. Geol. Ecol. Landsc. 2022, 6, 24–31. [Google Scholar] [CrossRef] [Green Version]
  29. Liu, Q.; Xiu, W.; Chen, B.; Jie, G. Effects of low light on agronomic and physiological characteristics of rice including grain yield and quality. Rice Sci. 2014, 21, 243–251. [Google Scholar] [CrossRef]
  30. Xie, X.; Shan, S.; Wang, Y.; Cao, F.; Chen, J.; Huang, M.; Zou, Y. Dense planting with reducing nitrogen rate increased grain yield and nitrogen use efficiency in two hybrid rice varieties across two light conditions. Field Crops Res. 2019, 236, 24–32. [Google Scholar] [CrossRef]
  31. Zhang, H.; Hou, D.; Peng, X.; Shao, S.; Jing, W.; Gu, J.; Liu, L.; Wang, Z.; Liu, Y.; Yang, J. Optimizing integrative cultivation management improves grain quality while increasing yield and nitrogen use efficiency in rice. J. Integr. Agric. 2019, 18, 2716–2731. [Google Scholar] [CrossRef]
  32. Liang, H.; Gao, S.; Ma, J.; Zhang, T.; Wang, T.; Zhang, S.; Wu, Z. Effect of Nitrogen Application Rates on the Nitrogen Utilization, Yield and Quality of Rice. Food Nutr. Sci. 2021, 12, 13–27. [Google Scholar] [CrossRef]
  33. Xing, Y.; Mi, F.; Wang, X. Effects of different nitrogen fertilizer types and application rates on maize yield and nitrogen use efficiency in Loess Plateau of China. J. Soils Sediments 2022, 22, 1938–1958. [Google Scholar] [CrossRef]
  34. Li, L.; Tian, H.; Zhang, M.; Fan, P.; Umair, A.; Liu, H.; Duan, M.; Tang, X.; Wang, Z.; Zhang, Z.; et al. Deep placement of nitrogen fertilizer increases rice yield and nitrogen use efficiency with fewer greenhouse gas emissions in a mechanical direct-seeded cropping system. Crop J. 2021, 9, 1386–1396. [Google Scholar] [CrossRef]
  35. Zhou, C.; Huang, Y.; Jia, B.; Wang, Y.; Wang, Y.; Xu, Q.; Li, R.; Wang, S.; Dou, F. Effects of cultivar, nitrogen rate, and planting density on rice-grain quality. Agronomy 2018, 8, 246. [Google Scholar] [CrossRef]
  36. Swarbreck, S.M.; Wang, M.; Wang, Y.; Kindred, D.; Sylvester-Bradley, R.; Shi, W.; Bentley, A.R.; Griffiths, H. A roadmap for lowering crop nitrogen requirement. Trends Plant Sci. 2019, 24, 892–904. [Google Scholar] [CrossRef]
  37. Wang, J.; Fu, P.; Wang, F.; Fahad, S.; Mohapatra, P.K.; Chen, Y.; Zhang, C.; Peng, S.; Cui, K.; Nie, L.; et al. Optimizing nitrogen management to balance rice yield and environmental risk in the Yangtze River’s middle reaches. Environ. Sci. Pollut. Res. 2019, 26, 4901–4912. [Google Scholar] [CrossRef]
  38. Wang, D.; Xu, C.; Yan, J.; Zhang, X.; Chen, S.; Chauhan, B.S.; Zhang, X. 15N tracer-based analysis of genotypic differences in the uptake and partitioning of N applied at different growth stages in transplanted rice. Field Crops Res. 2017, 211, 27–36. [Google Scholar] [CrossRef]
  39. Chen, P.; Nie, T.; Chen, S.; Zhang, Z.; Qi, Z.; Liu, W. Recovery efficiency and loss of 15N-labelled urea in a rice-soil system under water saving irrigation in the Songnen Plain of Northeast China. Agric. Water Manag. 2019, 222, 139–153. [Google Scholar] [CrossRef]
  40. Lin, Z.; Yi, Z. Effect of nitrogen application rate on yield formation and nitrogen use efficiency of the high-quality late rice variety Shengtaiyou 018. Crop Res. 2021, 35, 293–296. (In Chinese) [Google Scholar]
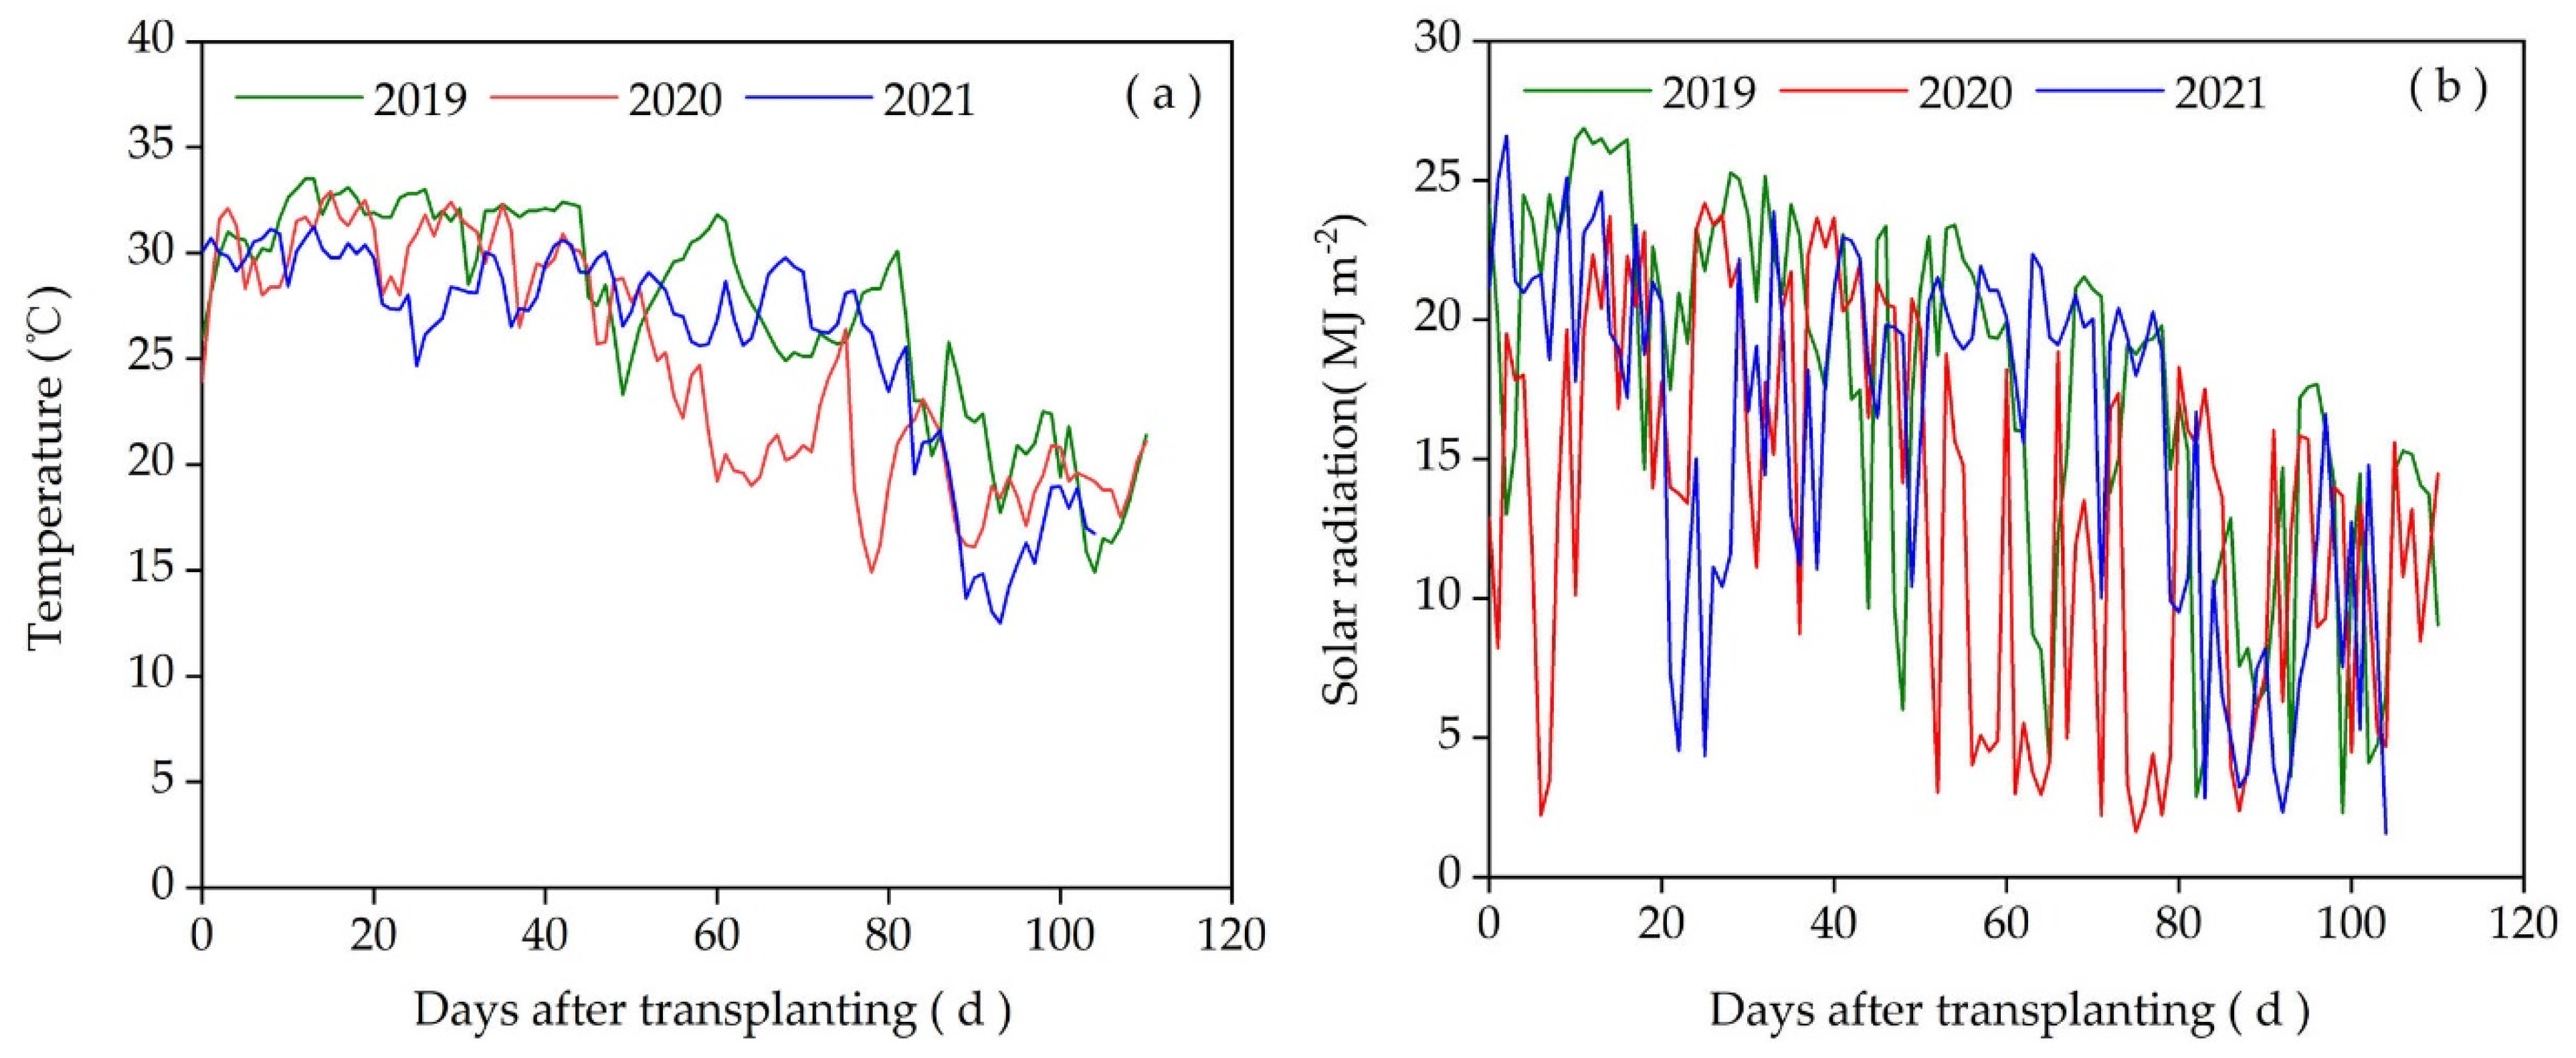
Figure 1. Daily mean temperature (a); and solar radiation (b) in 2019, 2020, and 2021.
Agronomy 12 02719 g001
Figure 2. Setup with PVC tubes of micro-plot experiment in 2021.
Agronomy 12 02719 g002
Figure 3. Correlations of grain yield (a,d), grain setting rate (b,e) and panicle m−2 (c,f) with grain N content in high-quality rice varieties under three N application rates in 2019 (ac) and 2020 (df).
Agronomy 12 02719 g003aAgronomy 12 02719 g003b
Table 1. List of twenty high-quality late indica rice varieties.
NumberNameTypeReleased YearNumberNameTypeReleased Year
1Y-liangyou 911Hybrid201811LongxiangyouhuazhanHybrid2016
2Yujing 91Inbred201512XiangyaxiangzhenInbred2013
3Wanxiangyou 982Hybrid201913YuzhenxiangInbred2009
4Meixiangzhan 2Inbred200614TaixiangyouyuesimiaoHybrid2018
5Taiyou 553Hybrid201915ChangyouhuazhanHybrid2018
6Taiyouhang 1573Hybrid201616Taifengyou208Hybrid2018
7MeitezhanInbred201917YueyousimiaoInbred2011
8TaoyouxiangzhanHybrid201518WanxiangyouhuazhanHybrid2017
9YexiangyoulisiHybrid201719Leiyou1068Hybrid2018
10YexiangyoubasiHybrid201920Taiyou871Hybrid2016
Table 2. Grain N content and its coefficient of variation (CV) of high-quality rice varieties under different N application rates.
VarietiesGrain N Content in 2019 (%)Grain N Content in 2020 (%)CV (%)
N105N165N225N105N165N225
Y-liangyou 9111.07 ab1.18 bcd1.33 bcd1.20 de1.28 efgh1.45 ghi10.36
Taiyou 5531.10 a1.18 bc1.42 a1.11 fgh1.23 h1.47 gh12.44
Meixiangzhan 21.01 cd1.08 fghi1.28 de1.10 gh1.26 gh1.43 hi12.99
Changyouhuazhan1.03 bc1.07 ghi1.30 de1.07 h1.26 gh1.42 hi13.17
Longxiangyouhuazhan0.95 efg1.09 fghi1.27 de1.18 efg1.31 efg1.39 i13.43
Yuzhenxiang1.11 a1.22 ab1.41 ab1.36 b1.53 ab1.62 cde13.59
Taiyou 8711.08 a1.16 bcde1.32 cd1.15 efgh1.33 ef1.56 ef13.69
Taixiangyouyuesimiao0.93 fg1.11 defgh1.28 de1.12 fgh1.25 gh1.41 hi13.99
Taoyouxiangzhan0.97 defg1.10 efghi1.30 d1.19 ef1.34 e1.44 hi14.06
Yujing 911.09 a1.28 a1.39 abc1.22 cde1.56 a1.63 cd14.99
Wanxiangyouhuazhan0.93 fg1.03 i1.22 e1.12 fgh1.27 fgh1.43 hi15.28
Taiyouhang 15730.93 fg1.12 cdefgh1.25 de1.07 h1.30 efg1.45 ghi15.41
Xiangyaxiangzhen1.02 cd1.17 bcd1.31 d1.28 bcd1.44 d1.64 bcd16.32
Taifengyou 2080.97 defg1.13 cdefgh1.27 de1.22 cde1.32 ef1.59 de16.53
Yexiangyoubasi1.09 a1.14 cdefg1.33 bcd1.30 bc1.51 abc1.74 a18.17
Wanxiangyou 9820.99 cdef1.13 cdefgh1.25 de1.19 ef1.30 efg1.51 fg18.28
Meitezhan1.01 cd1.13 cdefgh1.26 de1.45 a1.53 ab1.70 ab19.20
Yexiangyoulisi1.00 cde1.15 cdef1.45 a1.20 de1.44 d1.70 ab19.31
Yueyousimiao0.93 g1.17 bcde1.29 de1.22 cde1.49 bcd1.68 abc20.08
Leiyou 10680.97 defg1.06 hi1.43 a1.31 b1.45 cd1.74 a21.26
Mean1.01 C1.14 B1.32 A1.20 C1.37 B1.55 A
Note: N105, N165, and N225 indicate N application rate of 105, 165, and 225 kg ha−1, respectively. Within a column, different lowercase letters between varieties in the same N application rate indicate significant differences at the p < 0.05 level. Different uppercase letters between different N application rates in the same year indicate significant differences at the p < 0.05 level.
Table 3. Grain yield of high-quality rice varieties under different N application rates in 2019 and 2020.
VarietiesGrain Yield in 2019 (t ha−1)Grain Yield in 2020 (t ha−1)
N105N165N225N105N165N225
Y-liangyou 9117.80 a8.78 a9.47 a7.45 ab8.24 a8.51 a
Taiyou 5537.35 bcd8.26 bc8.17 de6.94 cde7.55 cde6.88 ef
Meixiangzhan 26.85 gh7.56 gh7.51 ij5.74 k6.27 j5.32 n
Changyouhuazhan7.88 a8.72 a9.32 a7.55 a8.26 a8.71 a
Longxiangyouhuazhan7.44 bc8.29 b8.52 bc7.09 c7.91 b7.11 de
Yuzhenxiang6.64 h7.31 i7.37 j6.06 hijk6.59 ij6.35 hij
Taiyou 8717.46 bc8.23 bc8.56 b6.94 cde7.73 bcd7.27 cd
Taixiangyouyuesimiao7.44 bc8.20 bc8.35 bcd7.10 bc7.81 bcd7.54 c
Taoyouxiangzhan7.16 def7.72 fg7.88 fgh7.08 c7.95 ab8.14 b
Yujing 916.79 h7.49 hi7.61 hij5.90 jk6.32 j5.65 lm
Wanxiangyouhuazhan7.41 bc8.11 bcd7.82 gh6.70 def7.32 ef6.45 ghi
Taiyouhang 15737.56 b8.17 bc8.46 bc6.86 cde7.91 b7.32 cd
Xiangyaxiangzhen7.05 fg7.88 ef7.66 hi6.00 ijk6.95 gh6.10 jk
Taifengyou 2087.32 bcde8.27 bc8.63 b6.99 cd7.84 bc7.23 d
Yexiangyoubasi7.15 def7.91 def7.95 efg6.13 hij6.66 hi5.96 k
Wanxiangyou 9827.32 bcde8.08 cd7.65 hi6.84 cde7.51 de6.68 fg
Meitezhan7.10 ef7.80 ef7.43 ij6.60 efg6.66 hi5.47 mn
Yexiangyoulisi7.25 cdef7.95 de8.15 def6.33 ghi6.95 gh6.26 ij
Yueyousimiao7.27 cdef7.92 def7.88 fgh6.69 defg7.15 fg6.62 fgh
Leiyou 10687.48 bc8.18 bc8.27 cd6.41 fgh6.89 ghi5.88 kl
Mean7.29 B 8.04 A8.13 A6.67 C 7.32 A6.77 B
Note: N105, N165, and N225 indicate N application rate of 105, 165, and 225 kg ha−1, respectively. Within a column, different lowercase letters between varieties in the same N application rate indicate significant differences at the p < 0.05 level. Different uppercase letters between different N application rates in the same year indicate significant differences at the p < 0.05 level.
Table 4. Effects of N application rates on yield and yield components in high-quality rice varieties.
TreatmentVarietyPanicles
m−2
Spikelets Panicle−1Grain Setting Rate(%)1000-Grain Weight
(g)
Yield
(g m−2)
Biomass
(g m−2)
Harvest Index
(%)
N165Y-liangyou 911342.36 d174.47 a86.25 a23.75 a1057.45 b2193.09 b54.57 a
Yexiangyoulisi369.78 c160.98 c85.36 b22.62 c993.95 c2090.13 c53.81 b
N225Y-liangyou 911407.82 b167.63 b83.06 c23.31 b1144.32 a2447.05 a51.72 c
Yexiangyoulisi437.90 a146.07 d81.59 d22.38 d1009.64 c2214.31 b50.63 d
Analysis of VarianceTreatment**************
Variety**************
Treatment × Varietyns**ns******ns
Note: N165 and N225 indicate N application rates of 165 and 225 kg ha−1, respectively. Different lowercase letters between different treatments in the same column indicate significant differences at the p < 0.05 level. ** represent significant differences at the p < 0.01 levels, respectively; ns means no significance.
Table 5. Effects of N application rates on grain N accumulation in high-quality rice varieties.
15N labelTreatmentVarietyN Content
(%)
Total N Accumulation (g m−2)15N Labeled Fertilizer N Accumulation
(g m−2)
Ratio of 15N Labeled Fertilizer N Accumulation to Total N Accumulation (%)
T1N165Y-liangyou 9111.30 c13.84 c1.02 b7.36 c
Yexiangyoulisi1.32 c13.08 d0.89 c6.82 d
N225Y-liangyou 9111.42 b16.42 a1.35 a8.23 b
Yexiangyoulisi1.47 a14.77 b1.34 a9.11 a
T2N165Y-liangyou 9111.29 d13.63 c0.79 c5.80 c
Yexiangyoulisi1.33 c13.22 c0.71 d5.38 d
N225Y-liangyou 9111.41 b16.06 a1.26 a7.84 b
Yexiangyoulisi1.46 a14.92 b1.30 a8.70 a
T3N165Y-liangyou 9111.28 c13.49 c1.35 b10.02 d
Yexiangyoulisi1.31 c12.99 c1.35 b10.42 c
N225Y-liangyou 9111.41 b16.35 a1.84 a11.22 b
Yexiangyoulisi1.45 a14.63 b1.81 a12.36 a
Note: N165 and N225 indicate N application of 165, and 225 kg ha−1, respectively. T1 represents applying 15N-labeled basal fertilizer; T2 represents applying 15N-labeled tillering fertilizer; T3 represents applying 15N-labeled panicle fertilizer. Different lowercase letters between different treatments in the same column indicate significant differences at the p < 0.05 level.
Table 6. Effects of N application rates on N recovery rate and N harvest index of 15N labeled fertilizer in high-quality rice varieties.
15N LabelTreatmentVariety15N Labeled Fertilizer N
Recovery Rate (%)
N Harvest Index of 15N Labeled Fertilizer
(%)
T1N165Y-liangyou 91121.35 b57.84 a
Yexiangyoulisi19.26 c56.17 ab
N225Y-liangyou 91122.25 a53.97 b
Yexiangyoulisi21.10 b56.63 a
T2N165Y-liangyou 91127.62 b57.86 ab
Yexiangyoulisi24.89 c57.73 ab
N225Y-liangyou 91131.72 a55.11 b
Yexiangyoulisi31.20 a59.71 a
T3N165Y-liangyou 91167.60 c60.61 a
Yexiangyoulisi68.52 bc59.89 ab
N225Y-liangyou 91170.60 ab57.76 bc
Yexiangyoulisi70.97 a56.63 c
Note: N165 and N225 indicate N application of 165, and 225 kg ha−1, respectively. T1 represents applying 15N-labeled basal fertilizer; T2 represents applying 15N-labeled tillering fertilizer; T3 represents applying 15N-labeled panicle fertilizer. Different lowercase letters between different treatments in the same column indicate significant differences at the p < 0.05 level.
Publisher’s Note: MDPI stays neutral with regard to jurisdictional claims in published maps and institutional affiliations.