Article

Effect of Light Intensity on Gene Expression in Hypocotyl during the Elongation in a Leaf-Yellowing Mutant of Pepper (Capsicum annuum L.)

1
Engineering Research Center for Horticultural Crop Germplasm Creation and New Variety Breeding, Ministry of Education, College of Horticulture, Hunan Agricultural University, Changsha 410128, China
2
Key Laboratory of Vegetable Biology of Hunan Province, Changsha 410128, China
3
Vegetable Institution of Hunan Academy of Agricultural Science, Changsha 410125, China
*
Authors to whom correspondence should be addressed.
These authors contributed equally to this work.
Agronomy 2022, 12(11), 2762; https://doi.org/10.3390/agronomy12112762
Submission received: 22 September 2022 / Revised: 20 October 2022 / Accepted: 4 November 2022 / Published: 6 November 2022

Abstract

:
Light is vital for plant growth and development, and the germination of many plant seeds and the development of seedlings are very sensitive to the light environment. Under no or low light conditions, pepper seedlings will accelerate the elongation of the hypocotyl to obtain light. To elucidate the molecular mechanism by which light regulates hypocotyl elongation in pepper, RNA sequencing was performed to analyze the hypocotyls and cotyledons of the yellowing mutant R24 under three different light intensity treatments. A total of 35,341 gene were identified; moreover, during the treatment, 9695 new genes and 13,123 differentially expressed genes (DEGs) were observed, respectively. Some genes related to brassino-lide receptor protein kinase BRI1, light capture proteins LHCA and LHCB, and auxin response factor may regulate the response of hot pepper cotyledons and hypocotyls to different light intensity. KEGG functional enrichment analysis revealed that the most abundant pathways were phenylpropane biosynthesis, plant hormone signal transduction, and carbon metabolism. This study provides a valuable reference for understanding the molecular mechanism of pepper’s response to different light intensities at the seedling stage and for improving the local light environment to overcome the hypocotyl elongation of pepper crop under low light conditions.

1. Introduction

Pepper (Capsicum annum L.), which belongs to Solanaceae family, is one of the most important vegetables cultivated in China. Because it contains some unique secondary metabolites such as capsaicin and capsanthin, along with its unique flavor, pepper has important economic and application values in the fields of medicine, chemical and food and industries; hence, it also widely cultivated around the world [1,2]. The process of plant growth and development is inseparable from light. As light intensity changes, the duration of light and its spectral composition, and the photomorphogenesis, growth, and physiological metabolism of plants will be changed, accordingly, which leads to altered stem and leaf growth, chlorophyll synthesis and photosynthesis intensity [3,4,5]. In early spring in southern China, pepper seedlings are often exposed to low light conditions, which can easily lead to the excessive elongation of the hypocotyls, typically caused by poor adaptability and resistance to adverse environmental conditions like drought, frost, and diseases. Furthermore, the growth and development of pepper plants is slow after they are transplanted, which seriously affects their yield and quality [6]. Therefore, it is of great significance to explore the hypocotyl elongation mechanism of pepper under low light conditions for improving the pepper crop’s yield and quality.
Plant growth is regulated by light signaling pathways mediated by photoreceptors, which regulate some of the crucial processes such as seed germination, hypocotyl growth, chlorophyll synthesis, stomatal opening, and flower initiation [7,8,9,10]. Hypocotyl elongation is a process jointly regulated by external environmental factors and endogenous hormones. We know that low light levels and high temperatures can significantly promote hypocotyl elongation in some plant species [11]. In Arabidopsis thaliana, light and ethylene signals regulate its hypocotyl cell elongation by changing the cortical microtubules and coordinating the gene expression of MDP60 [12]. Transcription factor PIFs can increase the expression of the auxin biosynthesis rate-limiting enzyme genes Z441 and YUC89, thereby promoting hypocotyl elongation by increasing the content of indole-3-acetic acid in the cotyledons [13]. It was also found that a light treatment could rapidly increase the growth of hypocotyls of wild-type etiolated seedlings of A. thaliana, while ACC, the direct precursor of ethylene, enhanced the effect of light on hypocotyls [14]. Although many studies have investigated the mechanism of hypocotyl elongation in recent years, they mainly focused on the effects of various environmental factors on the physiological metabolism of vegetable seedlings or the interaction mechanism of environmental factors for regulating hypocotyl elongation. These molecular mechanisms responsible for hypocotyl elongation in the pepper seedling stage are still unknown.
In the previous work, our research team obtained the yellow leaf color mutant R24 from a 60 Co-g-treated population of WT21 [15]. Compared with the wild type, the mutant was sensitive to light changes, and the leaf color was different with different light. We also found that the hypocotyls of the mutants changed significantly under different light intensities. Accordingly, the present study obtained transcriptome information in the hypocotyl and cotyledon of R24 at the seedling stage under different light conditions by RNA-Seq, to analyze this plant’s responsive functional genes, metabolic pathways, and key genes. With this date, our study had two objectives: (1) to uncover the molecular mechanism by which light regulates the growth and hypocotyl elongation of pepper seedlings; (2) to provide a reasonable basis for the yield increase and light regulation of protected cultivation of pepper.

2. Materials and Methods

2.1. Plant and Treatments

The pepper (Capsicum annum L.) leaf-yellowing mutant R24 was provided by the Pepper Research Group of Hunan Agricultural University (Changsha, China). The seeds of R24 were treated in hot water at 55 °C for 20 min, then germinated in the dark at 28 °C, and then grown in an artificial climatic chamber (HP600GS-LED) (under 16 h of light at 30 °C ± 2 °C and 8 h of darkness at 20 °C ± 2 °C), exposed to three light intensity treatments: high light 500 µM m−2 s−1 (HL), medium light 200 µM m−2 s−1 (ML) and low light 50 µM m−2 s−1 (LL), The data of light in Table S1. Each treatment consisted of 50 cultivated seedlings. When those plants treated with low light showed their first true leaves, the light three treatments were stopped from 9:00 to 11:00 the next morning. Meanwhile, the hypocotyls and cotyledons of the plants were cut to two parts: one part was frozen with liquid nitrogen for transcriptome sequencing, while the other part was for the phenotypic index determination.

2.2. Determination of Phenotypic Data

From each light intensity treatment (HL, ML, LL), a group of plants (plants = 15) were randomly selected separately. Their plant height, hypocotyl height and stem diameter were respectively measured with a ruler and Vernier caliper. Next, the weight of each plant was determined.

2.3. RNA Extraction and Library Preparation

The total RNA from the cotyledons and stems of R24 seeding was extracted by following the Trizol kit’s protocol and methodology. The purity and concentration of RNA were detected by an ultramicro-spectrophotometer, and its integrity then evaluated by agarose gel electrophoresis. Finally, the qualified samples were sent to a sequencing company to build the database, for which the Illumina sequencing platform (Illumina NovaSeq6000) was used for RNA-Seq high-throughput sequencing. Each sample was replicated three times, for a total of 18 DGE libraries (=2 tissue types × 3 treatments × 3 replicate seedlings) constructed and sequenced.

2.4. Transcriptome Analysis

Clean reads were obtained by removing the connectors and low-quality sequences from the original sequence data. The software tool Tophat2, was used to compare the data to the C.annuumL_Zunla-1 reference genome for analysis. The expression of transcripts was calculated by FPKM (Fragments Per Kilobase of transcript per Million mapped reads) method and then counted. According to the quantitative results of FPKM, the differential genes (DEGs) were analyzed by the Gene Ontology (GO) function analysis and the Kyoto Encyclopedia of Genes and Genomes (KEGG) pathway analysis. The FDR (false discovery rate) was used to determine the adjusted threshold of the p-value in multiple tests. In our study, an FDR < 0.05 and fold-change > 2 were used as significance cut-offs to designate gene expression differences. Only those genes identified in at least two of the three replicates of at least one treatment/hypocotyl/cotyledon were considered for the expression analysis. Via the KEGG database comparison and hypergeometric testing, the pathways of significant enrichment for differentially expressed transcripts were found, and the main biochemical metabolic pathways and signal transduction pathways involving the DEGs were determined.

2.5. Quantitative Real-Time PCR

The RNA was determined by RT-qPCR, as described by Osorio et al. [16]. Three replicates were performed for each sample. Cp-Actin served as the internal gene for differentially expressed genes (DEGs). All primers used in the study are listed in Table S2. Data for the relative expression levels of DEGs were normalized by applying the 2−ΔΔCT method [17].

2.6. Data Analysis

The experimental results are expressed as mean ± SD (standard deviation) and were analyzed using Excel 2010 and SPSS 22.0. Significance differences between means of the treatments were analyzed using Duncan’s multiple range test (p < 0.05).

2.7. Accession Numbers

All RNA-Seq data generated in this study are available from the SRA-Archive (http://www.ncbi.nlm.nih.gov/sra, accessed on 28 May 2022), under this accession number: PRJNA733289.

3. Results

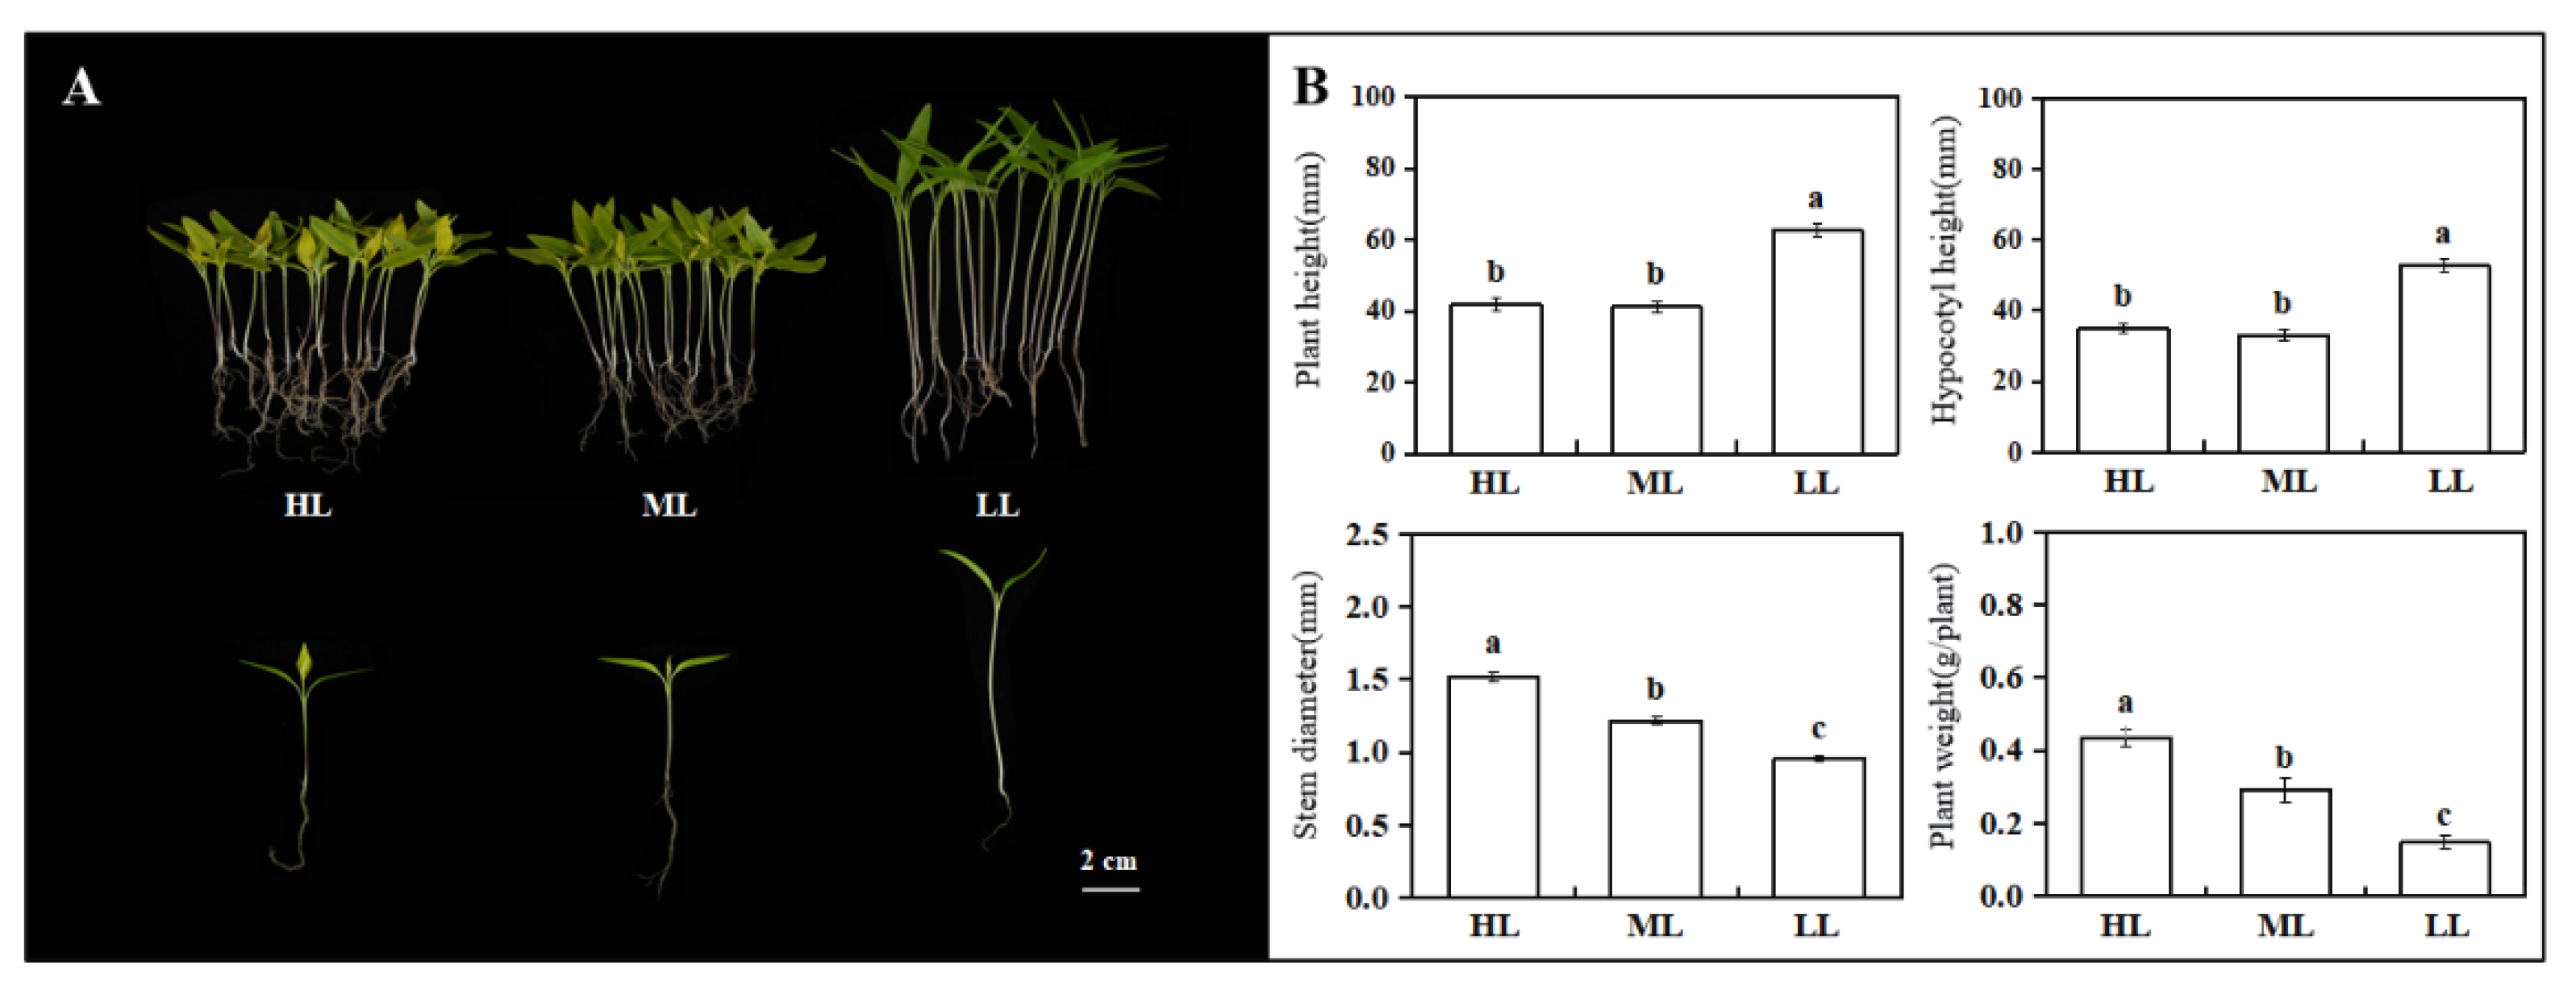
3.1. Plant Phenotypic Index Statistics

The R24 had obvious changes under different light intensity treatments. Under low light, the hypocotyl of mutant R24 grew, the stem diameter became weaker, the plant height increased by 37.31% and 33.11%, the hypocotyl height increased by 34.67% and 33.53%, and the plant fresh weight decreased by 48.96% and 66.52%, respectively (Figure 1B). Compared with low light, the fresh weight of plants treated with high light increased significantly. Combined with their phenotypic observation (Figure 1A), it could be seen that low light significantly promoted the hypocotyl elongation of R24, but these plants developed slowly, and their overall growth potential was obviously weaker than that of plants treated with medium light and strong light.

3.2. Specificity of Gene Accumulation in Tissue Types of Pepper

A total of 406,826,978 clean high-quality reads were obtained from the 18 pepper samples by Illumina NovaSeq6000 sequencing. After mapping to the C. annuum L_Zunla-1 Database (https://www.ncbi.nlm.nih.gov/genome/10896, accessed on 19 December 2017), a total of 35,341 genes (including 25,646 known and 9695 novel genes) were identified (Table S3). Among these genes, 31,803 were both identified in leaf and stem samples, 1278 and 2260 genes were identified only in leaf and stem samples, respectively (Figure 2A). In leaves, a total of 28,865 genes were identified in the different light treatments, with 833, 572, and 754 genes identified only in H, M, L, respectively (Figure 2B). In stems, a total of 29,968 genes were identified in different light treatments, of which 840, 596, and 653 genes were exclusive to H, M, L, respectively (Figure 2C).

3.3. Identification of Differentially Expressed Genes (DEGs)

A total of 13,123 DEGs were identified in the pairwise group comparison of treatments (Table S4). Among these genes, 3657 DEGs were common to both the hypocotyls and cotyledons, whereas 892, 1375 and 1584 DEGs were specifically found between hypocotyls and cotyledons under H, M, and L -light treatments, respectively (Figure 2D). Furthermore, the expression of 132 and 161 genes in cotyledons and hypocotyls, respectively, differ significantly among light treatments (Figure 2E,F). It was also found that the number of DEGs was significantly lower in the M/H comparison group than either L/M and L/H groups in both cotyledons and hypocotyls, indicating that the effects on them from moderate light and high light was mostly similar. Further analysis, revealed that the expression of early light-induced protein (Capana03g003815, Capana00g000035), and cellulose synthase-like protein (Capana07g001101, Capana07g001384), among others, decrease significantly in the L/M, M/H and L/H comparison groups of cotyledon and hypocotyl samples. However, expression of xyloglucan endotransglucosylase/hydrolase 1 (Capana08g001512), xyloglucan endotransglucosylase/hydrolase 2-like (Capana09g000688) and xyloglucan endotransglucosylase/hydrolase protein 8 (Capana02g002154, Capana04g002527), among others, increased significantly under low light condition in hypocotyls, yet no significant changes due to light were detected in cotyledons.

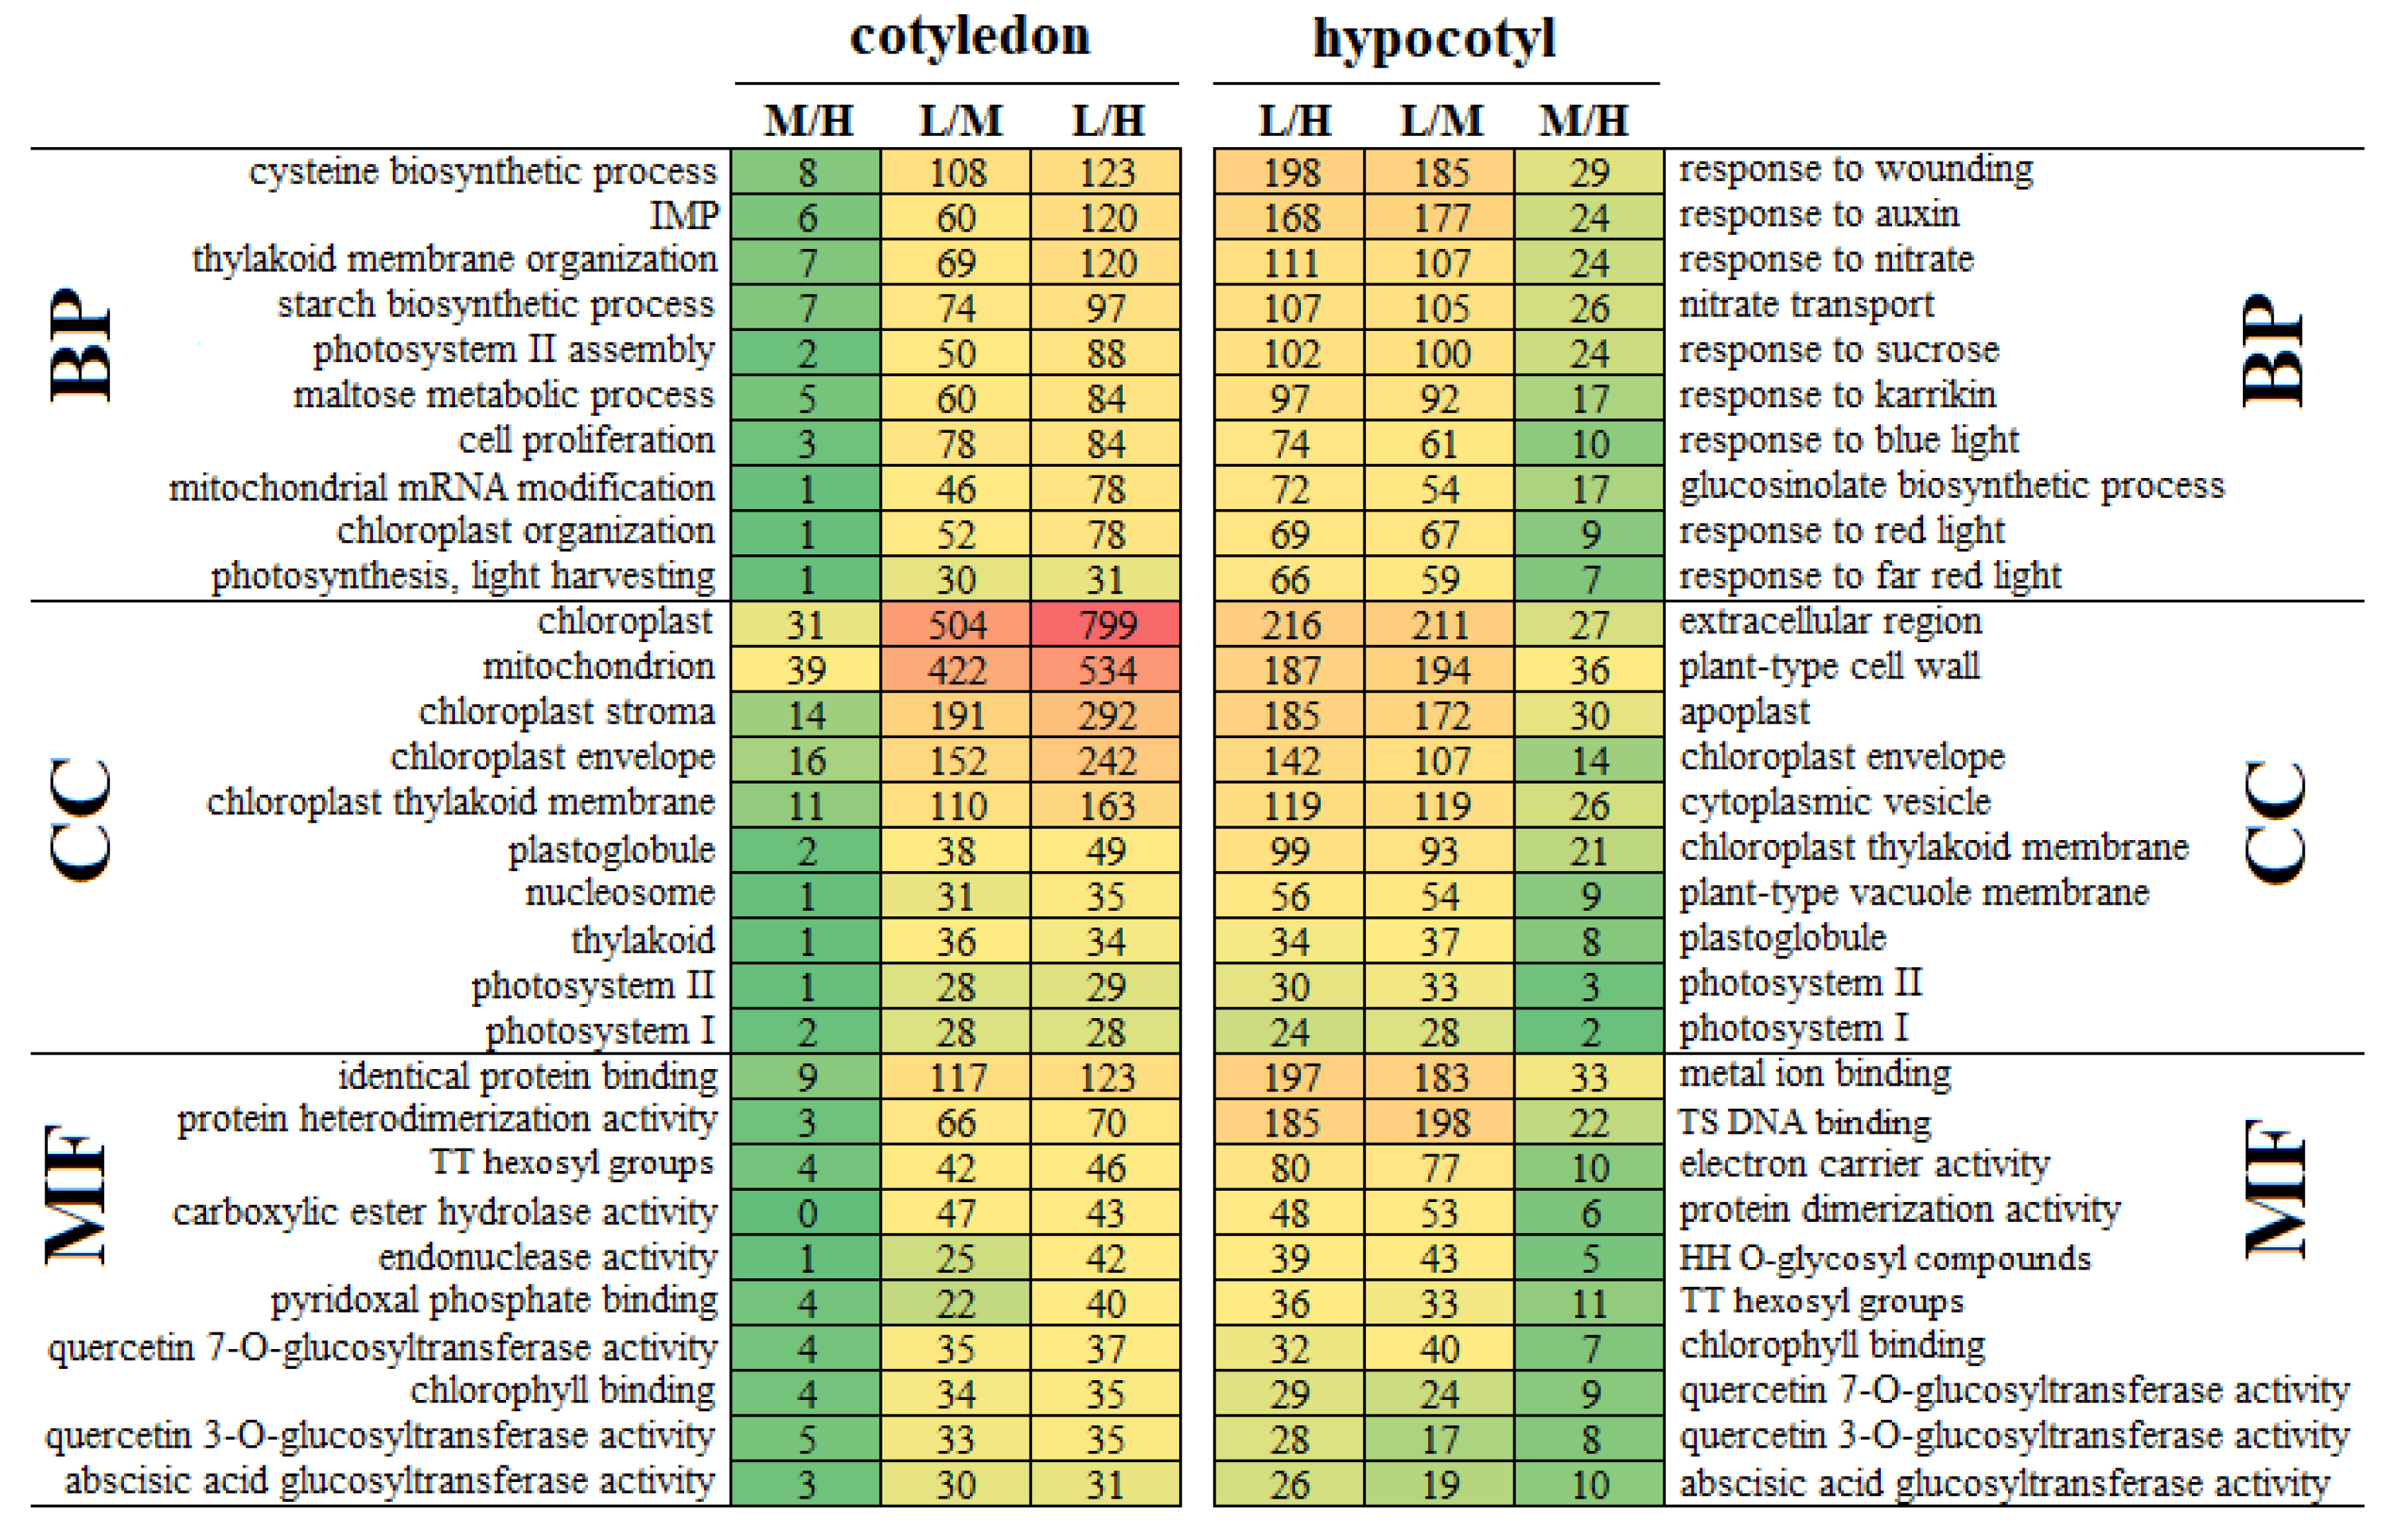
3.4. GO Analysis of DEGs

GO function enrichment analysis of DEGs in stems and cotyledons was also conducted. For this, the top-ten functional terms harboring the most DEGs for biological process (BP), cellular component (CC), and molecular function (MF) categories were selected to analyze the change differences between hypocotyls and cotyledons in response to differing light intensity (Figure 3). In general, significantly fewer DEGs were enriched in each GO term in the M/H group than the L/M group, in both cotyledons and hypocotyls. Regarding BP, the DEGs in cotyledons were most enriched in cysteine biosynthetic process, isopentenyl diphosphate biosynthetic process, methylerythritol 4-phosphate pathway, and thylakoid membrane organization, while the DEGs in hypocotyls were most enriched in terms of wounding, response to auxin, and response to emissions term; at the same time, a large amount of DEGs were enriched with respect to the response to light. Concerning CC, the DEGs in cotyledon and hypocotyl were most enriched in chloroplast and extracellular region terms, respectively, though some DEGs were also enriched in chloroplast envelope, Photosystem II and Photosystem I terms both in cotyledons and hypocotyls. For MF, the DEGs in cotyledons and hypocotyls were most enriched in identical protein binding and metal ion binding, respectively, but other DEGs were found enriched in chlorophyll binding, quercetin 7-O-glucosyltransferase activity, quercetin 3-O-glucosyltransferase activity, and abscisic acid glucosyltransferase activity terms, in both cotyledons and hypocotyls.

3.5. Aux/IAA Expression Analysis

The GO enrichment analysis showed that DEGs in hypocotyls were enriched in large quantities with respect to response to auxin terms, while in cotyledons the DEGs were not significantly enriched. Therefore, the Aux/IAA family genes were further analyzed, for a total of 23 AUX/IAA family genes quantified in this study (Figure 4). These results showed that the expression of IAA4 (Capana06g002018, Capana03g004568), IAA14 (Capana03g004567), IAA16 (Capana06g003073), AUX22-like (Capana03g000311), and AUX22D-like (Capana06g000110, Capana03g003343) in hypocotyls and cotyledon were not significantly changed under high light or moderate light treatment, but they were significantly increased by the low light treatment, while the expression of IAA1 (Capana03g000310) and IAA16-like (Capana09g000285) in hypocotyls were significantly decreased by low light only. This pattern suggested that the expression of the above Aux/IAA family genes may be affected by light, especially low light conditions. We found that the expression of most genes, including IAA4, IAA8 (Capana04g000808), IAA13 (Capana03g004455), IAA14, IAA16 (Capana08g001238), and IAA16-like, were significantly higher in hypocotyls than cotyledons across differing light intensity. By contrast, the expression level of IAA20-like (Capana07g000391) in cotyledons was significantly higher than that in hypocotyls, being significantly increased by the low light treatment.

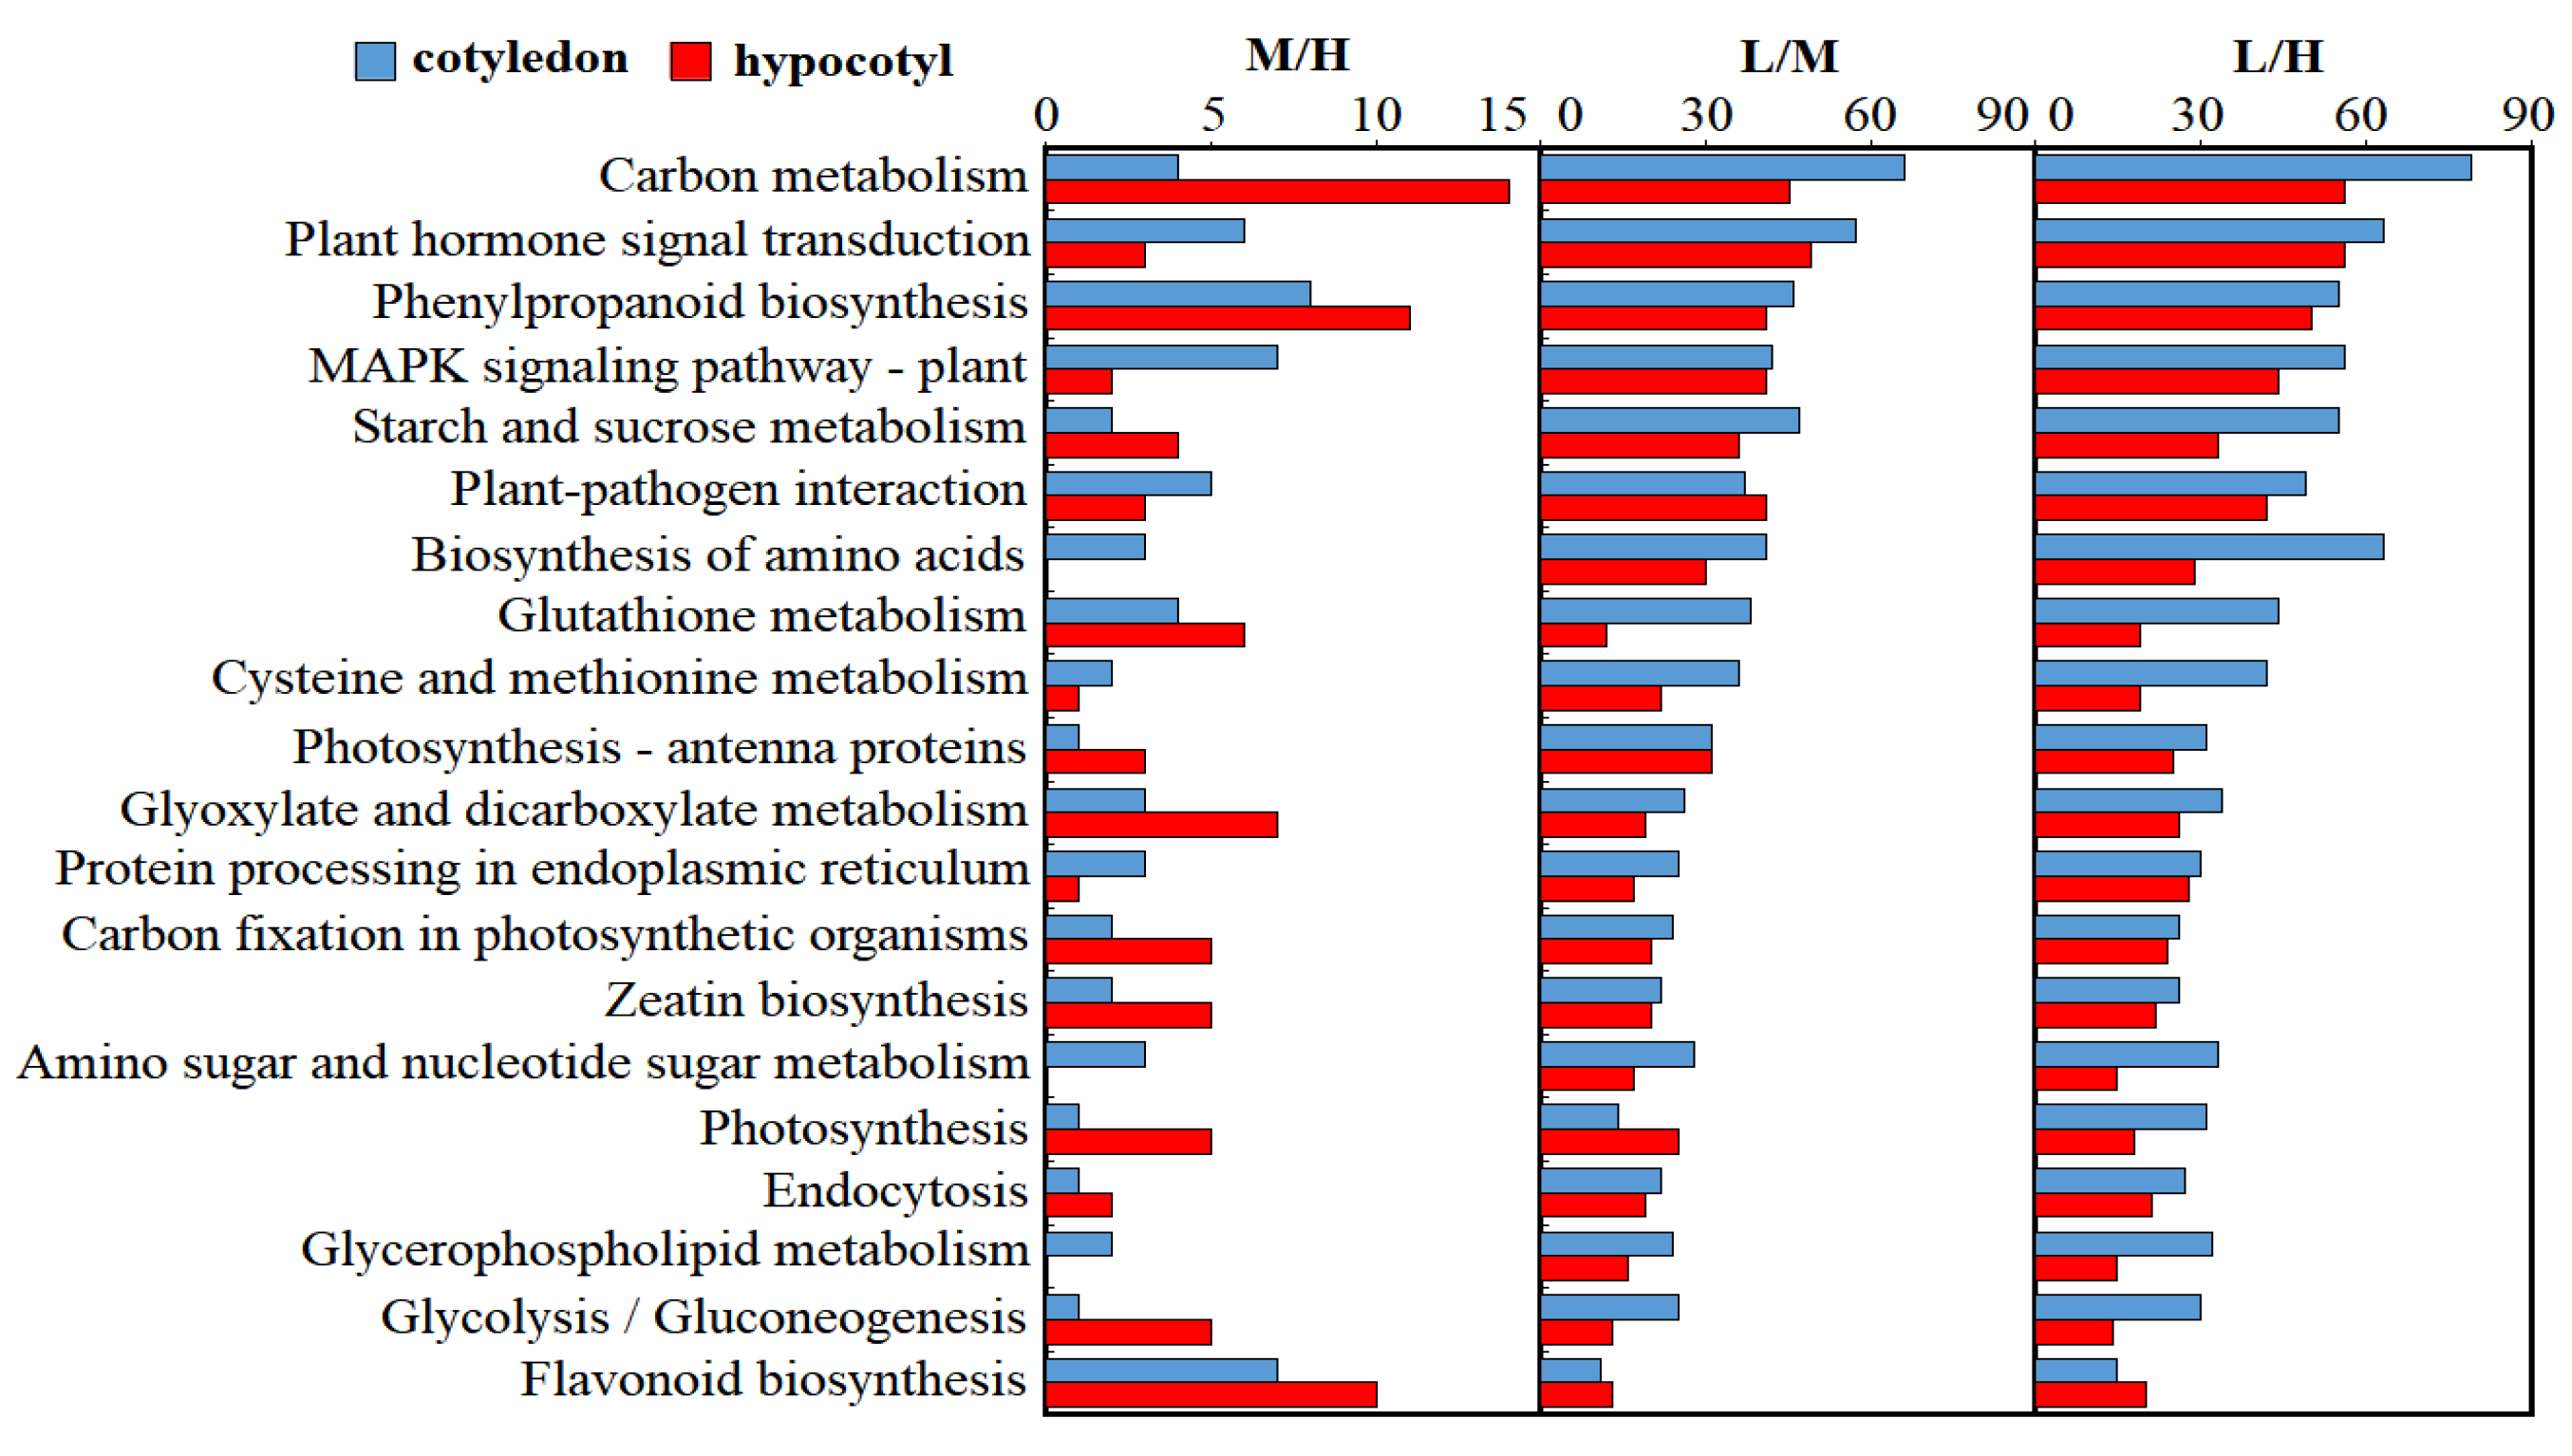
3.6. KEGG Enrichment

KEGG pathways were investigated to reveal the functions of DEGs that might be related to the process of pepper plant development. For this analysis, the top-30 KEGG pathways with the most DEGs were selected. These results showed that DEGs in hypocotyls and cotyledons were mainly concentrated in carbon metabolism, plant hormone signal transduction, and phenylpropanoid biosynthesis pathways (Figure 5). Further analysis revealed that the number of DEGs in each pathway in cotyledons was generally higher than that in hypocotyls under differing light intensity, especially in terms of biosynthesis of amino acids, ribosome, glutathione metabolism, carbon metabolism, cysteine and methionine metabolism pathways. However, we stumbled upon an interesting phenomenon, in that under M/H group, the number of DEGs in hypocotyls exceeded that in cotyledons, especially in the pathways of carbon metabolism, glyoxylate and dicarboxylate metabolism, and glycolysis/gluconeogenesis. On the contrary, MAPK signaling pathway-plant pathway result indicated that the number of DEGs in hypocotyls was five times less than that in cotyledons. These results suggested a greater effect of differing light levels on cotyledons than on hypocotyls, yet the hypocotyl of pepper at seedling stage might nonetheless be more sensitive to changes above a certain light intensity, resulting in more DEGs in the M/H comparison group.

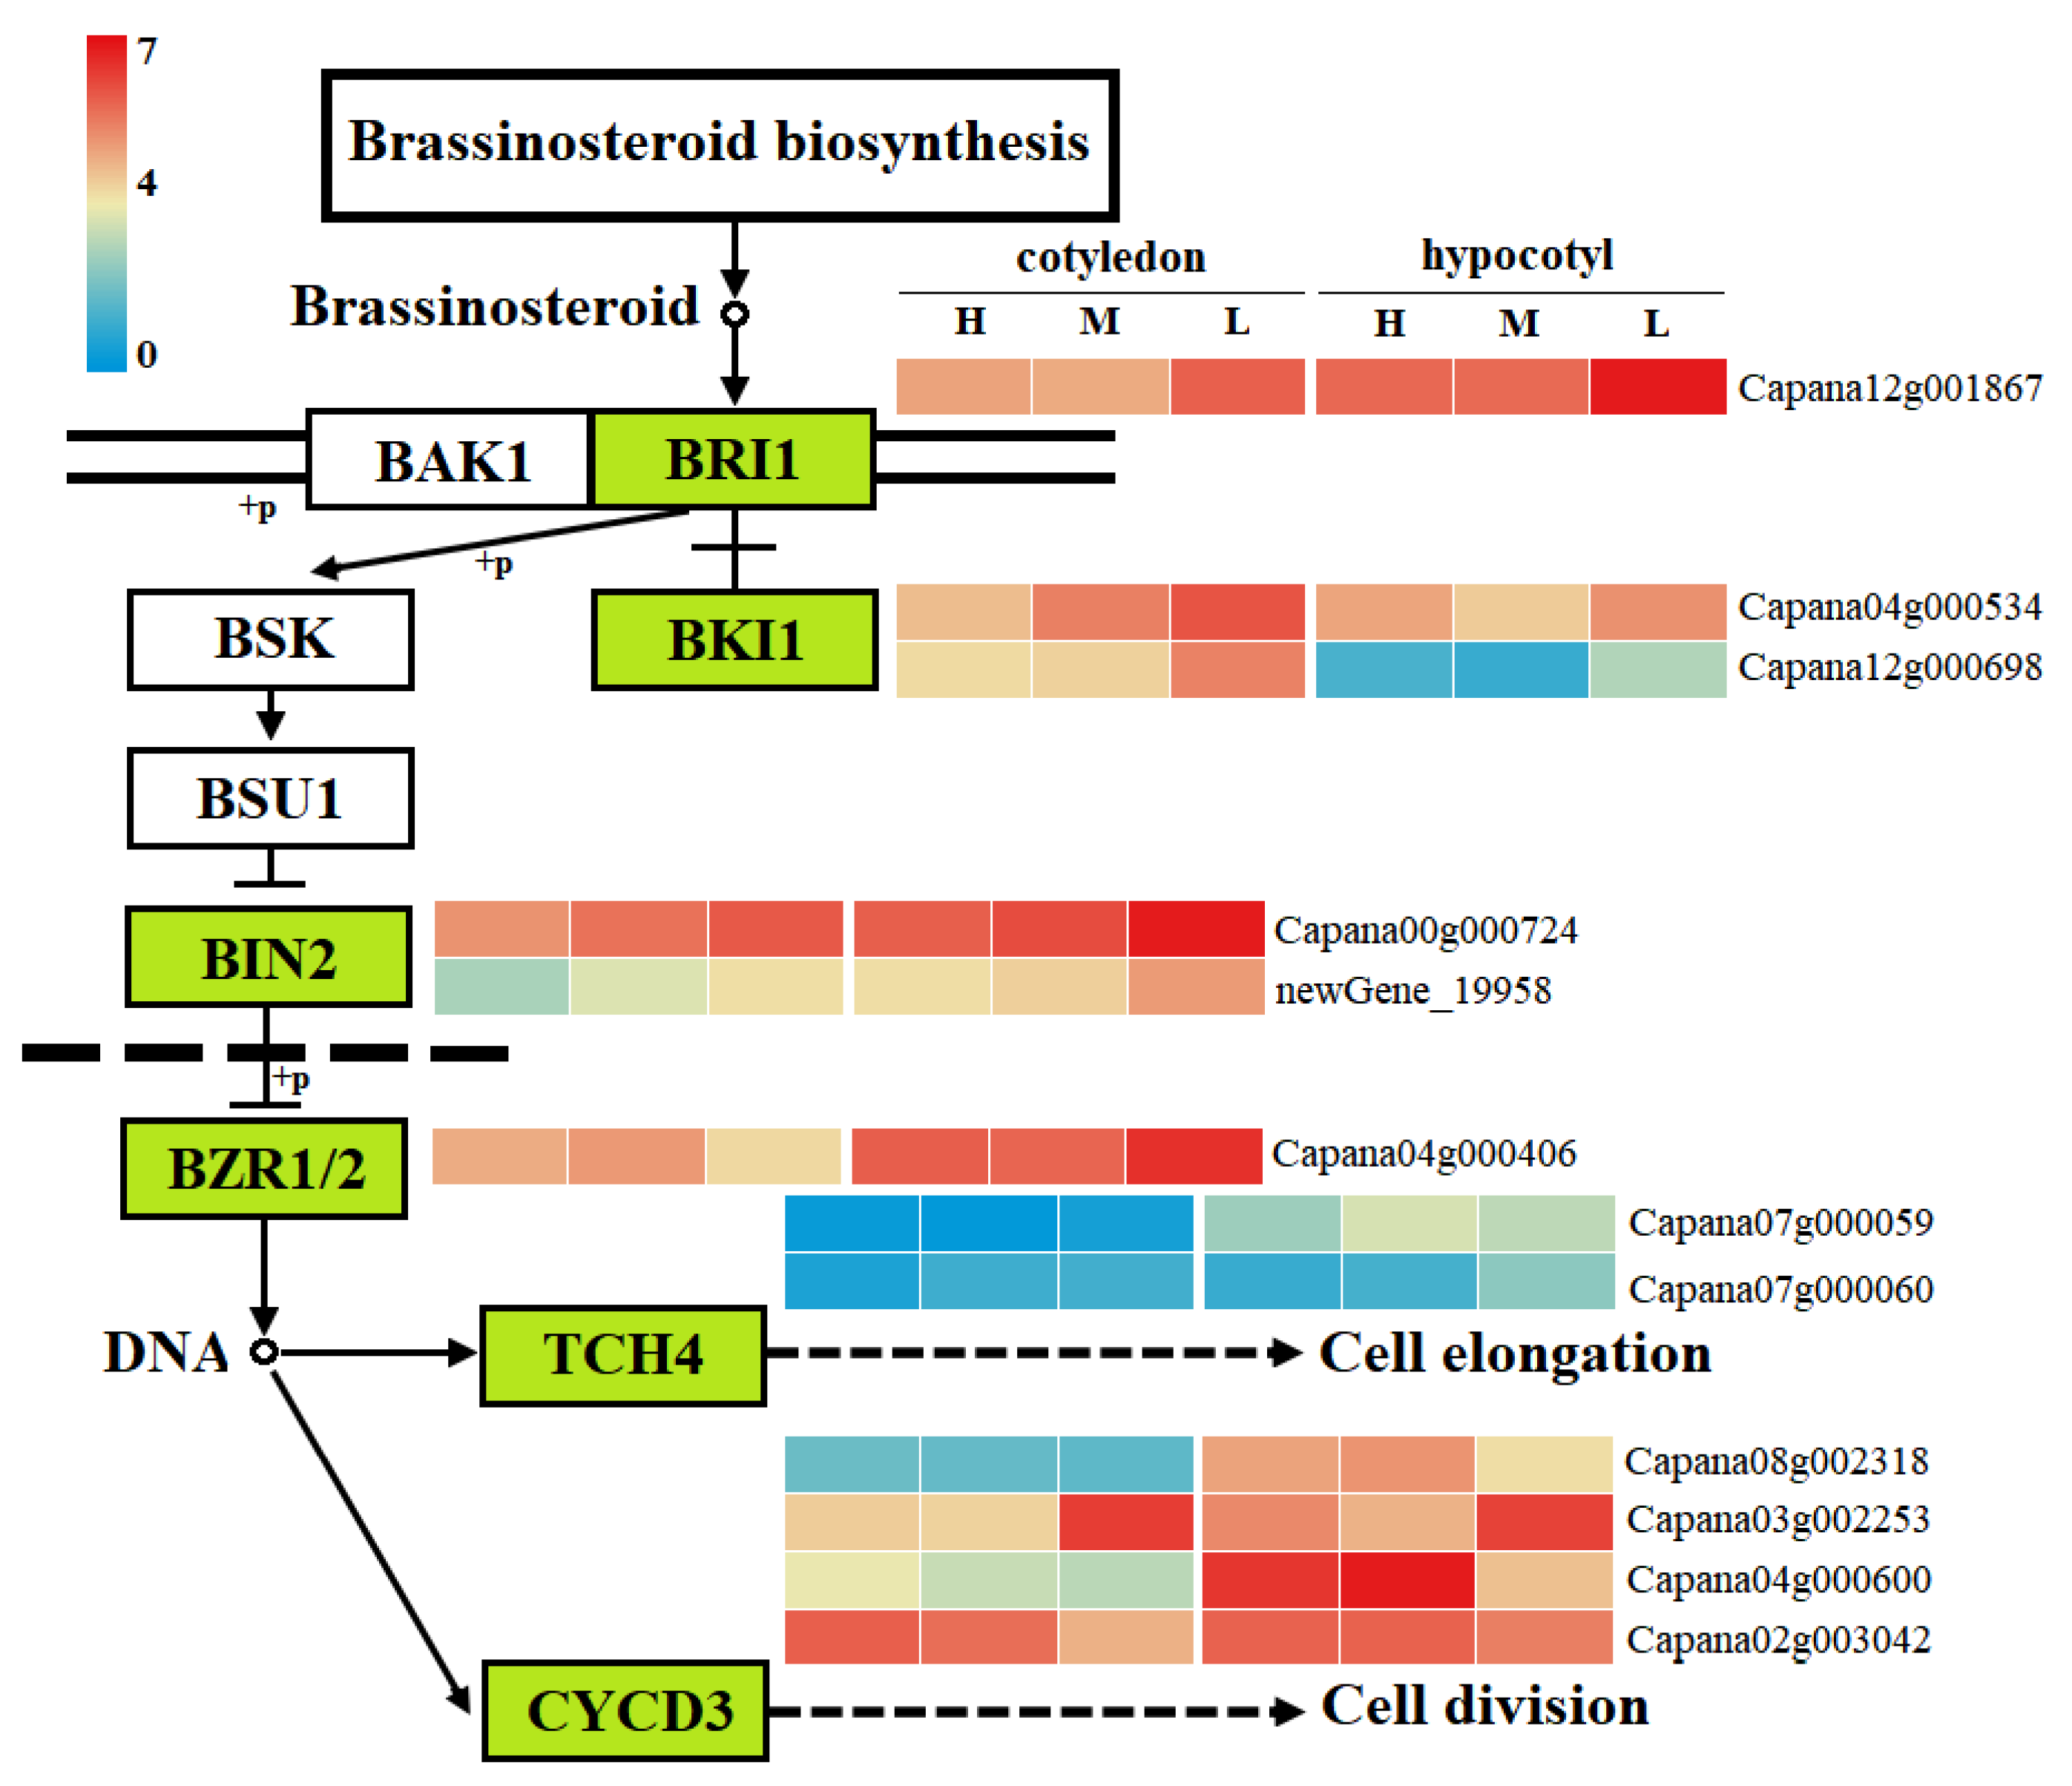
3.7. Gene Expression Network Analysis of Plant Hormone Signal Transduction Pathway

Concerning plant hormone signal transduction, the expression of 12 genes encoding six proteins in the brassinolide signal transduction pathway were found significantly different among the light treatments in cotyledons and hypocotyls (Figure 6). Among these genes, the expression of some genes in cotyledons versus hypocotyls differed significantly; namely, Bzr1/2 (Capana04g000406), Tch4 (Capana07g000059), and Cycd3 (Capana04g000600 and Capana08g002318) were expressed more in hypocotyls than cotyledons, and vice versa for Bki1 (Capana12g000698 and Capana04g000534). For other genes, the trend in their variation in hypocotyls vis-à-vis cotyledons under different light treatments was basically the same. Notably, the expression of Bri1 (Capana12g001867), Bki1 (Capana12g000698), Bin2 (Capana00g000724), Tch4 (Capana07g000060), and Cycd3 (Capana03g002253) were not significantly changed under high light and medium light conditions, but they were significantly increased under low light by 1.26-, 1.78-, 1.11-, 1.44- and 1.17-fold, respectively, in hypocotyls compared with medium light conditions.

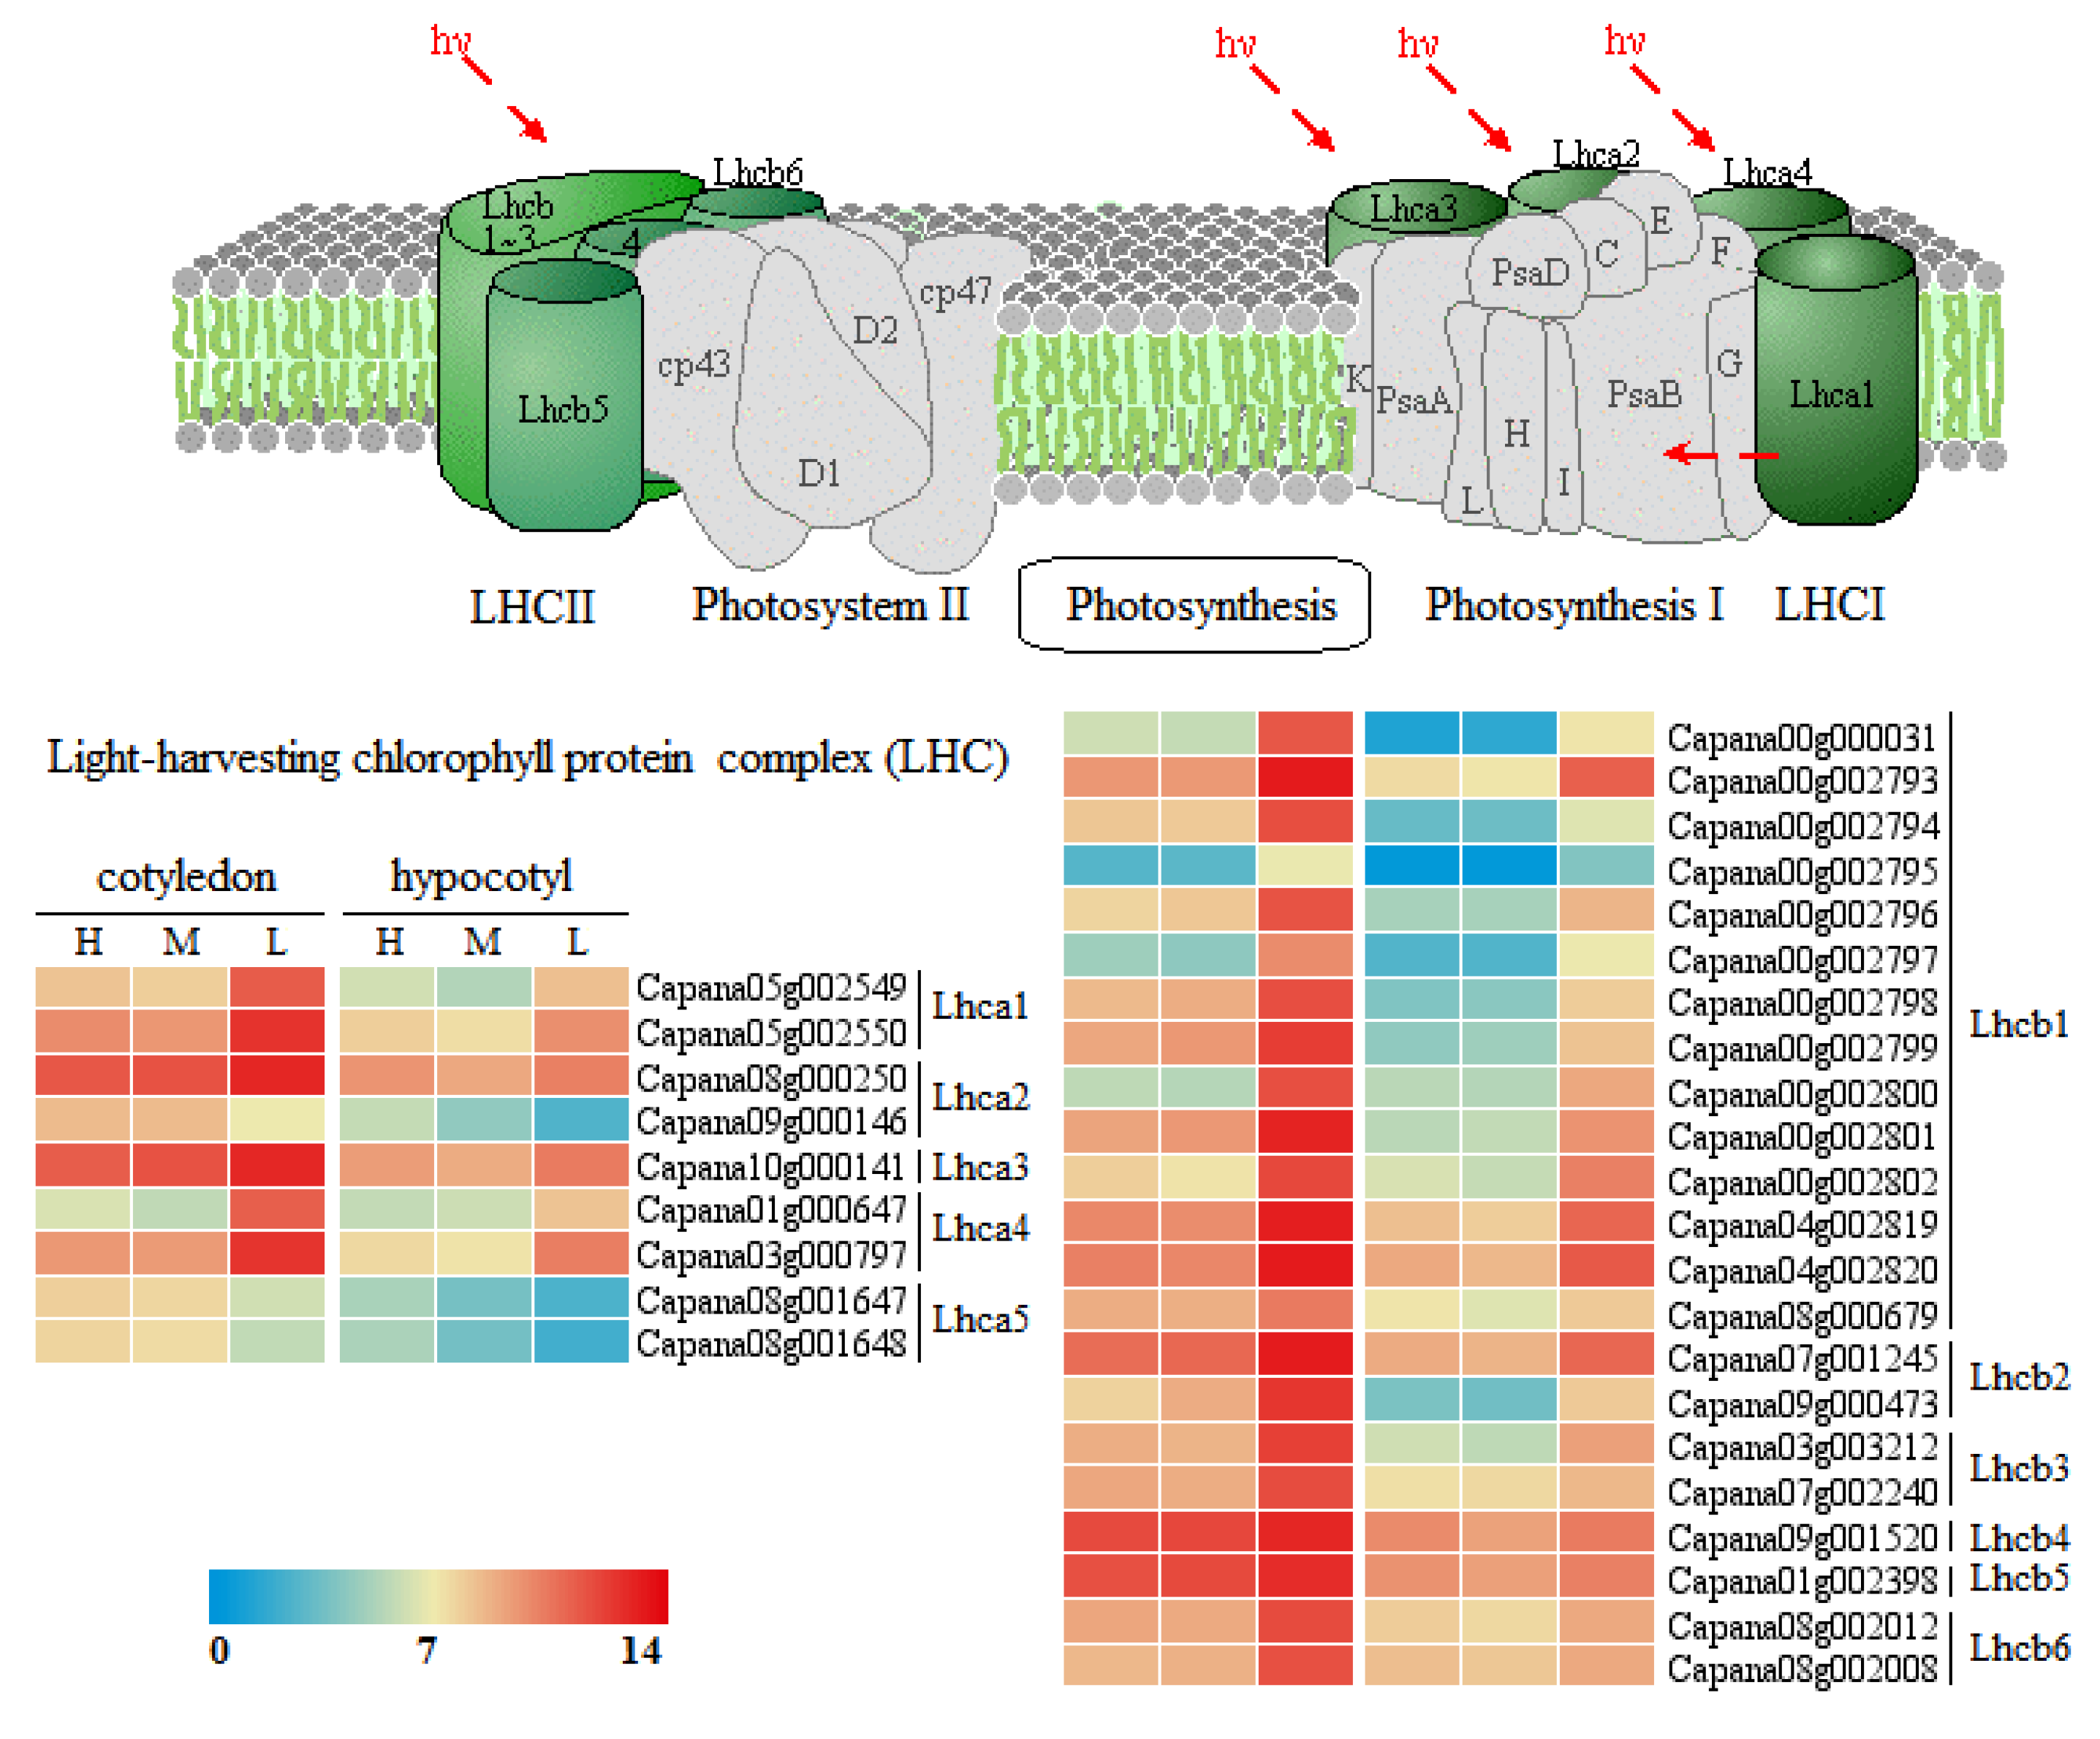
3.8. Gene Expression Network Analysis of Photosynthesis-Antenna Proteins Pathway

From the results of KEGG pathway enrichment analysis, significant differences were found in the expression of genes related to the photosynthesis-antenna proteins pathway in hypocotyls and cotyledons across different light intensities. Further analysis showed that significant changes occurred in the expression of 31 genes in the photosynthesis-antenna proteins pathway (Figure 7). When comparing hypocotyls and cotyledons, the expression of 29 genes in cotyledons were significantly higher than that in hypocotyls under different light conditions. Only Lhca4 (Capana01g000647) and Lhcb1 (Capana00g002800) failed to differ significantly in their expression between cotyledons and hypocotyls under high and medium light conditions; however, under the low light condition, both genes were expressed significantly higher in cotyledons than hypocotyl. Among light treatments, expression of all 31 genes in hypocotyls and cotyledon similar between high light and medium light conditions, whereas those of 28 genes were significantly increased under low light conditions, whose increases ranged from 1.06- to 6.35-fold. Only Lhca2 (Capana09G000146) and Lhca5 (Capana08G001647, Capana08G001648) incurred significantly reduced expression levels under low light, these decreasing by 1.08- to 3.29-fold.

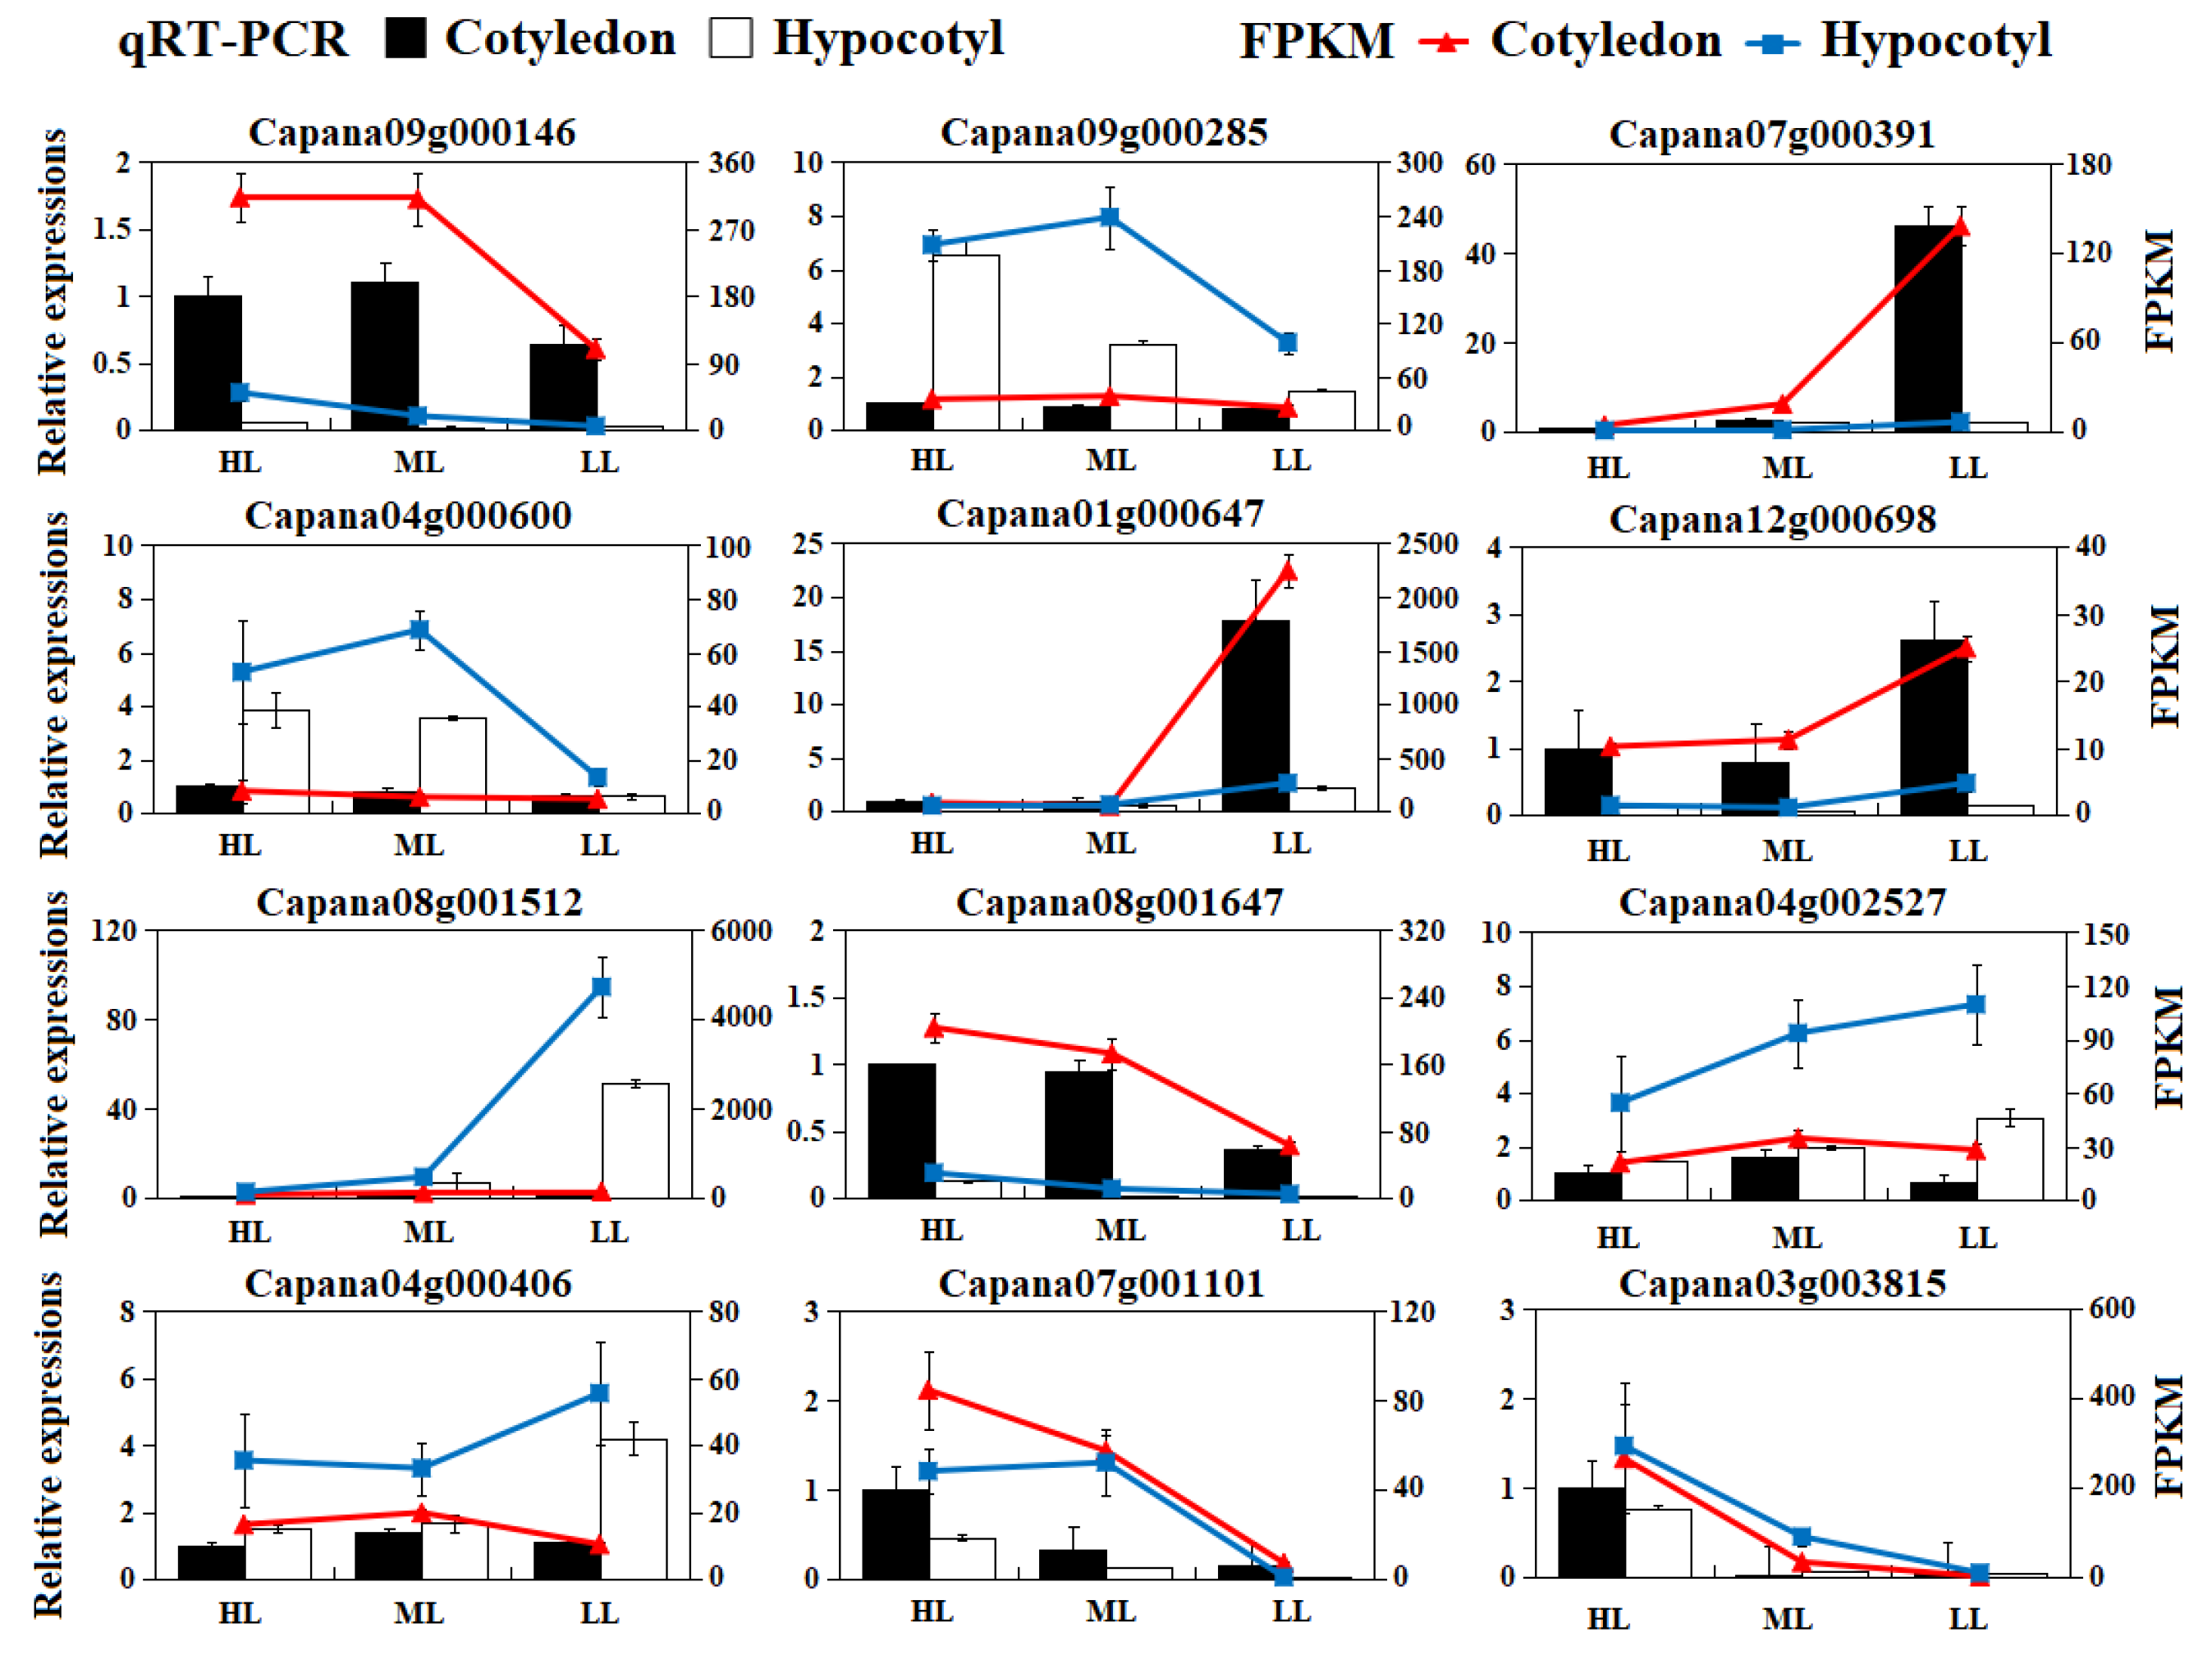
3.9. RT-qPCR Validation of Gene Expression Patterns

In order to validate the RNA-Seq results above, a RT-qPCR analysis was performed on 12 selected genes by using gene-specific primers. Transcript abundance patterns were calculated over the cotyledon and hypocotyl sample under the three different light conditions. The RT-qPCR analysis resulted in similar trends of transcript abundance when assessed by real-time RT-qPCR (Figure 8), thus confirming the FPKM values of transcripts determined by RNA-Seq in this study were reliable.

4. Discussion

The light-harvesting proteins LHCA and LHCB can participate in light-harvesting and chloroplast metabolism, and they maintain high photosynthetic capacity by consuming excess energy for light protection [18,19]. One study found that low light is the best condition for expression of the Lhc gene [20]. In high light, Lhc gene expression is down-regulated and light capture efficiency is reduced [21]. However, the expression of Lhca5 in A. thaliana and other plants is significantly increased by their exposure to high light intensity [22]. In our study, the expression of most Lhca and all Lhcb genes in hypocotyls and cotyledons of pepper were significantly increased under low light conditions, while that of Lhca5 (Capana08g001647 and Capana08g001648) were higher under high light. This pattern, which is basically consistent with the results of previous studies, indicates that most Lhca and Lhcb genes can maintain the normal photosynthetic capacity of pepper seedlings growing in low light by ramping up expression to capture more light capture.
Plants have evolved sophisticated light receptors and signaling networks that detect and respond to changes in light intensity [23]. The interaction between light and auxin helps regulate a wide range of developmental processes [23]. Environmental light signals control the distribution of auxin through the seedling [24]. It was reported that light and auxin co-regulate a number of downstream genes (SAUR) in Arabidopsis thaliana [25], the photoreceptors are shown to interact with IAA proteins to prevent the degradation of IAA proteins mediated by auxin receptors [26,27]. Studies have shown that AUX/IAA family genes can be induced by light signal trans-duction and this can affect the growth and development of plants’ hypocotyl/stem [28,29]. Here, the expression levels of IAA4, IAA14, IAA16, AUX22-like, and AUX22D-like were significantly increased under low light, while those of IAA1 and IAA16-like were significantly decreased, indicating that the activity of all these genes were affected by light induction and resulted in expression changes. Auxin is a core endogenous phytohormone that regulates plant growth and development. In contrast to the light signal, auxin promotes hypocotyl elongation [23,30]. Several auxin biosynthesis deficient or excessive mutants, such as sav3/taa1 and yucca lead to reduced seedling hypocotyl elongation and cotyledon expansion [31,32]. Xi (2020) found that the gain-of-function mutation in IAA3 caused hyposensitivity to light, whereas disruption of IAA3 led to an elongated hypocotyl under different light intensity conditions. This study revealed the interaction mechanism of light and auxin on the regulation of hypocotyl growth [32]. Except that IAA3 negatively regulates the expression of PIF dependent genes, it can also interact with some non-canonical IAA proteins, demonstrating that AUX/IAA family members play redundant roles in hypocotyl elongation, and these atypical IAAs interacting with PIF may also regulate hypocotyl elongation [33,34]. Therefore, we hypothesized that the increased expression of IAA4, IAA14, IAA16, AUX22-like and AUX22D-like genes would induce rapid hypocotyl elongation in peppers.
One of the most striking events in light-controlled morphogenesis is hypocotyl elongation. Brassinosteroids (BRs) and their signal transduction have long been recognized as being involved in light-regulated hypocotyl elongation in plants [35,36]. Hypocotyl growth is a developmental event with high plasticity, and it is antagonistically modulated by environmental light and endogenous auxin signals [34]. Under dark conditions, the hypocotyls of BR-deficient mutants are shorter than those of conspecific wild types, suggesting that BR promotes hypocotyl elongation [37]. Low light signals trigger the synthesis of auxin in cotyledons, which is then transported to promote Hypocotyl elongation, which is mediated by the interaction between IAA and different types of transcription factors, including ARF and BZR1 [33]. In the BR signaling pathway, BR binds and activates the receptor kinase BRI1, which further interacts with BAK1 to activate BR signaling. The activated BRI1 phosphorylates BSK1, which in turn activates BSU1 and then inactivates BIN2. Although BIN2 is a negative regulator of the BR response and cell elongation [37], Li et al. [38] found that greater light exposure enhanced the expression of ELONGATED HYPOCOTYL 5 (HY5), which bolstered by BIN2 kinase activity by promoting autophosphorylation of BIN2 Tyr200, thereby inhibiting the accumulation of transcription factor Brassinazole-resistant 1 (BZR1). In our study, the expression of BRI1 (Capana12g001867) and BIN2 (Capana00g000724) were significantly greater under the low light than high light treatment. This indicates that BR can bind to the rich receptor kinase BRI1, activating BR signal, to phosphorylate BSK1 and BSU1 under low light conditions, thus inactivating the rich expression of BIN2 and inhibiting its transcriptional activity via phosphorylation of BZR1/2. BZR1/2 is a transcriptional suppressor that regulates both BR synthesis and the downstream growth response [39]. Work by He et al. [40] found that interfering with the binding of BZR1 to DNA, or promoting the phosphorylation of BZR1, could inhibit the signal transduction of BR, thus inhibiting hypocotyl elongation. However, increasing the proportion of BZR1′s active form is capable of strengthening BR signal transduction and this promotes hypocotyl elongation [41]. Here, the expression of BZR1/2 (Capana04g000406) in hypocotyls was significantly higher than that in cotyledon, which may indicate that the proportion of their active forms was higher and that BZR1 was able to bind well to DNA. Meanwhile, the expression of TCH4 (Capana07g000060) and CYCD3 (Capana03g002253) under low light were significantly higher than those under high light and medium light, which promoted the division and elongation of pepper’s hypocotyl cells under low light, leading to its hypocotyl elongation.

5. Conclusions

In this study, a total of 35,341 genes were identified, of which 3657 were differentially expressed between hypocotyls and cotyledons. Under different light intensities, the number of differentially expressed genes in cotyledons was higher than that in stems. Many genes in the difference mainly involve the response to auxin and light harvesting conditions. Some genes related to brassinolide receptor protein kinase (BRI1), two light capture proteins (LHCa and LHCb) and an auxin response factor are sensitive to different levels of light in cotyledons and hypocotyls of pepper. Especially in low light, the expression of IAA4, IAA14, IAA16, AUX22-like and AUX22D-like increased significantly. The expression of brassinolide receptor protein kinases BRI1 and BIN2 also increased and obviously exceeded their expression under strong light. The changes of these genes may induce the rapid elongation of hypocotyls of seedlings, and even participate in some light regulation mechanisms of the mutant. These results provide a reasonable basis and potential candidate genes for understanding the molecular regulation mechanism of light on pepper seedling growth and hypocotyl elongation.

Supplementary Materials

The following are available online at https://www.mdpi.com/article/10.3390/agronomy12112762/s1, Table S1: the data of light, Table S2: all the primers used for RT-qPCR in this study, Table S3: transcriptome data, Table S4: DEGs in different comparison groups.

Author Contributions

Conceived and designed the experiments: S.Y., Z.L. (Zhoubin Liu) and L.O.; performed the ex-periments: L.M. and Y.D.; analyzed the data: L.M., Y.H.; contributed reagents/materials/analysis tools: H.S., Z.L. (Ziyu Li), B.Y., Z.Z. and W.C.; wrote the paper: S.Y. and L.M. All authors have read and agreed to the published version of the manuscript.

Funding

This work was funded by Ministry of Finance and Ministry of Agriculture and Rural Affairs of China (Grant No. CARS-24-A05), the Natural Science Foundation of Hunan Province (Grant No. 2021JJ40240), and Special Project of Biological Seed Industry and Fine and Deep Processing of Agricultural Products (Grant No. 202202AE090031).

Data Availability Statement

Transcriptome data has been uploaded to the public database and can be found in http://www.ncbi.nlm.nih.gov/sra (This data has been accessible since 28 May 2022). Found in, login number PRJNA733289. Physiological data are included in the article.

Conflicts of Interest

The authors declare no conflict of interest.

References

  1. Zhu, Z.S.; Sun, B.M.; Cai, W.; Zhou, X.; Mao, Y.H.; Chen, C.J.; Wei, J.L.; Cao, B.H.; Chen, C.M.; Chen, G.J.; et al. Natural vari-ations in the MYB transcription factor MYB31 determine the evolution of extremely pungent peppers. New Phytol. 2019, 223, 922–938. [Google Scholar] [CrossRef] [PubMed]
  2. Sun, B.M.; Zhou, X.; Chen, C.M.; Chen, C.J.; Chen, K.H.; Chen, M.X.; Liu, S.J.; Chen, G.J.; Cao, B.H.; Cao, F.R.; et al. Coexpression network analysis reveals an MYB transcriptional activator involved in capsaicinoid biosynthesis in hot peppers. Hortic. Res. 2020, 7, 162. [Google Scholar] [CrossRef] [PubMed]
  3. Hernández, R.; Kubota, C. Physiological responses of cucumber seedlings under different blue and red photon flux ratios using LEDs. Environ. Exp. Bot. 2016, 29, 66–74. [Google Scholar] [CrossRef]
  4. Chen, M.; Chory, J.; Fankhauser, C. Light signal transduction in higher plants. Annu. Rev. Genet. 2004, 38, 87. [Google Scholar] [CrossRef] [Green Version]
  5. Lu, N.; Toru, M.; Masahumi, J.; Masaaki, H.; Satoru, T.; Yoshikazu, I.; Takuya, I.; Yutaka, S. Effects of Supplemental Lighting with Light-Emitting Diodes (LEDs) on Tomato Yield and Quality of Single-Truss Tomato Plants Grown at High Planting Density. Seibutsu Kankyo Chosetsu 2012, 50, 63–74. [Google Scholar] [CrossRef] [Green Version]
  6. Liu, Y.; Wei, H.B.; Ma, M.D.; Li, Q.Q.; Kong, D.X.; Sun, J.; Ma, X.J.; Wang, B.B.; Chen, C.X.; Xie, Y.R.; et al. Arabidopsis FHY3 and FAR1 Proteins Regulate the Balance between Growth and Defense Responses Under Shade Conditions. Plant Cell 2019, 31, 2089–2106. [Google Scholar] [CrossRef] [Green Version]
  7. Shin, J.; Kim, K.; Kang, H.; Zulfugarov, I.S.; Bae, G.; Lee, C.H.; Lee, D.; Choi, G. Phytochromes promote seedling light responses by inhibiting four negatively-acting phytochrome-interacting factors. Proc. Natl. Acad. Sci. USA 2009, 106, 7660–7665. [Google Scholar] [CrossRef] [Green Version]
  8. Franklin, K.A.; Quail, P.H. Phytochrome functions in Arabidopsis development. J. Exp. Bot. 2010, 61, 11–24. [Google Scholar] [CrossRef] [Green Version]
  9. Chen, F.; Li, B.S.; Demone, J. Photoreceptor partner FHY1 has an independent role in gene modulation and plant development under far-red light. Proc. Natl. Acad. Sci. USA 2014, 111, 11888–11893. [Google Scholar] [CrossRef] [Green Version]
  10. Chen, M.; Chory, J. Phytochrome signaling mechanisms and the control of plant development. Trends Cell Biol. 2011, 21, 664–671. [Google Scholar] [CrossRef]
  11. Procko, C.; Crenshaw, C.M.; Ljung, K.; Noel, J.P.; Chory, J. Cotyledon-Generated Auxin Is Required for Shade-Induced Hypocotyl Growth in Brassica rapa. Plant Physiol. 2014, 165, 1285–1301. [Google Scholar] [CrossRef] [PubMed] [Green Version]
  12. Ma, Q.Q.; Wang, X.H.; Sun, J.B.; Mao, T.L. Coordinated Regulation of Hypocotyl Cell Elongation by Light and Ethylene through a microtubule destabilizing protein. Plant Physiol. 2018, 176, 678. [Google Scholar] [CrossRef] [PubMed] [Green Version]
  13. Sun, J.Q.; Qi, L.L.; Li, Y.N.; Chu, J.F.; Li, C.Y. PIF4–Mediated Activation of YUCCA8 Expression Integrates Temperature into the Auxin Pathway in Regulating Arabidopsis Hypocotyl Growth. PLoS Genet. 2012, 8, e1002594. [Google Scholar] [CrossRef] [PubMed] [Green Version]
  14. Seo, D.H.; Yoon, G.M. Light-induced stabilization of ACS contributes to hypocotyl elongation during the dark-to-light transition in Arabidopsis seedlings. Plant J. 2019, 98, 898–911. [Google Scholar] [CrossRef] [PubMed]
  15. Yang, S.; Zhang, Z.Q.; Chen, W.C.; Liang, C.L.; Zou, X.X. Fine-mapping and transcriptome analysis of the photosensitive leaf -yellowing gene CaLY1 in pepper (Capsicum annuum L.). Hortic. Plant J. 2022, 8, 1–11. [Google Scholar] [CrossRef]
  16. Osorio, S.; Alba, R.; Nikoloski, Z.; Kochevenko, A.; Fernie, A.; Giovannoni, J. Integrative comparative analyses of transcript and metabolite profiles from pepper and tomato ripening and development stages uncovers species-specific patterns of network regulatory behavior. Plant Physiol. 2012, 159, 1713–1729. [Google Scholar] [CrossRef] [Green Version]
  17. Livak, K.; Schmittgen, T. Analysis of relative gene expression data using real-time quantitative PCR and the 2(−ΔΔCT) method. Methods 2002, 25, 402–408. [Google Scholar] [CrossRef]
  18. Kubota, K.H.; Burton-Smith, R.N.; Tokutsu, R.; Song, C.H.; Akimoto, S.; Yokono, M.; Ueno, Y.; Kim, E.; Watanabe, A.; Murata, K.; et al. Ten antenna proteins are associated with the core in the supramolecular organization of the photosystem I supercomplex in Chlamydomonas reinhardtii. J. Biol. Chem. 2019, 294, 4304–4314. [Google Scholar] [CrossRef]
  19. Gerotto, C.; Franchin, C.; Arrigoni, G.; Morosinotto, T. In Vivo Identification of Photosystem II Light Harvesting Complexes Interacting with photosystem ii subunits. Plant Physiol. 2015, 168, 1747–1761. [Google Scholar] [CrossRef] [Green Version]
  20. Pötter, E.; Kloppstech, K. Effects of light stress on the expression of early light-inducible proteins in barley. Eur. J. Biochem. 1993, 214, 779–786. [Google Scholar] [CrossRef]
  21. Klimmek, F.; Sjödin, A.; Noutsos, C.; Leister, D.; Jansson, S. Abundantly and rarely expressed Lhc protein genes exhibit distinct regulation patterns in plants. Plant Physiol. 2006, 140, 793–804. [Google Scholar] [CrossRef] [Green Version]
  22. Ganeteg, U.; Klimmek, F.; Jansson, S. Lhca5—An LHC-type protein associated with photosystem I. Plant Mol. Biol. 2004, 54, 641–651. [Google Scholar] [CrossRef] [PubMed]
  23. Halliday, K.J.; Martinez-Garcı’a, J.F.; Josse, E.M. Integration of light and auxin signaling. Cold Spring Harb. Perspect. Biol. 2009, 1, a001586. [Google Scholar] [CrossRef] [PubMed] [Green Version]
  24. Salisbury, F.J.; Hall, A.; Grierson, C.S.; Halliday, K.J. Phytochrome coordinates Arabidopsis shoot and root development. Plant J. 2007, 50, 429–438. [Google Scholar] [CrossRef] [PubMed]
  25. Sun, N.; Wang, J.J.; Gao, Z.X.; Dong, J.; He, H.; Terzaghi, W. Arabidopsis SAURs are critical for differential light regulation of the development of various organs. Proc. Natl. Acad. Sci. USA 2016, 113, 6071–6076. [Google Scholar] [CrossRef] [Green Version]
  26. Xu, F.; He, S.; Zhang, J.; Mao, Z.; Wang, W.; Li, T. Photoactivated CRY1 and phyB Interact Directly with AUX/IAA Proteins to Inhibit Auxin Signaling in Arabidopsis. Mol. Plant. 2017, 17, 30373–30378. [Google Scholar] [CrossRef] [Green Version]
  27. Yang, C.; Xie, F.; Jiang, Y.; Li, Z.; Huang, X.; Li, L. Phytochrome A Negatively Regulates the Shade Avoidance Response by Increasing Auxin/Indole Acidic Acid Protein Stability. Dev. Cell 2018, 44, 29–41. [Google Scholar] [CrossRef] [Green Version]
  28. Kloosterman, B.; Visser, R.G.; Bachem, C.W. Isolation and characterization of a novel potato Auxin/Indole-3-Acetic Acid family member (StIAA2) that is involved in petiole hyponasty and shoot morphogenesis. Plant Physiol. Biochem. 2006, 44, 766–775. [Google Scholar] [CrossRef]
  29. Deng, W.; Fang, Y.; Liu, M.; Wang, X.Y.; Li, Z.G. Down-regulation of SlIAA15 in tomato altered stem xylem de-velopment and production of volatile compounds in leaf exudates. Plant Signal. Behav. 2012, 7, 911–913. [Google Scholar] [CrossRef] [Green Version]
  30. Oh, E.; Zhu, J.Y.; Bai, M.Y.; Arenhart, R.A.; Sun, Y.; Wang, Z.Y. Cell elongation is regulated through a central circuit of interacting transcription factors in the Arabidopsis hypocotyl. Elife 2014, 3, e03031. [Google Scholar] [CrossRef]
  31. Tao, Y.; Ferrer, J.L.; Ljung, K.; Pojer, F.; Hong, F.; Long, J.A. Rapid synthesis of auxin via a new tryptophan-dependent pathway is required for shade avoidance in plants. Cell 2008, 1, 164–176. [Google Scholar] [CrossRef] [PubMed] [Green Version]
  32. Zhao, Y.; Christensen, S.K.; Fankhauser, C.; Cashman, J.R.; Cohen, J.D.; Weigel, D. A role for flavin monooxygenase-like enzymes in auxin biosynthesis. Science 2001, 291, 306–309. [Google Scholar] [CrossRef] [PubMed]
  33. Xi, Y.; Yang, Y.; Yang, J.; Zhang, X.; Pan, Y.; Guo, H. IAA3-mediated repression of PIF proteins coordinates light and auxin signaling in Arabidopsis. PLoS Genet. 2021, 17, e1009384. [Google Scholar] [CrossRef] [PubMed]
  34. Nagpal, P.; Walker, L.M.; Young, J.C.; Sonawala, A.; Timpte, C.; Estelle, M.; Reed, J.W. AXR2 encodes a member of the Aux/IAA protein family. Plant Physiol. 2000, 123, 563–574. [Google Scholar] [CrossRef] [PubMed] [Green Version]
  35. Kim, T.W.; Guan, S.; Sun, Y.; Deng, Z.; Tang, W.; Shang, J.X.; Sun, Y.; Burlingame, A.L.; Wang, Z.Y. Brassinosteroid signal transduction from cell-surface receptor kinases to nuclear transcriptionfactors. Nat. Cell Biol. 2009, 11, 1254–1260. [Google Scholar] [CrossRef] [PubMed]
  36. García, B.S.; Lucas, M.D.; Martínez, C.; Ruiz, A.E.; Davière, J.M.; Prat, S. BR-dependent phosphorylation modulates PIF4 transcriptional activity and shapes diurnal hypocotyl growth. Genes Dev. 2014, 28, 1681–1694. [Google Scholar] [CrossRef] [Green Version]
  37. Li, J.; Nam, K.H.; Vafeados, D.; Chory, J. BIN2, a new brassinosteroidinsensitive locus in Arabidopsis. Plant Physiol. 2001, 127, 14–22. [Google Scholar] [CrossRef] [Green Version]
  38. Li, H.; Yang, Z.; Zeng, Q.W.; Wang, S.B.; Luo, Y.W.; Huang, Y.; Xin, Y.C.; He, N.J. Normal expression of bHLH3 disrupts a flavonoid homeostasis network, causing differences in pigment composition among mulberry fruits. Hortic. Res. 2020, 7, 83. [Google Scholar] [CrossRef]
  39. He, J.X.; Gendron, J.M.; Sun, Y.; Gampala, S.L.; Gendron, N.; Sun, C.Q.; Wang, Z.Y. BZR1 is a transcriptional re-pressor with dual roles in brassinosteroid homeostasis and growth responses. Science 2005, 307, 1634–1638. [Google Scholar] [CrossRef] [Green Version]
  40. He, G.H.; Liu, J.; Dong, H.X.; Sun, J.Q. The Blue Light Receptor CRY1 Interacts with BZR1and BIN2 to Modulate the Phosphorylation and Nuclear Function of BZR1 in Repressing BR Signaling in Arabidopsis. Mol. Plant. 2019, 12, 689–703. [Google Scholar] [CrossRef]
  41. Kim, B.; Jeong, Y.J.; Corvalán, C.; Fujioka, S.; Cho, S.; Park, T.; Choe, S. Darkness and gulliver2/phyB mutation decrease the abundance of phosphorylated BZR1 to activate brassinosteroid signaling in Arabidopsis. Plant J. 2014, 77, 737–747. [Google Scholar] [CrossRef] [PubMed]
Figure 1. Plants under different light intensities. (A) Observation of plant phenotype under different light intensities; (B) Changes of plant phenotypic indicators under different light intensities. HL: high light; ML: medium light; LL: low light. The same letter in the same column indicates no significant differences among values (p < 0.05).
Agronomy 12 02762 g001
Figure 2. Statistics of the identified genes in pepper. (A) Venn diagrams indicating the identified genes in cotyledon and hypocotyl tissues; (B,C) show the identified genes’ coverage in different light treatment in cotyledon and hypocotyl, respectively; (D) Venn diagrams of DEGs identified in different tissues under the same light treatment; in (E,F) are Venn diagrams of DEGs under different light intensities in cotyledons and hypocotyls, respectively. L: low light; M: middle light; H: high light.
Agronomy 12 02762 g002
Figure 3. GO analysis of DEGs in pepper. BP, biological process; MF, molecular function; CC, cellular component. L: low light; M: middle light; H: high light. IMP: isopentenyl diphosphate biosynthetic process, methylerythritol 4-phosphate pathway; TT hexosyl groups: transferase activity, transferring hexosyl groups; HH O-glycosyl compounds: hydrolase activity, hydrolyzing O-glycosyl compounds.
Agronomy 12 02762 g003
Figure 4. Heat map analysis of AUX/IAA family genes.
Agronomy 12 02762 g004
Figure 5. KEGG analysis of DEGs in pepper.
Agronomy 12 02762 g005
Figure 6. Comparative analysis of brassinosteroid signal transduction pathway genes in pepper.
Agronomy 12 02762 g006
Figure 7. Comparative analysis of photosynthesis-antenna proteins pathway genes in pepper.
Agronomy 12 02762 g007
Figure 8. Validation and expression analysis of selected genes using RT-qPCR (p ≤ 0.05).
Agronomy 12 02762 g008
Publisher’s Note: MDPI stays neutral with regard to jurisdictional claims in published maps and institutional affiliations.

