Abstract
Coconut (Cocos nucifera) fruit has attracted consumer interest due to its health benefits, especially the consumption of coconut water produced from 6–7-month-old coconut fruit. Consequently, by-products from young coconut fruit are also being expanded, including coconut mesocarp containing phenolic compounds. Therefore, this study aimed to provide new applications for young coconut mesocarp wastes. Specifically, optimizing the ultrasound-assisted extraction (UAE) of phenolic compounds from coconut mesocarp using a Box–Behnken design in conjunction with response surface methodology (RSM). The effects of three extraction variables, such as temperature (10–70 °C), solvent-to-sample ratio (20:1–10:1 mL g−1), and pulse duty cycle (0.4–1.0 s−1) were examined on the level of total phenolic content (TPC) and antioxidant activity of the extract. Subsequently, the optimum UAE condition was predicted using RSM models with coefficients of determination (R2) higher than 0.94, low prediction errors (less than 2.34), and non-significant lack-of-fit values (p < 0.05) for the two responses. Extraction time was evaluated through kinetic (5 to 25 min) studies applying the optimum extraction temperature (70 °C), solvent-to-sample ratio (20:1 mL g−1), and pulse duty cycle (0.55 s−1). An efficient extraction was achieved within 5 min, resulting in an extract with 47.78 ± 1.24 mg GAE 100 g−1 DW for the total phenolic compounds and high antioxidant activity (87.28 ± 1.01% DPPH). Extraction by ultrasound was then concluded to facilitate a fast extraction rate with high reproducibility (coefficients of variation were less than 3% in the levels of antioxidant activity and phenolic compounds).
1. Introduction
Previous studies have shown the beneficial effect of coconut fruit (Cocos nucifera) on several degenerative disorders, such as cardiovascular diseases, diabetes, and high blood pressure [1]. These facts triggered the increase in coconut consumption in recent years (reaching approximately 60 million tons between 2017 and 2018), and continues to grow [2]. Large quantities of coconut fruit are consumed in households and industries, resulting in a significant accumulation of by-products such as endocarp, mesocarp, and exocarp (approximately 80% of the weight). As a result, these by-products could generate an environmental problem in the development of the coconut industry.
Several studies reported that coconut by-products contain phenolic compounds such as phenolic acids (protocatechuic, chlorogenic, vanillic, gallic, and ellagic acids) and flavanols (catechin and epicatechin) [3,4,5,6,7,8,9]. Extracts from plants containing phenolic compounds have attracted considerable scientific interest since their application improves the functional and physical aspects of the body and food system.
Young coconut mesocarp provides some health benefits, such as hypoglycemic activity [10], preventing cardiovascular disease [11], and antidiabetic activity [12]. Moreover, phenolic compounds from coconut mesocarp can be used as antifungals, as shown in the study of Cortes-Rivera et al. (2019) [13]. Coconut mesocarp aqueous extract can inhibit fungal growth by reducing the mycelial growth and spore germination in citrus fruits. Furthermore, the phenolic extract from coconut mesocarp can improve the textural properties of sardine surimi [14] and positively affect its oxidative stability, such as preventing rancidity and lipid oxidation during refrigerated storage of surimi [15]. Hence, some researchers have proposed extracting natural and inexpensive food additives from plants and their by-products [16,17,18,19,20,21].
Several conventional techniques for the extraction of phenolics from coconut mesocarp include solid–liquid maceration [6,8,22,23], hot water extraction [24], and Soxhlet extraction [25]. However, such time-consuming extractions could generate degradation of the phenolic compounds. Extraction of bioactive compounds by ultrasound using 20–100 kHz is an alternative technology that facilitates a faster extraction rate with high reproducibility and a reduced amount of extraction solvent while increasing the efficiency of the process [26]. Additionally, ultrasound-assisted extraction (UAE) can be carried out at lower temperatures, thus preventing the thermal degradation of the phenolic compounds contained in the coconut mesocarp. During the application of ultrasounds, the cavitation processes generate bubbles which cause the decomposition of the plant cell walls, thus enhancing the mass transfer. Furthermore, optimizing some experimental factors, such as the frequency of ultrasonic waves, pulse duty cycle, and extraction time, can improve extraction recovery [27,28].
The ultrasound-assisted extraction (UAE) of phenolic compounds was applied for food industry by-products such as peels (orange, pomegranate, eggplant, and mulberry) [21,29,30,31], seeds (baobab) [32], bran (sorghum) [33], and spent coffee [34]. Hence, the study aimed to develop an optimized UAE to extract phenolic compounds from a young coconut mesocarp that provides high antioxidant activity. Ultimately, the individual phenolic compounds in the ultrasound-producing extract were also identified and evaluated during the kinetic studies.
2. Materials and Methods
2.1. Chemicals
Ethanol HPLC grade (Fischer Scientifics, Loughborough, UK) and ultrapure water supplied by a Millipore Milli-Q system (Bedford, MA, USA) were used as the extraction solvent. Additional to Milli-Q water, the mobile phases of ultrahigh-performance liquid chromatography (UHPLC) consisted of acetonitrile (Panreac Química SAU, Barcelona, Spain) and acetic acid (Merck KGaA, Darmstadt, Germany). The 2,2-diphenyl-1-picrylhydrazyl (DPPH) reagent, Folin reagent, sodium carbonate, and phenolic standard compounds (protocatechuic acid, gallic acid, chlorogenic acid, catechin, and caffeic acid) of the highest purity were obtained from Sigma-Aldrich (Steinheim, Germany).
2.2. Plant Material
The 6-month-old coconut (Cocos nucifera L.) fruits were harvested by local farmers in Yogyakarta, Indonesia. They were washed, cut manually, and the mesocarp was separated from other parts of the fruit, as explained in our former study [9]. The mesocarp was cut into a block shape (40 × 10 × 5 mm) and dried in a cabinet dryer at 50 °C for 48 h. Subsequently, the dried samples were powdered and sieved at 60 mesh, then packaged in a sealed container, and kept at room temperature until extraction.
2.3. Extraction of Phenolic Compounds
The ultrasound-assisted extraction of phenolic compounds was carried out using a 7 mm diameter probe with a power of 200 W UP200St and a frequency of 26 kHz (Hielscher Ultrasonics GmbH, Teltow, Germany). The temperature was controlled with a Frigiterm-TFT-10 thermostat water bath (J.P. Selecta S.A., Barcelona, Spain). Our former study revealed that 50% ethanol in water was a suitable extraction solvent to acquire phenolic compounds with high antioxidant activity from coconut mesocarp [9]. A precise amount (1 g) of young coconut mesocarp powder was placed in a cylindrical glass of 2 cm inner diameter, after which 50% ethanol was added based on the experimental design. The probe tip was submerged to a depth of approximately 0.5 cm into the mixture after the temperature was set to 10, 40, and 70 °C. The pulse duty cycle used in the study was 0.4, 0.7, and 1 s−1. The extraction time was set to 5 min and further optimized using a kinetic study to obtain the most efficient time. After extraction, the sample was immediately transferred to 15 mL falcon tubes and centrifuged at 4500 rpm for 15 min. The supernatants were collected and concentrated using a rotary evaporator. Finally, the samples were stored at 4 °C before analysis.
2.4. Analysis of Total Phenolic Content (TPC)
The Folin–Ciocalteu method was used to evaluate the total phenolic content according to the former method [35]. Diluted 200 μL extract in 1 mL of Milli-Q water was mixed with 800 μL of 10% Folin–Ciocalteu reagent. After 2 min, 1 mL of 7.5% sodium carbonate was added to the mixture and allowed to stand at room temperature for 120 min. The absorbance values were evaluated using a UV-Vis spectrophotometer at 765 nm (UV-2450, Shimadzu Corporation, Kyoto, Japan). A calibration curve of gallic acid was established at concentrations ranging from 10 to 110 μg mL−1. Finally, the results are expressed in gallic acid equivalents (mg GAE g−1 of dry matter).
2.5. DPPH Radical Scavenging Activity (DPPH-RSA)
The antioxidant activity of the extract was measured using 2,2-diphenyl-1-picrylhydrazyl (DPPH) according to the former method [36] with minor modification. The liquid extract (100 μL) was mixed with 1.9 mL DPPH solution (0.06 mM). The mixture was then homogenized and incubated in the dark at ambient temperature for 30 min. The absorbance value of the mixture was measured by a UV–Vis spectrophotometer at 515 nm (UV-2450, Shimadzu Corporation, Kyoto, Japan). The DPPH solution was used as the control. Finally, the following formula was used to calculate the percentage of inhibition of DPPH:
2.6. Analysis of Individual Phenolic Compounds
The ACQUITY UPLC H-Class System with a photodiode array (PDA) detector was used for the chromatographic analyses. The detector used a 3D scanning mode of 210–600 nm to identify the phenolic compounds by evaluating the spectral properties of the resulting peak in the chromatogram. The management software for the UPLC system was Empower 3 Chromatography Data (Waters Corporation, Milford, MA, USA). The phenolic compounds in the 1.5 µL injected extract were separated using a reversed-phase column C18 (100 mm length; 2.1 mm ID; RP 18 CORTECS UPLC silica-based solid-core particle; 1.6 µm particle size from Waters) at 47 °C. The mobile phase is a binary solution composed of phases A (2% acetic acid in water) and B (2% acetic acid in acetonitrile) with a flow rate of 0.55 mL min−1. Finally, the programmed gradient of 13.0 min was as follows (%B): 0 min, 0%; 3 min 0%; 4 min, 5%; 5 min, 10%; 8 min, 20%; 9 min, 30%; 13 min, 100%.
2.7. Experimental Design
The levels of the studied variables were determined by reviewing the literature on coconut mesocarp extraction [7,24,37]. A Box–Behnken design (BBD) was used to determine the extraction efficiency of phenolic compounds by measuring the total phenolic content (TPC) and antioxidant activity (DPPH) in the ultrasound-producing extract. BBD provided feasible experimental runs, estimation of the quadratic model of parameters, detection of a lack-of-fit, and the possibility of using blocks. Three independent variables, including temperature (A), solvent-to-sample ratio (B), and pulse duty cycle (C) at three levels (−1, 0, +1), were selected. The experiments were conducted in triplicate. Table 1 shows the range and levels of each independent factor, while Table 2 presents the entire design, which consists of 16 experimental points in random order.

Table 1.
Independent factors and their levels.
Table 2.
Box–Behnken design for three factors of ultrasound-assisted extraction with their observed responses.
The resulting responses from BBD were used to evaluate the effect of each factor and establish polynomial models for the response surface. Since the objective was to optimize the responses, the best estimate of the correlation between independent factors and response surfaces was required. Hence, a second-order model was implemented in RSM:
where Y is the predicted response (TPC and antioxidant activity), A is temperature, B is the solvent-to-sample ratio, and C is pulse duty cycle. The regression coefficients were defined as intercept (βo), linear (β1, β2, β3), quadratic (β11, β22, β33), and interaction (β12, β13, β23) terms.
Y = β0 + ∑ β1A + ∑ β2B + ∑ β3C + ∑ β11A2 + ∑ β22B2 + ∑ β33C2 + ∑ β12AB + ∑ β13AC + ∑ β23BC
The desirability algorithm was applied to achieve the optimum extraction conditions from the two responses (TPC and antioxidant activity). The model was validated by the coefficient of determination (R2) and prediction error. Additionally, the lack-of-fit tests for the models were conducted by comparing residual variables of the current model and the variability between observational variables and replication settings.
2.8. Process Precision Evaluation
The precision of the extraction process was evaluated on two levels, i.e., intra- and interday. The intraday precision was measured by performing nine extractions under the optimum UAE condition on the same day. Meanwhile, the interday precision was evaluated by three consecutive days of three extractions. The results are expressed by the coefficient of variation (%CV).
2.9. Statistical Analysis
The experimental design was established, and the resulting data were analyzed using STATGRAPHICS Centurion XVI (Statpoint Technologies, Inc., New York, NY, USA). The significance of the main, interaction, and quadratic effects of independent variables was determined using the analysis of variance (ANOVA) at the p < 0.05 level. The experimental results from a single-factor experiment in a kinetic study were analyzed using an Analysis ToolPak added in Excel by Microsoft Office. A Duncan’s multiple range test (DMRT, p = 0.05) was used to identify the differences between the means.
3. Results
Before optimizing the ultrasound-assisted extraction of phenolic compounds from young coconut mesocarp, the effect of extraction variables on the recovery of phenolic compounds was measured.
3.1. Effects of Extraction Variables
A three-level Box–Behnken design was applied to study the effect of UAE conditions on antioxidant activity and total phenolic content (TPC) in coconut mesocarp extract. The three independent variables and the corresponding levels were temperatures (A) at 10, 40, and 70 °C, solvent-to-sample ratio (B) at 20:1, 15:1, and 10:1 mL solvent g−1 sample, and pulse duty cycle (C) at 0.4, 0.7, and 1.0 s−1, while the antioxidant activity and TPC were considered as responses. Table 2 shows the values of independent factors and the measured and predicted values of the two responses. The main, interaction, and quadratic effects of UAE variables on the two responses were evaluated by ANOVA. The standardized effects (p = 0.05) are represented in the Pareto chart in decreasing order of importance (Figure 1a,b).
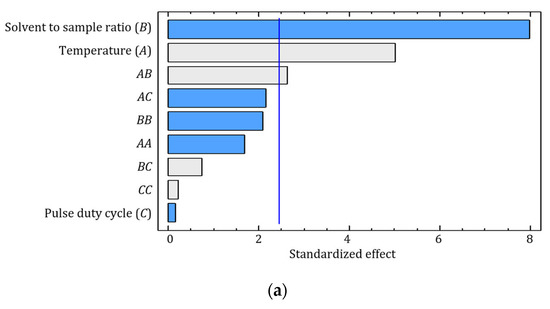
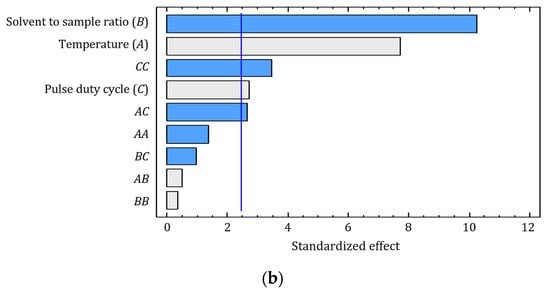
Figure 1.
Pareto chart of UAE factors and their effects (A, extraction temperature; B, solvent-to-sample ratio; C, pulse duty cycle) on antioxidant activity (a) and total phenolic content (b). The vertical lines that cross the bars indicate that the corresponding factor has a significant effect with 95% confidence in the response. The bar colors of  and
and  indicate positive and negative effects, respectively.
and indicate positive and negative effects, respectively.
Based on the Pareto diagram, it is possible to identify the essential effects of the extraction factors on the antioxidant activity of the resulting extract (Figure 1a). Bars crossing the vertical line significantly correspond to factors and combinations (p < 0.05) affecting the response. The extraction temperature (A) and the interaction with the solvent-to-sample ratio (AB) exhibited positive linearity. Meanwhile, the sample-to-solvent ratio had a negative effect, indicating a lower antioxidant activity of the extract when increasing the sample-to-solvent ratio.
The three independent factors (temperature, solvent-to-sample ratio, and pulse duty cycle) significantly (p < 0.05) contributed to the content of phenolic compounds (Figure 1b). Temperature (A) and pulse duty cycle (C) indicated a positive effect on the level of phenolic compounds. The result shows that the interaction between temperature and pulse duty cycle (AC) and the quadratic effect of pulse duty cycle (CC) contributed negatively to the increment of phenolic content in the extract.
The antioxidant activity and the level of phenolic compounds in the rising extraction temperature increased due to more significant cavitation nuclei formations at higher temperatures. Furthermore, high temperature contributes to improving mass transfer. It increases the force to break down the cell wall of the sample [38]. Remarkably, the pulse duty cycle is associated with ultrasonic effects such as the formation of microjet and acoustic streams [39]. The intensity of the ultrasound transmitted to the medium is directly related to the vibrational amplitude of the sonication that generates a large number of cavitation bubbles, resulting in a rise in extraction efficiency. The pulse duty cycle facilitates the degradation of sample cell walls, thus leading to the higher release of the phenolic compounds into the solvent [40].
3.2. Polynomial Models for the Response Surface
The experimental values of antioxidant activity and TPC in the extract of young coconut mesocarp varied due to different UAE conditions. The results were used to establish models for predicting the optimum variables for each response by regression analysis.
Antioxidant activity
Y = 81.45 + 0.26 × A + 104.37 × B − 1.95 × C − 0.01 × A2 + 5.36 × A × B − 0.37 × A × C − 5122.08 × C2 + 148.36 × B × C+ 3.55 × C2
Total phenolic content
where A, B, and C are temperature (°C), solvent-to-sample ratio (mL solvent g−1 sample), and pulse duty cycle (s−1), respectively.
Y = 25.69 + 0.34 × A − 227.03 × B + 59.83 × C − 0.01 × A2 + 0.49 × A × B − 0.22 × A × C + 409.66 × C2 − 94.51 × B × C − 28.13 × C2
The models were validated by high coefficients of determination (R2) of 0.9774 for antioxidant activity and 0.9701 for TPC. Additionally, the standard error of the predicted value revealed the residuals standard deviation of 3.0618 and 1.4623 for antioxidant activity and TPC, respectively. Furthermore, the values for the lack-of-fit test were higher than 0.05; thus, the models accurately described the observed data as satisfactory. Therefore, the models can be further used for multi-response optimization purposes.
3.3. Multi-Response Optimization
Three-dimensional surface plots were obtained using the desirability function of two polynomial equations for antioxidant activity and TPC (Figure 2). The multi-response optimization proposed the optimum UAE conditions: extraction temperature of 70 °C, solvent-to-sample ratio 20:1 mL g−1, and pulse duty cycle 0.55 s−1. Furthermore, optimum conditions were verified and produced similar results as predicted values. The experimental value of antioxidant activity was 88.69 ± 0.62%, and TPC was 48.05 ± 0.61 mg GAE/g, while the predicted value of antioxidant activity and TPC were 89.63% and 49.65 mg GAE/g, respectively.
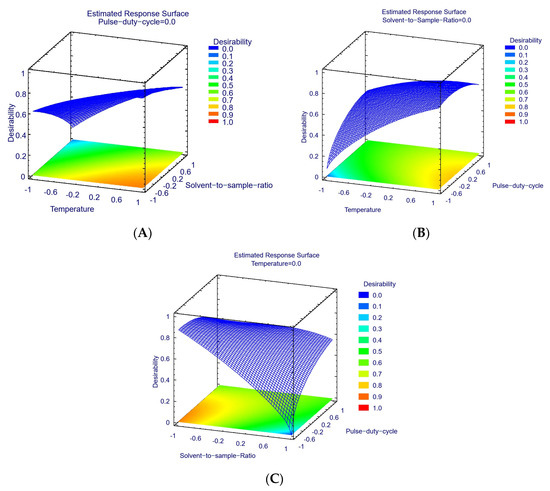
Figure 2.
The estimated multi-response surface of the studied factors: temperature and solvent-to-sample ratio (A), temperature and pulse duty cycle (B), and pulse duty cycle and solvent-to-sample ratio (C).
3.4. Identification of Phenolic Compounds
The individual phenolic compounds in the young coconut mesocarp extract were identified using UHPLC-PDA. The resulting chromatography (Figure 3) shows that the cinnamic acid group was the major phenolic in the resulting extract, such as chlorogenic acid and three caffeic acid derivatives. Additionally, the catechin and protocatechuic acid were also identified.
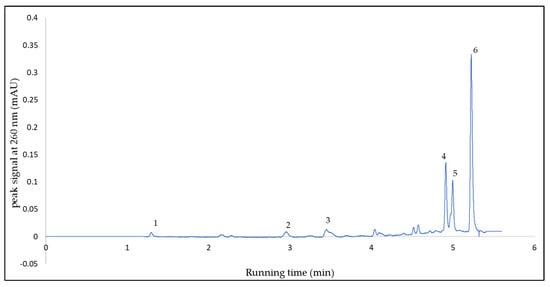
Figure 3.
Chromatogram of identified phenolic compounds: protocatechuic acid (1), catechin (2), chlorogenic acid (3), and caffeic acid derivatives (4,5,6).
The aforementioned phenolic compounds have been reported by previous studies to have high antioxidant activity so that they can be used as natural additives in the food system. Chlorogenic acid is considered a strong phenolic acid, and is widely used as a prebiotic, in food packaging, and as an antimicrobial and antioxidant agent to extend food shelf life [41]. Caffeic acid acts as a natural antioxidant that improves the oxidative stability of fish-fiber-restructured products [42]; meanwhile, catechin has been used to prolong the shelf life and reduce the oxidative rates in various food systems, such as salad dressing, meat, poultry, fat spreads, shortening, and bakery products. [43]. Protocatechuic acid exhibits a higher metal chelating activity than synthetic antioxidants, i.e., butylated hydroxytoluene (BHT), and is possibly utilized as a natural antioxidant [44].
Previous studies also reported that mature coconut mesocarp contains chlorogenic acid, dicaffeoylquinic acid, caffeoylshikimic acid, gallic acid, ellagic acid, catechin, procyanidin, and epicatechin [3,7], when extracted using methanol and water. Additionally, young coconut mesocarp extracted by maceration for 2 h using 50% methanol produced extract containing 4-hydroxybenzoic acid, epicatechin, catechin, gallic acid, vanillin, ferulic acid, vanillic acid, and syringic acid [8]. The major phenolic compounds in coconut mesocarp extracted using an aqueous alcoholic solvent were phenolic acids and flavan−3-ol.
3.5. Kinetic Study
Kinetic analysis was used to determine the most efficient extraction time by measuring two parameters: the level of individual phenolic compounds and antioxidant activities of the extracts collected at 5, 10, 15, 20, and 25 min of extraction time under the optimal UAE conditions (5 min of extraction time, 70 °C of temperature, 0.55 s−1 of pulse duty cycle, and 20:1 mgL−1 of solvent-to-sample ratio), as shown in Figure 4.
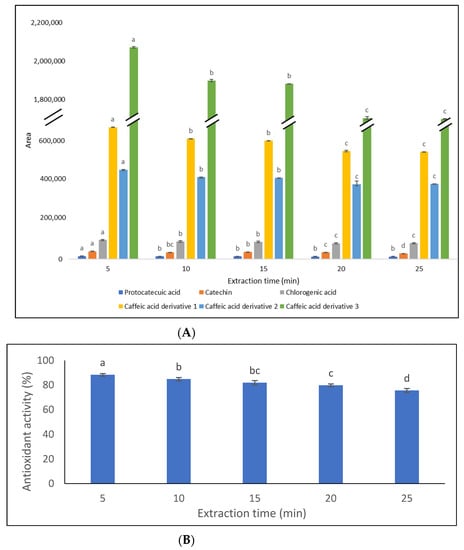
Figure 4.
The kinetic study of phenolic compounds (A) and antioxidant activity (B) in the young coconut mesocarp under optimum UAE extraction conditions (5 min of extraction time, 70 °C of temperature, 0.55 s−1 of pulse duty cycle, and 20:1 mL g−1 of solvent-to-sample ratio). Bars with different letters indicate significant differences at a p < 0.05 based on Duncan’s multiple range test.
Statistical analysis confirmed that the highest level of individual phenolic compounds and antioxidant activity occurred within 5 min of extraction time. The peak area of the phenolic compounds in decreasing order was protocatechuic acid (15,610 AU min), catechin (39,839 AU min), chlorogenic acid (97,152 AU min), and three derivatives of caffeic acids (664,635, 450,738, and 2,066,919 AU min). Meanwhile, the antioxidant activity was 88% in 5 min of extraction time.
Applying a longer extraction time significantly (p < 0.05) decreased the phenolic extraction recovery, as shown in Figure 4A. This result is also supported by the antioxidant activity that produced the highest activity in 5 min of extraction time and subsequently decreased significantly (p < 0.05) as the extraction time increased, as presented in Figure 4B. The increase in the extraction time is directly related to the exposure of the analyte due to environmental factors. The escalation of ultrasound waves damages the matrix and affects to the rising of temperature in the extraction mixture, lead to the degradation of phenolic compounds due to the high temperature [45]. The time-consuming extraction usually occurs in the conventional technique, such as 10 h by Soxhlet extraction [25] and 2 h by maceration [8]. The study found that the extraction time of young coconut mesocarp can be reduced to 5 min and ensure the most efficient process.
3.6. Precisions of UAE Process
The precision of the UAE process was evaluated at two levels: intra- (n = 9) and interday (n = 3 × 3) precision, which is expressed in %CV, as shown in Table 3. The results show a high precision of the extraction method, indicated by similar experimental values for the responses under optimum conditions, which are in close agreement with the predicted values described in Table 3.
Table 3.
The predicted and experimental value of the optimum condition.
All CV values were below 5%, indicating that the developed UAE process produced a consistent quality of extract regarding the level of phenolic compounds and antioxidant activity. Hence, the UAE conditions proposed by this study can be used to produce an extract from underutilized young coconut mesocarp as a natural antioxidant source.
4. Conclusions
The ultrasound-assisted extraction (UAE) was successfully optimized using the Box–Behnken design to recover the phenolic compounds from young coconut mesocarp with high antioxidant activity. The optimum UAE condition includes extraction time, temperature, pulse duty cycle, and a solvent-to-sample ratio of 5 min, 70 °C, 0.55 s−1, and 20:1 mL g−1, respectively. The optimum condition provided antioxidant activity and TPC values of 88.69 ± 0.62% and 48.05 ± 0.61 mg GAE g−1, respectively. The phenolic compounds found in the extract were protocatechuic acid, caffeic acid derivatives, chlorogenic acid, and catechin. Furthermore, applying the proposed UAE conditions, the consistent composition of extract from underutilized young coconut mesocarp can be achieved.
Author Contributions
Conceptualization, L.L., U.S. and W.S.; methodology, L.L., U.S. and W.S.; software L.L.; validation, W.S., U.S. and M.P.; formal analysis, L.L. and W.S.; investigation, L.L.; resources, L.L. and U.S.; data curation, L.L. and S.S.; writing—original draft preparation, L.L. and W.S.; writing—review and editing, M.P., S.S. and U.S.; visualization, W.S. and M.P.; supervision, U.S., W.S., S.S. and M.P.; project administration, W.S.; funding acquisition, L.L. and W.S. All authors have read and agreed to the published version of the manuscript.
Funding
The APC was supported by Universitas Gadjah Mada through the Final Project Recognition Program (Rekognisi Tugas Akhir, RTA) 2022 with assignment number 3550/UN1.P.III/Dit-Lit/PT.01.05/2022.
Institutional Review Board Statement
Not applicable.
Informed Consent Statement
Not applicable.
Data Availability Statement
The data presented in this study is contained within the article.
Acknowledgments
L.L. is grateful to the Ministry of Education, Culture, Research, and Technology of the Republic of Indonesia for a Ph.D. studentship through the PMDSU program [2354/UN1/DITLIT/DIT-LIT/PT/2021 and 3550/UN1.P.III/Dit-Lit/PT.01.05/2022].
Conflicts of Interest
The authors declare no conflict of interest.
References
- DebMandal, M.; Mandal, S. Coconut (Cocos nucifera L.: Arecaceae): In Health Promotion and Disease Prevention. Asian Pac. J. Trop. Med. 2011, 4, 241–247. [Google Scholar] [CrossRef]
- FAOSTAT. Available online: https://www.fao.org/faostat/en/#data/QCL (accessed on 27 October 2022).
- Chakraborty, M.; Mitra, A. The Antioxidant and Antimicrobial Properties of the Methanolic Extract from Cocos nucifera Mesocarp. Food Chem. 2008, 107, 994–999. [Google Scholar] [CrossRef]
- Elsbaey, M.; Abdel, B.F.M. Coconut Waste as a Potential Source for Cytotoxic and Antioxidant Compounds. Int. J. Pharmacogn. Phytochem. Res. 2017, 9, 1288–1292. [Google Scholar] [CrossRef]
- Kibria, A.A.; Kamrunnessa, M.; Rahman, M. Extraction And Evaluation Of Phytochemicals From Green Coconut (Cocos nucifera) Shell. Malays. J. Halal Res. (MJHR) 2018, 1, 19–22. [Google Scholar] [CrossRef]
- Onyechi, O.; Elijah, P.; Nkechi, J. Phytochemical Analysis of Cocos nucifera L. J. Pharm. Res. 2010, 3, 280–286. [Google Scholar]
- Silva, R.R.; Oliveira, D.; Fontes, H.R.; Alviano, C.S.; Fernandes, P.D.; Alviano, D.S. Anti-inflammatory, antioxidant, and antimicrobial activities of Cocos nucifera var. typica. BMC Complement. Altern. Med. 2013, 13, 107. [Google Scholar] [CrossRef]
- Valadez-carmona, L.; Cortez-Garcia, R.M.; Plazola-Jacinto, C.P.; Ortiz-Moreno, A.; Necoechea-Mondrago, H. Effect of Microwave Drying and Oven Drying on the Water Activity, Color, Phenolic Compounds Content and Antioxidant Activity of Coconut Husk (Cocos nucifera L.). J. Food Sci. Technol. 2016, 53, 3495–3501. [Google Scholar] [CrossRef]
- Leliana, L.; Setyaningsih, W.; Palma, M.; Supriyadi, S.; Santoso, U. Antioxidant Activity of Aqueous and Ethanolic Extracts of Coconut (Cocos nucifera) Fruit By-Products. Agronomy 2022, 12, 1102. [Google Scholar] [CrossRef]
- Emojevwe, V. Hypoglycaemic Effects of Cocos nucifera (Coconut) Husk Extract on Alloxan Induced Female Diabetic Wistar Rats. Cont. J. Med. Res. 2012, 6, 5–10. [Google Scholar] [CrossRef]
- Bo, J.; Muyiwa, A. Effects of Alkaloids of Cocos nucifera Husk Fibre on Cardiovasular Disease Indices in Albino Mice. J. Card. Pharmacol. 2019, 8, 1000253. [Google Scholar] [CrossRef]
- Das, R.R.; Rahman, M.A.; Al-Araby, S.Q.; Islam, M.S.; Rashid, M.M.; Babteen, N.A.; Alnajeebi, A.M.; Alharbi, H.F.H.; Jeandet, P.; Rafi, M.K.J.; et al. The Antioxidative Role of Natural Compounds from a Green Coconut Mesocarp Undeniably Contributes to Control Diabetic Complications as Evidenced by the Associated Genes and Biochemical Indexes. Oxidative Med. Cell Longev. 2021, 2021, 9711176. [Google Scholar] [CrossRef]
- Javier Cortés-Rivera, H.; Javier Blancas-Benitez, F.; del Carmen Romero-Islas, L.; Gutiérrez-Martinez, P.; Ramón González-Estrada, R. In Vitro Evaluation of Residues of Coconut (Cocos nucifera L.) Aqueous Extracts, against the Fungus Penicillium Italicum. Emir. J. Food Agric. 2019, 31, 613–617. [Google Scholar] [CrossRef]
- Buamard, N.; Benjakul, S. Improvement of Gel Properties of Sardine (Sardinella albella) Surimi Using Coconut Husk Extracts. Food Hydrocoll. 2015, 51, 146–155. [Google Scholar] [CrossRef]
- Javier Cortés-Rivera, H.; Javier Blancas-Benitez, F.; del Carmen Romero-Islas, L.; Gutiérrez-Martinez, P.; Ramón González-Estrada, R. Effect of Ethanolic Coconut Husk Extract and Pre-Emulsification on Properties and Stability of Surimi Gel Fortified with Seabass Oil during Refrigerated Storage. LWT—Food Sci. Technol. 2019, 108, 160–167. [Google Scholar] [CrossRef]
- Azaroual, L.; Liazid, A.; el Mansouri, F.; Brigui, J.; Ruíz-Rodriguez, A.; Barbero, G.F.; Palma, M. Optimization of the Microwave-Assisted Extraction of Simple Phenolic Compounds from Grape Skins and Seeds. Agronomy 2021, 11, 1527. [Google Scholar] [CrossRef]
- Boulekbache-makhlouf, L.; Medouni, L.; Medouni-adrar, S.; Arkoub, L.; Madani, K. Effect of Solvents Extraction on Phenolic Content and Antioxidant Activity of the Byproduct of Eggplant. Ind. Crops Prod. 2013, 49, 668–674. [Google Scholar] [CrossRef]
- Derakhshan, Z.; Ferrante, M.; Tadi, M.; Ansari, F.; Heydari, A.; Sadat, M.; Oliveri, G.; Khalili, E. Antioxidant Activity and Total Phenolic Content of Ethanolic Extract of Pomegranate Peels, Juice and Seeds. Food Chem. Toxicol. 2018, 114, 108–111. [Google Scholar] [CrossRef]
- Tabaraki, R.; Heidarizadi, E.; Benvidi, A. Optimization of Ultrasonic-Assisted Extraction of Pomegranate (Punica granatum L.) Peel Antioxidants by Response Surface Methodology. Sep. Purif. Technol. 2012, 98, 16–23. [Google Scholar] [CrossRef]
- José Aliaño González, M.; Carrera, C.; Barbero, G.F.; Palma, M. A Comparison Study between Ultrasound–Assisted and Enzyme–Assisted Extraction of Anthocyanins from Blackcurrant (Ribes nigrum L.). Food Chem. X 2022, 13, 100192. [Google Scholar] [CrossRef] [PubMed]
- Espada-bellido, E.; Ferreiro-gonzález, M.; Carrera, C.; Palma, M.; Barroso, C.G.; Barbero, G.F. Optimization of the Ultrasound-Assisted Extraction of Anthocyanins and Total Phenolic Compounds in Mulberry (Morus nigra) Pulp. Food Chem. 2017, 219, 23–32. [Google Scholar] [CrossRef]
- Singla, R.K.; Jaiswal, N.; Bhat, V.; Jagani, H. Antioxidant & Antimicrobial Activities of Cocos nucifera Linn. (Arecaceae) Endocarp Extracts. Indo Glob. J. Pharm. Sci. 2011, 4, 354–361. [Google Scholar]
- Thebo, N.K.; Simair, A.A.; Mangrio, G.S.; Ansari, K.A.; Bhutto, A.A.; Lu, C.; Sheikh, W.A. Antifungal Potential and Antioxidant Efficacy in the Shell Extract of Cocos nucifera (L.) (Arecaceae) against Phatogenic Dermal Mycosis. Medicines 2016, 3, 12. [Google Scholar] [CrossRef] [PubMed]
- Esquenazi, D.; Wigg, M.D.; Miranda, M.M.F.S.; Rodrigues, H.M.; Tostes, J.B.F.; Rozental, S.; Antonio, J.R.; Alviano, C.S. Antimicrobial and Antiviral Activities of Polyphenolics from Cocos nucifera Linn. (Palmae) Husk Fiber Extract. Res. Microbiol. 2002, 153, 647–652. [Google Scholar] [CrossRef]
- Heenataj, B.; Kushmitha, V.; Babu, N.G.R.; Seethalakshmi, I. Antioxidants and Cytotoxicity Analysis of Coconut Husk Extract. Int. J. Eng. Res. Manag. (IJERM) 2017, 4, 5–9. [Google Scholar]
- Chemat, F.; Rombaut, N.; Sicaire, A.; Meullemiestre, A.; Abert-vian, M. Ultrasound Assisted Extraction of Food and Natural Products. Mechanisms, Techniques, Combinations, Protocols and Applications. A Review. Ultrason. Sonochem. 2017, 34, 540–560. [Google Scholar] [CrossRef]
- Susanti, E.P.; Rohman, A.; Setyaningsih, W. Dual Response Optimization of Ultrasound-Assisted Oil Extraction from Red Fruit (Pandanus conoideus): Recovery and Total Phenolic Compounds. Agronomy 2022, 12, 523. [Google Scholar] [CrossRef]
- Aliaño-González, M.J.; Barea-Sepúlveda, M.; Espada-Bellido, E.; Ferreiro-González, M.; López-Castillo, J.G.; Palma, M.; Barbero, G.F.; Carrera, C. Ultrasound-Assisted Extraction of Total Phenolic Compounds and Antioxidant Activity in Mushrooms. Agronomy 2022, 12, 1812. [Google Scholar] [CrossRef]
- Khan, M.K.; Abert-vian, M.; Dangles, O.; Chemat, F. Ultrasound-Assisted Extraction of Polyphenols (Flavanone glycosides) from Orange (Citrus sinensis L.) Peel. Food Chem. 2010, 119, 851–858. [Google Scholar] [CrossRef]
- Jelena, Ž.; Katarina, Š.; Jankovi, T.; Nada, Ć. Separation and Puri Fi Cation Technology Optimization of Ultrasound-Assisted Extraction of Polyphenolic Compounds from Pomegranate Peel Using Response Surface Methodology. Sep. Purif. Technol. 2018, 194, 40–47. [Google Scholar] [CrossRef]
- Dranca, F.; Oroian, M. Optimization of Ultrasound-Assisted Extraction of Total Monomeric Anthocyanin (TMA) and Total Phenolic Content (TPC) from Eggplant (Solanum melongena L.) Peel. Ultrason. Sonochem. 2016, 31, 637–646. [Google Scholar] [CrossRef]
- Ismail, B.B.; Guo, M.; Pu, Y.; Wang, W.; Ye, X. Valorisation of Baobab (Adansonia digitata) Seeds by Ultrasound Assisted Extraction of Polyphenolics. Optimisation and Comparison with Conventional Methods. Ultrason. Sonochem. 2019, 52, 257–267. [Google Scholar] [CrossRef]
- Luo, X.; Cui, J.; Zhang, H.; Duan, Y.; Zhang, D.; Cai, M.; Chen, G. Ultrasound Assisted Extraction of Polyphenolic Compounds from Red Sorghum (Sorghum bicolor L.) Bran and Their Biological Activities and Polyphenolic Compositions. Ind. Crops Prod. 2018, 112, 296–304. [Google Scholar] [CrossRef]
- Al-Dhabi, N.A.; Ponmurugan, K.; Maran Jeganathan, P. Development and Validation of Ultrasound-Assisted Solid-Liquid Extraction of Phenolic Compounds from Waste Spent Coffee Grounds. Ultrason. Sonochem. 2017, 34, 206–213. [Google Scholar] [CrossRef]
- Singleton, V.L.; Orthofer, R.; Lamuela-Raventós, R.M. Analysis of Total Phenols and Other Oxidation Substrates and Antioxidants by Means of Folin-Ciocalteu Reagent. Methods Enzymol. 1999, 299, 152–178. [Google Scholar]
- Brand-Williams, W.; Cuvelier, M.E.; Berset, C. Use of a Free Radical Method to Evaluate Antioxidant Activity. Lebensm.-Wiss. Technol. 1995, 28, 25–30. [Google Scholar] [CrossRef]
- Hassan, R.M.; Hassan, N.A.; Fhadhila, A.; Yusoff, A.M. Ultrasound-Assisted Extraction of Natural Colourant from Husk of Cocos nucifera: A Comparison with Agitated-Bed Extraction. Pertanika J. Sci. Technol. 2018, 26, 1039–1052. [Google Scholar]
- Dzah, C.S.; Duan, Y.; Zhang, H.; Wen, C.; Zhang, J.; Chen, G.; Ma, H. The Effects of Ultrasound Assisted Extraction on Yield, Antioxidant, Anticancer and Antimicrobial Activity of Polyphenol Extracts: A Review. Food Biosci. 2020, 35, 100547. [Google Scholar] [CrossRef]
- Kumar, K.; Srivastav, S.; Sharanagat, V.S. Ultrasound Assisted Extraction (UAE) of Bioactive Compounds from Fruit and Vegetable Processing by-Products: A Review. Ultrason. Sonochem. 2021, 70, 105325. [Google Scholar] [CrossRef]
- Goldsmith, C.D.; Vuong, Q.V.; Stathopoulos, C.E.; Roach, P.D.; Scarlett, C.J. Ultrasound Increases the Aqueous Extraction of Phenolic Compounds with High Antioxidant Activity from Olive Pomace. LWT—Food Sci. Technol. 2018, 89, 284–290. [Google Scholar] [CrossRef]
- Wang, L.; Pan, X.; Jiang, L.; Chu, Y.; Gao, S.; Jiang, X.; Zhang, Y.; Chen, Y.; Luo, S.; Peng, C. The Biological Activity Mechanism of Chlorogenic Acid and Its Applications in Food Industry: A Review. Front. Nutr. 2022, 9, 943911. [Google Scholar] [CrossRef]
- Sánchez-Alonso, I.; Careche, M.; Moreno, P.; González, M.J.; Medina, I. Testing Caffeic Acid as a Natural Antioxidant in Functional Fish-Fibre Restructured Products. LWT—Food Sci. Technol. 2011, 44, 1149–1155. [Google Scholar] [CrossRef]
- Namal Senanayake, S.P.J. Green Tea Extract: Chemistry, Antioxidant Properties and Food Applications—A Review. J. Funct. Foods 2013, 5, 1529–1541. [Google Scholar] [CrossRef]
- Kakkar, S.; Bais, S. A Review on Protocatechuic Acid and Its Pharmacological Potential. ISRN Pharmacol. 2014, 2014, 952943. [Google Scholar] [CrossRef]
- Setyaningsih, W.; Saputro, I.E.; Palma, M.; Barroso, C.G. Stability of 40 Phenolic Compounds during Ultrasound-Assisted Extractions (UAE). AIP Conf. Proc. 2016, 1755, 080009. [Google Scholar]


Publisher’s Note: MDPI stays neutral with regard to jurisdictional claims in published maps and institutional affiliations. |
© 2022 by the authors. Licensee MDPI, Basel, Switzerland. This article is an open access article distributed under the terms and conditions of the Creative Commons Attribution (CC BY) license (https://creativecommons.org/licenses/by/4.0/).