Article

Evaluating Growth, Biomass and Cannabinoid Profiles of Floral Hemp Varieties under Different Planting Dates in Organic Soils of Florida

1
Tropical Research and Education Center, University of Florida, Homestead, FL 33031, USA
2
College of Agriculture, Community and the Science, Kentucky State University, Frankfort, KY 40601, USA
3
United States Sugar Corporation, Clewiston, FL 33440, USA
4
Everglades Research and Education Center, University of Florida, Belle Glade, FL 33430, USA
*
Author to whom correspondence should be addressed.
Agronomy 2022, 12(11), 2845; https://doi.org/10.3390/agronomy12112845
Submission received: 13 October 2022 / Revised: 3 November 2022 / Accepted: 9 November 2022 / Published: 14 November 2022
(This article belongs to the Special Issue Sustainable Management of Herbaceous Field Crops)

Abstract

:
Hemp production has been permitted as a new agricultural commodity in Florida and may serve as a potential rotational crop. Field trials were conducted in the Everglades Agricultural Region with multiple varieties planted at different dates. Data were collected on plant growth parameters, final biomass at harvest, and temporal cannabidiol (CBD) and Δ-9-tetrahydrocannabinol (THC) content in developing flowers. Results showed that at the United States Sugar Corporation (USSC) location, the BaOX variety had higher biomass compared to other varieties and at Everglades Research and Education Center (EREC), varieties ACDC and Cherry wine recorded the highest biomass compared to other varieties. Moreover, plant growth parameters such as plant height, canopy cover and SPAD were significantly affected by variety and planting date. Total CBD and THC content in plants increased over time for most varieties except for Early bird and Cherry abacus under second planting. There was a significantly high correlation between total CBD and THC content (R2 = 0.75 to 0.98, slope = 16.8 to 22.8). The THC content in most varieties exceeded the legal limit of 0.3% at some stage of the growing season. The results of this study indicate that the variety performance was largely affected by genetics compared to the planting date.

1. Introduction

Industrial hemp (Cannabis sativa L.) is a multipurpose plant that can be produced as fiber, seed, or flower. Since the 1950s, there has been no hemp production in the United States. The U.S. Federal Bureau of Narcotics supported legislation restricting the production of cannabis varieties, including hemp, because of concerns about recreational use. Low pricing and cultivation challenges for traditional crops have piqued interest in commercial hemp farming [1]. While hemp has major legal barriers because of its close resemblance to marijuana, several states, including Florida, are seeking to revitalize the hemp industry. Marijuana and industrial hemp are two different types of Cannabis sativa L. species based on cannabinoid content [2]. Even though they are botanically the same species and appear to be almost identical in appearance, they differ in the amount of psychoactive component Δ-9-tetrahydrocannabinol (THC). Marijuana usually contains 3–15% THC by dry weight, but according to the 2018 Farm Bill, THC levels of 0.3% or below is required for hemp to be grown legally [3].
Hemp varieties developed for cannabidiol (CBD) rich flowers are distinct from those grown for seed or fiber. Mature female plants are ideal for CBD production because they produce larger levels of cannabinoids than male plants. Therefore, the best CBD yield is obtained in unpollinated female flowers, where pollen from the male plants can be excluded from the field [4]. Thus, cuttings (clones) of female plants are the most effective method of propagation for producing homogenous productivity. Because CBD is contained primarily in female flowers, plants are grown in nurseries using propagated female clones and transplanted in the field two to three weeks later [5].
There are many environmental and ecological characteristics of hemp production that need to be considered and evaluated before successfully adopting hemp cultivation in South Florida. Hemp cultivation relies heavily on temperature at vegetative and flowering stages of plant development. Studies have shown that hemp is most suitable to temperate climates, yet it can be grown in a wide range of environments [6]. Hemp requires adequate moisture during the growing season, but especially during the first four to five weeks of growth when the new plants are establishing themselves [7]. Crop water demand and uptake differ due to different hemp varieties, soil, climate conditions, and management practices. Hemp is a photosensitive crop, and flowering occurs when nights become longer (at least 10–11 h) or days get shorter [8]. Therefore, the ideal planting time is critical in profitable hemp production, which needs to be researched for South Florida conditions.
The CBD content in the flowers, along with their biomass, determines the hemp crop’s profit in the market. Thus, harvesting flowers when the CBD content is at or near their highest content would be necessary to maximize return. The THC content is another important aspect to consider. Currently, the final rule by the USDA for growing industrial hemp growing requires the hemp plants to be evaluated within 30 days of harvest [9]. If the THC content in the plants exceed the 0.3% level, all of the plants must be retested, remediated, or disposed of in accordance with the United States Department of Agriculture (USDA) rule. Information on the formation of cannabinoids in industrial hemp plants will be useful in establishing when THC regulatory testing will take place, but also when to harvest to maximize profits [10].
Hemp cultivation has been suggested as a new agricultural opportunity in Florida, potentially filling the void created by the state’s decreasing citrus industry and serving as a potential rotational crop in the sugarcane production system in Florida’s organic soils. However, there are no hemp varieties that are developed for Florida conditions, and growers rely on varieties developed in other states or even outside the United States. Studies related to the field performance and potential yield of new industrial hemp varieties for CBD production in South Florida are scarce. It is unknown at this time which varieties would be most suitable for climatic conditions in South Florida. Moreover, there is not much information available about the best planting time for CBD hemp production in South Florida. Therefore, field experiments are required to answer a broad range of questions related to the hemp variety adaptation and response, cannabinoids synthesis and other agronomic practices to optimize the yields of CBD hemp production. We hypothesized that the growth and biomass of hemp varieties will vary with different planting dates due to their photoperiod sensitivity. Moreover, the genetics will have more control on the CBD and THC content than the environmental conditions. Therefore, the objectives of this study were to (i) evaluate the growth, potential yield, and cannabinoid content of different hemp varieties cultivated at two different locations in a sub-tropical environment of South Florida, (ii) study the effect of different planting dates on biomass production and cannabinoids biosynthesis, and (iii) evaluate the temporal THC and CBD accumulation pattern as affected by different varieties under different planting dates in the organic soils of South Florida.

2. Materials and Methods

2.1. Experimental Sites

The present study was conducted in 2020 at two different locations in South Florida. The first field trial on variety and planting date evaluation was conducted at the United States Sugar Corporation (USSC) farm in Palm Beach County near Clewiston, FL, located at 26°43′0.66″ N and 80°50′58.24″ W. The second trial on variety evaluation only was conducted at the Everglades Research and Education Center (EREC) of the University of Florida in Belle Glade, FL located at 26°40′2.60″ N and 80°37′53.06″ W. The soil at the USSC location was classified as Terra Ceia series, Histosol (Euic, hyperthermic Typic Haplosaprists), around 200 cm deep, whereas at the EREC location, it was Pahokee soil series, Histosol (Euic, hyperthermic Lithic Haplosaprists) of approximately 100 cm deep. Both locations had more than 70% soil organic matter, and a slope of 0–1%. Some chemical properties of the soil at both locations are shown in Supplementary Table S1. Both experimental locations have a humid subtropical climate with hot and wet conditions during the summer (growing season of hemp). The average air temperature and cumulative precipitation of the growing season (April to October) were 26.2 °C and 73.5 cm, and 26.4 °C and 105.8 cm at the USSC and EREC locations, respectively. The weather data during the study period at both locations including precipitation and average air temperatures are presented in Supplementary Figures S1 and S2.

2.2. Field Preparations and Management

At both experimental locations, hemp varieties were transplanted on raised beds (around 75 cm width and 20 cm height) covered with white plastic film to control weeds during the growing season. Bed to bed distance (center to center) was maintained at 1.8 m. Two drip tapes were laid under the plastic for irrigation. At the USSC location, half of the beds were fumigated (to kill pathogenic fungi, bacteria, nematodes, insects etc.) with chloropicrin (Tri-Pic-100 TriEast Ag Group, Inc. Greenville, NC, USA) at 134 Kg ha−1, while no fumigation treatment was used at the EREC location. Uniform sized (~12–15 cm height) seedlings of each variety were transplanted manually into the beds at 1.2 m intra row spacing. All varieties used were dioecious female clones and were propagated from the female plants. All of the cuttings (clones) for each variety came from one single mother plant. Each plot had 20 plants at the USSC location and 15 plants at the EREC location. The 20 and 15 plants at the USSC and EREC locations, respectively, were for sub-sub plots. At the USSC location, phosphorous (P) and potassium (K) fertilizers were applied through drip irrigation at a weekly interval at 0.84 Kg ha−1 per day until 1 month after transplanting and 3.36 Kg ha−1 per day afterwards. At the EREC location, granular P and K were applied at the time of transplanting at 84 P2O5 Kg ha−1 and 84 K2O Kg ha−1 rate, respectively. The soil at both experimental locations had high organic matter (>70%), so no nitrogen fertilizer was applied to the soil. At both locations, weeds between the beds were hand weeded during the growing season.

2.3. Experimental Design and Treatments

At USSC, the experimental design was a split-split-plot randomized complete block design with three replications. Planting date was considered as the main plot, fumigation as the sub-plot, and varieties as the sub-sub plot. There were three planting dates at the USSC location (Table 1). The first planting was done during the last week of April or the second week of May. Similarly, the second and third planting was done during the last week of May and June, respectively. Due to weather conditions and COVID-19 restrictions, there is some inconsistency in planting time, but the intervals were kept close to 4–5 weeks. Four varieties (BaOX, Wife, T1, Stout) obtained from a supplier in Kentucky, and four varieties (Abacus, Cherry abacus, Early bird, and Otto stout) from Colorado were planted at the USSC location. Early bird and Abacus are early flowering varieties that originated in Colorado, and their expected CBD content is between 7 and 10%. At the EREC location, a variety trial was conducted in a randomized complete block design with four replications. Seven varieties were used at this location, including ACDC, BaOX, Cherry wine, S × S (Spectrum × Spectrum), W × S (Wife × Spectrum), Super CBD, and Wife (Table 1). The number of plants per plot were 20 at the USSC site and 15 at the EREC site.

2.4. Data Collection

Before planting, soil samples were collected from the top 15 cm of the soil and analyzed for pH, macro, and micronutrients (Supplementary Table S1). Furthermore, plant growth data including plant height, SPAD values and green canopy cover were measured every 2 to 3 weeks during crop growth from five randomly selected plants in each plot at both locations. Plant height was measured from the base of the plant to the tip of the main stem. The percentage of green canopy cover was obtained using a mobile phone application called Canopeo®. The application was developed using Matlab (Mathworks, Inc., Natick, MA, USA), which analyzes and differentiates pixels in the images based on red to green (R/G) and blue to green (B/G) color ratios and an excess green index (2G–R–B) [11]. The app was installed on the phone (iPhone 8 plus) and pictures of each plant were taken from about 1.5 m vertical distance right above the canopy. The picture taking method and environmental conditions across the observation dates were made consistent by using chest height of the same person as reference by placing the phone perpendicular to the center of upper canopy and by taking images between 9:00 a.m. to 11:00 a.m. on sunny days. SPAD values were measured using SPAD-502 Chlorophyll Meter (Minolta Co. Ltd., Osaka, Japan). SPAD values were measured on the fully expanded new leaf of the plant between 9:00 a.m. to 11:00 a.m. on sunny days. The date of flowering (flower initiation in >50% plants in each plot) was recorded at both locations when around ten and eight plants showed flower initiation at USSC and EREC sites, respectively. Flower initiation was considered when a pair of white stigmas started to come out from the green calyx in at least 50% of plants in a plot. Flower initiation was considered when a pair of white stigmas started to come out from the green calyx in the plant. At the USSC location, beginning from 2 weeks after flowering, the destructive sampling of flowers was conducted at weekly intervals to measure temporal CBD and THC contents. The top 25 cm portion of two randomly selected plants per plot were clipped, dried at 50°C for a day and then analyzed for CBD, cannabidioalic acid (CBDA), THC and tetrahydrocannabinolic acid (THCA) using an industry standard methanol extract/HPLC assay [10] calibrated against 16 cannabinoids and analyzed using an ultraperformance liquid chromatograph equipped with a mass spectrometer (UPLC-MS/MS, Waters Corp, Milford, MA, USA). Total CBD and Total THC were calculated as the sum of CBD plus 0.877 × CBDA, and sum of THC plus 0.877 × THCA, respectively. Moreover, at both locations, plants were harvested based on the flowering time of each variety from each plot, and dried at 50 °C for 3 days to estimate dry biomass yield. the At EREC site, plants were harvested at eight weeks after flowering and 6 weeks after flowering at the USSC site. The plants were considered flowered when almost 50% of flowers were open. Total CBD and THC from the top 25 cm portion of the plants at the time of harvest were also analyzed following the previously described procedure.

2.5. Statistical Analysis

All data were analyzed by location using the R statistical software (Version 4.1.3, R Foundation for Statistical Computing, Vienna, Austria). For data from the USSC location, a mixed effects models analysis of variance (ANOVA) (lme package; [12]) was used to investigate the effect of planting date, varieties, and fumigation treatments on variables including plant growth, final biomass, THC and CBD contents. The planting date, varieties and fumigation treatments were considered as fixed effects, while the replication was considered to be a random effect. Diagnostic reports (residual plots and quantile plots) were used to ensure that the data met assumptions of the model (linearity, homoscedasticity, normality). For all analyses, the effects were declared significant at p ≤ 0.05. The post-hoc Tukey’s HSD (agricolae package; [13]) test was performed for all pairwise comparisons at α = 0.05. Because the effect of fumigation was not significant, data for all three planting dates and varieties were combined across both fumigation treatments for analysis. Moreover, the relationship between CBD and THC contents was analyzed using a linear regression. At the EREC location, a one-way ANOVA followed by post-hoc TUKEY’s HSD test (α = 0.05) test was used to investigate the effect of varieties on different parameters. The ggplot2 package in R was used to make all of the graphs and figures.

3. Results

3.1. Final Biomass Yield and Crop Growth Parameters

Plant growth data including plant height, canopy cover, SPAD values and final biomass are shown in Figure 1, Figure 2 and Figure 3 (USSC location) and Figure 4, Figure 5 and Figure 6 (EREC location). At the USSC location, plant height, canopy cover and SPAD were significantly affected by variety and planting date (Table 2). Moreover, there was a significant interaction between variety and planting date for plant height, canopy cover and SPAD values. Overall, varieties from Kentucky source (Wife, BaOX, and Stout) except for T1 had higher plant height compared to the varieties from Colorado source (Abacus, Cherry abacus, Early bird, and Otto stout) under all three planting dates (except Otto stout under third planting) (Figure 1A). Moreover, plant height was higher in general under first and second planting for most varieties compared to third planting. Furthermore, in general, the Cherry abacus and T1 varieties had higher SPAD values compared to other varieties, and planting date had a minimal effect on SPAD values (Figure 1B). The percentage canopy cover of different varieties under different planting dates at 53 days after planting are shown in Figure 2. Overall, the canopy cover data had a similar trend as plant height where varieties Wife, BaOX, and Stout had significantly higher canopy cover compared to other varieties under all three planting dates except Otto stout in the third planting (Figure 2). Moreover, canopy cover of varieties under first and second planting was mostly higher compared to the third planting. The final dry plant biomass at harvest was significantly affected by different varieties and planting dates (Figure 3). Moreover, there was a significant interaction between variety and planting date for the final biomass. Under the first planting, the biomass was significantly higher in variety BaOX (1102 Kg ha−1) followed by Cherry abacus (785 Kg ha−1), T1 (554 Kg ha−1), and Abacus (254 Kg ha−1) and Early bird (102 Kg ha−1). Under the second planting, the biomass was again significantly higher in variety BaOX (1842 Kg ha−1) followed by Stout (872 Kg ha−1), Cherry abacus (554 Kg ha−1), and Abacus (277 Kg ha−1) and Early bird (175 Kg ha−1). There were no significant differences between variety Abacus and Early bird under the third planting. Moreover, variety BaOX had significantly higher plant biomass at harvest under second planting compared to first planting. On the other hand, variety Cherry abacus had significantly higher plant biomass under the first planting compared to the second planting, whereas varieties Abacus and Early bird were not significantly different under all three planting dates.
At the EREC location, plant height, SPAD values, percentage canopy cover and final dry plant biomass were significantly different among the varieties (Table 3). Overall, varieties ACDC, S × S, W × S had higher plant height (cm) compared to other varieties (Figure 4A). For SPAD values, there was no specific pattern among the tested varieties (Figure 4B). In general, SPAD values of all of the varieties decreased as the plants grew towards maturity. Furthermore, the percentage canopy cover (%) at 34 days after planting was significantly higher for the Cherry wine, BaOX and S × S varieties compared to the Super CBD, Wife and W × S varieties (Figure 5). The plant biomass at harvest was significantly different between the varieties. It was significantly higher for the Cherry wine (1601 Kg ha−1) and ACDC (1467 Kg ha−1) varieties, followed by the BaOX (1222 Kg ha−1), S × S (1201 Kg ha−1), the Super CBD (947 Kg ha−1), the W × S (870 Kg ha−1), and the Wife (867 Kg ha−1) varieties (Figure 6).

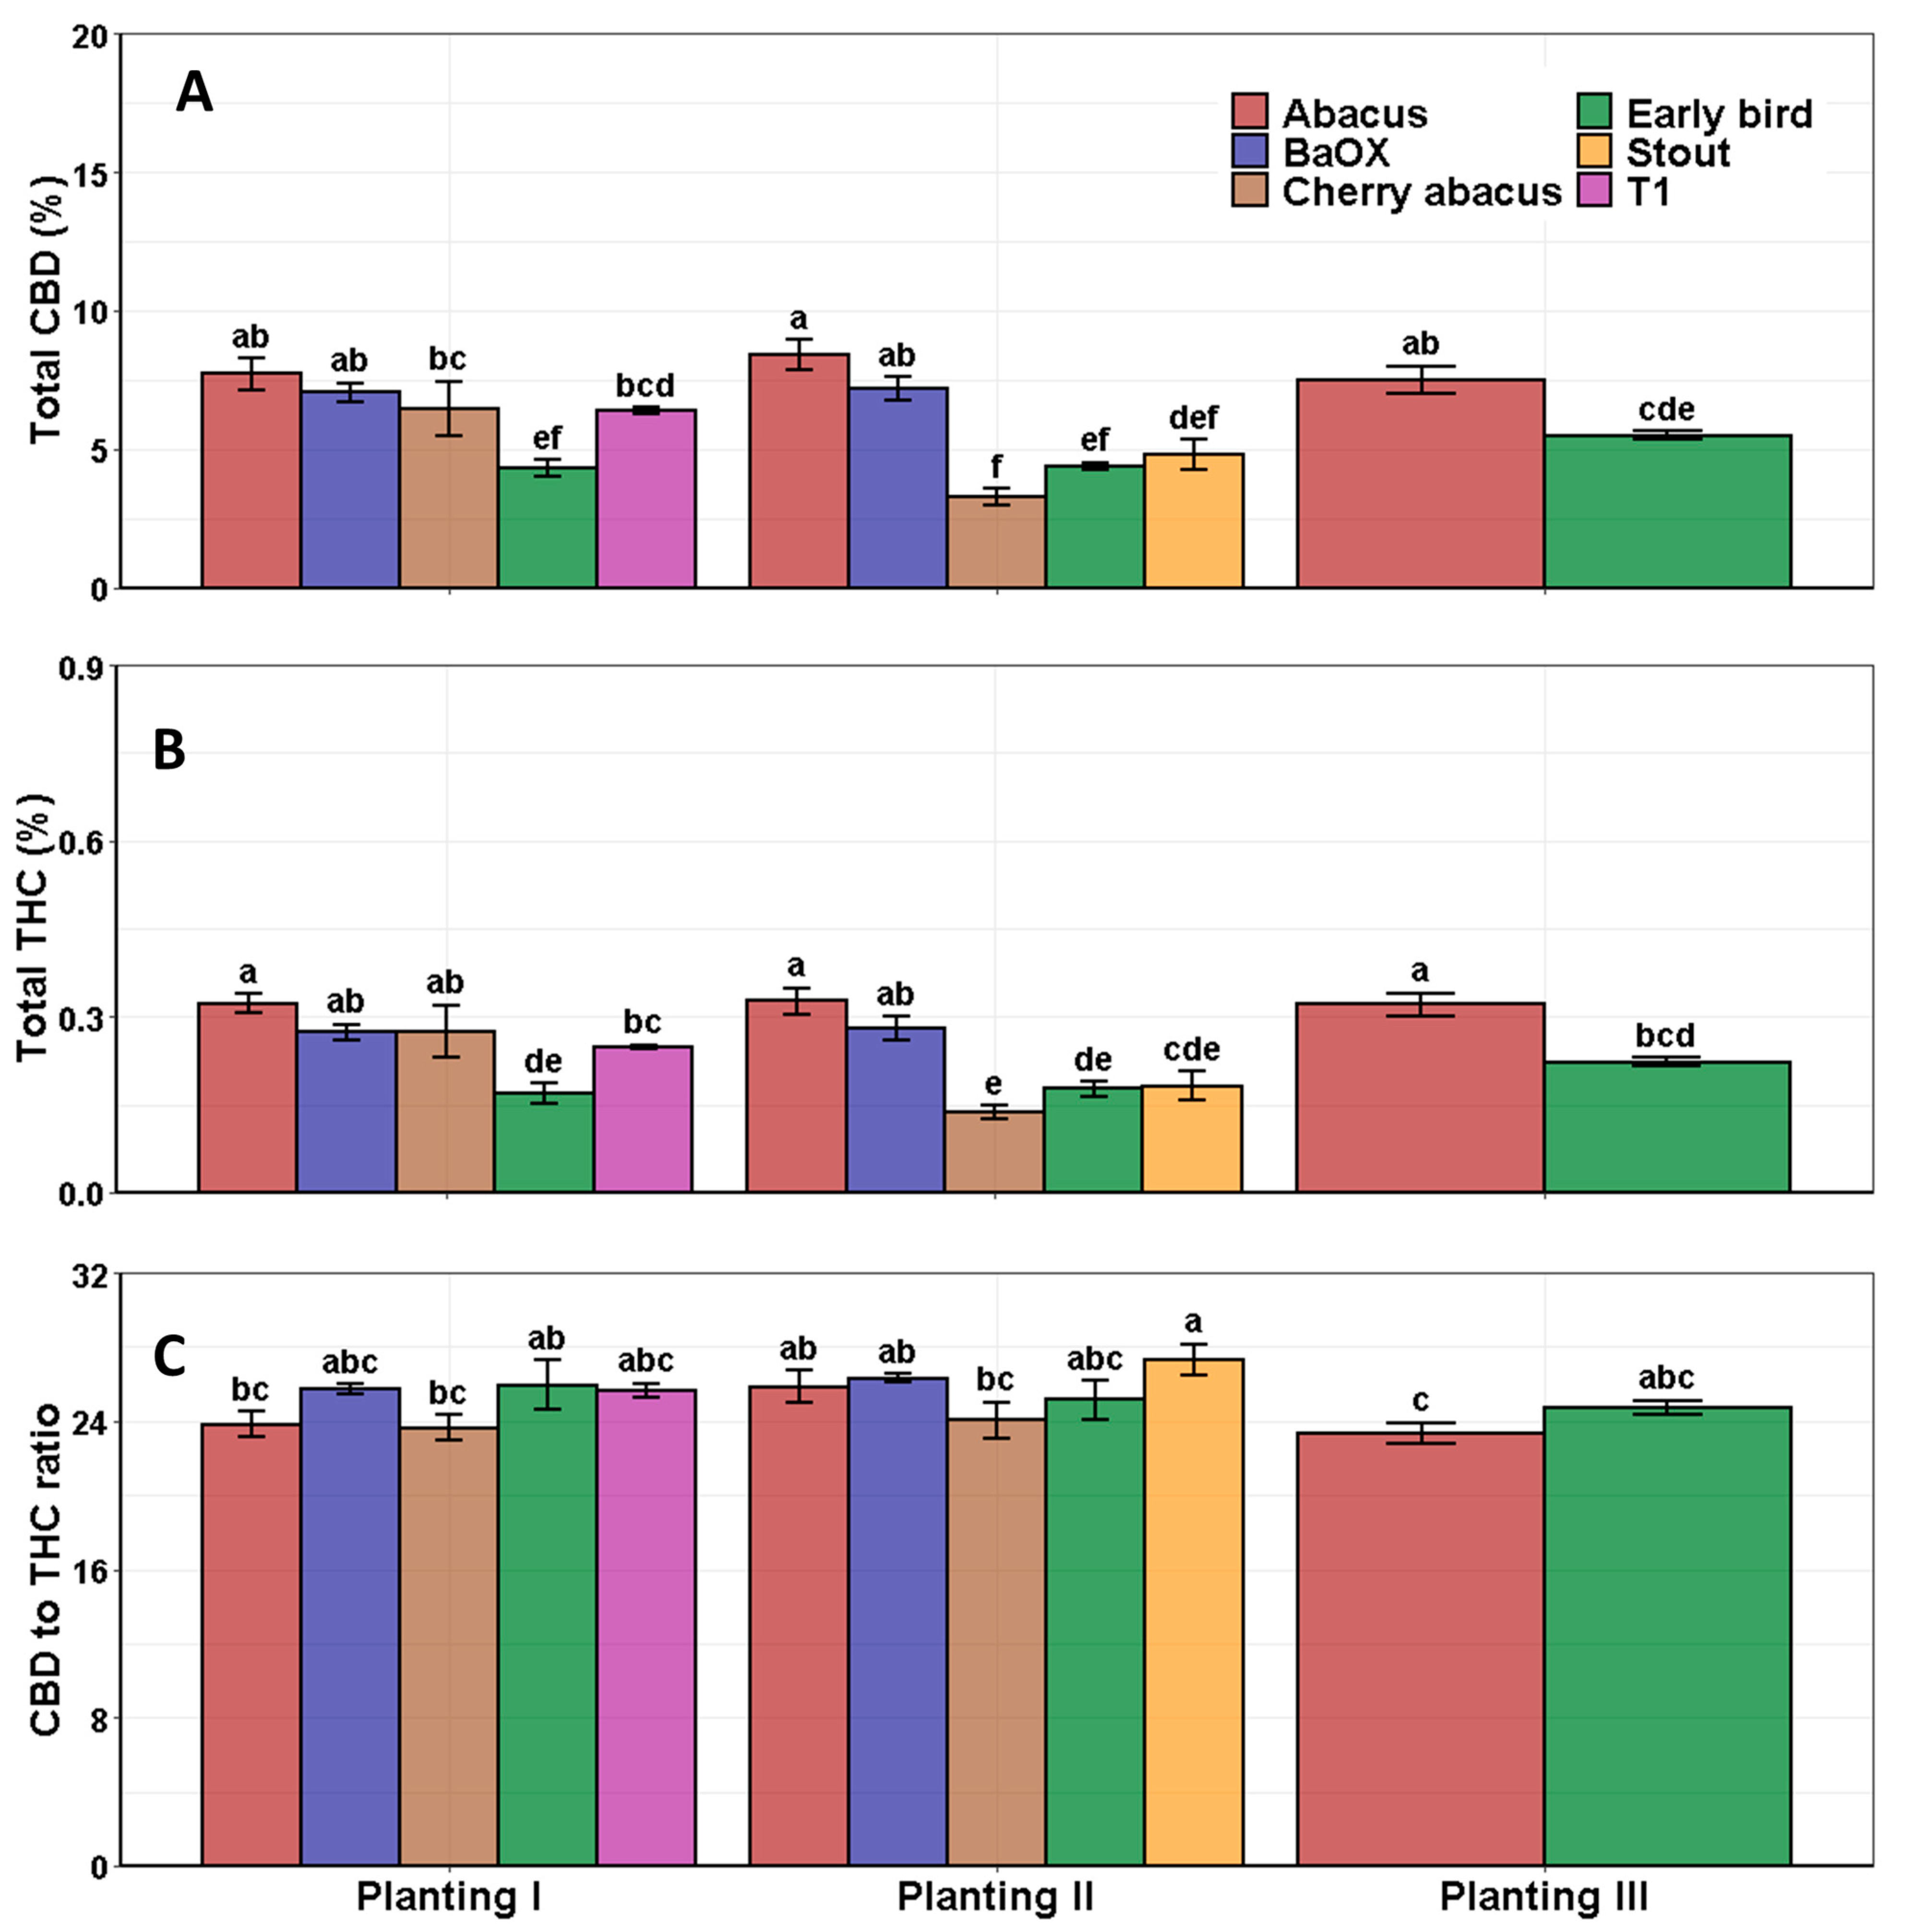
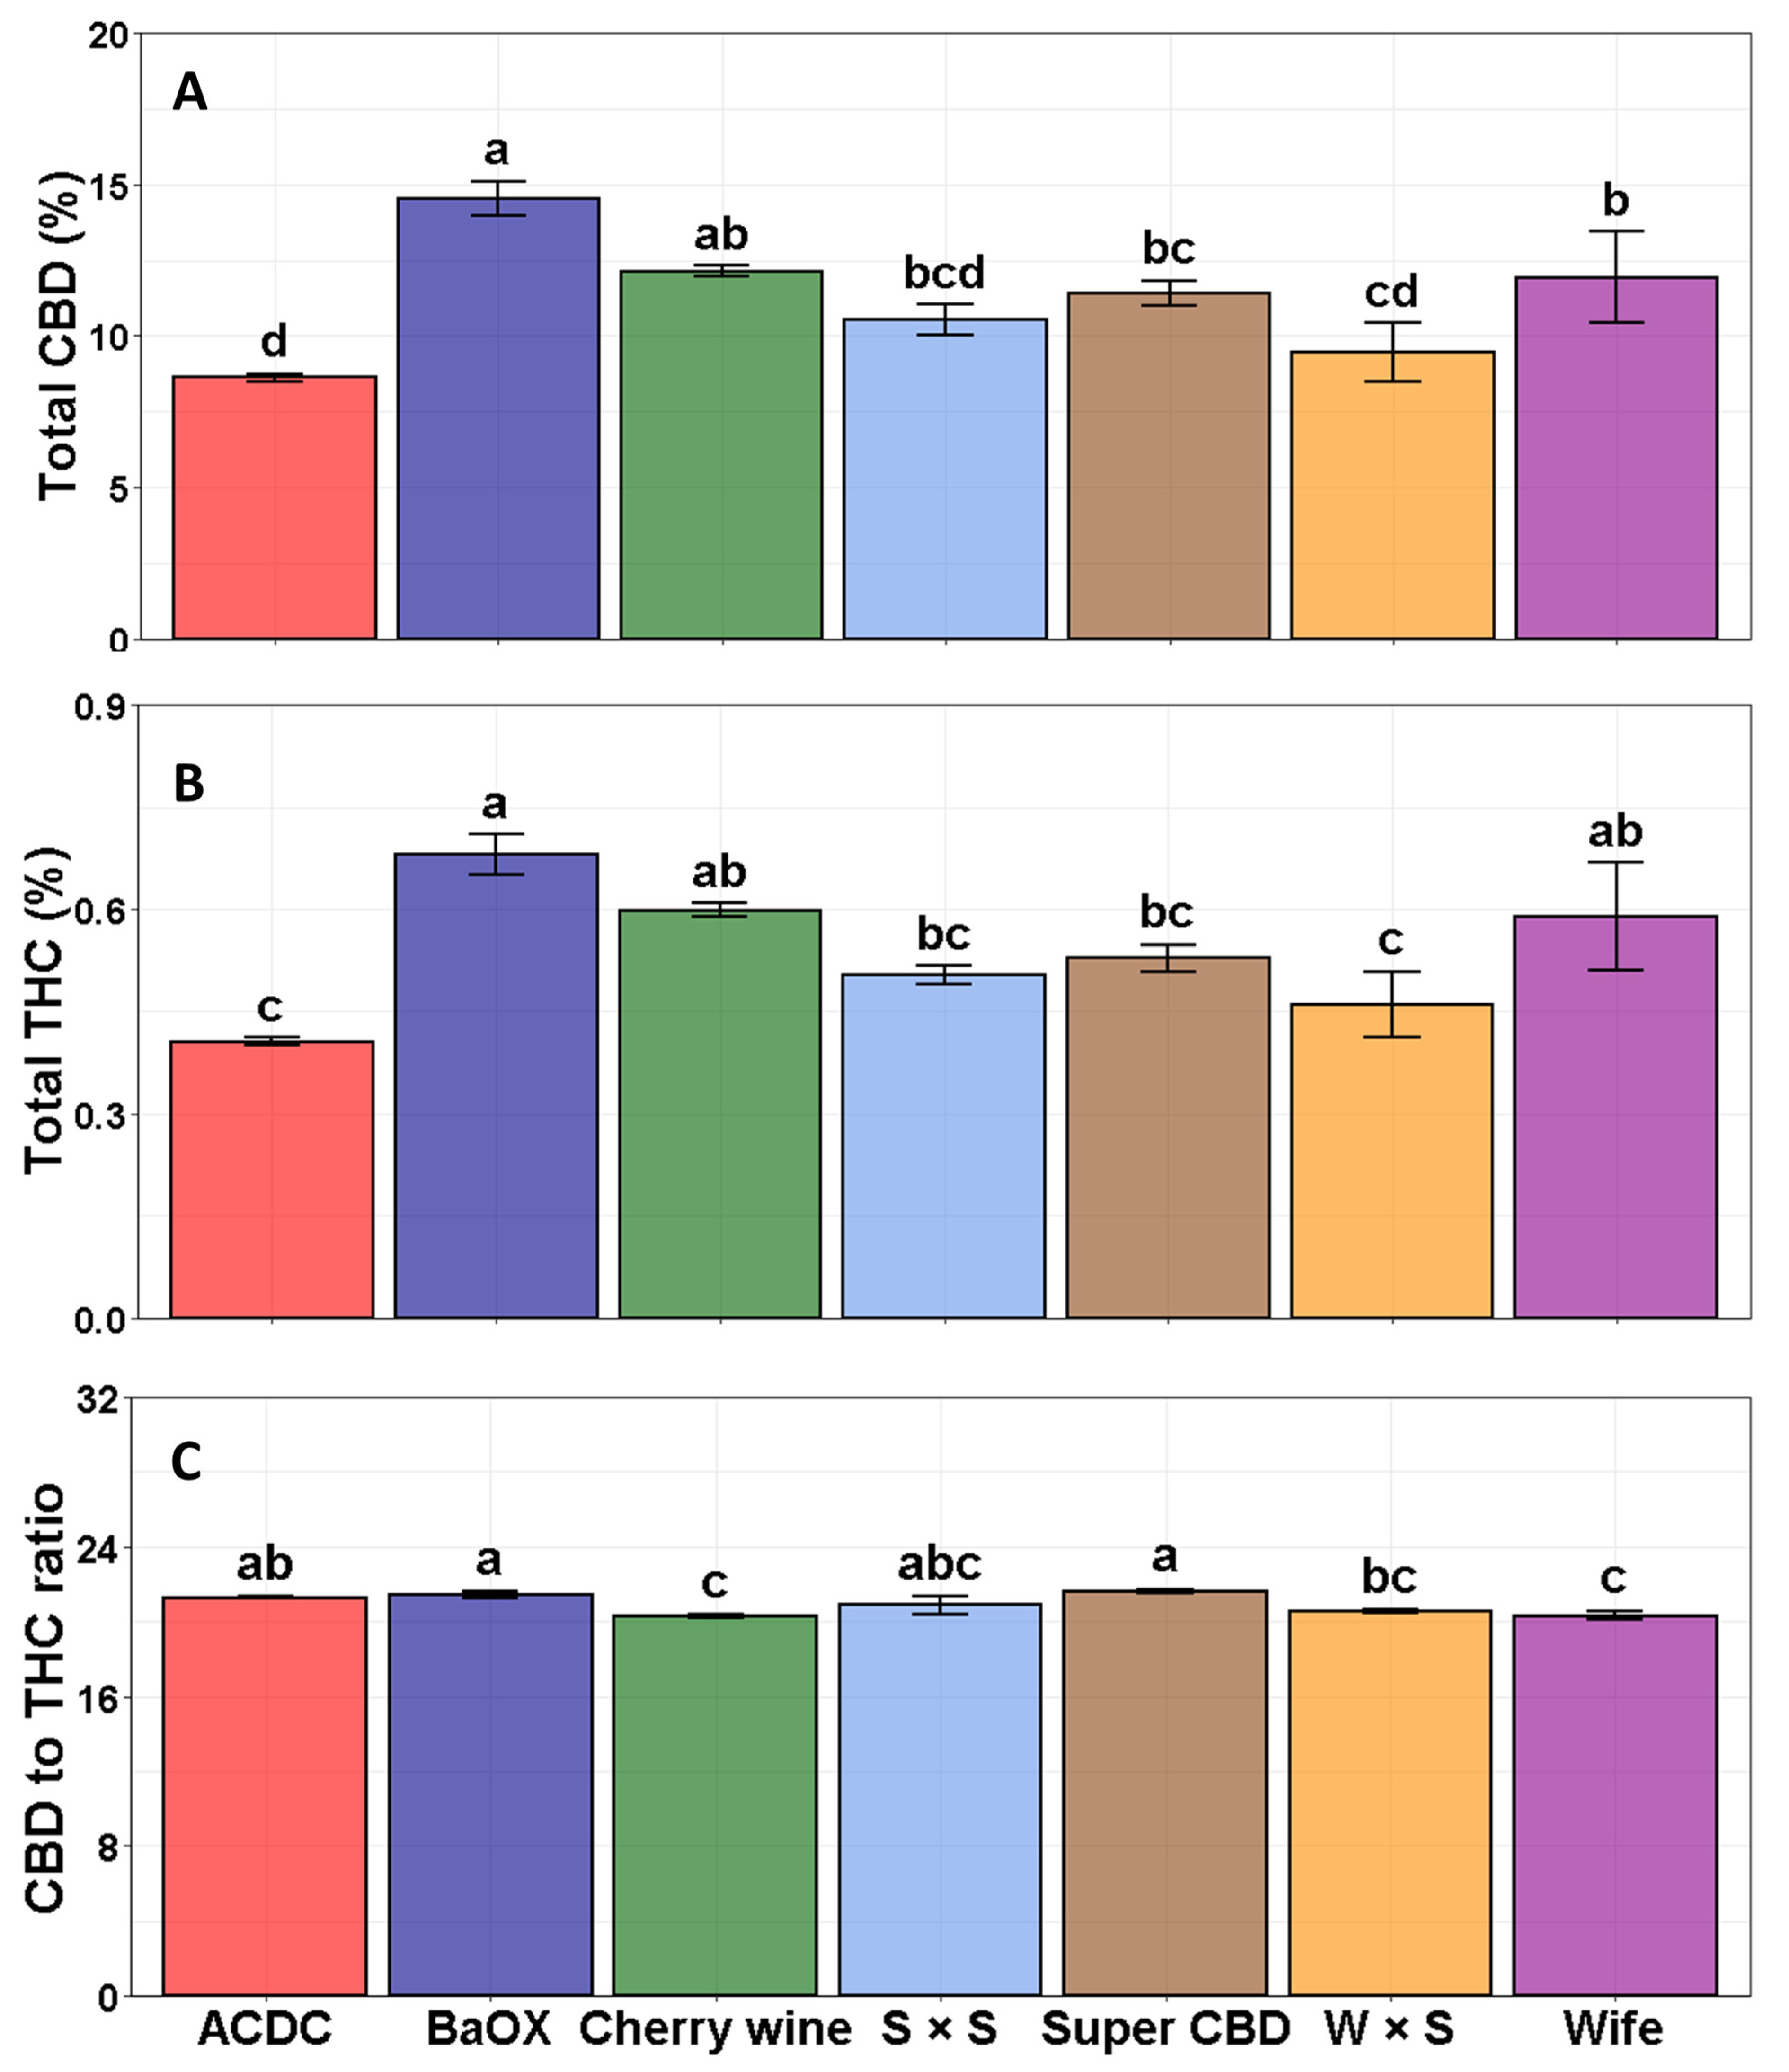
3.2. CBD and THC Content and Their Ratio at Harvest

The total CBD and THC contents and their ratios at harvest have been shown in Figure 7 (USSC location) and Figure 8 (EREC location). At the USSC location, the CBD and THC content and their ratios (CBD:THC) at harvest were significantly different in the tested varieties (Table 2). However, the planting date had no significant effect on THC content (except Cherry Abacus), CBD content (Cherry Abacus), and the CBD:THC ratio (except Abacus) of different tested varieties (Figure 7). There was a significant interaction between varieties and planting dates for CBD and THC content, whereas the CBD:THC ratio had no significant interaction. It can be noticed that Figure 7 does not include the CBD and THC contents at harvest for all eight varieties, as some of the varieties were destroyed by the hurricanes during the later stages of the growing period. A high amount of rainfall along with heavy winds significantly affected some varieties, especially under the third planting. Abacus and Early bird varieties under the third planting flowered early and were harvested before the onset of hurricanes. Overall, total CBD content ranged from 3.3% in Cherry abacus under second planting to 8.4% in Abacus under first planting. Total CBD content was higher in Abacus and BaOX varieties and lowest in Early bird compared to other varieties under first planting, whereas Abacus and BaOX had significantly higher CBD content compared to the Cherry abacus, Early bird, and Stout varieties under second planting (Figure 7A). Furthermore, CBD content was significantly higher in Abacus compared to the Early bird variety under the third planting. A similar trend to CBD content was observed for total THC content in different varieties under all three planting dates. Total THC content ranged from 0.14% in Cherry abacus under the second planting to 0.33% in Abacus under the second planting. Moreover, varieties Abacus and BaOX exceeded the legal limit of 0.3% THC content at harvest, but other varieties had a THC content of less than 0.3% at harvest (Figure 7B). The CBD:THC ratio at harvest ranged from 27.3 in the Stout variety under the second planting to 23.3 in the Abacus variety under the third planting. Overall, there were not many differences between the varieties, except for the CBD:THC ratio, which was significantly higher in the Stout compared to the Cherry abacus under the second planting (Figure 7C).
At the EREC location, the total CBD, total THC and CBD:THC ratio were significantly different between the varieties (Table 3). Overall, the CBD content was significantly higher in BaOX (14.5%) compared to ACDC (8.6%), W × S (9.6%), S × S (10.5%), Super CBD (11.4%), and Wife (11.9%) varieties (Figure 8A). A very similar trend was observed for THC content where BaOX (0.68%) recorded the highest THC content compared to the ACDC (0.41%), W*S (0.46%), S*S (0.50%), and Super CBD (0.53%) varieties (Figure 8B). All seven varieties exceeded the legal THC limit of 0.3% at the time of harvest at the EREC location. The CBD:THC ratio was significantly higher in BaOX (21.4), and Super CBD (21.6) compared to the Cherry wine (20.2) and Wife (20.3) varieties (Figure 8C). Moreover, all seven varieties at the EREC location had higher total CBD and THC contents compared to the varieties at the USSC location.

3.3. CBD and THC Accumulation Curve at USSC

Data for CBD and THC accumulation in different varieties under different planting dates at USSC locations is shown in Figure 9. Both the CBD and THC accumulation patterns over the growing season varied among different varieties. In general, the CBD and THC content in plants increased over time for most varieties under different planting dates except for Early bird (Figure 9D) and Cherry abacus under second planting (Figure 9C). Moreover, the CBD and THC accumulation pattern appeared to be similar under different planting dates for each variety except for Cherry abacus in which the CBD and THC content increased over time under the first planting, did not change much under the second planting, and increased very slightly under the third planting (Figure 9C). Both the CBD and THC contents followed similar increase or decrease patterns during the crop growth in all the varieties under all planting dates (Figure 9). As a result, there was a significant and very high correlation between total CBD and THC contents (r2 = 0.75 to 0.97) in all eight varieties used in this study (Figure 10). Moreover, the THC content in most varieties exceeded the legal limit of 0.3% at some stage of the growing season except for the Early bird variety under first and third planting, Cherry abacus under second and third planting, and Otto stout under first and third planting (Figure 9). The information on flowering date and number of days to flower have been summarized in Table 1. Overall, almost all the varieties except Otto stout under first planting took more days to flower compared to second and third planting (Table 1). Moreover, all varieties from the Colorado source except Otto stout flowered early compared to the varieties from Kentucky source under all planting dates.

4. Discussion

In this study, we examined the effects of different varieties and planting dates on CBD, THC accumulation curves and growth and yield. We also examined the plant growth, CBD and THC contents and final biomass at harvest under different varieties at another location. At the USSC location, the final dry plant biomass at harvest was significantly affected by different varieties and planting dates. Variety BaOX had higher biomass compared to other varieties in the first and second planting. However, at EREC location, variety ACDC and Cherry wine recorded the highest biomass compared to other varieties. The final biomass of many varieties is close to what was reported in other states e.g., North Carolina [14]. Since some of the varieties were destroyed by the hurricanes, we cannot properly infer the effect of planting date on final plant biomass. However, based on the plant growth data (Plant height, canopy cover) and flowering data, the plant biomass appears to be high under first and second planting compared to the third planting. Therefore, planting earlier (End of April or May) might have advantages for farmers to make use of the longer photoperiod during the summer to produce high biomass, but at the same time, they can potentially avoid the hurricane season that peaks around mid-September.
At the EREC location, in general all seven varieties had higher total CBD and THC contents at harvest compared to the varieties at the USSC location. The CBD and THC content of variety BaOX (common at both locations at the time of harvest) was higher at EREC compared to the USSC location. This is probably because the BaOX variety at the EREC location was harvested eight weeks after flowering, whereas at the USSC location it was harvested at 6 weeks after flowering. Excessively high soil moisture condition during most of the growing season at the EREC location compared to the USSC location (Supplementary Figure S2) may be another factor which might have caused water logging stress in plants. Small et al., [15] stated that plants are likely to have higher THC and CBD content when under stress.
At the USSC location, both the CBD and THC accumulation patterns over the growing season varied among different varieties. This shows the non-uniform genetic variations in different varieties. It is well known that Cannabis sativa L. is a highly variable species in terms of botany, genetics, and its chemical profile [4]. In a recent study in North Florida, Yang et al., [10] reported different CBD and THC accumulation patterns between different varieties. Moreover, the CBD and THC accumulation patterns were identical across different planting dates for most of the varieties. Some studies found in the literature suggest that environmental conditions such as temperature [16,17] and soil moisture [15,18,19] can play a role in the THC and CBD accumulation in hemp plants. However, in our study, the temperature and rainfall did not have much effect on the CBD and THC accumulation patterns across different planting dates. The CBD and THC accumulation patterns were also similar during different planting dates for most of the varieties. Our results are in accordance with many other studies which have reported that the cannabinoids content generally increases with plant age after the flowering stage [20,21,22]. Furthermore, the CBD and THC content and their ratios (CBD:THC) at harvest at the USSC location were significantly different in various varieties, but the planting date had a significant effect on the CBD and THC content of the Cherry abacus variety only. It shows that the CBD and THC contents trait is largely controlled by genetic factors, but there can be some effect of the environment as well. This further supports the concept that plant genetics are likely a larger factor in determining the cannabinoid ratios of hemp than environmental or agronomic factors. Campbell et al. [18] tested 13 hemp cultivars and stated that the total THC content and total CBD content were primarily determined by genotype with over 80% variation in THC content and 83% in CBD content being attributed to genotype, and 1.7% and 6% of variation being attributed to the environment, respectively. Our results indicate that the CBD and THC contents are highly correlated. The THC content also increases with an increase in the CBD content. Ideally, farmers want to maximize the CBD content in the plants to get maximum profit, but there is a risk of higher THC content as well. According to the USDA rule, farmers will potentially have to destroy their hemp crop if THC content is higher than the legal limits (0.3%); thus, it is very important to understand the effect of genetics and the environment on CBD and THC contents in different hemp varieties. In our study, despite the small number of varieties used, the data support that variety selection is an extremely important factor in mitigating risk for farmers. Therefore, selection of the right variety for the environment and optimum harvest time is very important for successful hemp cultivation. The result of this study shows the importance of genetics compared to the environment for improving industrial hemp cultivation in sub-tropical climate similar to southern Florida. Therefore, this study has broader impacts to advance scientific knowledge in industrial hemp cultivation. Furthermore, the limited availability of scientific literature on industrial hemp, especially in tropical and sub-tropical climates, increases the importance of this study to identify suitable varieties with higher biomass yield and CBD content but also to comply with the THC content regulations.

5. Conclusions

The research reported flowering, growth, CBD and THC accumulation patterns and final biomass of different floral hemp varieties under different planting dates in organic soils of Florida. Overall, BaOX showed a higher CBD:THC ratio at both locations but it also exceeded the THC legal limit of 0.3% at harvest. Results showed that THC content exceeded the threshold level of 0.3% at some time during the flowering stage for all the varieties except Early bird and Otto stout. At the USSC location, the BaOX variety had higher biomass compared to other varieties, and at the EREC location, the ACDC and Cherry Wine varieties recorded the highest biomass compared to other varieties. Moreover, the plant growth and biomass were higher under first planting (last week of April) and second planting (last week of May) compared to third planting (last week of June), even though planting date did not have a significant effect on the total CBD content of the plants. Both the CBD and THC accumulation patterns over the growing season varied among different varieties. The results of this research clearly showed that genetics plays a major role in floral hemp biomass yield and accumulation of CBD and THC over time, as well as their content at the time of harvest. Our results contribute data to the current knowledge of suitable varieties for Sub-tropical and Tropical geographies where industrial hemp production has proven challenging. Also, the extensive data collection on CBD and THC content to develop CBD and THC accumulation curves in multiple varieties help the scientific community to understand the genetic and environmental effects on these important parameters in hemp.

Supplementary Materials

The following supporting information can be downloaded at: https://www.mdpi.com/article/10.3390/agronomy12112845/s1, Table S1: Different macro and micronutrient contents (pre-planting) at USSC and EREC locations; Figure S1: Monthly average air temperature during the growing season at USSC and EREC locations; Figure S2: Monthly cumulative rainfall during the growing season at USSC and EREC locations.

Author Contributions

Conceptualization, S.S.S., Z.T.B. and H.S.S.; methodology, S.S.S., Z.T.B., J.M.M., A.C., M.I. and H.S.S.; formal analysis, S.S.S., A.C. and H.S.S.; writing—original draft preparation, S.S.S., A.C. and H.S.S.; writing—review and editing, Z.T.B., J.M.M., M.I., D.C.O. and S.H.D.; supervision, H.S.S.; funding acquisition, H.S.S. All authors have read and agreed to the published version of the manuscript.

Funding

This research was funded by USDA-NIFA Hatch project (FLA-ERC-006028), The Mary Alice Fortin Foundation and the United States Sugar Corporation.

Data Availability Statement

Not applicable.

Acknowledgments

The authors are thankful to the Farm crew at the Everglades Research and Education center with their help in farm management and related operations. We also extend our thanks to the United Sates Sugar Corporation with all their help and collaboration during the project.

Conflicts of Interest

The authors declare that they have no conflicts of interest.

References

  1. Mark, T.; Shepherd, J.; Olson, D.; Snell, W.; Proper, S.; Thornsbury, S. Economic Viability of Industrial Hemp in the United States: A Review of State Pilot Programs. Available online: https://ageconsearch.umn.edu/record/302486/ (accessed on 8 November 2022).
  2. Fortenbery, T.R.; Bennett, M. Opportunities for Commercial Hemp Production. Appl. Econ. Perspect. Policy 2004, 26, 97–117. [Google Scholar] [CrossRef]
  3. Cherney, J.H.; Small, E. Industrial Hemp in North America: Production, Politics and Potential. Agronomy 2016, 6, 58. [Google Scholar] [CrossRef] [Green Version]
  4. Chandra, S.; Lata, H.; ElSohly, M.A. Cannabis Sativa L.-Botany and Biotechnology; Springer: Berlin/Heidelberg, Germany, 2017. [Google Scholar]
  5. Adesina, I.; Bhowmik, A.; Sharma, H.; Shahbazi, A. A Review on the Current State of Knowledge of Growing Conditions, Agronomic Soil Health Practices and Utilities of Hemp in the United States. Agriculture 2020, 10, 129. [Google Scholar] [CrossRef] [Green Version]
  6. Wimalasiri, E.M.; Jahanshiri, E.; Chimonyo, V.G.; Kuruppuarachchi, N.; Suhairi, T.; Azam-Ali, S.N.; Gregory, P.J. A Framework for the Development of Hemp (Cannabis Sativa L.) as a Crop for the Future in Tropical Environments. Ind. Crops Prod. 2021, 172, 113999. [Google Scholar] [CrossRef]
  7. Kaiser, C.; Cassady, C.; Ernst, M. Industrial Hemp Production. Cent Crop Divers. Univ. Ky. 2015, 27, 101–106. [Google Scholar]
  8. Williams, R.A.; Williams, D.W. Cannabinoids-human Physiology and Agronomic Principles for Production. Ind. Hemp Mod. Commod. Crop 2019, 73–91. [Google Scholar] [CrossRef]
  9. Register, F.; Agricultural Marketing Service, US Department of Agriculture. Establishment of a Domestic Hemp Production Program. Fed. Regist. 2019, 84, 58522–58564. [Google Scholar]
  10. Yang, R.; Berthold, E.C.; McCurdy, C.R.; da Silva Benevenute, S.; Brym, Z.T.; Freeman, J.H. Development of Cannabinoids in Flowers of Industrial Hemp (Cannabis Sativa L.): A Pilot Study. J. Agric. Food Chem. 2020, 68, 6058–6064. [Google Scholar] [CrossRef] [PubMed]
  11. Patrignani, A.; Ochsner, T.E. Canopeo: A Powerful New Tool for Measuring Fractional Green Canopy Cover. Agron. J. 2015, 107, 2312–2320. [Google Scholar] [CrossRef] [Green Version]
  12. Pinheiro, J.; Bates, D.; DebRoy, S.; Sarkar, D.; Team, R.C. Linear and Nonlinear Mixed Effects Models (Nlme). R Package Version 3.1, 2020, p. 149. Available online: https://cran.r-project.org/package=nlme (accessed on 8 November 2022).
  13. De Mendiburu, F.; de Mendiburu, M.F. Package ‘Agricolae.’ R Package Version 2019, 1. Available online: https://cran.r-project.org/web/packages/agricolae/index.html (accessed on 8 November 2022).
  14. 2019 North Carolina Hemp Strain Testing Results. Available online: https://hemp.ces.ncsu.edu/2020/02/2019-north-carolina-hemp-strain-testing-results/ (accessed on 7 October 2022).
  15. Small, E.; Beckstead, H.D.; Chan, A. The Evolution of Cannabinoid Phenotypes in Cannabis. Econ. Bot. 1975, 29, 219–232. [Google Scholar] [CrossRef]
  16. De Prato, L.; Ansari, O.; Hardy, G.E.S.J.; Howieson, J.; O’Hara, G.; Ruthrof, K.X. The Cannabinoid Profile and Growth of Hemp (Cannabis Sativa L.) Is Influenced by Tropical Daylengths and Temperatures, Genotype and Nitrogen Nutrition. Ind. Crops Prod. 2022, 178, 114605. [Google Scholar] [CrossRef]
  17. Sikora, V.; Berenji, J.; Latković, D. Influence of Agroclimatic Conditions on Content of Main Cannabinoids in Industrial Hemp (Cannabis Sativa L.). Genet.-Belgrade 2011, 43, 449–456. [Google Scholar] [CrossRef]
  18. Campbell, B.J.; Berrada, A.F.; Hudalla, C.; Amaducci, S.; McKay, J.K. Genotype× Environment Interactions of Industrial Hemp Cultivars Highlight Diverse Responses to Environmental Factors. Agrosystems Geosci. Environ. 2019, 2, 1–11. [Google Scholar] [CrossRef] [Green Version]
  19. Caplan, D.; Dixon, M.; Zheng, Y. Increasing Inflorescence Dry Weight and Cannabinoid Content in Medical Cannabis Using Controlled Drought Stress. HortScience 2019, 54, 964–969. [Google Scholar] [CrossRef] [Green Version]
  20. Chandra, S.; Lata, H.; Mehmedic, Z.; Khan, I.A.; ElSohly, M.A. Assessment of Cannabinoids Content in Micropropagated Plants of Cannabis Sativa and Their Comparison with Conventionally Propagated Plants and Mother Plant during Developmental Stages of Growth. Planta Med. 2010, 76, 743–750. [Google Scholar] [CrossRef] [PubMed] [Green Version]
  21. De Backer, B.; Maebe, K.; Verstraete, A.G.; Charlier, C. Evolution of the Content of THC and Other Major Cannabinoids in Drug-type Cannabis Cuttings and Seedlings during Growth of Plants. J. Forensic Sci. 2012, 57, 918–922. [Google Scholar] [CrossRef] [PubMed]
  22. Pacifico, D.; Miselli, F.; Carboni, A.; Moschella, A.; Mandolino, G. Time Course of Cannabinoid Accumulation and Chemotype Development during the Growth of Cannabis Sativa L. Euphytica 2008, 160, 231–240. [Google Scholar] [CrossRef]
Figure 1. Plant height (A) and Soil Plant Analysis Development (SPAD) values (B) during the growing season for different varieties at different planting dates at United States Sugar Corporation (USSC) location. Note: Some varieties flowered early and were harvested early compared to other varieties. Thus, SPAD and plant height data were not collected for those varieties. Thus, some data points are missing at later stages of the growing season.
Agronomy 12 02845 g001
Figure 2. Plant canopy cover at 53 days after transplanting for different varieties at different planting dates at the USSC location. Different letters on the bars represent significant differences (α = 0.05) between the varieties across all planting dates. Error bars represent standard error of the mean (n = 6). Note: This canopy cover data was collected at 53 days after planting. Some of the tested varieties (e.g., Early bird and Abacus) flowered early and were harvested before the canopy cover data collection.
Agronomy 12 02845 g002
Figure 3. Plant biomass (Kg/ha) at harvesting for different varieties at different planting dates at the USSC location. Different letters on the bars represent significant differences (α = 0.05) between the varieties across all planting dates. Error bars represent standard error of the mean (n = 6). Note: Some of the varieties were destroyed by the hurricanes during the later stages of the growing period, especially under the third planting. Thus, plant biomass data is not available for those varieties.
Agronomy 12 02845 g003
Figure 4. Plant height (A), and SPAD value (B) during the growing season for different varieties at Everglades Research and Education Center (EREC) location.
Agronomy 12 02845 g004
Figure 5. Plant canopy cover (%) at 34 days after transplanting for different varieties at EREC location. Different letters on the bars represent significant differences (α = 0.05) between the varieties. Error bars represent standard error of the mean (n = 4).
Agronomy 12 02845 g005
Figure 6. Plant biomass (Kg/ha) at harvesting for different varieties at EREC location. Different letters on the bars represent significant differences (α = 0.05) between the varieties. Error bars represent standard error of the mean (n = 4).
Agronomy 12 02845 g006
Figure 7. Total CBD (A), total THC (B), and CBD to THC ratio (C) at harvesting for different varieties at different planting dates at the USSC location. Different letters on the bars represent significant differences (α = 0.05) between the varieties across all planting dates. Error bars represent standard error of the mean (n = 6). Note: Some of the varieties were destroyed by the hurricanes during the later stages of the growing period, especially under the third planting. Thus, data for CBD and THC contents at harvest is not available for those varieties.
Agronomy 12 02845 g007
Figure 8. Total CBD (A), total THC (B), and CBD to THC ratio (C) at harvesting for different varieties at the EREC location. Different letters on the bars represent significant differences (α = 0.05) between the varieties. Error bars represent standard error of the mean (n = 4).
Agronomy 12 02845 g008
Figure 9. CBD and THC content curves within each planting date for different varieties, Abacus (A), BaOX (B), Cherry abacus (C), Early bird (D), Otto stout (E), Stout (F), T1 (G) and Wife (H) at USSC location. A dashed line was drawn at 0.3% THC, the maximum threshold of THC for hemp in the United States.
Agronomy 12 02845 g009aAgronomy 12 02845 g009b
Figure 10. Relationship between CBD and THC in each variety at USSC location.
Agronomy 12 02845 g010
Table 1. Varieties and their source, planting, and flowering dates in the study at United States Sugar Corporation (USSC) and Everglades Research and Education Center (EREC) locations.
CultivarPlanting DateDate of 50% FloweringDays to 50% Flowering
Planting IPlanting IIPlanting IIIPlanting IPlanting IIPlanting IIIPlanting IPlanting IIPlanting III
USSC location
BaOX5/12/205/29/206/25/207/13/207/27/208/05/20625941
Wife5/12/205/29/206/25/208/01/207/27/208/11/20815947
T15/12/205/29/206/25/207/13/207/27/208/05/20625941
Stout5/12/205/29/206/25/207/06/207/04/208/05/20553641
Abacus4/29/205/29/206/25/205/19/206/15/207/06/20201711
Cherry Abacus4/29/205/29/206/25/206/01/206/15/207/06/20331711
Early Bird4/29/205/29/206/25/205/19/206/15/207/06/20201711
Otto stout5/12/205/29/206/25/207/06/207/27/208/05/20555941
a EREC location
ACDC6/13/20 8/11/2020 59
BaOX6/13/20 8/11/2020 59
Cherry wine6/13/20 8/17/2020 65
S × S6/13/20 8/17/2020 65
Super CBD6/13/20 8/11/2020 59
W × S6/13/20 8/17/2020 65
Wife6/13/20 8/17/2020 65
a only one planting date at EREC location.
Table 2. Summary of ANOVA (fixed effects) for various response variables measured at USSC location.
Response
Variables
Fixed Effects (p-Value)
Varieties (V)Fumigation (F)Planting Date (PD)V × FV × PDF × PDV × F × PD
Plant Height<0.00010.15<0.00010.74<0.00010.3170.48
Canopy Cover<0.00010.07<0.00010.51<0.00010.1410.86
SPAD<0.00010.34<0.00010.19<0.00010.0180.22
Final Biomass<0.00010.380.020.12<0.00010.0620.16
CBD<0.00010.680.200.930.00160.6720.43
THC<0.00010.760.040.930.00360.5770.24
CBD/THC ratio0.0260.120.140.450.4230.2880.13
Table 3. Summary of ANOVA (fixed effects only) for various response variables measured at EREC location.
Response VariablesFixed Effects (p-Value)
Varieties (V)Days after Transplanting (DAT)V × DAT
Plant Height<0.0001<0.0001<0.0001
Canopy Cover0.001NANA
SPAD<0.0001<0.00010.004
Final Biomass<0.0001NANA
CBD 0.004NANA
THC0.008NANA
CBD/THC ratio0.002NANA
Publisher’s Note: MDPI stays neutral with regard to jurisdictional claims in published maps and institutional affiliations.

