Article

Impact of Field Topography and Soil Characteristics on the Productivity of Alfalfa and Rhodes Grass: RTK-GPS Survey and GIS Approach

1
Precision Agriculture Research Chair, Deanship of Scientific Research, King Saud University, Riyadh 11451, Saudi Arabia
2
Department of Agricultural Engineering, College of Food and Agriculture Sciences, King Saud University, Riyadh 11451, Saudi Arabia
*
Author to whom correspondence should be addressed.
Agronomy 2022, 12(12), 2918; https://doi.org/10.3390/agronomy12122918
Submission received: 17 October 2022 / Revised: 16 November 2022 / Accepted: 18 November 2022 / Published: 23 November 2022
(This article belongs to the Special Issue Soil Sensing and Landscape Modeling for Agronomic Application)

Abstract

:
Understanding the spatial pattern of soil chemical properties along with the topologic indicators is essential for site-specific agriculture management. A study was conducted on a 50 ha field to investigate the effect of selected topographic indicators, including elevation (DEM), slope (SL), flow accumulation (FA) and Topographic Wetness Index (TWI) on forage crop production. The soil samples and yield data were obtained from the field inventory. Topographical parameters of elevation and slope were estimated with the use of a real-time kinematic global positioning system (RTK-GPS), and then the DEM was generated. The collected soil samples were analyzed for pH, EC, nitrogen and soil organic carbon. Sentinel-2 images were for the creation of yield maps of alfalfa and Rhodes grass. Subsequently, on the basis of DEM, the generated elevation, slope and FA model were then compared with the yield and soil chemical properties. Statistical analysis revealed that the SL, FA and TWI, which are associated with water distribution, were significantly related to crop yields. The FA showed a medium-to-non-significant correlation with the productivity of both alfalfa (R2 = 0.586; p = 0.015) and Rhodes grass (R2 = 0.578; p = 0.01). A significant inverse correlation was recorded between the SL and the yield of both crops (R2 = −0.591 to −0.617; p = 0.01). The yield map revealed that the majority of the area (37.56%) of the experimental field was occupied by the medium-yield class, followed by the high-yield class (33.03%).

1. Introduction

Topographic variability is one of the main factors affecting soil properties and crop production [1]. Information on the influencing factors of spatiotemporal variability in crop yield is essential for the optimized use of agricultural inputs and increased profits [2]. Understanding the spatial pattern of soil chemical properties (SCP) along with topography indicators (TI) is essential for field management [3]. Site-specific-agriculture deals with field topography and soil characteristics exploring the temporal and spatial changes in enhanced crop production. It also plays a key role in the spatial distribution of soil particles, moisture content, organic matter, and nutrients throughout agricultural fields [4,5,6]. Understanding the relationship between topographic indicators and crop yield variability helps to improve crop management [7]. The topography of agricultural fields is described by several indicators, including the relative elevation, slope, surface curvature, upslope length or contribution area and flow accumulation [8,9]. The effect of those topographic indicators on crop yield was analyzed. The most important topographical and hydrological attributes, which are considered to induce a significant impact on crop production, include the slope, the aspect, the wetness index, the flow direction, the flow length and the flow accumulation [10,11,12]. These indicators represent important factors affecting the spatiotemporal dynamics of irrigation water in agricultural fields [13,14]. The soil surface configurations of agricultural fields are important factors that strongly influence crop productivity [15,16]. The response of crop yield to these indicators varies with different crops and different soil and climatic conditions [17].
Several studies have shown that crop production significantly correlates with soil characteristics such as topography, surface curvature, organic matter content and soil depth [8,18,19]. Recently, farmers have been able to collect more accurate site-specific data on soil, vegetation and plant residue characteristics from precision agriculture applications based on more accurate and cost-effective Global Positioning Systems (GPS) [20]. In agricultural systems, the digital elevation model (DEM), which refers to the digital representation of terrestrial topography, is of great importance in modeling watersheds and hydrological flow, assessing erosion and environmental impact, and in the interpretation of spatial variability in crops [21,22]. It was reported that topographic features (slope, aspect and drainage area) can be used for both the delineation of agricultural management zones and crop water management [8,23]. The digital elevation model (DEM) can be easily obtained from devices that are commonly used in agricultural fields, such as yield monitors, and thus assess the effect of topography on drainage and crop yield using the methods embodied in the GIS software programs. In addition to the conventional scanning methods, the DEMs can be implemented through several advanced technologies, including aerial or satellite methods. For small-scale agricultural fields, a DEM of high accuracy (decimeter or centimeter level) is critical for the efficient management of precision agriculture practices and hydrological modeling [24]. The real-time kinematic global positioning system (RTK-GPS) is an integral part of topographic surveys, one of the most efficient ground-based techniques used in the efficient topographic survey, and is considered a fast and inexpensive method that can provide DEMs of high resolution [25]. On the other hand, surveys using the RTK-GPS system are not only practical and fast but also generate more accurate topographic maps [26,27]. However, studying the topographic data along with soil information contributes to the explanation of crop-yield variations across agricultural fields [28]. Crop growth and yield are heavily influenced by soil nutrient conditions. In recent years, there has been a rise in the usage of remote sensing observations suitable for field-scale applications [29,30,31]. The combination of remotely sensed images and in situ observations used in crop models improves crop yield predictions. For example, several studies have combined statistical techniques (i.e., both linear and non-linear approaches) with satellite imagery to develop yield prediction models [3,32,33,34].
Investigating the topographic features of agricultural fields and understanding their impact on crop yield can significantly assist with the adoption of site-specific management practices. Therefore, this study was conducted to collect geospatial point-data using an RTK-GPS in order to: (1) generate a high-resolution DEM, slope (SL) and flow accumulation (FA) model; and (2) investigate the relationship between the generated topographic attributes (DEM, SL and FA) and soil properties with the spatial variation in alfalfa and Rhodes grass yields.

2. Materials and Methods

2.1. Study Area and the Experimental Field

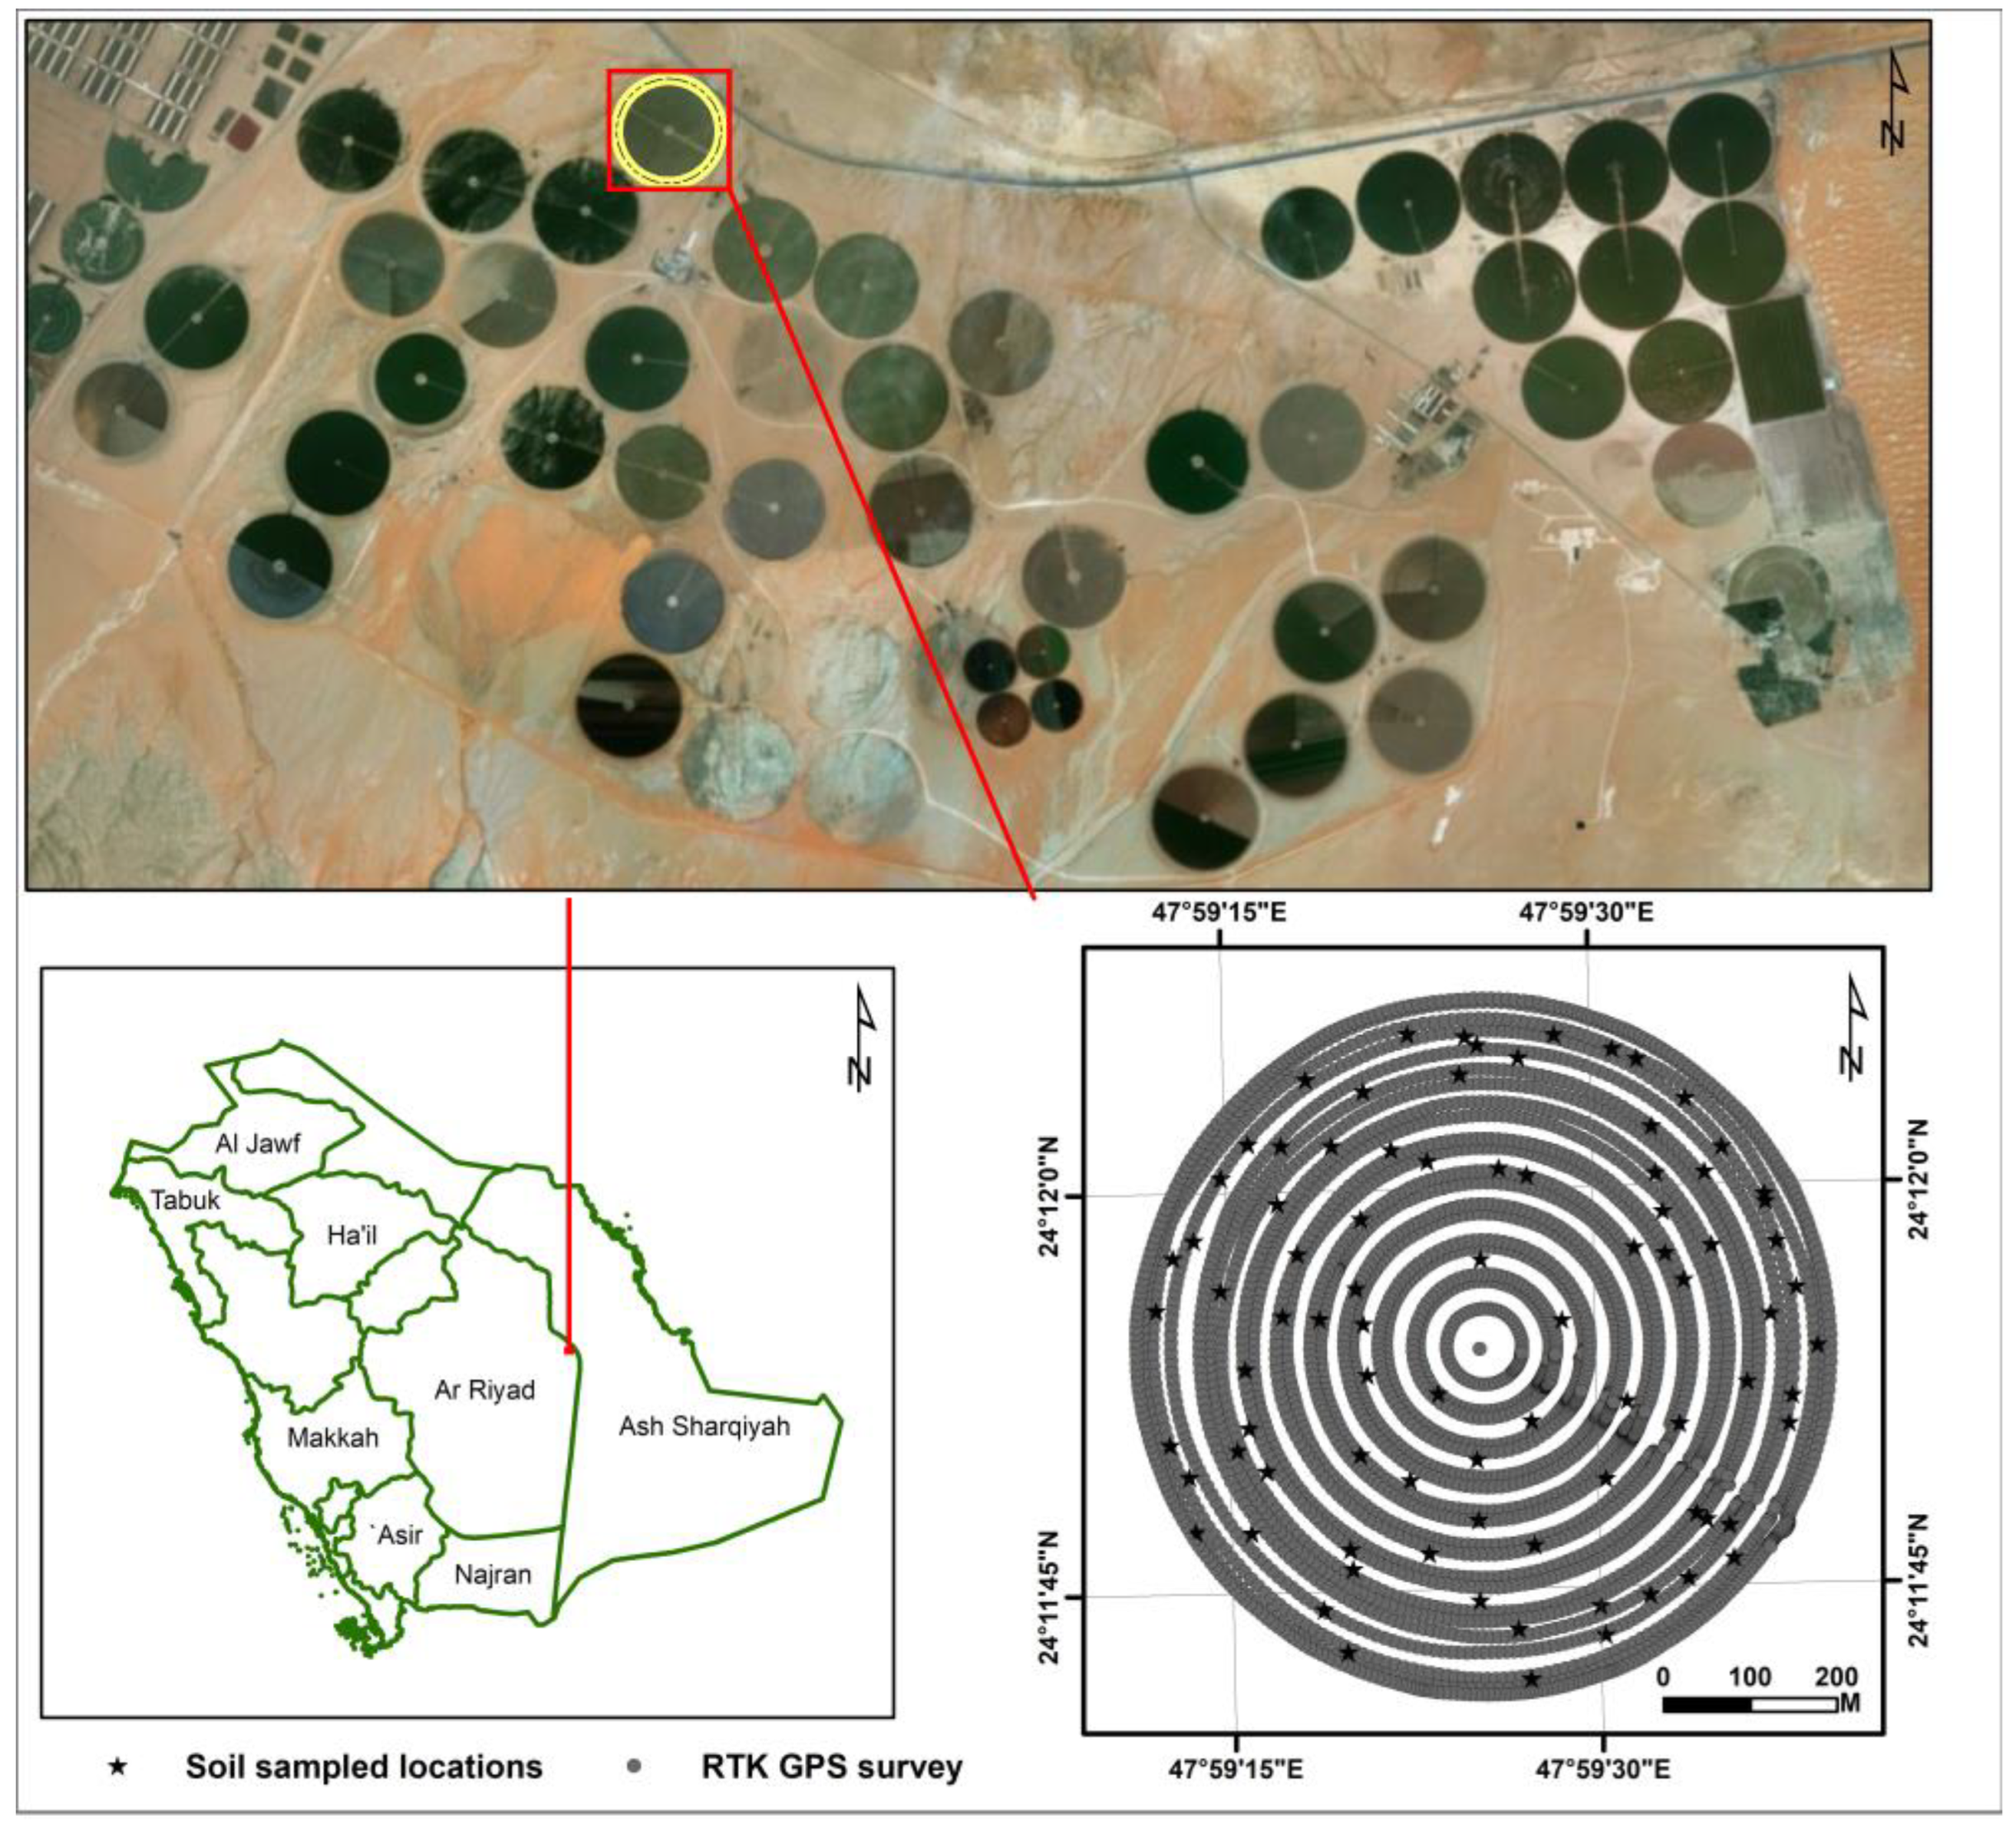
The experimental work was conducted on a 50 ha field (ID: Pivot-2) located in the Tawdeehiya Farms, 200 km southeast of Riyadh, the capital of Saudi Arabia. This farm, which covers an area of about 7000 ha, is located in an arid climatic zone between the latitudes of 24°10′22.77″ and 24°12′37.25″ N and longitudes of 47°56′14.60″ and 48°05′08.56″ E (Figure 1). The soil in the farm is mainly sandy loam and the major cultivated crops were alfalfa, Rhodes grass, corn and carrot. The annual mean minimum and maximum temperatures of the experimental site were 12 °C (winter) and 42 °C (summer), respectively. The mean annual rainfall was ~98 mm, mainly distributed between November and February [35]. The crop history of the experimental field (ID: Pivot-2) for the period from January 2015 to October 2017, provided by the farm manager, indicated that the field was under-cultivated for alfalfa crop for the period from March 2015 to November 2016, followed by Rhodes grass for the period from November 2016 up to October 2017.

2.2. RTK-GPS Survey and Mapping of Topography Indicators

A detailed topographic survey of the experimental field was performed to collect geospatial point-data using an RTK-GPS system (Model R8, Trimble). The two RTK-GPS receiver systems, one mounted on a vehicle as a rover and the other used as a local base station for correction, were used for the collection of continuous one-second measurements at an operating speed of 5.0–6.0 km h−1. The collected survey points were imported into the ArcGIS software program (ver. 10.4) for the generation of the digital elevation model (DEM) using the 3D analyst tool of the ArcGIS.
There are several available approaches to generating the DEMs; examples include the widely used Kriging and inverse distance weighting (IDW) approaches [36]. Kriging is a geostatistical approach, whereas the IDW is a deterministic method. Due to the simplicity of the IDW model, which works based on mathematical functions and the procedure performed on the sample points collected from the RTK GPS receiver, it is considered suitable for DEM generation [37]. The obtained DEM data were subjected to further analysis using the spatial analyst tool (hydrology) of the Esri ArcGIS for the generation of the surface layers of topographic indicators including the slope (SL), the flow direction (FD), and the flow accumulation (FA). To assess the cumulative effect of the topographic attributes on the crop yield, the topographic wetness index (TWI) as developed by Kirkby and Beven [38] was calculated, as in Equation (1).
TWI = l n   FA / S l o p e
where TWI is the compound topographic index and FA is the flow accumulation.

2.3. Sampling Strategy and Field Data Collection

Soil samples were collected from the experimental field from a total of 86 sampling locations, identified using the random sampling method. A manual soil auger with a bit diameter of 62 mm and a steel rod length of 1.0 m was used for the collection of soil samples at depths from 0 to 30 cm from the soil surface.
A large square baler (Claas 3200) was used for harvesting biomass yields of alfalfa and Rhodes grass fields. Approximately six to eight harvests were made for each season with a constant baler-chamber pressure of 55 to 60 bars and a forward speed of about 10–15 km h−1. Sampling bales, which represent the same geolocations of soil samples, were numbered and weighed.

2.4. Soil Physicochemical Properties Mapping

The collected soil samples were analyzed for soil EC, soil pH, soil N and soil organic carbon (SOC). The soil N content (mg kg−1) was determined in the laboratory using the Kjeldahl method [39], and soil pH and EC were measured using the pH/conductivity meter (Mi805). Soil texture was determined by the hydrometer method [40]. The geostatistical method (krigging procedure) was applied to generate soil EC, pH, nitrogen, and SOC maps. The geostatistical analyst tool of ESRI ArcGIS (ver. 10.4) software program was used to execute the ordinary kriging method and generated maps of soil EC, pH, N and SOC on a 10 m × 10 m grid.

2.5. Satellite Data, Image Analysis and Forage Yield Mapping

Recent studies proved that the drones and unmanned aerial vehicles (UAV) are the best facilities for site-specific studies [29]. However, due to the lack of facilities in our lab, cloud-free Sentinel-2A (Level-1) satellite images were downloaded from the Earth Explorer service (https://earthexplorer.usgs.gov/, accessed on 30 June 2022) of the USGS, USA (Table 1). The downloaded images were analyzed for surface reflectance using the Q-GIS software program (Ver. 3.1).
The Sentinel-2A datasets were geographically registered and georeferenced to the map projection of the Universal Transverse Mercator (UTM) using the World Geodetic System 84 (WGS84) datum. Subsequently, the Region of Interest (ROI), i.e., the area pertained to the experimental field, was created for further analysis of the collected data. Furthermore, each processed (i.e., TOA corrected) image was computed for NDVI [41]. In this study, yield prediction models (Table 2) developed by Patil et al. [32] were used for yield mapping. Yield models (yield-monitor based) developed by Patil et al. [32], used in this study, were part of a water productivity mapping research project conducted in the experimental farm during the period 2012–2014. Subsequently, the accuracy of the YP (x-axis) was evaluated against field collected yield (YA; y-axis) using standard statistical indicators, including the coefficient of determination (R2), mean bias error (MBE), and root mean square error (RMSE).

2.6. Data Analysis and Spatial Clusters of High and Low Yield Zones

For the assessment of the spatial variability in the experimental field, the studied topographic attributes (elevation, SL, FA and TWI) and soil properties (pH, EC, SOC and N) were correlated with the crop yield (YP) as a dependent variable. Multivariate regression techniques were utilized to assess the topographic effects on the cumulative VIs and YP. Moreover, spatial clusters of high- and low-yield zones in the experimental field were delineated using the hot-spot analysis tools of the ESRI ArcGIS, employing the z-scores and p-values of the studied attributes. Before embarking on the multiple regression and spatial cluster analysis, the obtained dataset (85 sampling observations) was randomly divided into two subsets of 65% (55 samples) and 35% (30 samples) for model development and cross-validation, respectively. Performance indicators, including the r, the R2, the mean bias error (MBE) and the root mean square error (RMSE), were utilized for the assessment of the models’ accuracy.

3. Results

3.1. Soil Chemical Properties

The results presented in Table 3 indicated a significant temporal increase in the soil EC of the experimental field, where the mean EC values increased from 1.5 mS cm−1 in 2015 to 2.2 mS cm−1 in 2016 and to 2.3 mS cm−1 in 2017. The results also exhibited significant spatial variability in the soil EC across the experimental field, as indicated by the high values of the coefficient of variation (CV), namely, 42.6%, 49.1% and 44.9% in the years 2015, 2016 and 2017, respectively. The excessive use of nitrogen fertilizers during the 2016 season for alfalfa enhanced the concentration of soil EC for 2016, and the same level was maintained during the 2017 season.
The results also showed spatiotemporal homogeneity of the soil pH in the experimental filed, with mean pH values in the range of 7.7–7.9. On the other hand, the results showed a remarkable temporal increase in the soil nitrogen (N) content, with mean values of 2.15 %, 2.74 %, and 2.94 % in the years 2015, 2016 and 2017, respectively. However, high spatial variability was observed in the soil N content across the experimental field, as indicated by the CV values of 31.19%, 36.46% and 24.19% for the years 2015, 2016 and 2017, respectively.
In terms of the soil organic carbon (SOC) content, the results showed no significant temporal variability across the study period, with mean residual SOC values of 1.32%, 1.34% and 1.44% in the years 2015, 2016 and 2017, respectively. The low CV values (11.92% in 2015 to 20.47% in 2017), however, indicated no spatial variability in the SOC content across the experimental field. Further interpretation of the results was performed through the classified maps of soil pH, EC, N and SOC, as shown in Figure 2. These maps showed low spatial variability across the experimental field in both soil pH and SOC, whereas the spatial variability in soil EC and nitrogen was moderate. In general, the experimental field was relatively homogeneous in terms of soil physicochemical properties.

3.2. Topographic Attributes

Table 4 summarizes the descriptive statistics, and Figure 3 illustrates the studied topographic attributes including the digital elevation model (DEM), the slope (SL), the flow accumulation (FA) and the topographic wetness index (TWI). The results showed no variability in the DEM across the experimental field (CV = 0.31%) and low variability in the SL (CV = 10.29%). However, the results indicated high variability in the FA (CV = 56.84%). The TWI was ranged from −6.61 to 15.75, which indicated that the experimental field exhibited high variability in the wetness conditions (CV = 57.34%).

3.3. Vegetation Indices and Crop Yield

A time-series assessment of vegetation indices (VIs), namely, the normalized difference vegetation index (NDVI) and the soil-adjusted vegetation index (SAVI), was carried out for the cultivated alfalfa and Rhodes grass crops during the study period (from 2015 to 2017). Multi-temporal profiles of the NDVI and SAVI were aggregated to cumulative values for “growth-and-cut” cycles. In the case of Alfalfa (2015–2016), the phenological characteristics and the “growth-and-cut” cycles were visible in the time-series NDVI and SAVI data. As given in Table 5, the alfalfa crop was characterized by a steep ascending phase, as indicated by a high CNDVI value of 2.15 during the early spring of 2016, compared to the subdued CNDVI value of 1.69 in 2015. In 2017, however, the highest CSAVI value of 3.12 was observed for Rhodes grass during summer. The average yield (YP) of alfalfa for the year 2015 and 2016, and Rhodes grass for the year 2017, was estimated at 5.53, 5.08 and 6.67 t ha−1, respectively.

4. Discussion

4.1. Yield Prediction

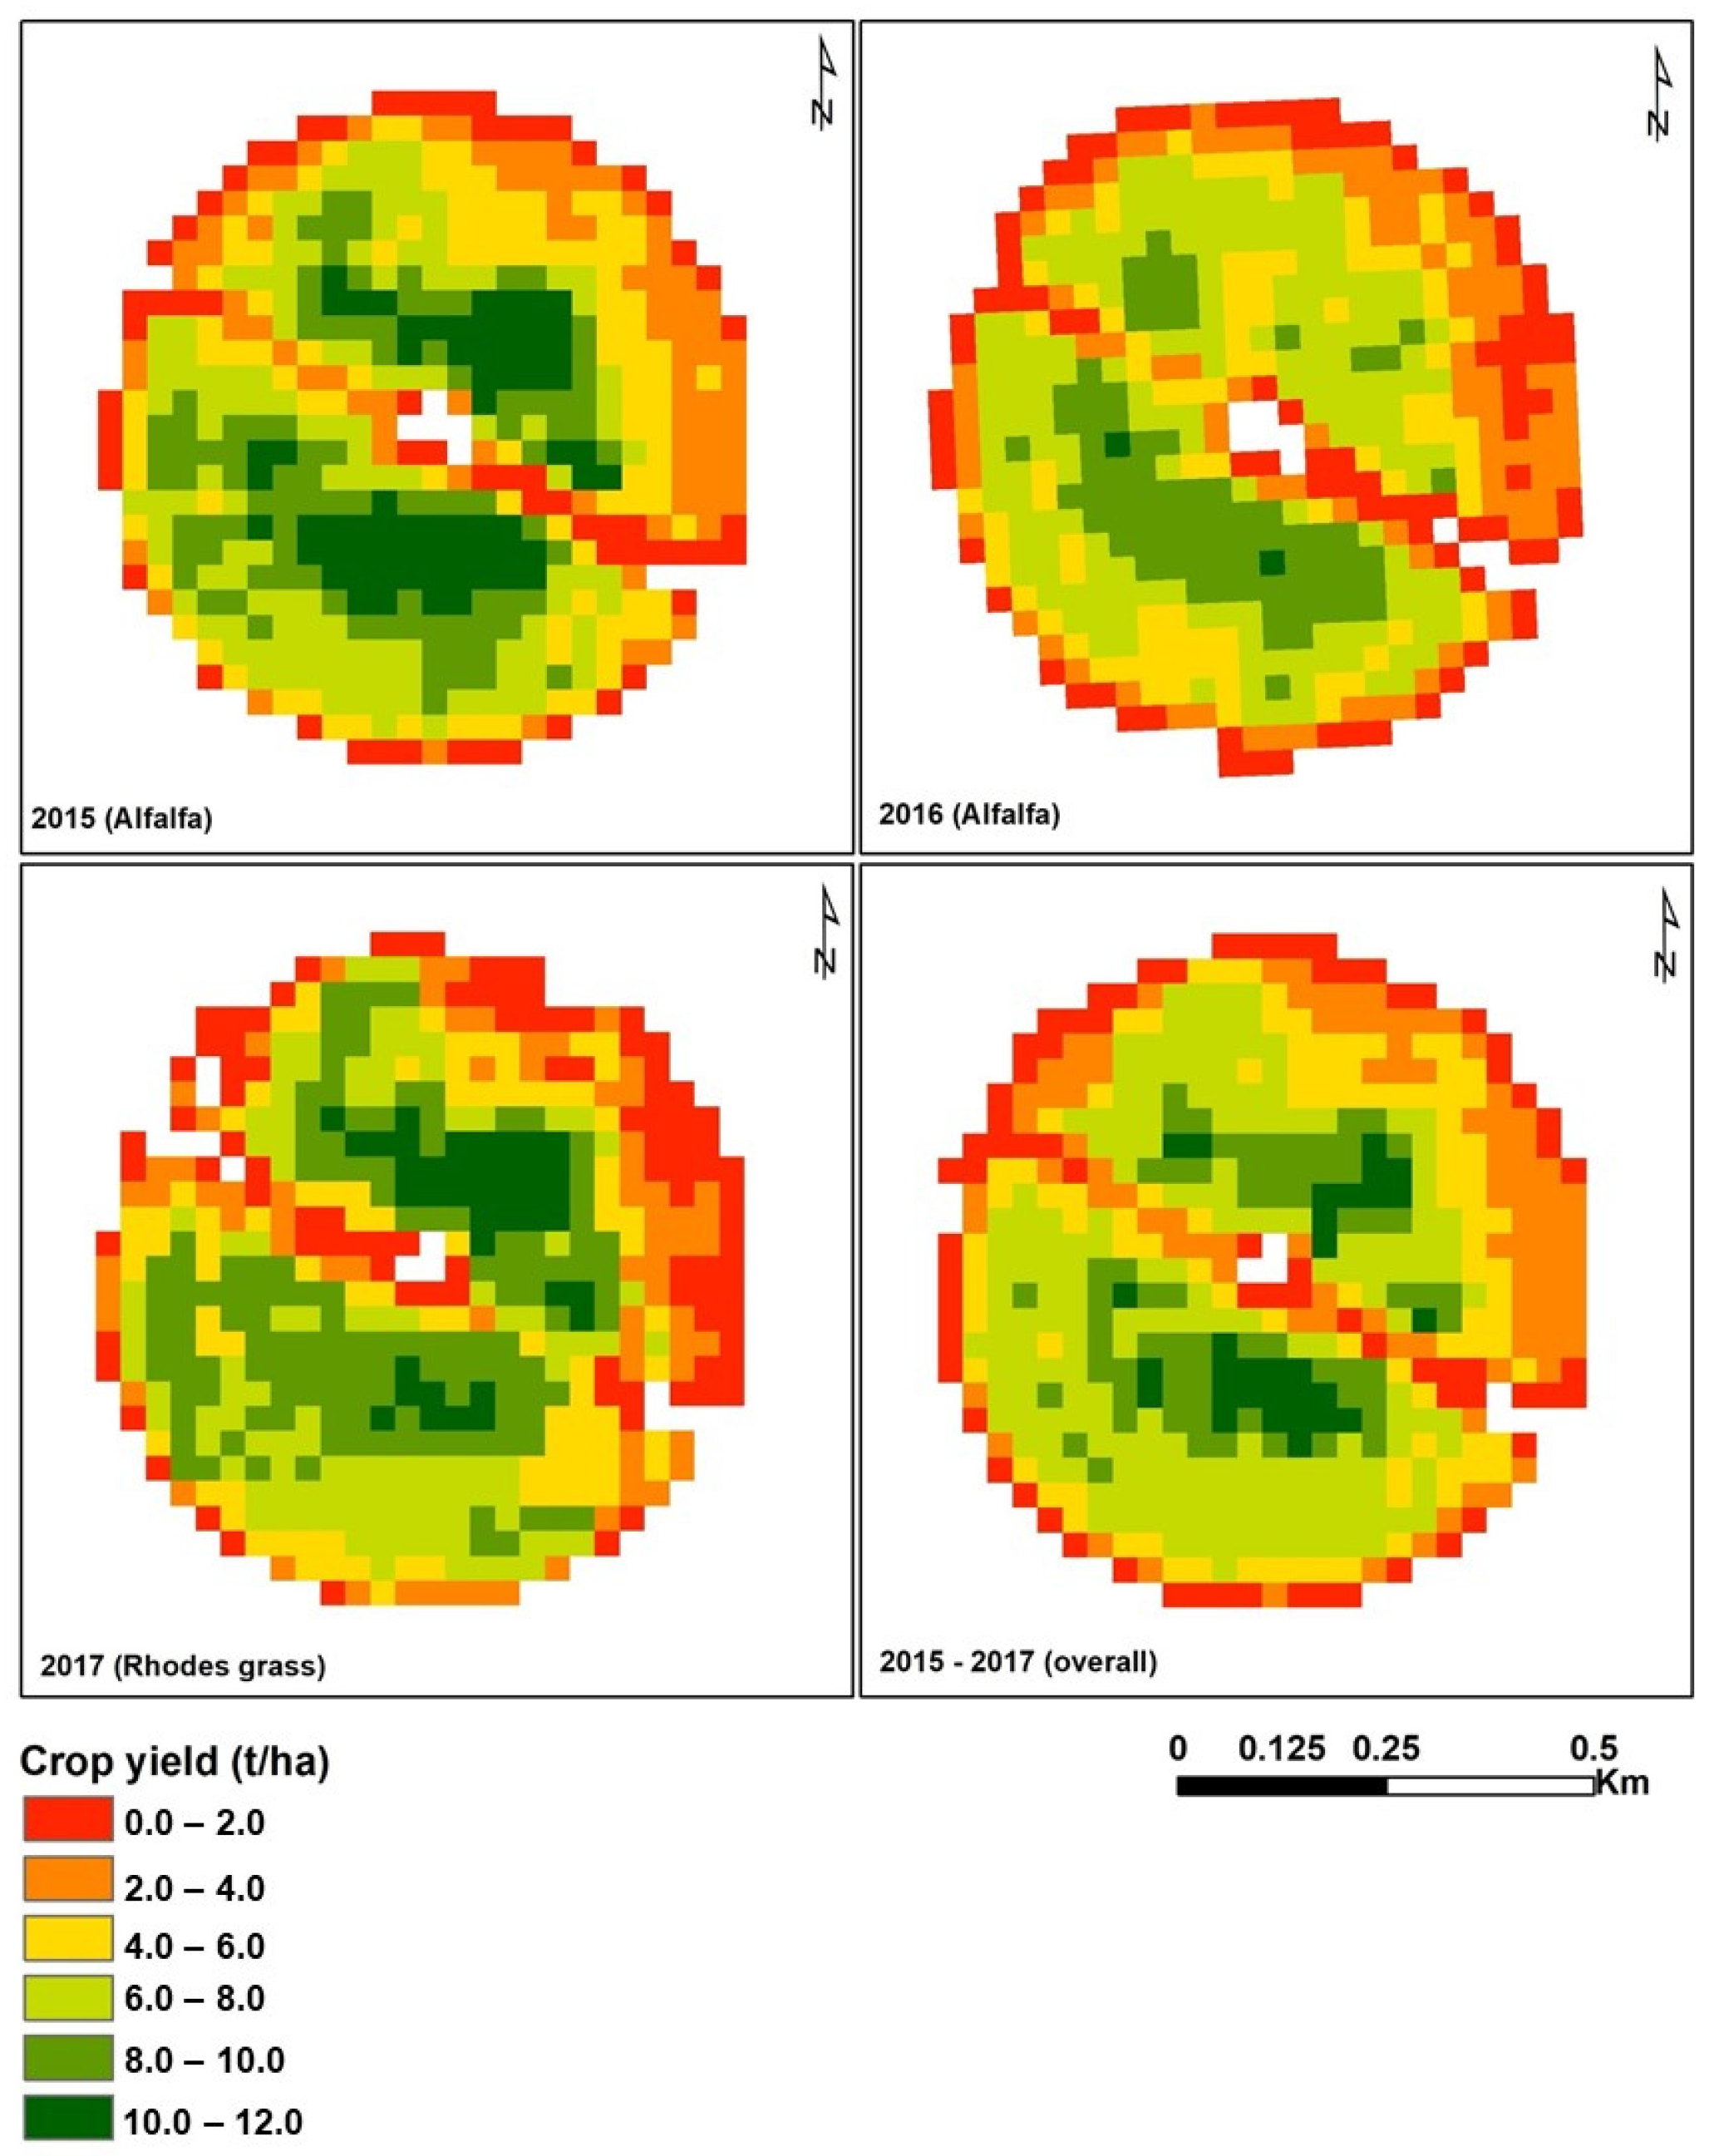
The yield maps of the studied crops showed significant spatial variability across the experimental field (Figure 4). The predicted yield (YP) was validated against the actual yield (YA) data obtained from the farm records, and the validation results showed significant to highly significant correlations (Table 6). The results revealed that the best correlation between the predicted and actual yields of both alfalfa and Rhodes grass was in the spring season (Figure 5).

4.2. Topography Features vs. Crop Yield

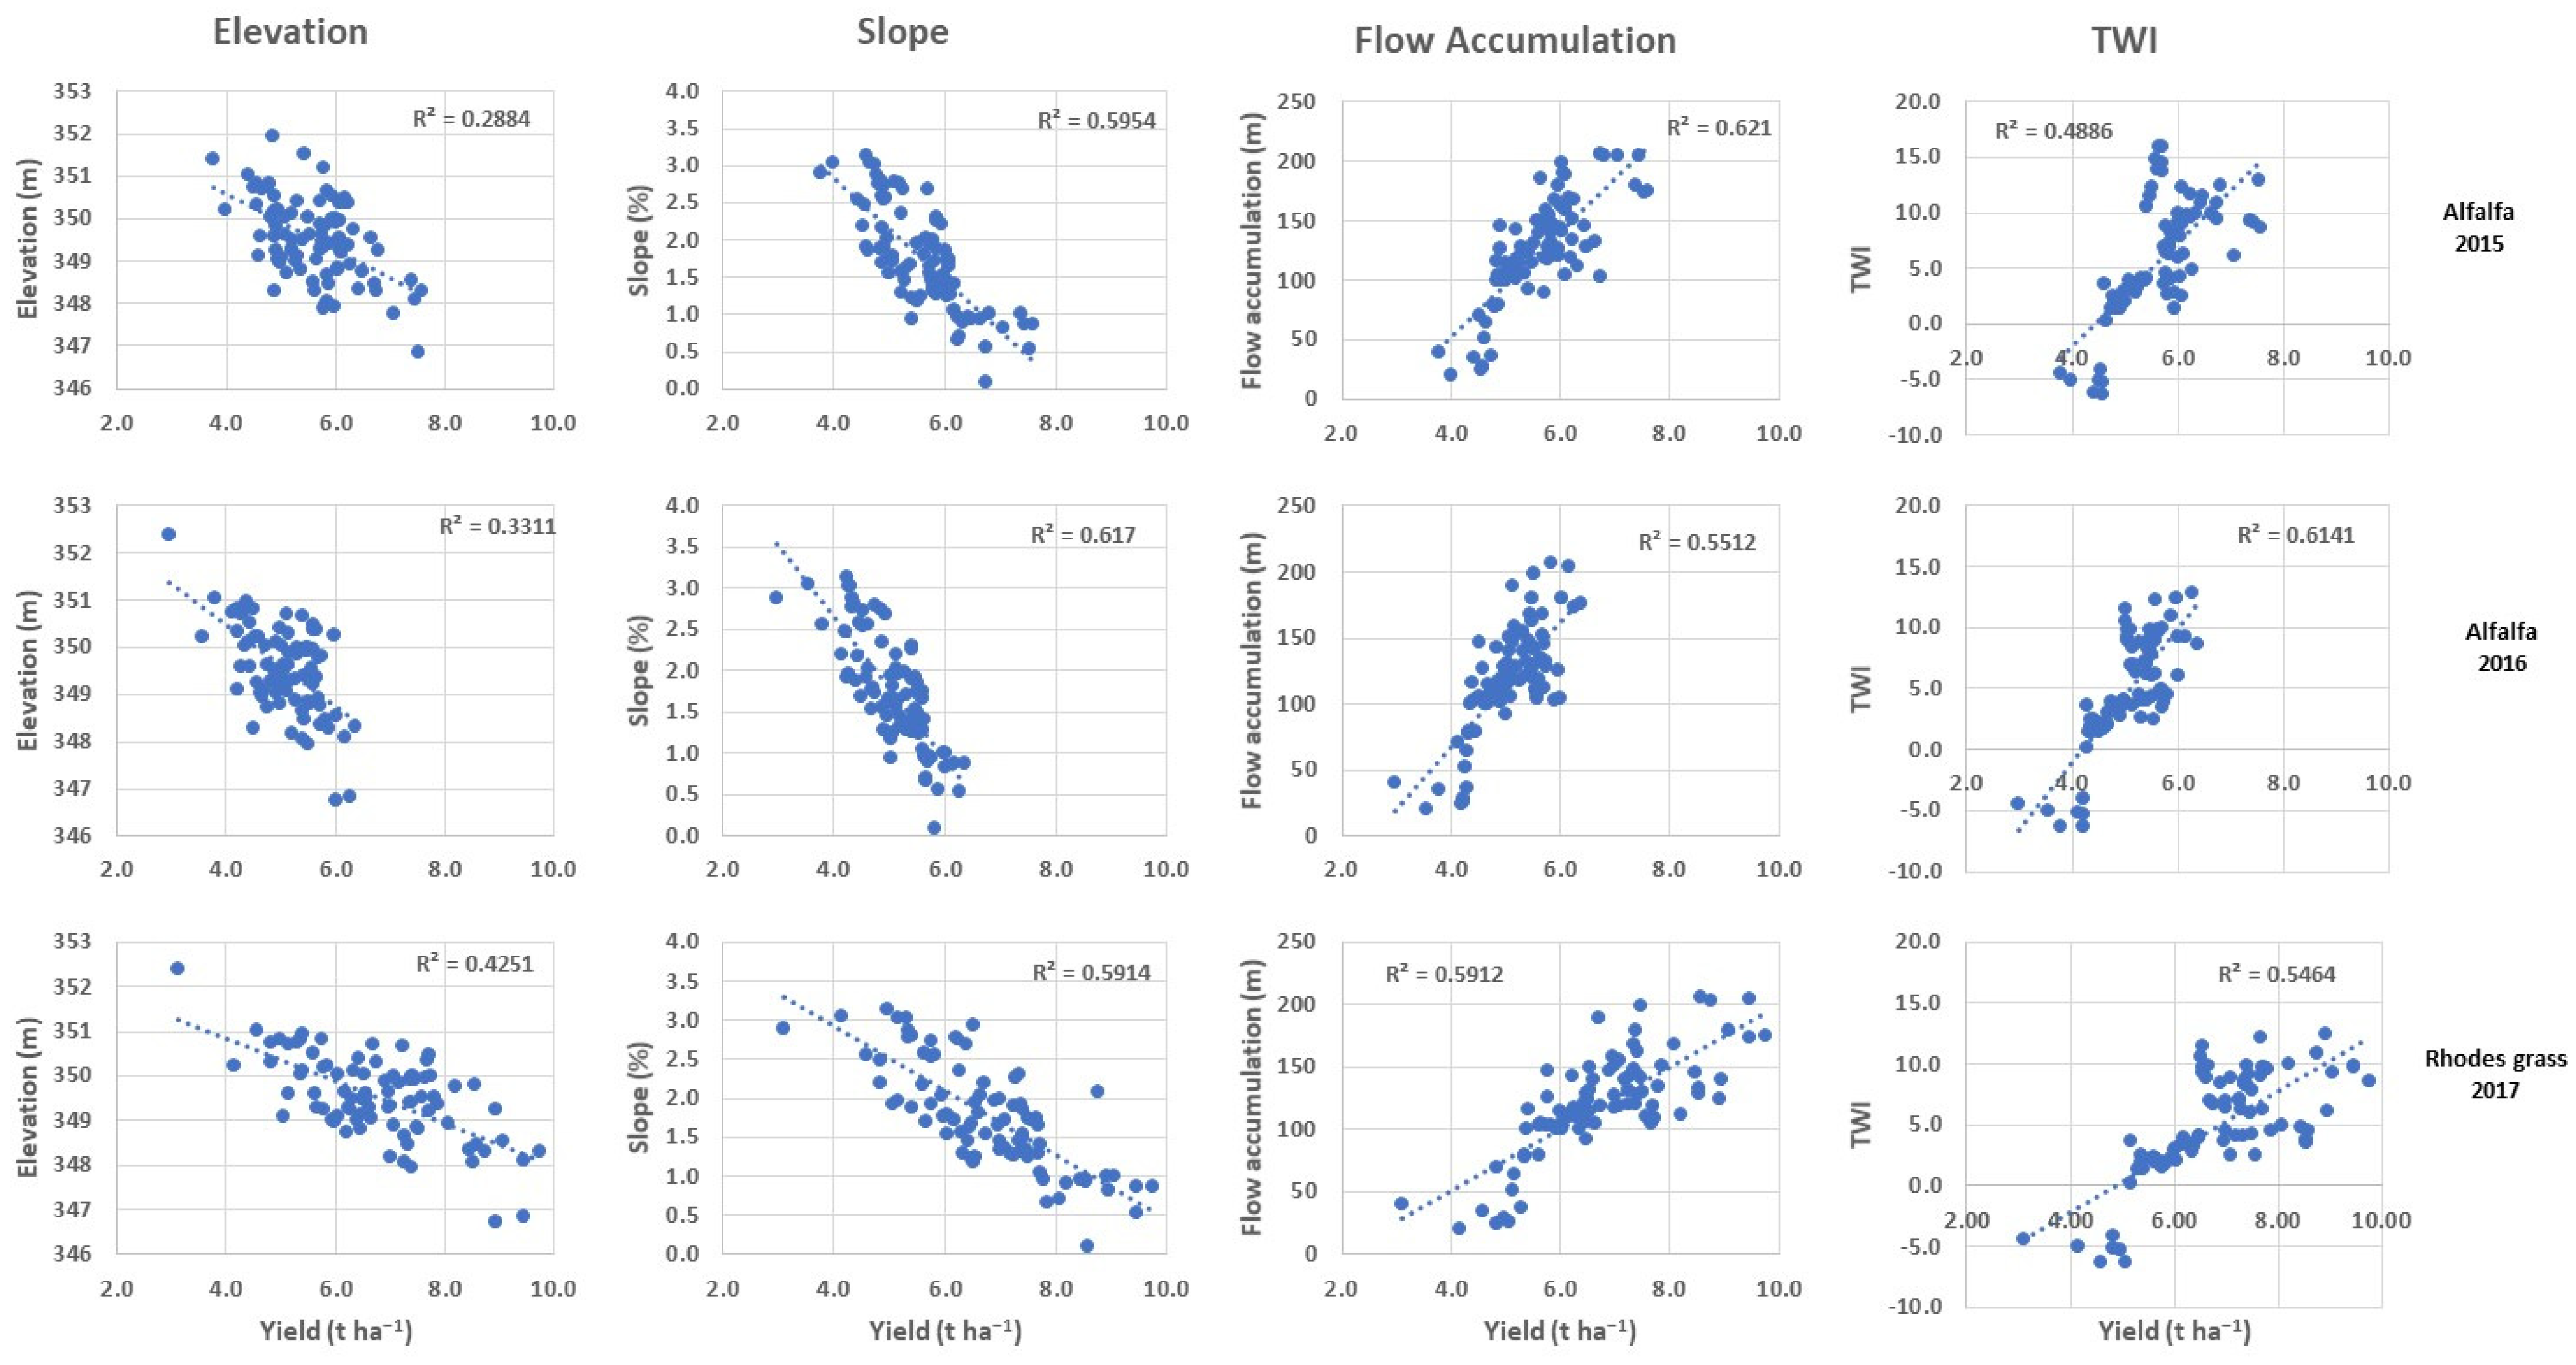
The impact of the topographical attributes (elevation, SL, FA and TWI) on the yields of the studied crops was studied (Figure 6), and the regression analysis results are presented in Table 7. It was observed that the elevation showed no significant effect on the yield of both alfalfa and Rhodes grass throughout the study period. The correlation results revealed a significant negative impact of the SL on the yield of both alfalfa and Rhodes grass. Earlier publications [42,43] confirmed a negative relationship between slope and crop yield. This is because steep slope positions tend to have more severe erosion, which is characterized by a thinner surface horizon, higher clay content, lower infiltration rate, and greater runoff, resulting in lower productivity [44], whereas the FA and TWI only showed a significant impact on the alfalfa crop. Overall, the SL and the FA were the most topographic indicators that significantly affected the productivity of the studied crops. As illustrated in Figure 3, it was also observed that the SL (the slope or the surface curvature) was the most important parameter affecting the yield components across the experimental field. This can be attributed to the fact that the landscape curvature significantly influences the concentration or diffusion of surface water flow and, hence, the soil moisture storage for crop growth [22,45,46].
The obtained results of the FA and crop yield (R2 = 0.551 to 0.621) are in agreement with Marques da Silva and Silva [47], who reported a positive correlation between alfalfa yield and the FA (R2 = 0.618; p = 0.0001). Moreover, the significant relationships between the crop yield and the topographic attributes can be justified by the water accumulation and storage, as well as different rates of water consumption by plants at upslope and downslope positions [5,48]. The obtained results exhibited no essential differences in the responses of Rhodes grass and alfalfa crops to the elevation. However, the SL showed a highly significant impact on alfalfa yield in 2016 and a less significant impact on Rhodes grass yield in 2017. The obtained results also revealed that the TWI was one of the essential factors affecting the yield of Rhodes grass and alfalfa.

4.3. Soil Physicochemical Properties vs. Crop Yield

Regression analysis results, represented by the coefficient of determination (R2) between soil physicochemical properties (pH, EC, SOC and N) and the crop yields, along with the Pr > Fare, are presented in Table 8. Both SOC and N components had a significant effect on the yields of both alfalfa and Rhodes grass crops (Figure 7). Soil EC, however, only had a significant impact on the alfalfa yield, in agreement with the earlier study of Emam et al. [49], which reported a negative effect between salinity stress and alfalfa. Soil pH revealed no significant impact on the yields of both studied crops. In general, of the studied soil properties, soil N had the most significant impact on both alfalfa and Rhodes grass. These results are in agreement with Bernardi et al. [50], who reported a weak relationship between alfalfa yield and soil pH.

4.4. Crop Yield Cluster Map

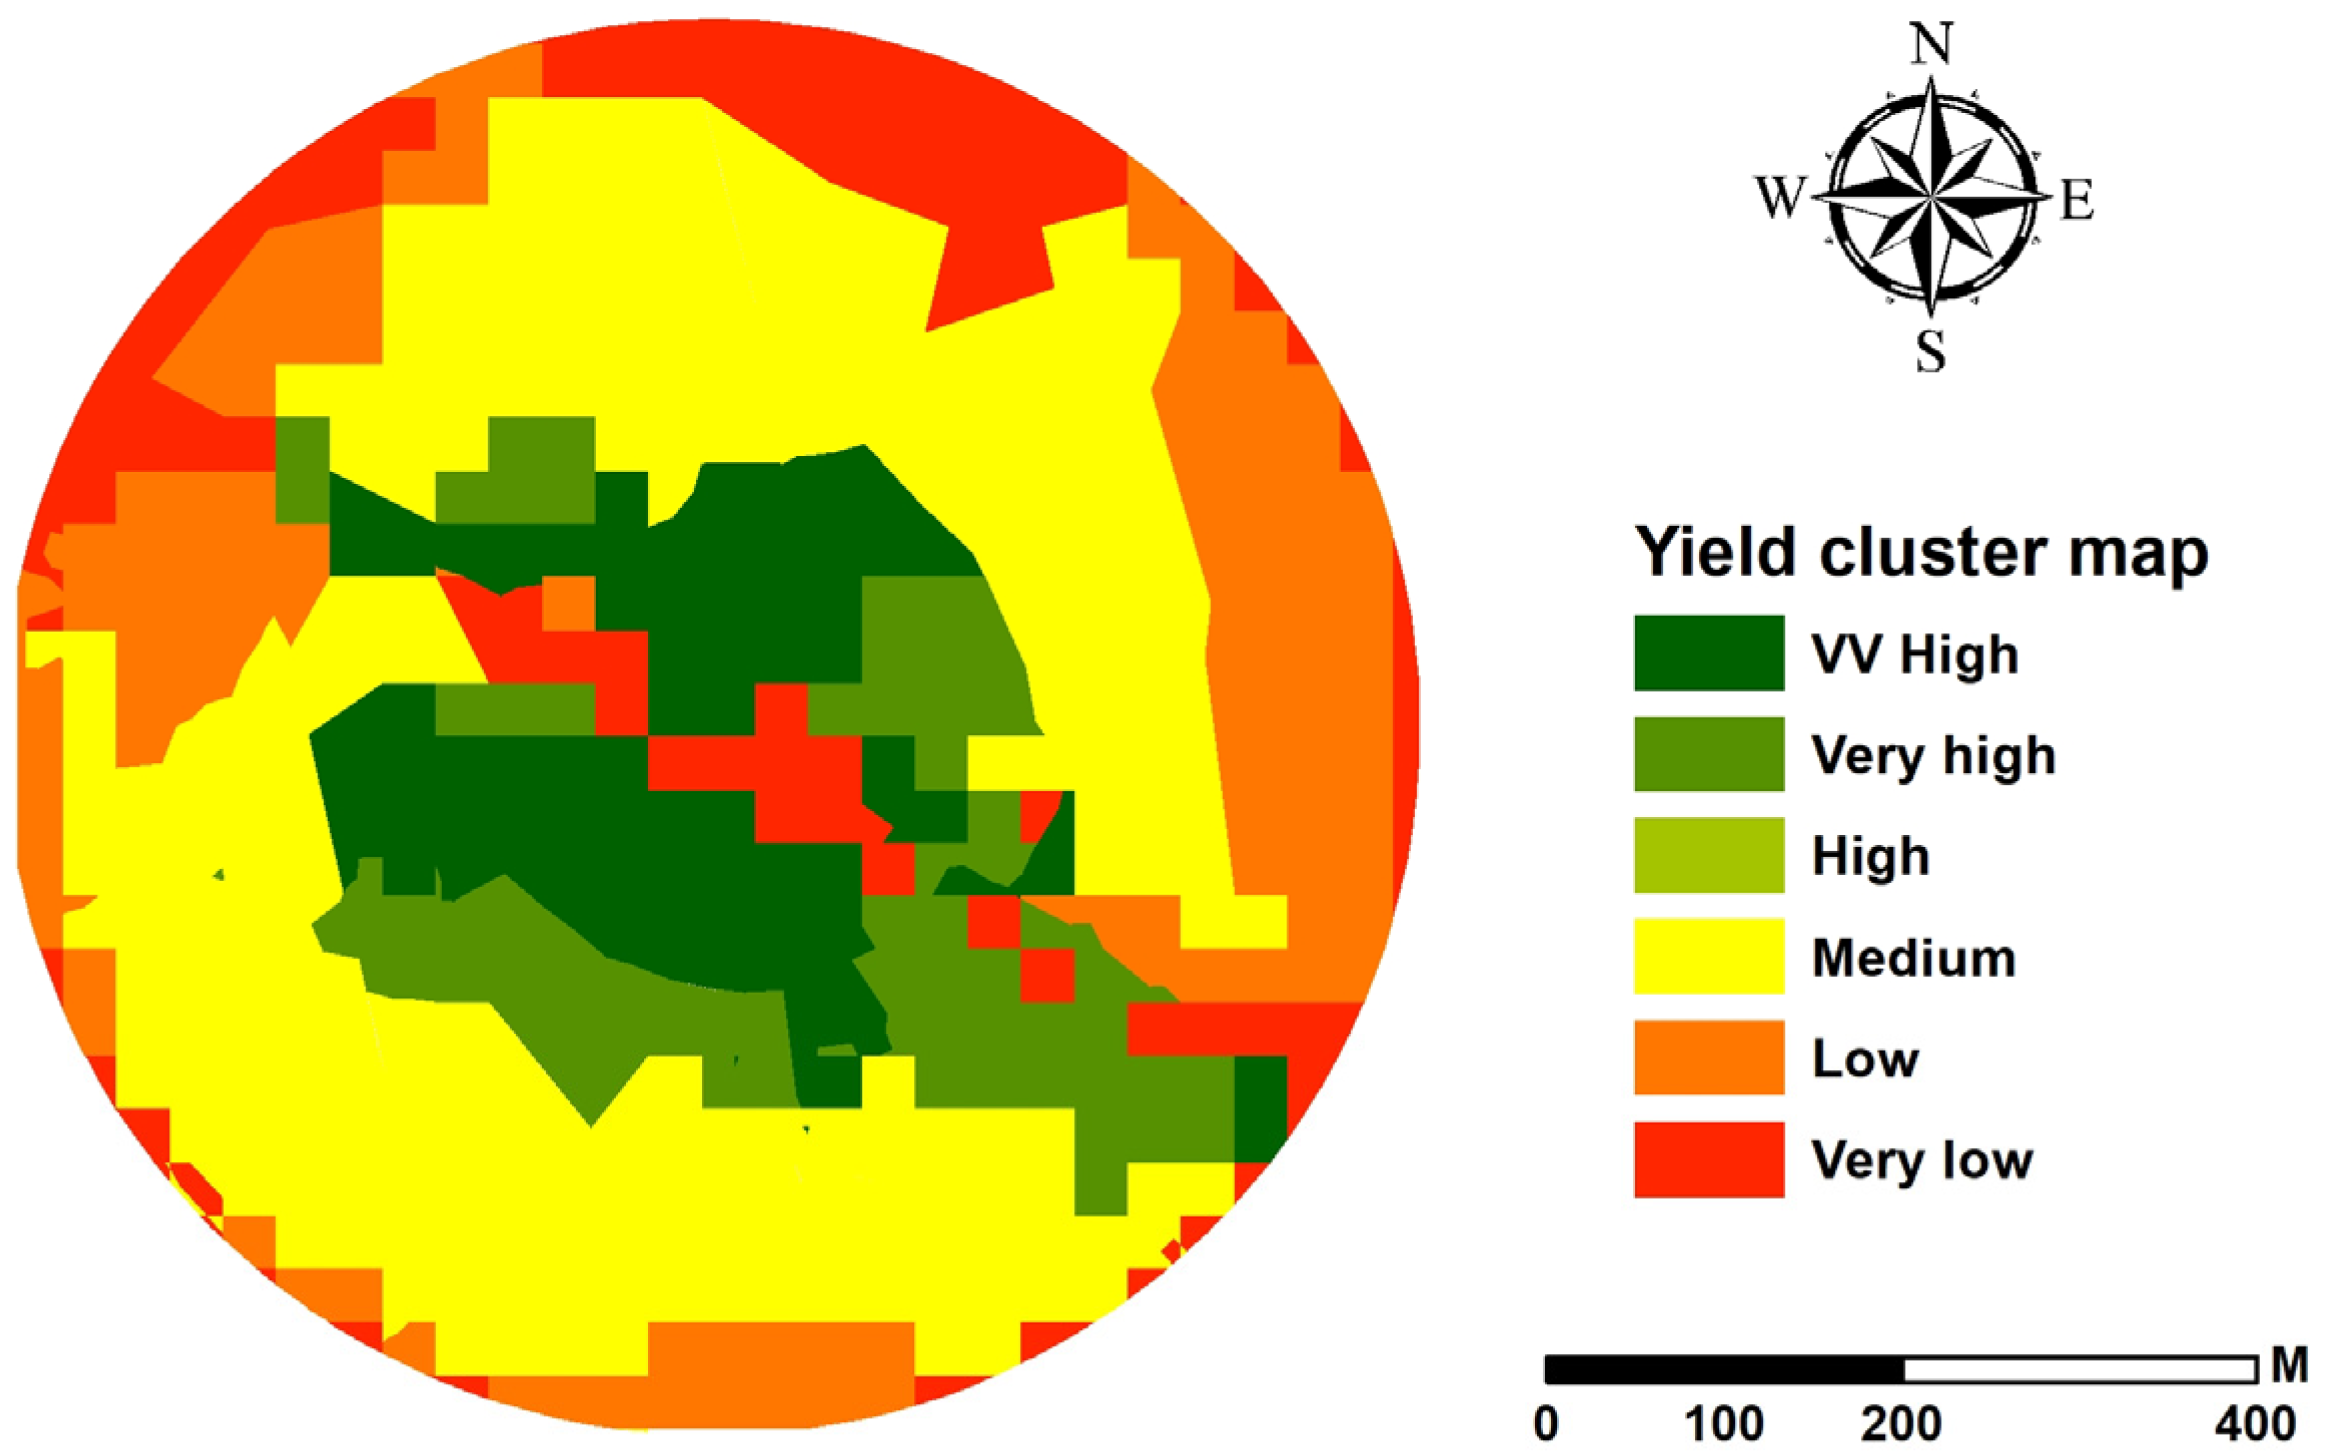
Yield cluster maps (Figure 8) were generated to investigate the impact of topography features (TWI) and soil physicochemical properties (soil EC, soil SOC and soil nitrogen) on the spatial variability of the productivity of the studied field. The generated cluster map resulted in six distinct yield zones (YZ): YZ-1 (very low) through to YZ-6 (VV high). The crop yield and the area occupied by each yield level are given in Table 9. The majority (37.56%) of the experimental field was occupied by the medium-yield class, followed by the high-yield class (33.03%). In general, the borders of the field were represented by the low (2–4 t ha−1)- and very low (0–2 t ha−1) yield clusters, which occupied 9.92% and 5.72% of the experimental area, respectively.

5. Conclusions

Topographic indicators including the elevation, slope (SL), flow accumulation (FA), and the topographic wetness index (TWI) derived from RTK-GPS data, in addition to the selected soil physicochemical properties (pH, EC, SOC and N), were investigated regarding the yield spatial variability of alfalfa and Rhodes grass. The following are the most important results of this study:
  • The elevation was shown to have a significant effect on the yield of both alfalfa and Rhodes grass. However, there was a significant negative impact of the SL on the yield of both alfalfa and Rhodes grass. Moreover, the FA and TWI had a significant positive influence on the yield of both crops.
  • Of the studied soil properties, the soil N had the most significant impact on the yield of both alfalfa and Rhodes grass.
  • The generated yield cluster map indicated that the majority area (37.56%) of the experimental field was occupied by the medium-yield class, followed by the high-yield class (33.03%), and the rest of the experimental field (29.41%) is characterized as a low-productivity area.
  • The outcomes of this study can be used as a reference for alfalfa crops and Rhodes grass yield mapping with respect to topography and soil chemical properties in the study region and areas with similar environmental conditions.

Author Contributions

Conceptualization, R.M. and K.A.A.-G.; methodology, R.M., K.A.A.-G. and E.T.; software, R.M. and A.M.Z.; validation, R.M., E.T. and K.A.A.-G.; formal analysis, M.K.E., A.A.A. and H.F.E.; investigation, R.M., E.T. and O.M.; resources, K.A.A.-G.; data curation, E.T. and A.M.Z.; writing—original draft preparation, R.M.; writing—review and editing, R.M., K.A.A.-G. and E.T.; visualization, E.T.; supervision, R.M. and E.T.; project administration, K.A.A.-G.; funding acquisition, K.A.A.-G. All authors have read and agreed to the published version of the manuscript.

Funding

This research was funded by the Deanship of Scientific Research, King Saud University, Riyadh, Saudi Arabia.

Data Availability Statement

Not applicable.

Acknowledgments

The authors are grateful to the Deanship of Scientific Research, King Saud University, for funding this study through the Vice Deanship of Scientific Research Chairs. The unstinted cooperation and support extended by Alan King in carrying out the field research work at the Tawdeehiya Farms, are gratefully acknowledged.

Conflicts of Interest

The authors declare that they have no conflict of interest.

References

  1. Rabia, A.H.; Neupane, J.; Lin, Z.; Lewis, K.; Cao, G.; Guo, W. Chapter four—Principles and applications of topography in precision agriculture. Adv. Agron. 2022, 171, 143–189. [Google Scholar]
  2. Franz, T.E.; Pokal, S.; Gibson, J.P.; Zhou, Y.; Gholizadeh, H.; Tenorio, F.A.; Rudnick, D.; Heeren, D.M.; McCabe, M.F.; Ziliani, M.; et al. The role of topography, soil, and remotely sensed vegetation condition towards predicting crop yield. Field Crops Res. 2020, 252, 107788. Available online: https://digitalcommons.unl.edu/natrespapers/1112 (accessed on 7 November 2022). [CrossRef]
  3. Li, Q.; Gu, F.; Zhou, Y.; Xu, T.; Wang, L.; Zuo, Q.; Xiao, L.; Liu, J.; Tian, Y. Changes in the Impacts of Topographic Factors, Soil Texture, and Cropping Systems on Topsoil Chemical Properties in the Mountainous Areas of the Subtropical Monsoon Region from 2007 to 2017: A Case Study in Hefeng, China. Int. J. Environ. Res. Public Health 2021, 18, 832. [Google Scholar] [CrossRef] [PubMed]
  4. Bhattarai, K.; Yousef, M.; Greife, A.; Naraharisetti, S.C.S. Influence of Topography on Sustainable Land Management: An Analysis of Socioeconomic and Ecodemographic Conditions of Nepal. Agriculture 2020, 10, 224. [Google Scholar] [CrossRef]
  5. Xiong, Y.; Li, Y.; Xiong, S.; Wu, G.; Deng, O. Multi-scale spatial correlation between vegetation index and terrain attributes in a small watershed of the upper Minjiang River. Ecol. Indic. 2021, 126, 107610. [Google Scholar] [CrossRef]
  6. Munoz, J.D.; Kravchenko, A. Deriving the optimal scale for relating topographic attributes and cover crop plant biomass. Geomorphology 2012, 179, 197–207. [Google Scholar] [CrossRef]
  7. Walley, F.; Pennock, D.; Solohub, M.; Hnatowich, G. Spring wheat (Triticum aestivum) yield and grain protein response to N fertilizer in topographically defined landscape positions. Can. J. Soil Sci. 2001, 81, 505–514. [Google Scholar] [CrossRef]
  8. Kravchenko, A.N.; Bollero, G.A.; Omonode, R.A.; Bullock, D.G. Quantitative mapping of soil drainage classes using topographical data and soil electrical conductivity. Soil Sci. Soc. Am. J. 2022, 66, 235–243. [Google Scholar] [CrossRef]
  9. Green, T.R.; Salas, J.D.; Martinez, A.; Erskine, R.H. Relating crop yield to topographic attributes using Spatial Analysis Neural Networks and regression. Geoderma 2007, 139, 23–37. [Google Scholar] [CrossRef]
  10. Halvorson, G.A.; Doll, E.C. Topographic effects on spring wheat yields and water use. Soil Sci. Soc. Am. J. 1991, 55, 1680–1685. [Google Scholar] [CrossRef]
  11. Bakhsh, A.; Colvin, T.; Jaynes, D.; Kanwar, R.; Tim, U. Using soil attributes and GIS for interpretation of spatial variability in yield. Agric. Biosyst. Eng. 2000, 43, 819–828. [Google Scholar] [CrossRef]
  12. Heil, K.; Heinemann, P.; Schmidhalter, U. Modeling the effects of soil variability, topography and management on the yield of Barley. Front. Environ. Sci. 2018, 6, 146. [Google Scholar] [CrossRef]
  13. Krummel, J.; Su, H. Topographic effect and its relation to crop production in an individual field. In Precision Agriculture-1996, Proceedings of the 3rd International Conference on Precision Agriculture, Minneapolis, MN, USA, 23–26 June 1996; American Society of Agronomy: Madison, WI, USA, 1996. [Google Scholar] [CrossRef]
  14. Iqbal, J.; Read, J.J.; Thomasson, A.J.; Jenkins, J.N. Relationships between Soil–Landscape and Dryland Cotton Lint Yield. Soil Sci. Soc. Am. J. 2005, 69, 872–882. [Google Scholar] [CrossRef] [Green Version]
  15. Robinson, N.J.; Rampant, P.C.; Callinan, A.P.L.; Rab, M.A.; Fisher, P.D. Advances in precision agriculture in south-eastern Australia. II. Spatio-temporal prediction of crop yield using terrain derivatives and proximally sensed data. Crop Pasture Sci. 2009, 60, 859–869. [Google Scholar] [CrossRef]
  16. Li, Y.; Yang, X.; Cai, H.; Xiao, L.; Xu, X.; Liu, L. Topographical characteristics of agricultural potential productivity during cropland transformation in China. Sustainability 2015, 7, 96–110. [Google Scholar] [CrossRef] [Green Version]
  17. Chi, B.L.; Bing, C.S.; Walley, F.; Yates, T. Topographic indices and yield variability in a rolling landscape of western Canada. Pedosphere 2009, 19, 362–370. [Google Scholar] [CrossRef]
  18. Timlin, D.J.; Pachepsky, Y.; Snyder, V.A.; Bryant, R.B. Spatial and temporal variability of corn grain yield on a hillslope. Soil Sci. Soc. Am. J. 1998, 51, 1025–1032. [Google Scholar] [CrossRef]
  19. Kaspar, T.C.; Colvin, T.S.; Jaynes, D.B.; Karlen, D.L.; James, D.E.; Meek, D.W.; Pulido, D.; Butler, H. Relationship between six years of corn yields and terrain attributes. Precis. Agric. 2003, 4, 87–101. [Google Scholar] [CrossRef]
  20. Renschler, C.S.; Flanagan, D.C. Site-Specific Decision-Making Based on RTK GPS Survey and Six Alternative Elevation Data Sources: Soil Erosion Predictions. Trans. ASABE Am. Soc. Agric. Biol. Eng. 2008, 51, 413. [Google Scholar] [CrossRef]
  21. Kumhalova, J.; Kumhala, F.; Kroulik, M.; Matejkova, S. The impact of topography on soil properties and yield and the effect of weather conditions. Precis. Agric. 2011, 12, 813–830. [Google Scholar] [CrossRef]
  22. Neupane, J.; Guo, W. Agronomic basis and strategies for precision water management: A review. Agronomy 2019, 9, 87. [Google Scholar] [CrossRef] [Green Version]
  23. Pilesjo, P.; Thylen, L.; Persson, A. Topographical data for delineation of agricultural management zones. In Precision Agriculture ’05, Proceedings of the 5th European Conference on Precision Agriculture, Uppsala, Sweden, 9–12 June 2005; Stafford, J.V., Ed.; Wageningen Academic Publishers: Wageningen, The Netherlands, 2005; pp. 819–826. [Google Scholar]
  24. Persson, A.; Pilesjo, P.; Eklundh, L. Spatial influence of topographical factors on yield of potato (Solanum tuberosum L.) in central Sweden. Precis. Agric. 2005, 6, 341–357. [Google Scholar] [CrossRef]
  25. Ouma, Y.O. Evaluation of multiresolution digital elevation model (DEM) from real-time kinematic GPS and ancillary data for reservoir storage capacity estimation. Hydrology 2016, 3, 16. [Google Scholar] [CrossRef] [Green Version]
  26. Kizil, U.; Tisor, L. Evaluation of RTK-GPS and Total Station for Applications in Land Surveying. J. Earth Syst. Sci. 2011, 120, 215–221. [Google Scholar] [CrossRef] [Green Version]
  27. Idris, M. Evaluation of GPS-RTK and Total Station for Topographic Survey and Strategic Decision in Private Companies. KnE Eng. 2019, 4, 323–332. [Google Scholar] [CrossRef]
  28. Kumhalova, J.; Matejkova, S.; Fifernova, M.; Lipavsky, J.; Kumhala, F. Topography impact on nutrition content in soil and yield. Plant Soil Environ. 2008, 54, 255–261. [Google Scholar] [CrossRef] [Green Version]
  29. Ziliani, M.G.; Parkes, S.D.; Hoteit, I.; McCabe, M.F. Intra-Season Crop Height Variability at Commercial Farm Scales Using a Fixed-Wing UAV. Remote Sens. 2018, 10, 2007. [Google Scholar] [CrossRef] [Green Version]
  30. Foster, T.; Brozovic, N.; Butler, A.P.; Neale, C.M.U.; Raes, D.; Steduto, P.; Fereres, E.; Hsiao, T.C. AquaCrop-OS: An open source version of FAO’s crop water productivity model. Agric. Water Manag. 2017, 181, 18–22. [Google Scholar] [CrossRef]
  31. Manfreda, S.; McCabe, M.E.; Miller, P.E.; Lucas, R.; Madrigal, V.P.; Mallinis, G.; Dor, E.B.; Helman, D.; Estes, L.; Ciraolo, G.; et al. On the Use of Unmanned Aerial Systems for Environmental Monitoring. Remote Sens. 2018, 10, 641. [Google Scholar] [CrossRef] [Green Version]
  32. Patil, V.C.; Al-Gaadi, K.A.; Madugundu, R.; Tola, E.; Marey, S.; Aldosari, A.; Biradar, C.M.; Gowda, P.H. Assessing agricultural water productivity in desert farming System of Saudi Arabia. IEEE J. Sel. Top. Appl. Earth Obs. Remote Sens. 2015, 8, 284–297. [Google Scholar] [CrossRef]
  33. Peng, B.; Guan, K.Y.; Pan, M.; Li, Y. Benefits of Seasonal Climate Prediction and Satellite Data for Forecasting US Maize Yield. Geophys. Res. Lett. 2018, 45, 9662–9671. [Google Scholar] [CrossRef]
  34. Leroux, L.; Castets, M.; Baron, C.; Escorihuela, M.J.; Begue, A.; Lo Seen, D. Maize yield estimation in West Africa from crop process-induced combinations of multi-domain remote sensing indices. Eur. J. Agron. 2019, 108, 11–26. [Google Scholar] [CrossRef]
  35. Madugundu, R.; Al-Gaadi, K.A.; Tola, E.; Kayad, A.G.; Hassaballa, A.A.; Patil, V.C. Seasonal dynamics of surface energy fluxes over a centre-pivot irrigated cropland in Saudi Arabia. J. Environ. Biol. 2017, 38, 743–751. [Google Scholar] [CrossRef]
  36. Al-Mamoori, S.K.; Al-Maliki, L.A.; Al-Sulttani, A.H.; El-Tawil, K.; Al-Ansari, N. Statistical analysis of the best GIS interpolation method for bearing capacity estimation in An-Najaf City, Iraq. Environ. Earth Sci. 2021, 80, 683. [Google Scholar] [CrossRef]
  37. Achilleos, G.A. The Inverse Distance Weighted interpolation method and error propagation mechanism—Creating a DEM from an analogue topographical map. J. Spat. Sci. 2011, 56, 283–304. [Google Scholar] [CrossRef]
  38. Kirkby, M.J.; Beven, K.J. A physically based, variable contributing area model of basin hydrology. Hydrol. Sci. J. 1979, 24, 43–69. [Google Scholar]
  39. Lynch, J.M.; Barbano, D.M. Kjeldahl nitrogen analysis as a reference method for protein determination in dairy products. J. AOAC Int. 1999, 82, 1389–1398. [Google Scholar] [CrossRef] [Green Version]
  40. Bouyoucos, G.J. A recalibration of the hydrometer method for making mechanical analysis of soils. Agron. J. 1951, 43, 434–438. [Google Scholar] [CrossRef] [Green Version]
  41. Rouse, J.W.; Hass, R.H.; Schell, J.A.; Deering, D.W. Monitoring vegetation systems in the Great Plains with ERTS. In Proceedings of the 3rd ERTS Symposium, NASA SP-351, Washington, DC, USA, 10–14 December 1973; pp. 309–317. [Google Scholar]
  42. Yang, C.; Peterson, C.L.; Shropshire, G.J.; Otawa, T. Spatial variability of field topography and wheat yield in the Palouse region of the Pacific Northwest. Trans. ASAE 1998, 41, 17–27. [Google Scholar] [CrossRef]
  43. Kravchenko, A.N.; Bullock, D.G. Correlation of corn and soybean grain yield with topography and soil properties. Agron. J. 2000, 92, 75–83. [Google Scholar] [CrossRef]
  44. Wright, R.J.; Boyer, D.G.; Winant, W.M.; Perry, H.D. The influence of soil factors on yield differences among landscape positions in an Appalachian cornfield. Soil Sci. 1990, 149, 375–382. [Google Scholar] [CrossRef]
  45. Dinaburga, G.; Lapins, D.; Kopmanis, J. Effect of differences in soil moisture on winter wheat yield. In Proceedings of the Engineering for Rural Development Conference, Jelgava, Latvia, 27–28 May 2010. [Google Scholar]
  46. Bodner, G.; Nakhforoosh, A.; Kaul, H. Management of crop water under drought: A review. Agron. Sustain. Dev. 2015, 35, 401–442. [Google Scholar] [CrossRef]
  47. Marques da Silva, J.R.; Silva, L.L. The yield pattern considering the distance to flow accumulation lines. Eur. J. Agron. 2008, 28, 551–558. [Google Scholar] [CrossRef] [Green Version]
  48. McConkey, B.G.; Ulrich, D.J.; Dyck, F.B. Slope position and subsoiling effects on soil water and spring wheat yield. Can. J. Soil Sci. 1997, 77, 83–90. [Google Scholar] [CrossRef]
  49. Emam, Y.; Bijanzadeh, E.; Naderi, R.; Edalat, M. Effect of salt stress on vegetative growth and ion accumulation of two alfalfa (Medicago sativa L.) cultivars. Desert 2009, 14, 163–169. [Google Scholar]
  50. Bernardi, A.C.C.; Bettiol, G.M.; Ferreira, R.P.; Santos, K.E.L.; Rabello, L.M.; Inamasu, R.Y. Spatial variability of soil properties and yield of a grazed alfalfa pasture in Brazil. Precis. Agric. 2016, 17, 737–752. [Google Scholar] [CrossRef]
Figure 1. Location map of the study area.
Agronomy 12 02918 g001
Figure 2. Classified maps of soil physicochemical properties of the experimental field. Nitrogen (AC), soil pH (DF), soil organic carbon (GI) and soil electrical conductivity (JL) maps for the year 2015, 2016 and 2017 of experimental field.
Agronomy 12 02918 g002
Figure 3. Classified maps of topography features (elevation, slope (SL), flow accumulation (FA) and Topographic wetness index (TWI)).
Agronomy 12 02918 g003
Figure 4. Classified maps of predicted (YP) yield of alfalfa and Rhodes grass.
Agronomy 12 02918 g004
Figure 5. A scatter plot between actual yield (YA) and predicted yield (YP) of (af) Alfalfa and (gi) Rhodes grass. The round (dark blue) and triangular (red) points represent the training and validation datasets, respectively.
Agronomy 12 02918 g005
Figure 6. Scatter plots with regression analysis between predicted yield (YP) and topographical factors.
Agronomy 12 02918 g006
Figure 7. Scatter plots with regression analysis between predicted yield (YP) and soil properties.
Agronomy 12 02918 g007
Figure 8. Classified map of high- and low-productivity clusters.
Agronomy 12 02918 g008
Table 1. Sentinel-2A satellite images: date of satellite overpass (Scene ID: T38QRM).
Month201520162017
January-3, 195
February14, 20-
March57, 2326
April228, 2411, 27
May2410, 2613, 29
June9, 2511, 2730
July11, 2713, 2916
August12, 2814, 301, 17
September13, 29152, 18
October15, 311, 1720
November1625
December2, 18207, 23
Table 2. Yield prediction models for alfalfa and Rhodes grass crops.
CropYield ModelReference
AlfalfaY = 9.6754 × NDVI − 0.1097[32]
Rhodes grassY = 11.3946 × NDVI − 0.3807
Table 3. Temporal variation in soil physicochemical properties of the experimental field.
Sample No. = 86201520162017
MinMaxAvg.CV (%)MinMaxAvg.CV (%)MinMaxAvg.CV (%)
Soil EC (mS cm−1)0.92.11.542.61.63.22.249.11.43.32.344.9
Soil pH7.77.97.812.67.78.07.917.27.88.17.919.6
Soil Nitrogen (%)0.094.592.1531.190.185.622.7436.460.125.162.9424.19
Soil Organic Carbon (%)0.692.241.3211.920.792.041.3416.110.942.191.4420.47
Table 4. Summary statistics of the topography features.
ParametersElevation (m)SL (%)FA (m)TWI
Minimum346.850.1020.25−6.61
Maximum351.393.05205.9615.75
Mean349.250.6841.616.94
Standard Deviation1.080.2523.653.98
Coefficient of Variation (CV), %0.3110.2956.8457.34
Table 5. Seasonal mean of studied vegetation indices (NDVI and SAVI) and crop yield, YA (t ha−1).
N = 85Season2015 (Alfalfa)2016 (Alfalfa)2017 (Rhodes Grass)
Cumulative NDVISummer0.901.602.30
Spring1.692.152.74
Winter0.091.402.04
Cumulative SAVISummer2.103.592.87
Spring3.202.943.12
Winter2.202.242.16
Yield (YP)Summer4.714.495.18
Spring6.656.647.35
Winter2.222.664.92
Mean5.535.086.67
Table 6. Relationship between the predicted (YP) and actual (YA) crop yields.
CovarianceAlfalfa (2015)Alfalfa (2016)Rhodes Grass (2017)
SummerSpringWinterSummerSpringWinterSummerSpringWinter
R20.61 *0.71 **0.56 *0.59 **0.74 **0.64 NS0.62 *0.58 **0.53 *
RMSE (t ha−1)0.910.930.541.031.340.621.151.191.02
RMSE (%)22.4617.2821.9719.1920.6924.2120.2918.1915.92
MBE (t ha−1)0.580.760.240.690.920.550.870.780.66
MBE (%)17.19−9.62−12.910.6216.84−17.19−12.81−9.14−11.9
* Significant at 0.05 level, ** significant at 0.01 level and NS not significant.
Table 7. Correlation coefficients (R2) between the cumulative yields and the topographical attributes.
YearCropElevationSLFATWI
2015Alfalfa−0.288 NS−0.595 NS0.621 *0.489 NS
2016Alfalfa−0.331 NS−0.617 **0.551 **0.614 *
2017Rhodes grass−0.425 NS−0.591 *0.578 *0.519 *
Overall −0.398 NS−0.593 *0.583 *0.546 *
F0.84017.39517.8887.374
Pr > F0.3640.0020.0010.009
* Significant at 0.05 level, ** significant at 0.01 level and NS not significant.
Table 8. Comparison of R2 results between the cumulative crop yield and soil physicochemical properties.
YearCropSoil pHSoil ECSOCNitrogen
2015Alfalfa0.216 NS0.435 *0.562 *0.424 **
2016Alfalfa0.337 NS0.547 **0.579 **0.602 *
2017Rhodes grass0.309 NS0.319 NS0.512 *0.519 *
Overall 0.279 NS0.443 *0.547 *0.552 **
F7.711.4325.8569.526
Pr > F0.0810.0010.0030.000
* Significant at 0.05 level; ** significant at 0.01 and NS not significant.
Table 9. Area statistics extracted from the predicted yield map.
Yield (Yp), t ha−1Alfalfa (2015)Alfalfa (2016)Rhodes Grass (2017)Overall Mean
ha%ha%ha%ha%
VV high: 10–120.170.340.000.000.561.120.240.49
Very High: 8–103.847.686.2112.429.8819.766.6413.29
High: 6–89.4918.9814.6229.2425.4350.8616.5133.03
Medium: 4–627.7355.4621.1442.287.4714.9418.7837.56
Low: 2–44.859.706.1112.223.927.844.969.92
Very Low: 0–23.927.841.923.842.745.482.865.72
Overall50.00100.0050.00100.0050.00100.0050.00100.00
Publisher’s Note: MDPI stays neutral with regard to jurisdictional claims in published maps and institutional affiliations.