Article

Genetic Diversity and Population Differentiation of Dongxiang Wild Rice (Oryza rufipogon Griff.) Based on SNP Markers

1
Jiangxi Super Rice Research and Development Center, Nanchang Branch of Chinese National Center for Rice Improvement, Nanchang 330200, China
2
Shanghai Agrobiological Gene Center, Shanghai 201106, China
*
Author to whom correspondence should be addressed.
These authors contributed equally to this work.
Agronomy 2022, 12(12), 3056; https://doi.org/10.3390/agronomy12123056
Submission received: 1 November 2022 / Revised: 26 November 2022 / Accepted: 30 November 2022 / Published: 2 December 2022
(This article belongs to the Special Issue Discovery and Utilization of Germplasm Resources in Rice)

Abstract

:
Dongxiang wild rice (DXWR) is one of the most valuable germplasm resources of rice. It is important to conserve the genetic diversity and uncover the population differentiation of DXWR. In this study, we analyzed the genetic diversity and population differentiation of DXWR based on whole-genome resequencing of 220 DXWR lines collected from nine natural populations in an ex situ conservation nursery. Almost half of the SNPs and Indels detected in these DXWR lines were absent in cultivated rice or other common wild rice, indicating the potential and importance of DXWR in rice breeding. Based on Structure and PCA analysis, these DXWR lines could be divided into two subpopulations, in which subpopulation G1 had more specific SNPs and Indels and was genetically more genetically diverse than subpopulation G2. The average Fst of regions with low relative genetic diversity between G1 and G2 were significantly lower than whole-genomic Fst, indicating directional selection in these regions. Some functional genes and QTLs were found to locate in highly differentiated regions between G1 and G2. Moreover, the deep root ratios of G2 were significantly higher than G1. Our results would be helpful to the conservation and utilization of DXWR germplasm.

1. Introduction

Genetic diversity is the material basis for breeding and gene function research, which is of great significance for variety improvement, yield, quality, and resistance improvement [1]. The genetic diversity of cultivated rice is extremely low because many genes or allelic variations in wild rice are lost during the evolutionary process owing to the genetic bottleneck effect and long-term directional selection of humans in the domestication process. On the contrary, wild rice displays extremely abundant genetic diversity, as it has adapted to various natural disasters and unfavorable environments [2]. Hence, the evaluation of genetic diversity, identification of favorable traits, and exploration of favorable genes of wild rice can not only offer a scientific basis for the conservation and utilization of wild rice germplasm resources but can also provide gene resources for the genetic improvement of cultivated rice.
DXWR is a common wild rice belonging to the AA genome group with the highest latitude distribution both in China and worldwide. Evaluating and conserving the genetic diversity of DXWR is necessary for exploring and utilizing favorable gene resources. Owing to its unique geographical location and ability to survive in dry environments, DXWR has developed roots with strong drought resistance [3]. Due to the rapid development of the economy and the destruction of the ecological environment, DXWR is facing the threat of sharp reduction or even extinction. The number of in situ nurseries has decreased from nine populations at the time of discovery to three, and one population is in an endangered state [4]. Since the establishment of ex situ conservation nurseries, due to repeated sampling and self-reproduction of seed falling, the genetic diversity of the conservation population in ex situ conservation nurseries has declined sharply, which is only 71.1% of that in situ conservation nurseries [5]. Further analysis of the genetic diversity of DXWR by resequencing can not only provide an important basis for its protection and research strategies but also provide a basis for mining drought resistance genes of DXWR by analyzing its unique variation types.
In this study, we analyzed the genetic diversity of DXWR based on whole-genome resequencing using 220 lines collected from an ex situ conservation nursery of DXWR, and proposed conservation and utilization strategies for DXWR. Drought avoidance of DXWR was investigated from the perspective of population differentiation by analyzing candidate genes in differential regions specifying the deep root trait, which could lay the foundation for exploring drought avoidance candidate genes in DXWR.

2. Materials and Methods

2.1. Plant Material

A total of 220 lines were used in 9 populations from the ex situ conservation nursery (Nanchang) of DXWR, including 22, 29, 20, 27, 21, 33, 23, 15, and 27 lines in the populations of Anjiashan, Zhangtang, Dongtangshang, Shuitaoshu, Kanxialong, Dongtang, Linchang, Dongtangxice, and Dongtangxia, respectively (Table S1).

2.2. Investigation of Root Characteristics

The deep rooting traits were evaluated using the basket method with minor modifications [6]. Briefly, three traits, including number of deep roots (DR, roots emerging outside from the bottom), number of shallow roots (SR, roots emerging outside from the side), and number of total roots were counted. Then, the ratio of deep roots (RDR), which is an index of rice drought avoidance, was calculated as: DR/TR. These traits were measured from the DXWR accessions 50 days after transplanting with six replications for each accession.

2.3. Genome Resequencing, SNP, and InDel Calling

The whole-genome resequencing (DNA sample detection, library preparation, library quality control, and computer sequencing) was performed on the 220 DXWR lines. In brief, DNA was extracted from the rice leaves using the CTAB method [7]. The library was prepared strictly according to the protocol given in the NEBNext® Ultra™ II FS DNA Library Prep Kit for Illumina®, with the following main experimental steps:
(1)
The genomic DNA was fragmented using Ultra II FS enzyme mixed solution and repaired at the end, and an A tail was added to it.
(2)
The processed products were connected to specific sequencing joints.
(3)
AMPure XP beads in specific proportions were selected for target fragment selection in accordance with the expected library size, and purification was performed to remove joint contamination.
(4)
With polymerase chain reaction (PCR) enrichment, purification was performed using AMPure XP beads to prepare the sequencing library.
After the library preparation, the quality was determined as follows, after which computer sequencing was started if the detection result satisfied the requirements:
(1)
Preliminary quantification was performed using Qubit 3.0.
(2)
The insert size of the library was detected using Agilent 2100, and the next step of the experiment began only when the insert size met the expectation, and joint contamination was not found.
(3)
The effective concentration of the library was accurately quantified using a German ANALYTIKJENA QTOWER real-time fluorescent quantitative PCR analyzer, and the library was qualified when the effective concentration was >2 nM.
Paired-end 150 bp (PE150) sequencing was implemented on the Illumina HiSeq platform, and the sequencing service was provided by GENOSEQ. The raw sequence obtained may contain linker sequences or low-quality bases. To ensure data quality, raw reads were filtered to obtain clean reads, and subsequent analyses were based on clean reads. The data filtering steps were as follows:
(1)
The Cutadapt software (version 1.13) [8] was used to remove adapter sequences from the reads.
(2)
The Trimmomatic software (version 0.36) [9] was used to remove low-quality nucleobases in reads (the average quantity was calculated with a 4 bp sliding window, and all the following nucleobases were removed if they were lower than 15).
(3)
The length of the reads should be greater than 50 bp.
The MEM algorithm of the BWA software (version 0.7.15-r1140) [10] was used to align the sequencing data with the reference genome (only paired-end (PE) reads with both ends matched could be identified as being aligned to the genomes). The rice reference genome used for alignment was the Nipponbare MSU7.0 (http://rice.plantbiology.msu.edu/, accessed on 31 October 2011). We obtained the alignment results in SAM format and then used Samtools software (version 1.3.1) [11] to convert them into BAM format. Subsequently, the reads in BAM format were sorted using SortSam in Picard tools (version 1.91) [12], and rmdup in Samtools was used to remove PCR repetitions. Finally, the resulting BAM format files can be adopted for the statistics of coverage and coverage depth, as well as for variant calling.
Based on the BAM format file acquired from the above-mentioned alignment analysis, a genome variant call format (GVCF) file was generated for each sample through the HaplotypeCaller modules in the Genome Analysis Toolkit (GATK) (version 3.7) [12], and GenotypeGVCF modules were utilized to carry out variation detection on all samples, including SNPs and Indels. The variation information output from GATK was stored in a variant call format (VCF) file, which included variations between all samples and reference genomes. The focus of this experiment was the variations between the samples. Therefore, the original variation results were screened according to the following conditions:
(1)
The sequencing depth of samples should not be less than 3.
(2)
The missing genotype proportions of all samples should not exceed 50%.
(3)
A relatively low allele frequency should not be less than 5%.
(4)
The hybridization percentage should not exceed 55%.

2.4. Analysis of Population Structure

Variation annotation was performed on the variation sites obtained from resequencing, and the influence of variations on gene functions was predicted using ANNOVAR software (version 2016Feb1). Population structure analysis was performed, and the K and ΔK values were calculated using the software Structure (version 2.3.4) [13]. The ΔK value was determined to be the maximum when K = 2. Principal component analysis (PCA) was performed, and a scatter diagram was created using PLINK software (version v1.90p) [14]. A phylogenetic tree was constructed by molecular evolutionary genetics analysis (MEGA) 7 (version 7.0) [15] software and visualization using the software ggtree (version 1.7.10) [16]. The software VCFtools (version 0.1.17) [17] was used to calculate the degree of linkage disequilibrium (LD) r² values between every two sites and to paint the LD decay trend diagram. The software VCFtools was also used to calculate FST values between subpopulations, with sliding windows set to 100 kb and step length to 10 kb. The average FST value of the whole genome was used to measure the degree of differentiation between subpopulations, and the FST values of all windows were ranked from largest to smallest, with the top 1% of windows as the candidate regions for selection. The genetic differentiation between G1 and G2 may have been caused by the divergent selection imposed on the two subpopulations, which can be reflected by the relative genetic diversity. The relative genetic diversity was calculated as: πG1/πG2. If a region with significantly higher/lower relative genetic diversity indicates directional selection imposed on G2/G1, directional selection can lead to a reduction in genetic diversity. We analyzed the relationship between the relative genetic diversity and the genetic differentiation (Fst) between the two subpopulations. First, we calculated the average relative genetic diversity of the highly differentiated regions (regions with the top 5% FST values) and compared them with the genomic average. If the highly differentiated region has a higher or lower relative genetic diversity, the directional selection on G2/G1 drives their differentiation. Second, we calculated the average Fst value from regions with the top 5% or bottom 5% relative genetic diversity and compared it with the genomic average. If the regions with the top 5% or bottom 5% relative genetic diversity had significantly higher FST than the genomic average, it means that the directional selection of G2 or G1 contributes to their genetic divergence.

3. Results

3.1. Genetic Diversity of DXWR

A total of 4.94 × 10⁹ clean reads were obtained from 220 samples of DXWR rice by resequencing, containing 1.44 × 10¹² nucleobases, with an average of 2.22 × 10⁷ clean reads and 6.45 × 10⁹ nucleobases per sample (Tables S2 and S3). Clean reads from sequencing were compared with the rice reference genomes to detect variations, and 1,676,078 polymorphic sites were acquired, including 1,454,405 SNPs and 221,673 Indels. The average distribution density of SNPs on the 12 chromosomes was 3896.64/Mb, with the highest density (4729.07/Mb) on chromosome 10 and the lowest density (3197.25/Mb) on chromosome 3. The average distribution density of Indels on the 12 chromosomes was 593.91/Mb, with the highest (695.8/Mb) on chromosome 11 and the lowest (524.38/Mb) on chromosome 8 (Table 1). The density of the variations on the same chromosome also showed an obvious difference (Figure 1).
Among the SNPs, 1,031,300 were transition types (A/G and C/T), accounting for 70.9%, and 423,105 were transversion types (A/C, A/T, C/G, and G/T), accounting for 29.1%. The transition–transversion ratio (Ts/Tv) was 2.4%.
The sites of variation were annotated based on the gene position information of the reference genomes. The results showed that there were 571,390 SNPs in the intergenic regions, accounting for 39.29% of all SNPs. A total of 480,305 SNPs were found in the genic regions, accounting for 33.03% of all SNPs. A total of 402,626 SNPs were detected in the upstream and downstream regions, accounting for 27.68% of all SNPs. Specifically, 207,582 SNPs were located within 1 kb upstream of the transcription start site, which accounted for 14.27% of all SNPs; 168,030 SNPs were located within 1 kb downstream region of the transcription termination site, which accounted for 11.55% of all SNPs; and 27,014 SNPs were located in the upstream and downstream regions of two adjacent genes, accounting for 1.86% of all SNPs. Among the SNPs in the genic regions, 227,355 were in the intronic regions, and 208,061 were in the exonic regions, accounting for 15.63% and 14.31% of all SNPs, respectively. Among the SNPs in the exonic regions, there were 81,048 synonymous mutation SNPs, and 121,427 were nonsynonymous mutation SNPs, which accounted for 5.57% and 8.35% of all SNPs, respectively. A total of 15,372 SNPs were located in the 5’ untranslated region (UTR), 28,205 in the 3’UTR, and 1312 in the variable transcript (Table 2).
The Indel annotation information revealed that 90,930 (41.03%) Indels were in the intergenic regions, 68,207 (30.77%) Indels were in the upstream and downstream regions, and 62,508 (28.20%) Indels were in the genic regions. Specifically, 37,967 (17.13%) Indels were located in the intronic regions, and 12,423 (5.06%) Indels were located in the exonic regions. There were 5067 and 6887 Indels in the 5’UTR and 3’UTR regions, respectively, and 164 Indels were in the selective shearing regions.
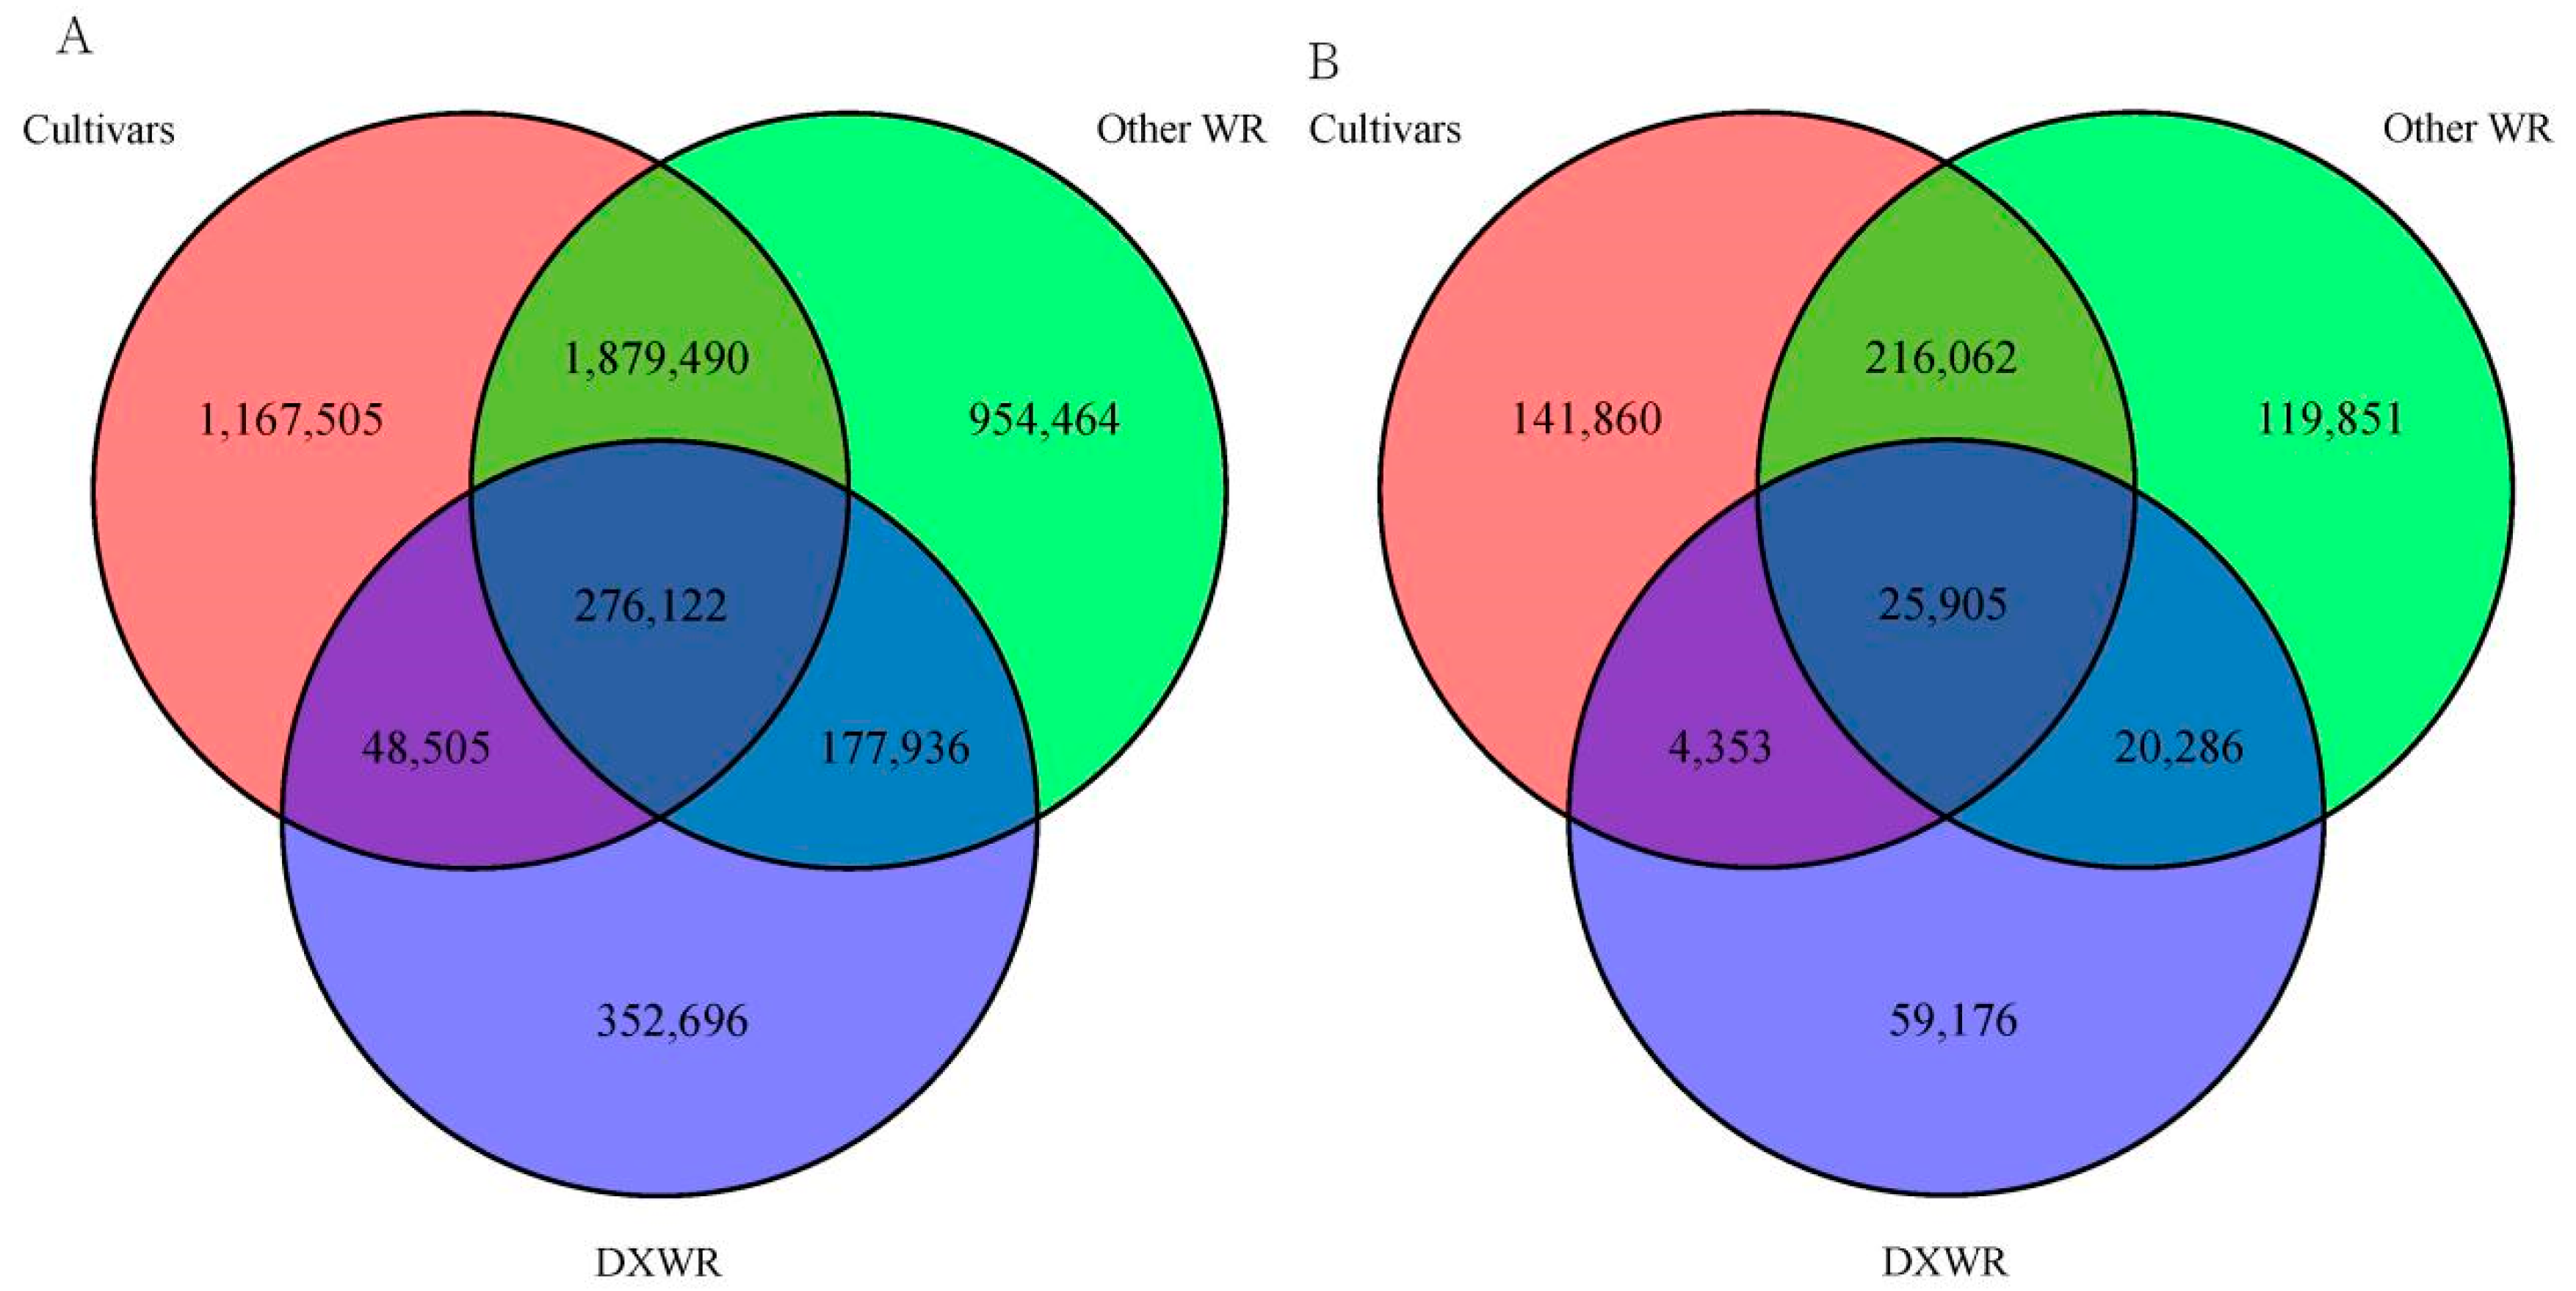
The genetic variation of the 220 DXWR lines, 468 cultivated rice, and 44 other common wild rice lines was compared (Table S4). A total of 352,696 SNPs and 59,176 Indels were identified to be specific in DXWR, accounting for 41.2% and 53.9% of all the SNPs and Indels, respectively (Figure 2). DXWR had a high proportion of specific SNPs and Indels variation, suggesting that DXWR has unique genetic resources that have been lost during rice landrace domestication and have not yet been utilized in modern cultivars.

3.2. Population Structure of DXWR

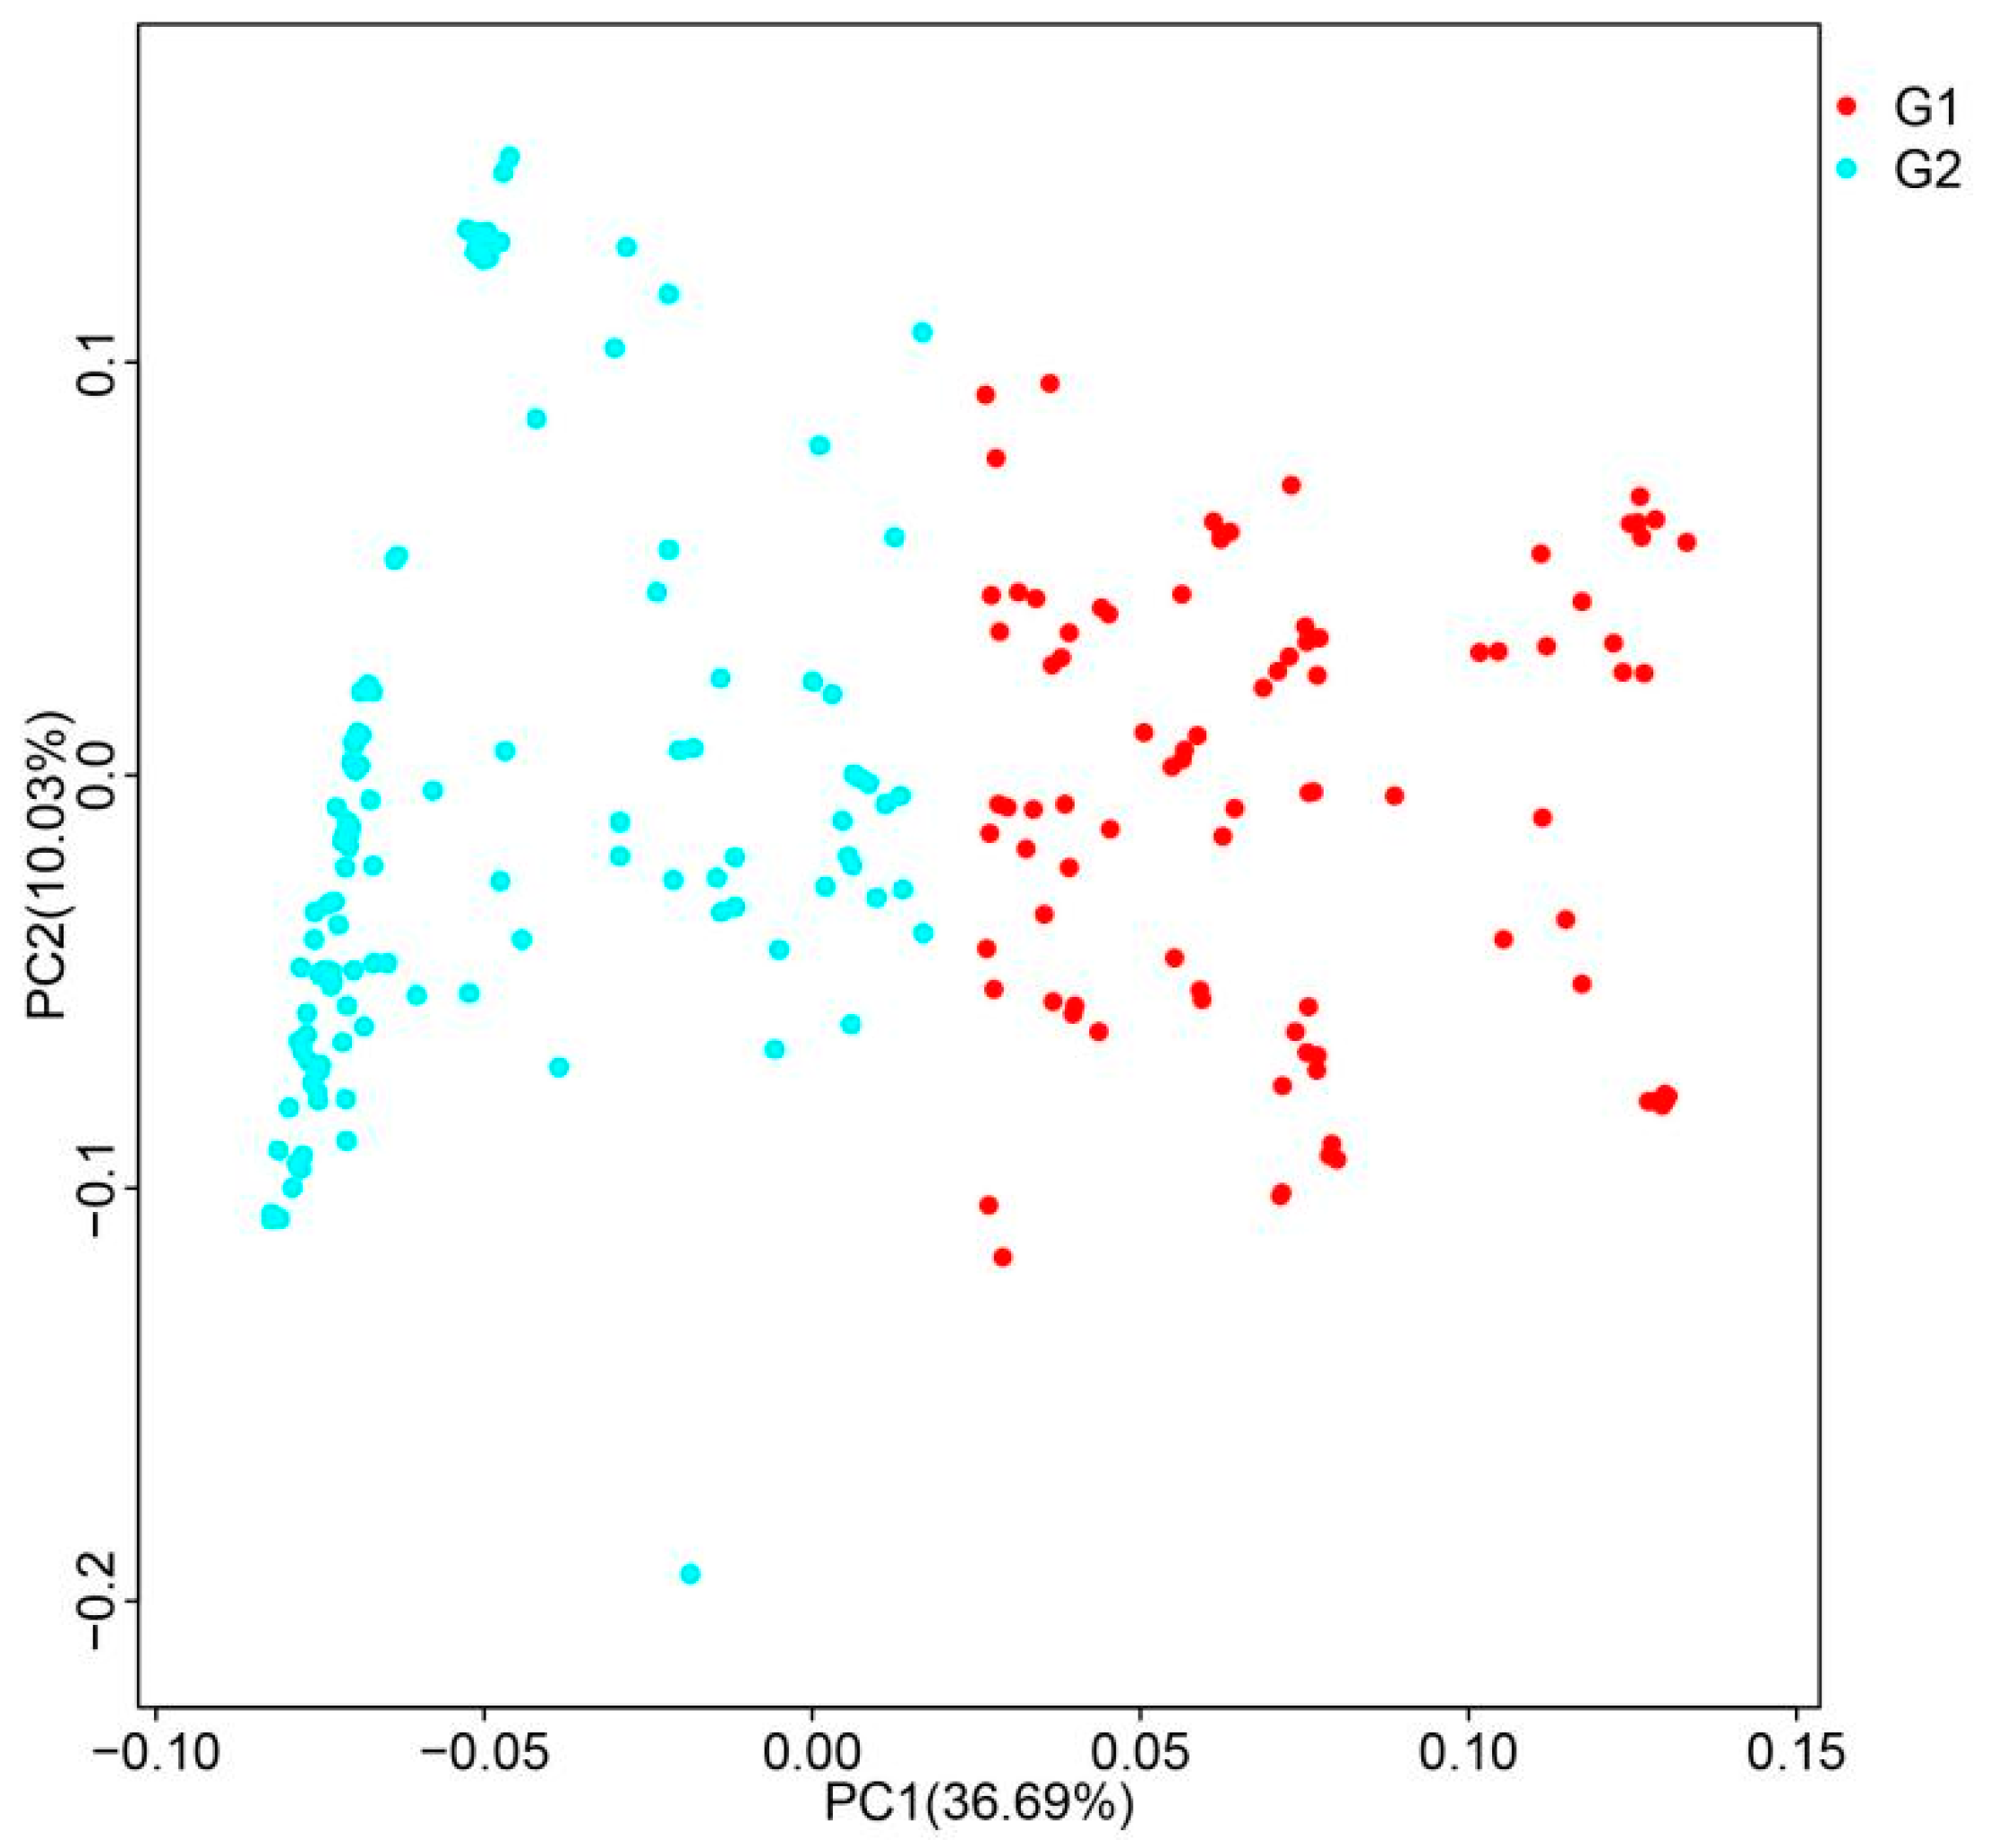
Multiple methods were used to analyze the population structure in terms of population resequencing gene information to clarify the population structure of DXWR in ex situ conservation. A total of 1,676,078 variation sites, obtained by resequencing the DXWR populations, were subjected to PCA. The PCA scatter plot showed that the populations used in this study could be divided into two subpopulations, G1 and G2 (Figure 3). The first eigenvector (PC1) explained 36.69% of the genetic variation, and the second eigenvector (PC2) explained 10.03%.
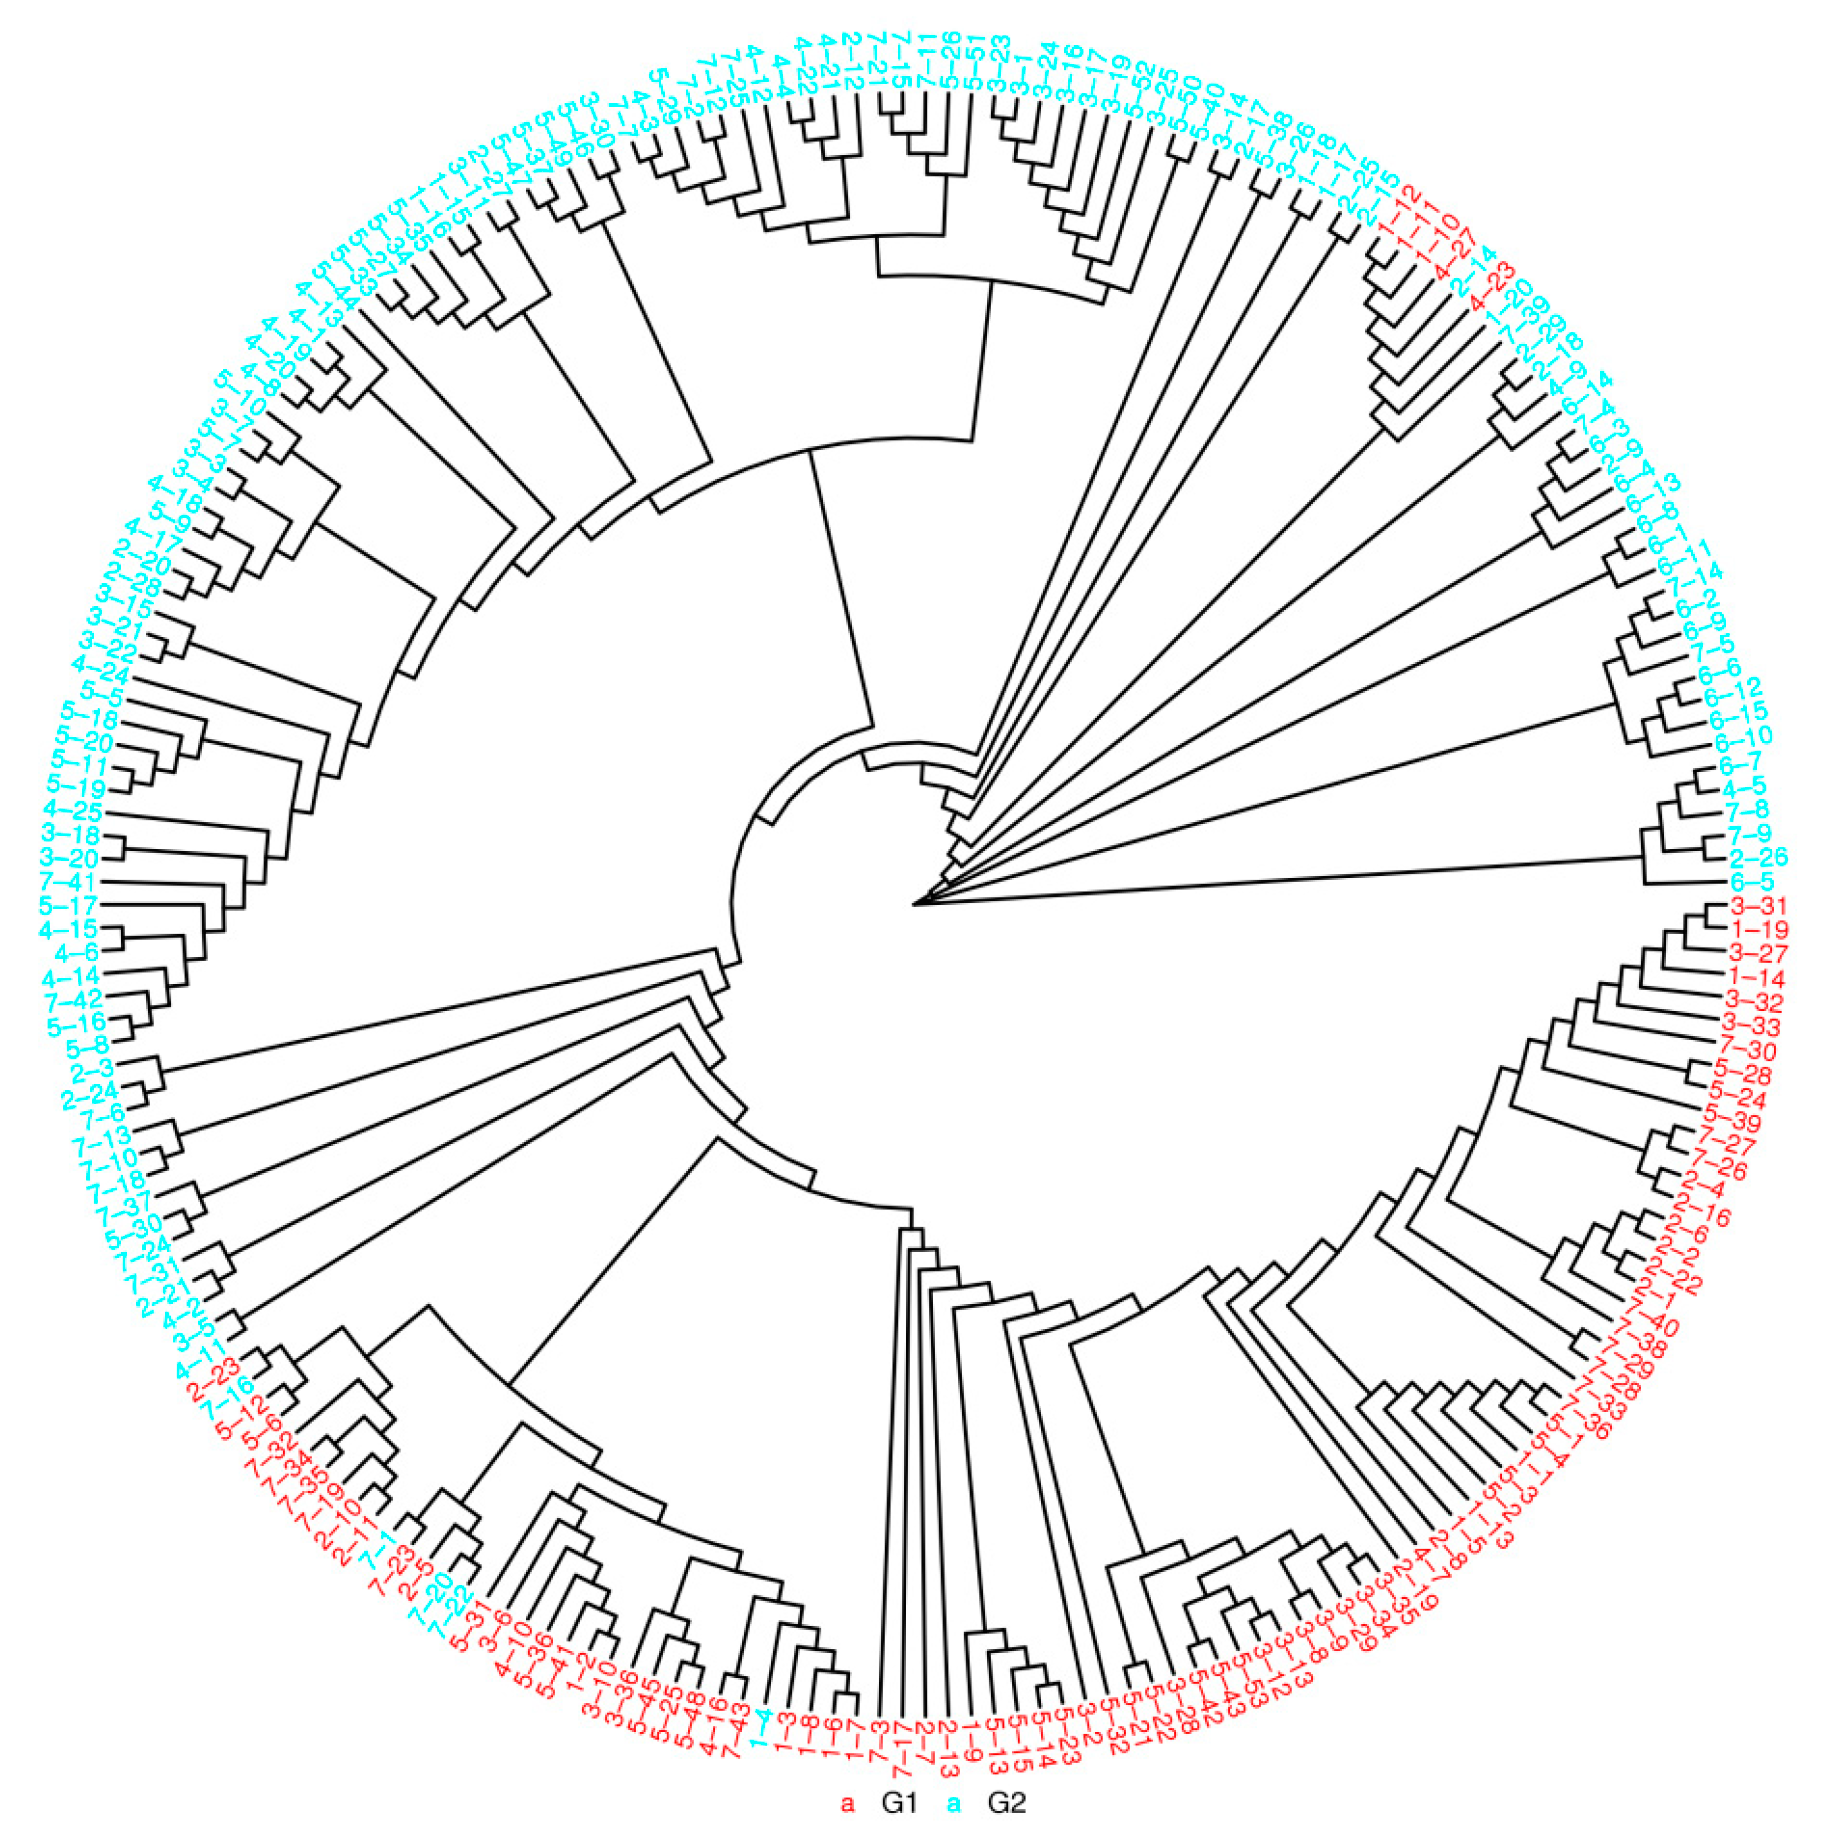
The genetic distance between the two wild rice subpopulations was calculated, and a cluster analysis was performed. The results (Figure 4) revealed that 220 lines were mainly divided into two branches. According to population system phylogenetic analysis, 89 lines in the G1 subpopulation were clustered into one group and 131 lines in the G2 subpopulation were clustered into another group. The population system phylogenetic analysis displayed a result similar to that of the PCA; the 220 lines were divided into two branches. The groups were very similar, except for several members.
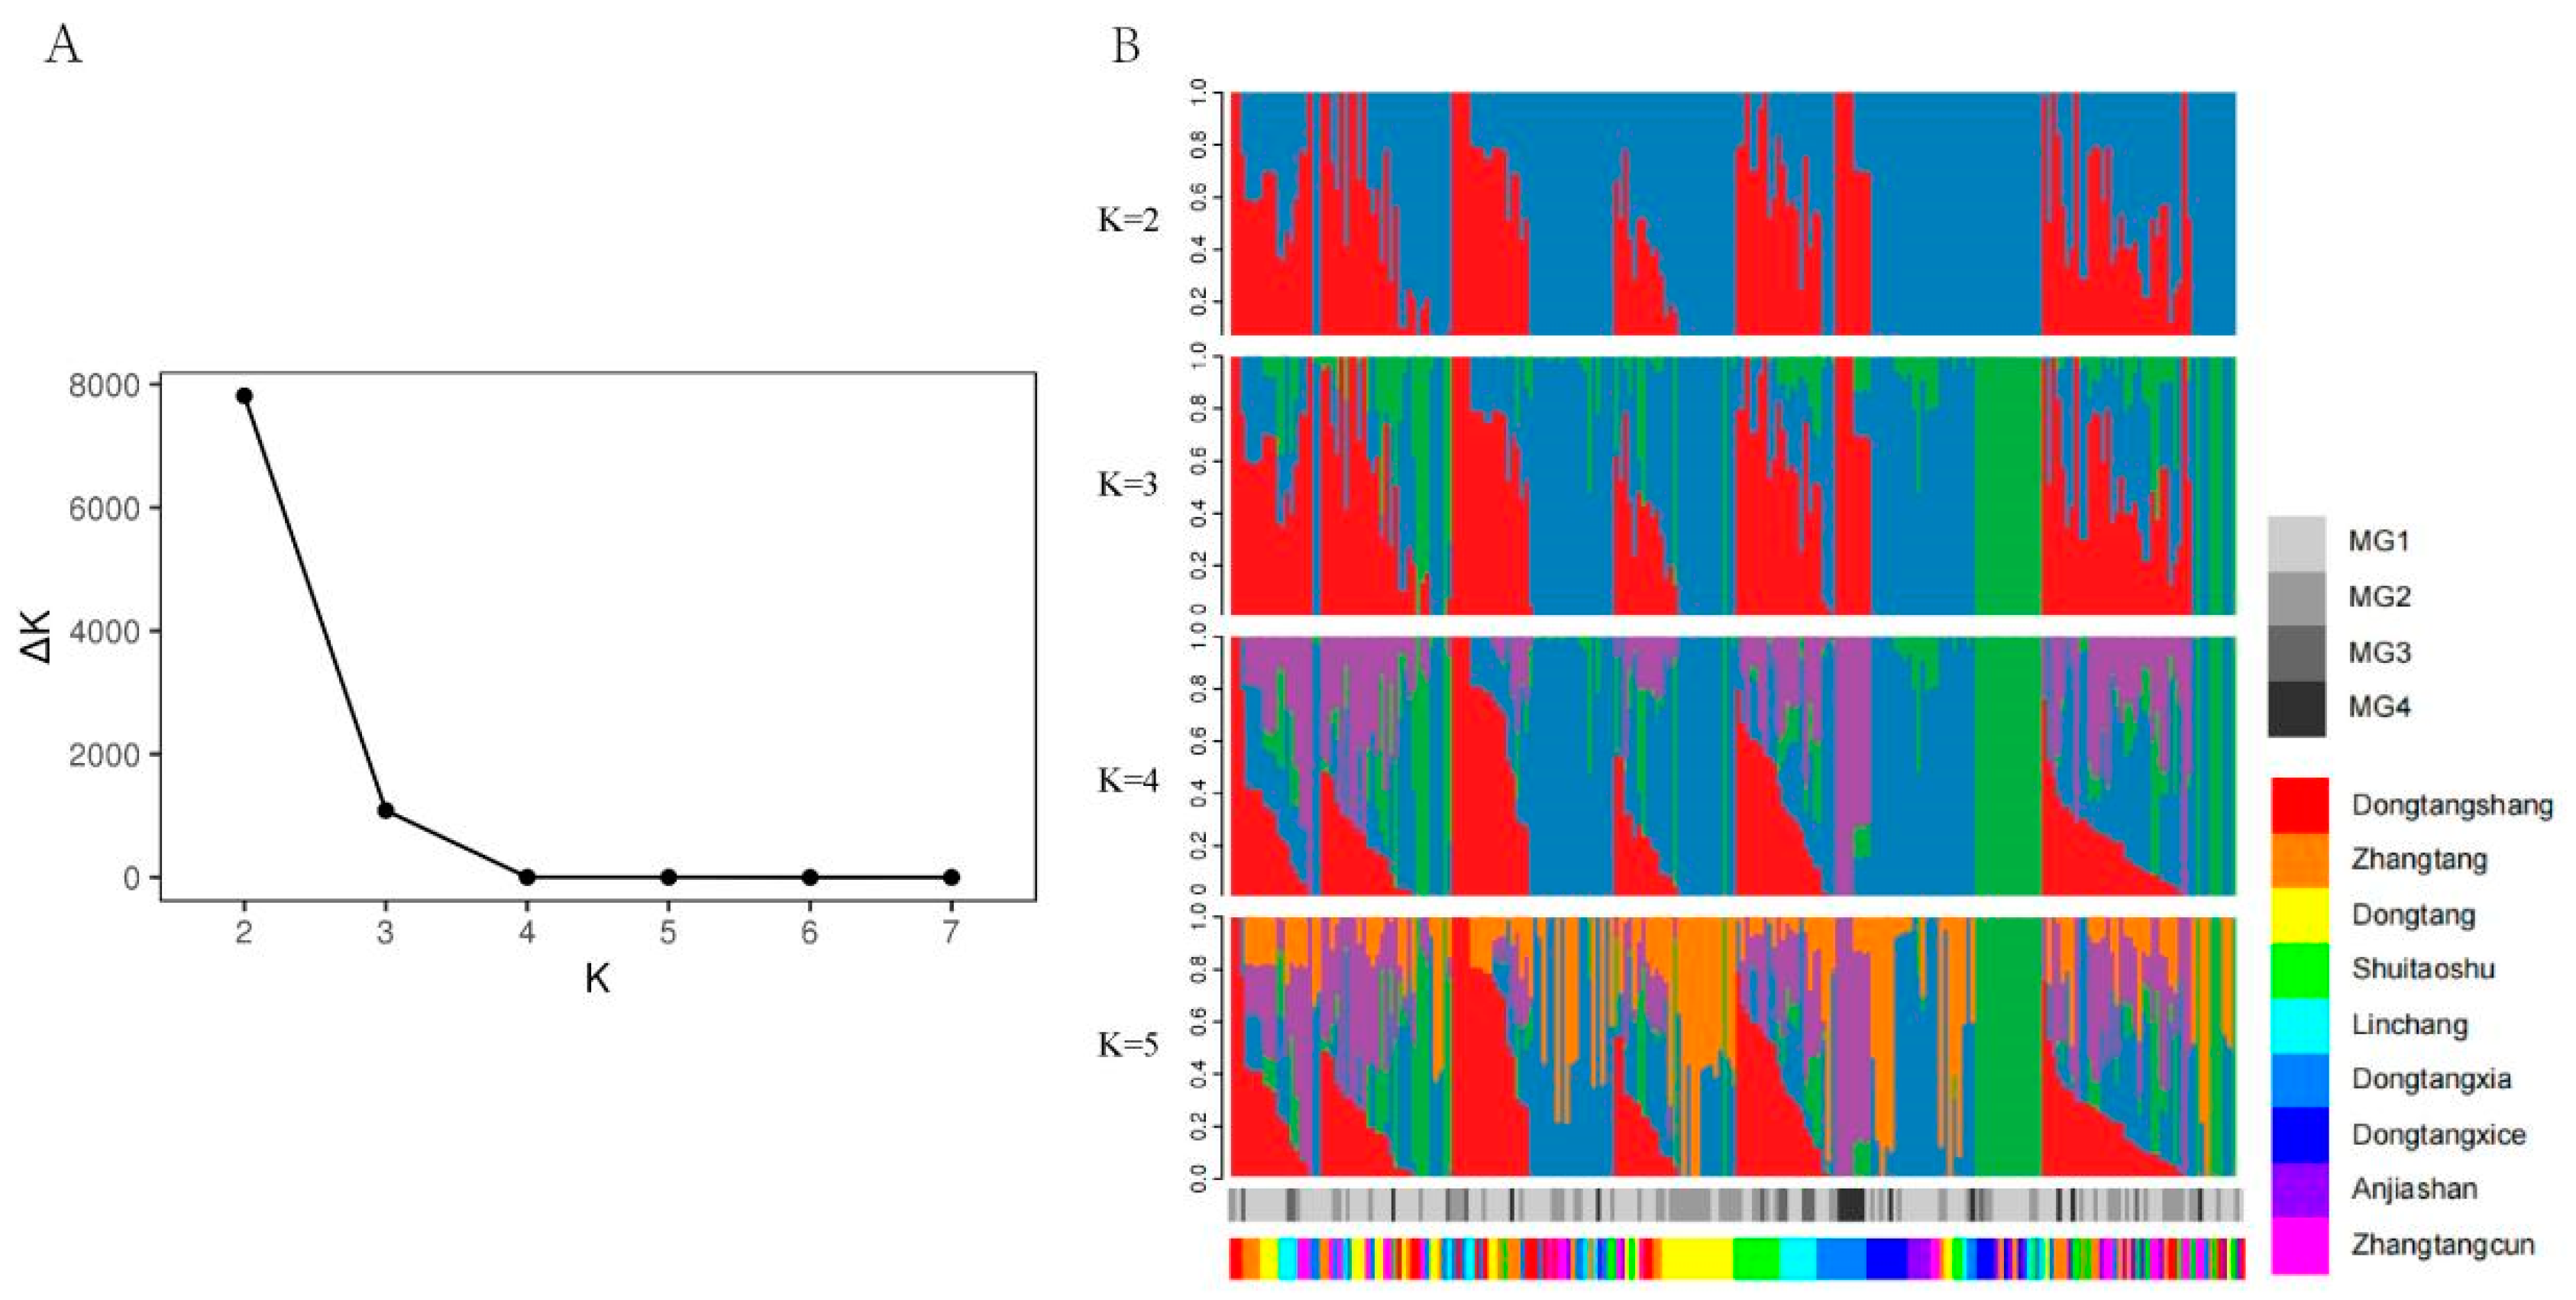
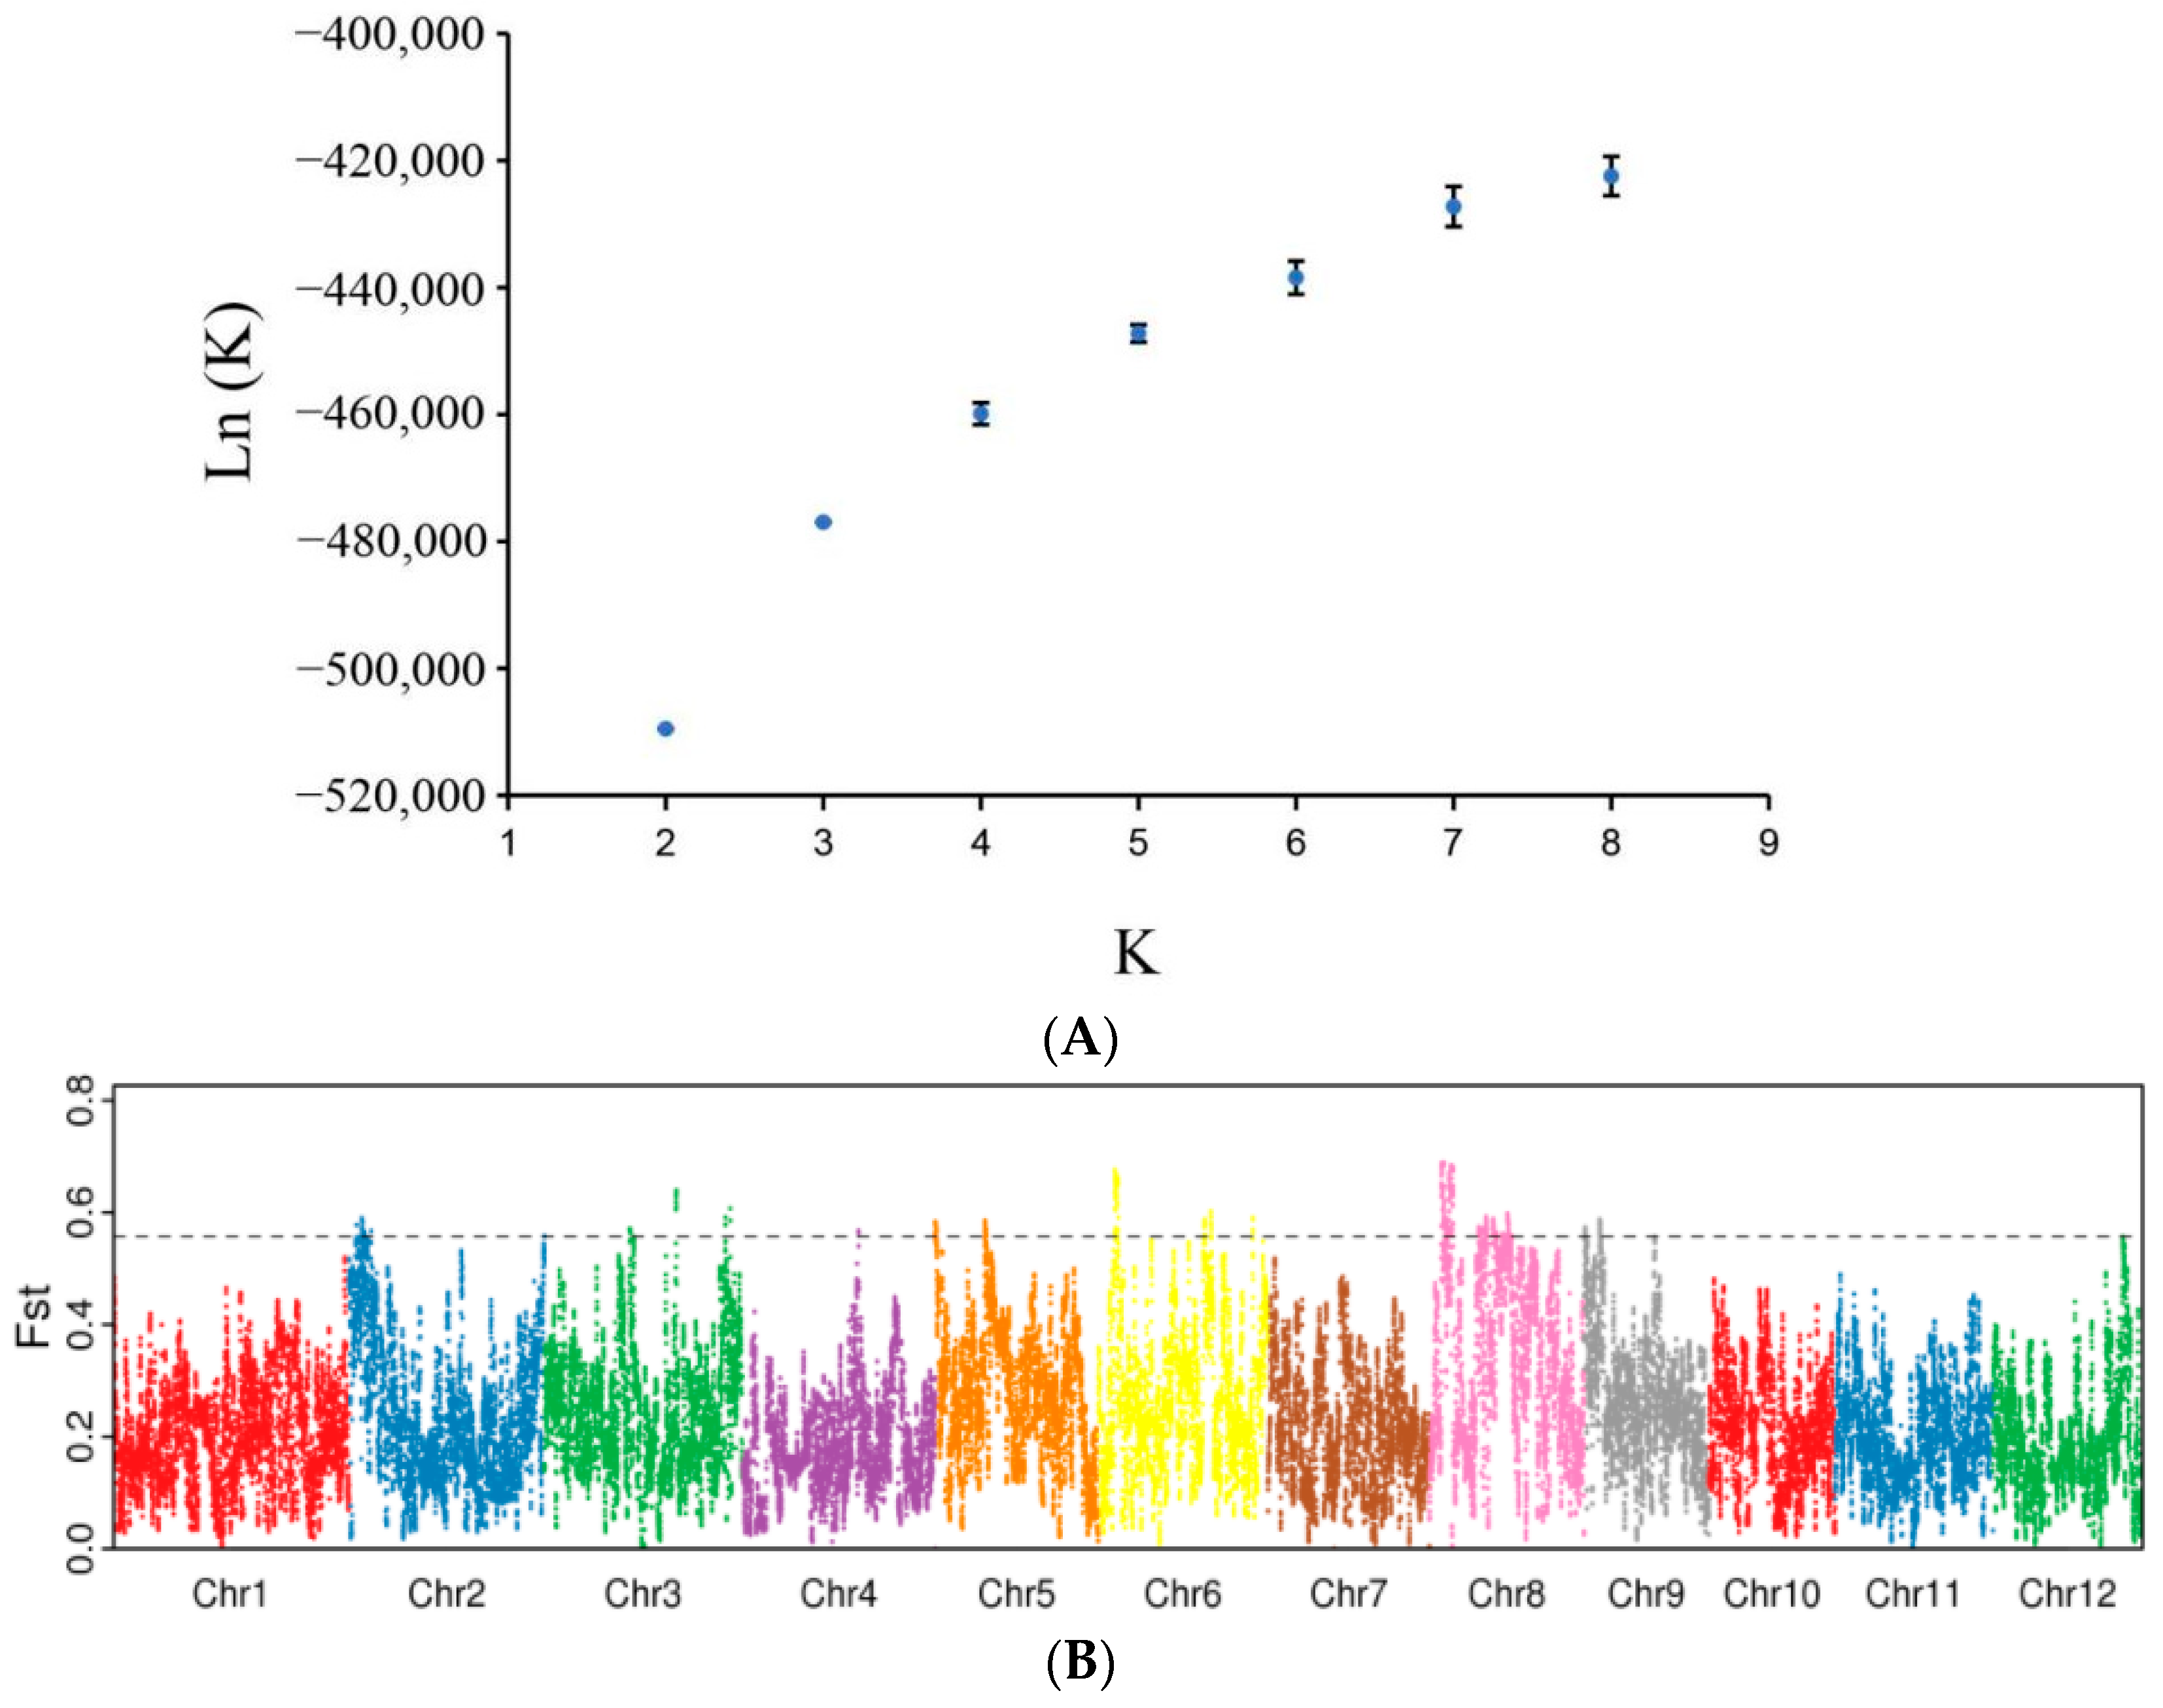
Subsequently, the population structure of 220 DXWR lines was analyzed using the Structure software. The variation trend diagram of the ΔK value of the population structure analysis showed that when K = 2, the corresponding ΔK value was at its maximum (Figure 5A). Therefore, the optimal subpopulation number of the populations in this study was 2, which was consistent with the PCA results. Thus, it was appropriate to divide the 220 DXWR lines into two subpopulations. Some individuals in the two subpopulations exhibited significant genetic confounding in their components (Figure 5B), which might have been caused by gene flow.
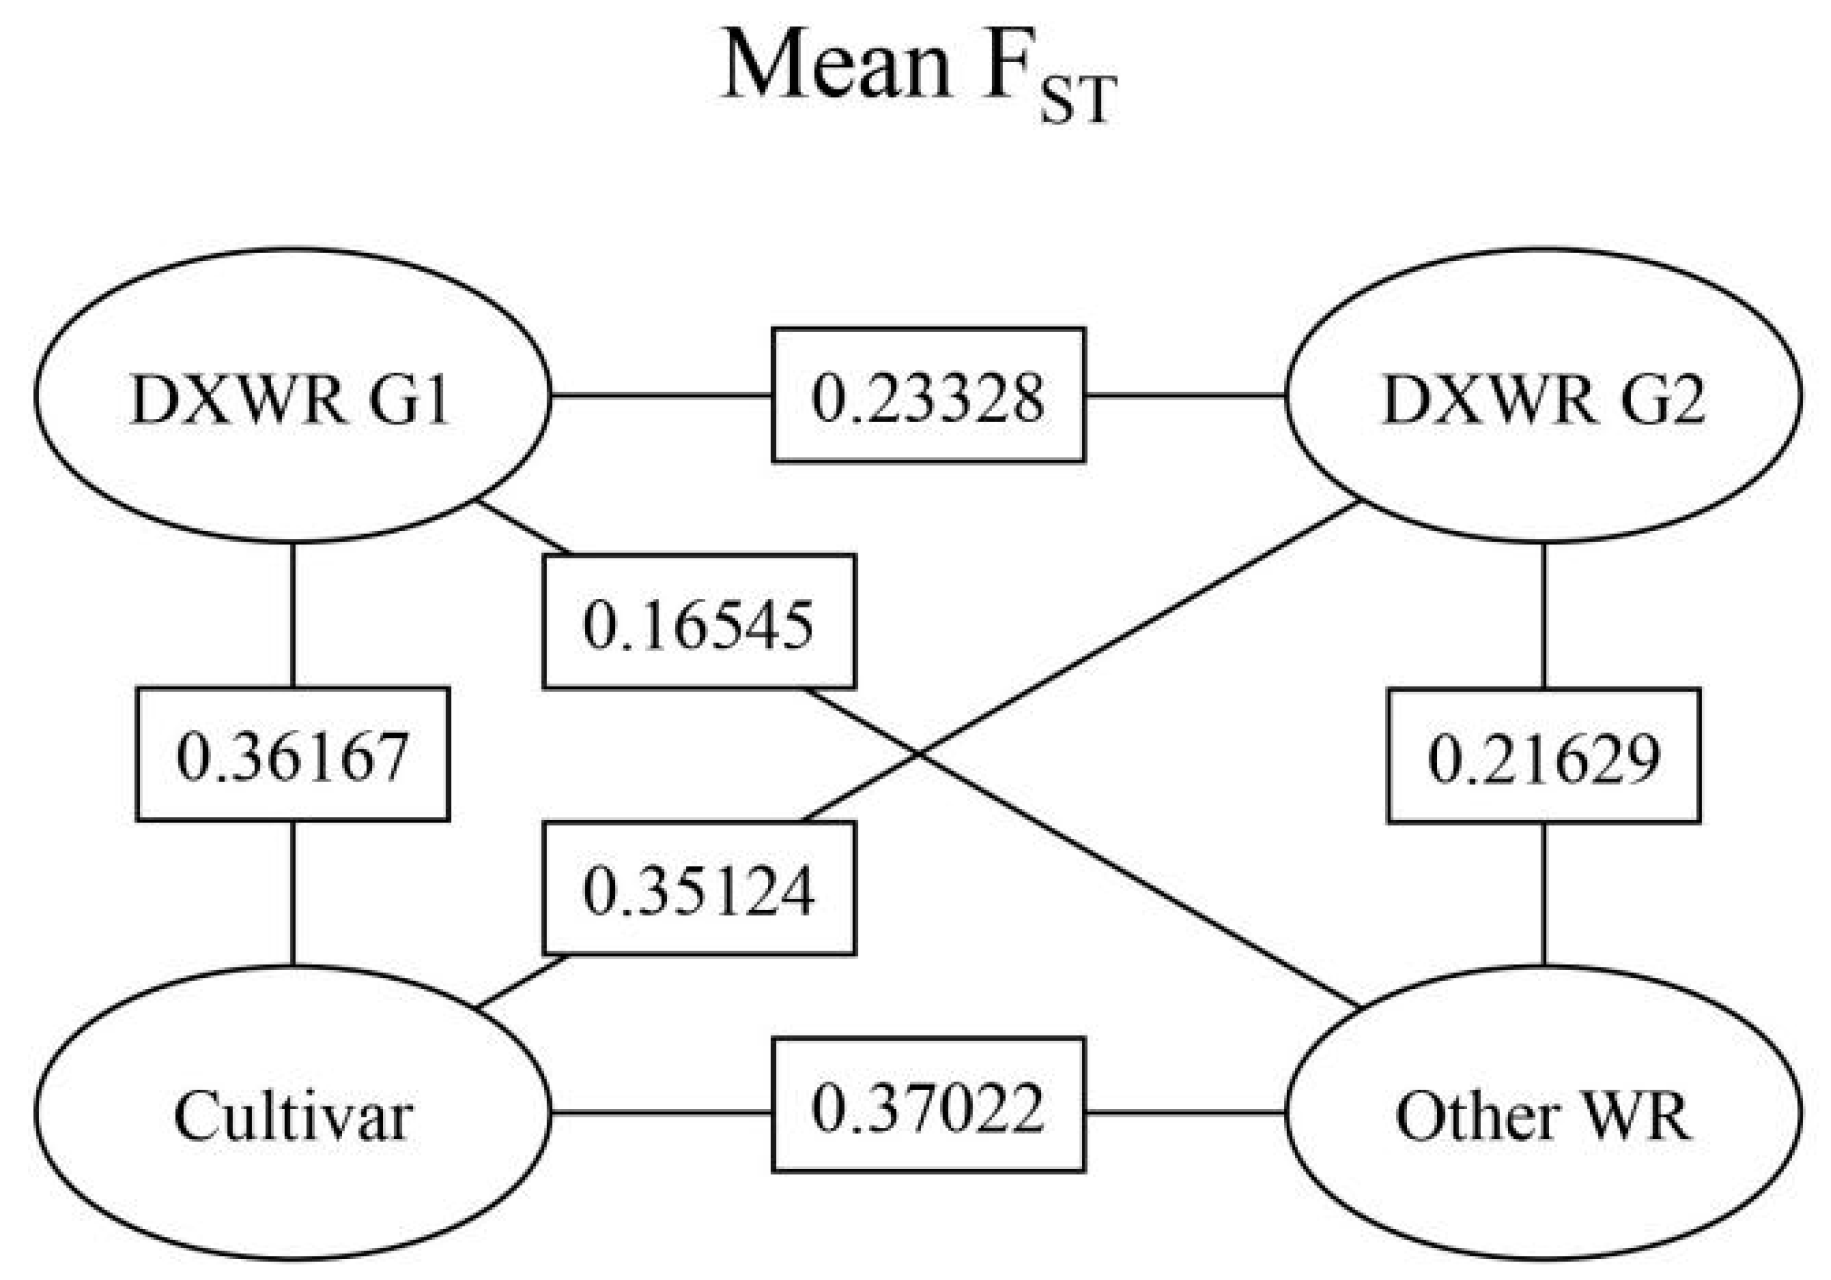
The FST values between the two subpopulations, cultivated rice, and other common wild rice populations were calculated (Figure 6). The mean FST value between the two subpopulations was 0.233, that between the G1 subpopulation and cultivated rice was 0.362, and that between the G2 subpopulation and cultivated rice was 0.351. The FST value between the G1 subpopulation and other common wild rice was 0.165 and that between the G2 subpopulation and other common wild rice was 0.216. This indicated that the degree of differentiation between G1 and G2 in DXWR was closer to that of other common wild rice.
According to PCA, phylogenetic tree analysis, and Structure analysis, 220 lines in DXWR ex situ conservation were divided into two subpopulations, inconsistent with nine populations named after the original habitat (Table 3). Among them, 15 lines in the Dongtangxice population belonged to the G2 population, and the other 8 populations were distributed in both subpopulations, in which the Shuitaoshu and Anjiashan populations were mainly in G2, accounting for 81% and 82% of the population, respectively.

3.3. Genetic Differentiation between Two Subpopulations of DXWR

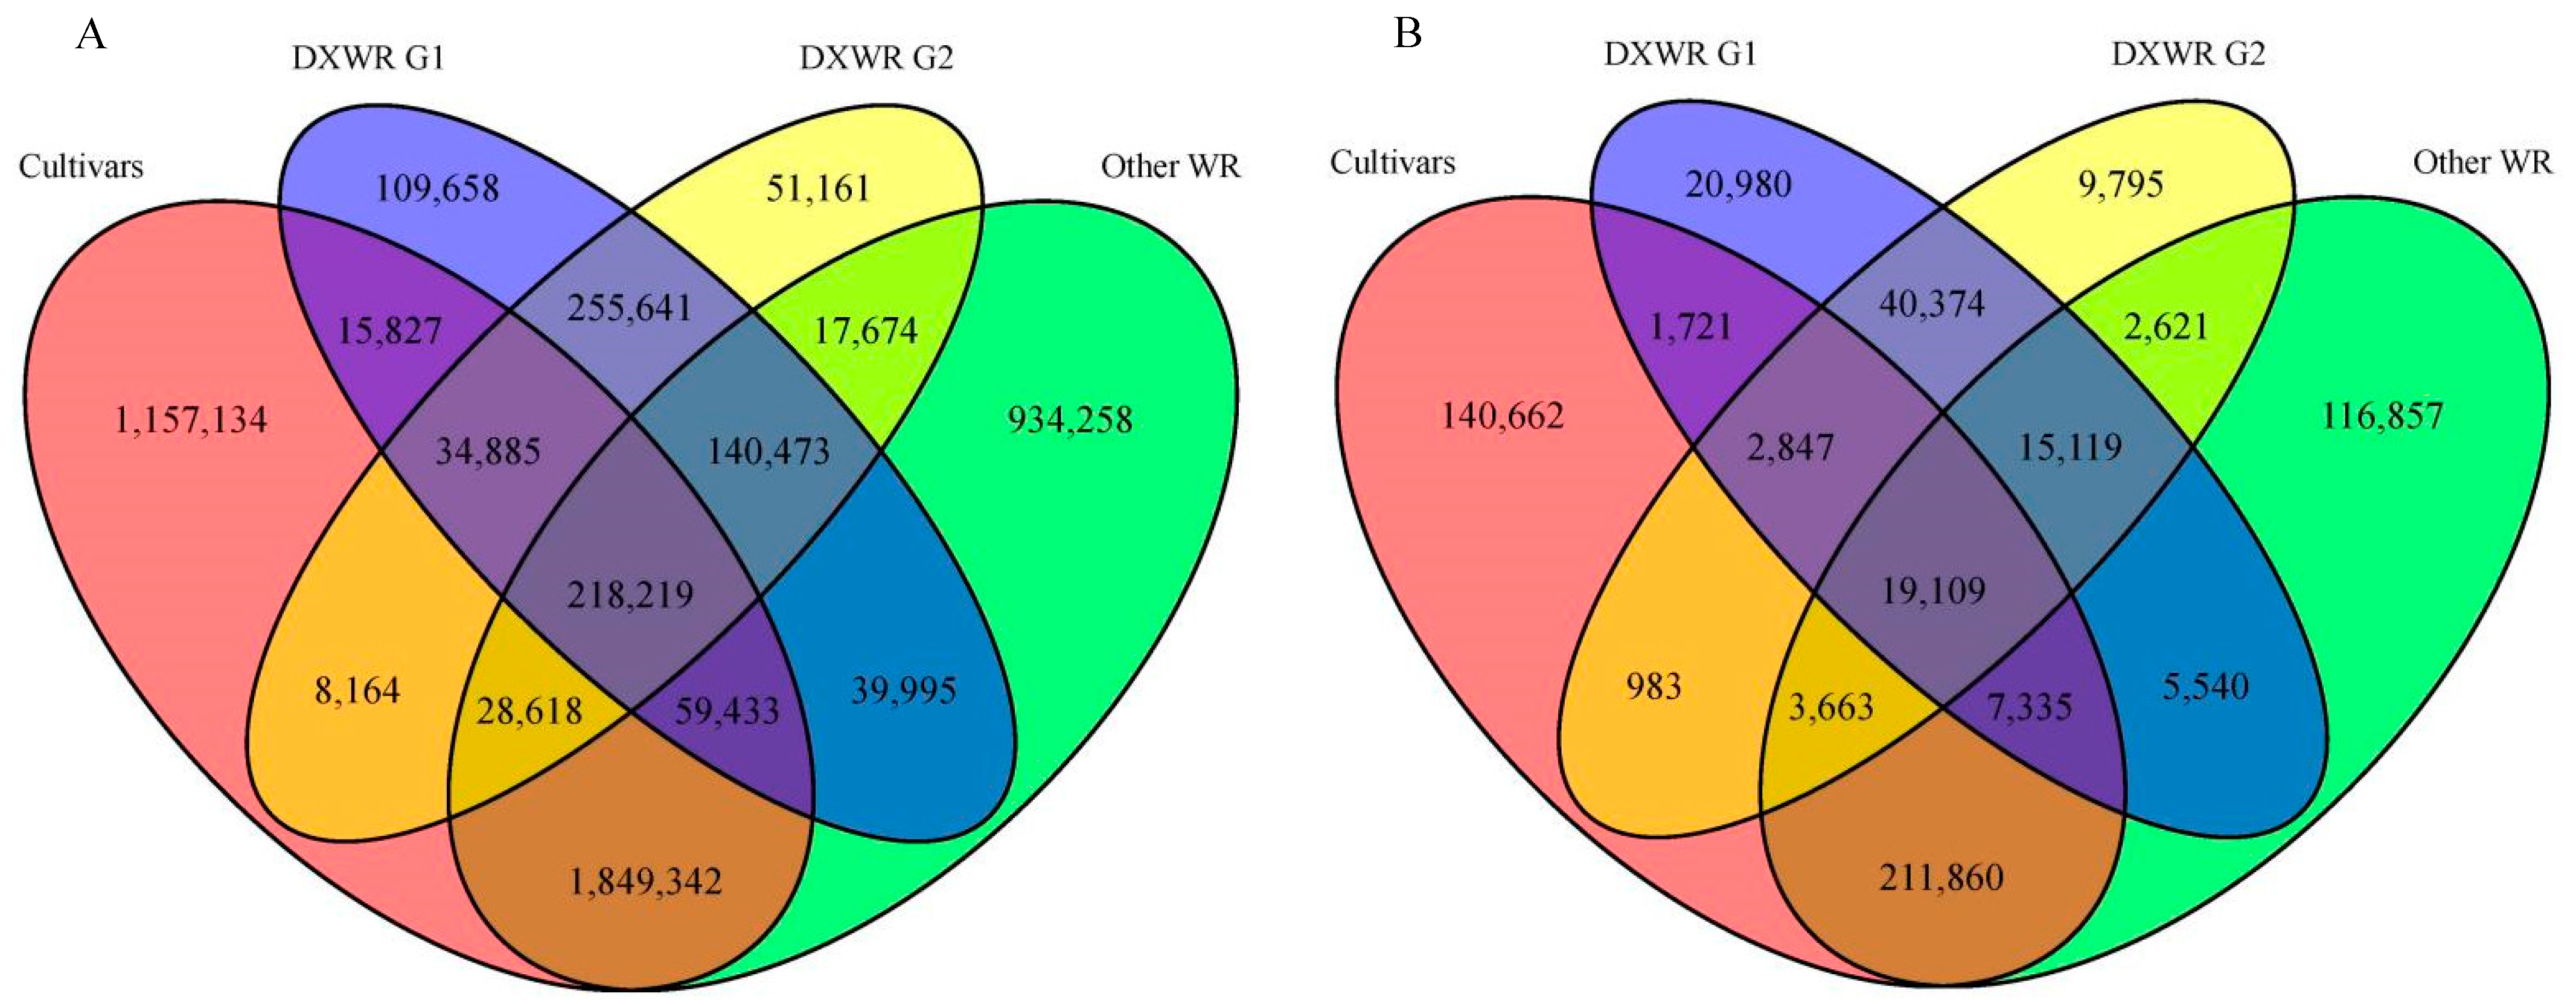
A total of 218,219 SNPs and 19,109 Indels were identified by comparing the polymorphic sites of two subpopulations, cultivated rice and other common wild rice (Figure 7). It was discovered that 109,658 specific SNPs were present in the G1 subpopulation of DXWR rice, accounting for 12.5% of all SNPs in the G1 subpopulation, and 20,980 specific Indels were present in the G1 subpopulation, accounting for 18.6% of all Indels in the G1 subpopulation. There were 51,161 specific SNPs in the G2 subpopulation, accounting for 6.8% of all SNPs in the G2 subpopulation, and 9795 specific Indels in the G2 subpopulation, accounting for 10.4% of all Indels in the G2 subpopulation. The G1 subpopulation had more polymorphic sites than the G2 subpopulation. The specific SNPs and Indels of the two subpopulations can be used as sources of variation in rice breeding.
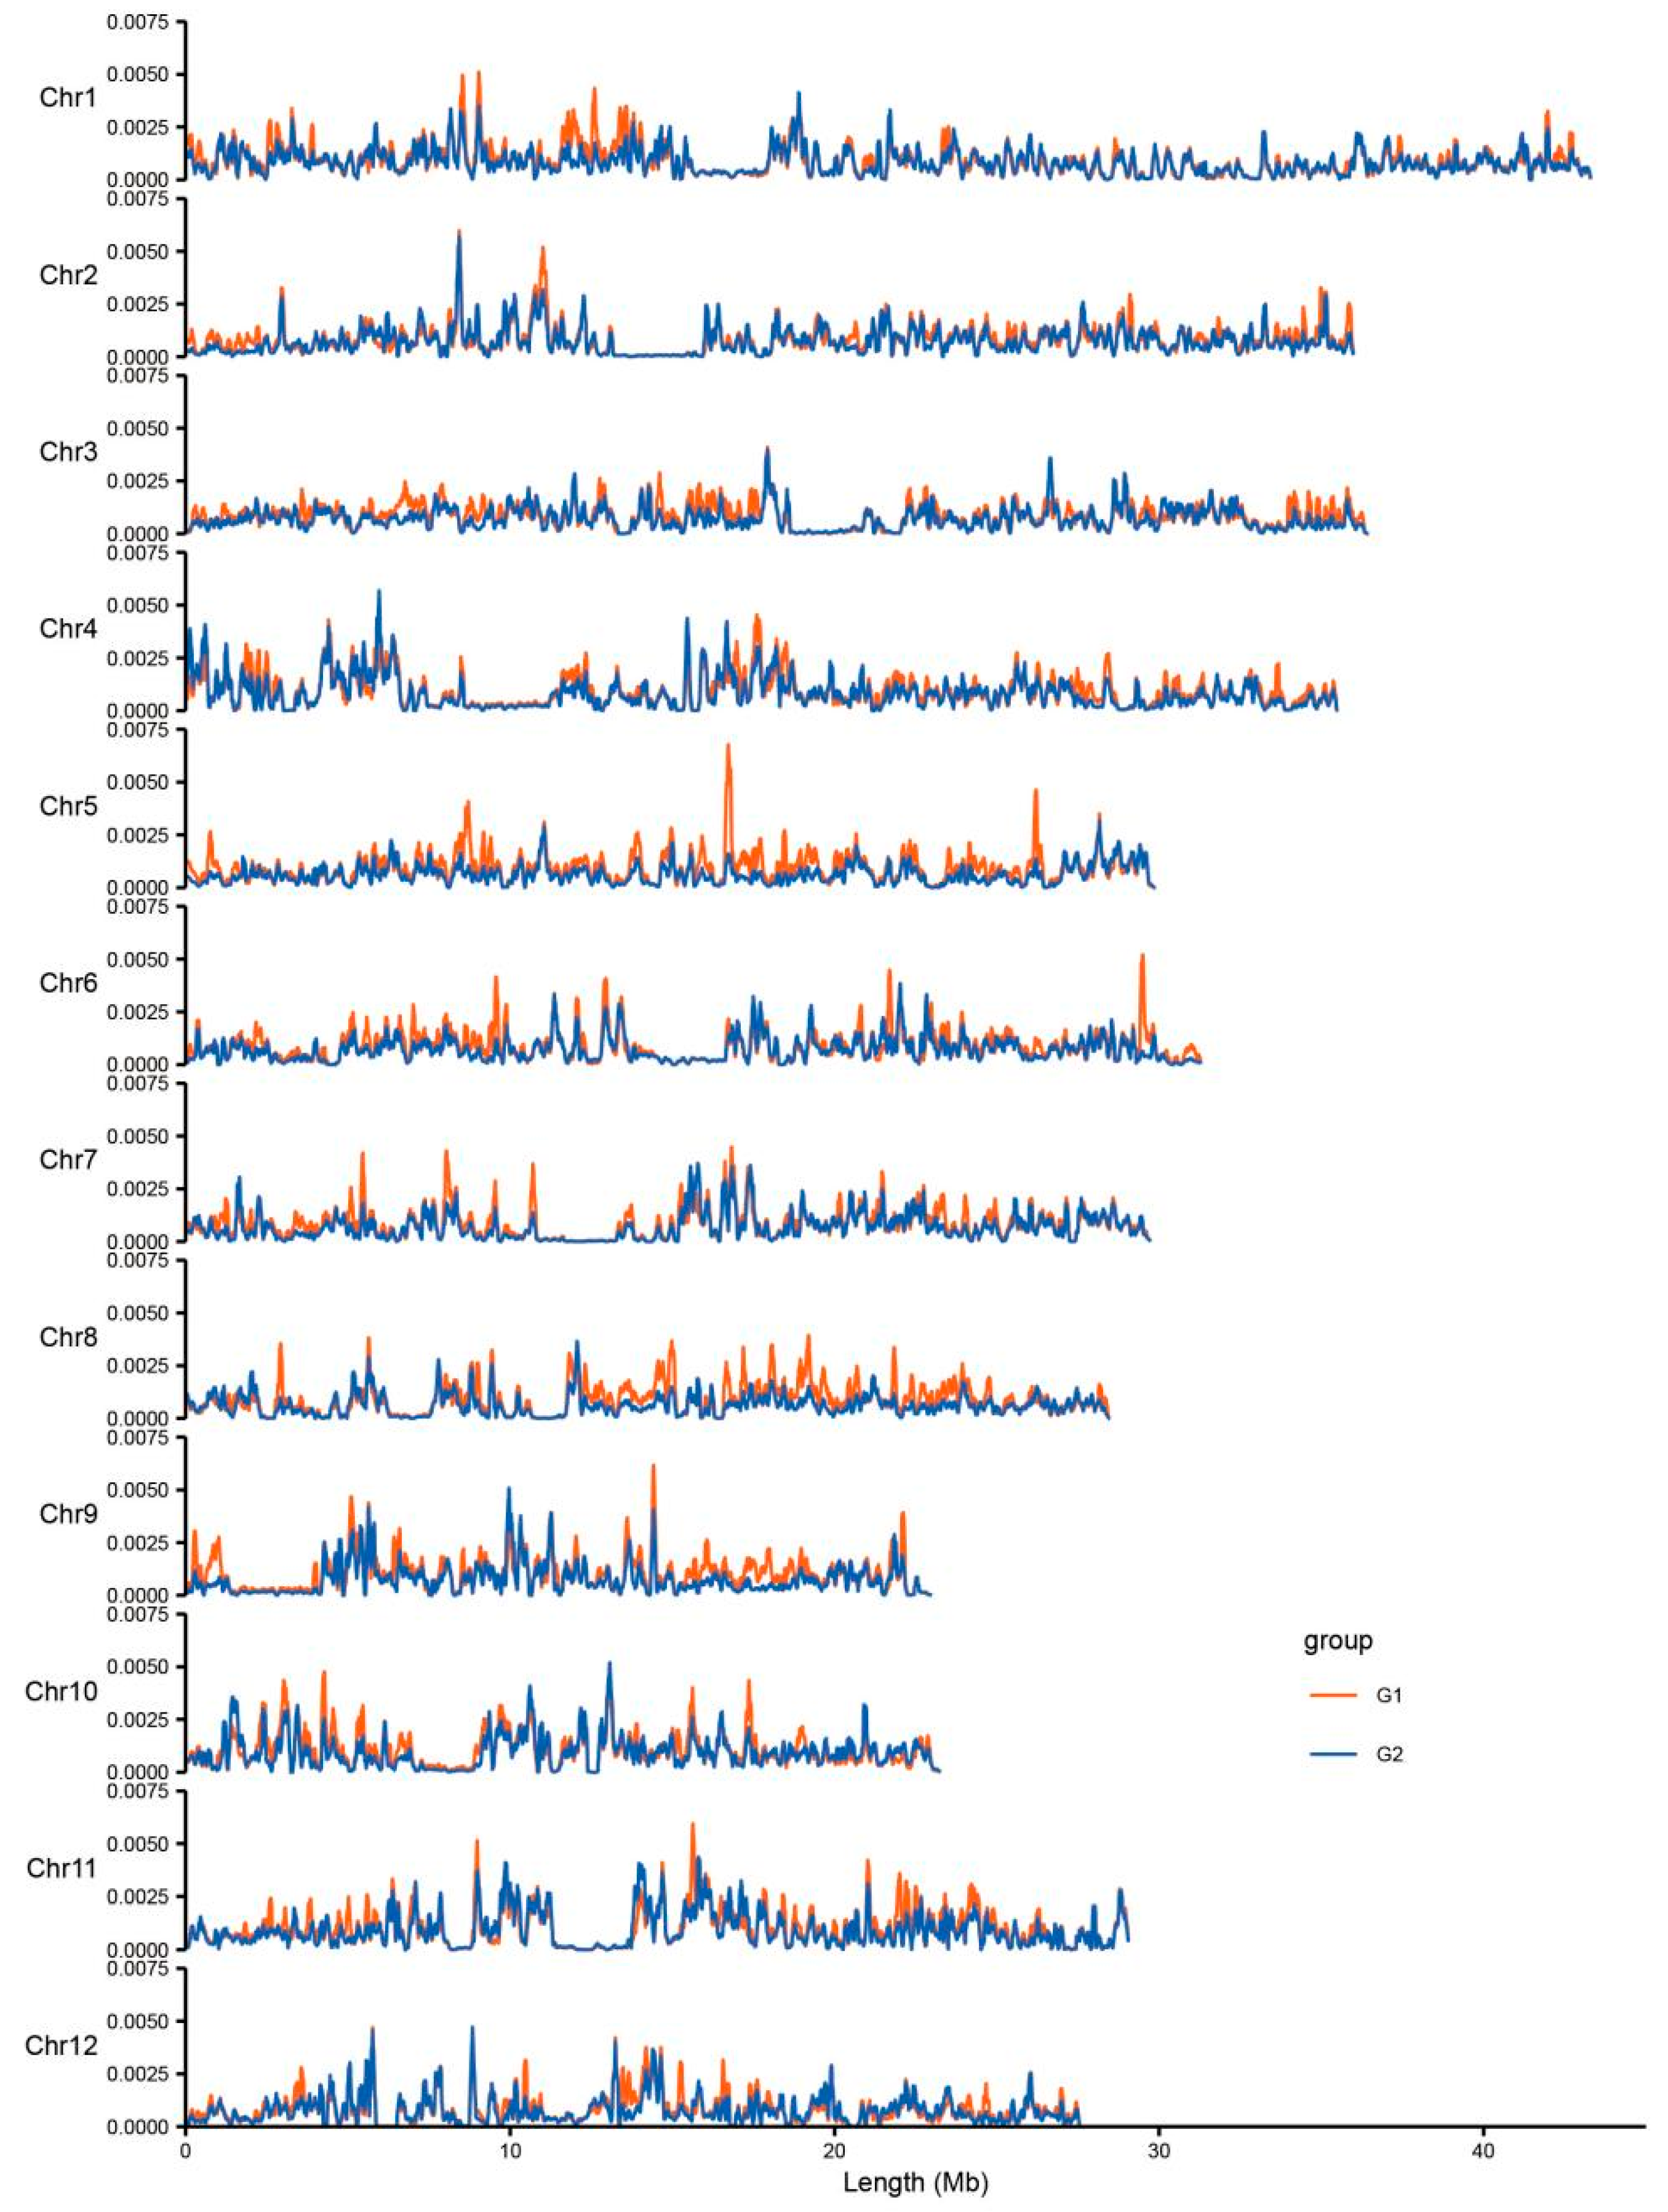
With a sliding window size of 100 kb and a step length of 10 kb, the π values of the two subpopulations in the DXWR populations were calculated, and a distribution diagram was drawn (Figure 8). The variation trend of the π values of the two subpopulations was compared and it was observed that the SNPs of the two subpopulations in some regions showed significant differences, usually with G1 > G2 in the π value.
Since the degree of differentiation between subpopulations is increased by natural selection, the highly differentiated regions in the genomes might be candidate regions for selection. Based on the FST value of the whole genome calculated by setting the sliding window size to 100 kb and step length to 10 kb, 31 highly differentiated regions were determined by the top 1% windows (Figure 9), which were 7.87 Mb in total length and included 1233 genes (Table S5).
The 31 highly differentiated regions have 1233 genes, including three drought resistance genes (OsPP18 [18], OsCYP20-2 [19], and OsTF1L [20]). In addition, the highly differentiated region at Chr2 1400001-1500000 coincided with the follow-up quantitative trait locus (QTL) region for drought avoidance in DXWR, and the highly differentiated region at Chr5 1-290000 was adjacent to the follow-up QTL region for drought avoidance in DXWR in a previous study [21].
We analyzed the relationship between relative genetic diversity (represented as log2 (πG1/πG2)) and genetic differentiation (represented by FST) between G1 and G2. First, we found that the average relative genetic diversity in the highly differentiated regions was significantly higher than the genomic average, indicating a reduction in genetic diversity from G1 to G2 in these regions (Figure 10A). Second, we found that genomic regions with the top 5% values of relative genetic diversity had significantly higher Fst than genomic regions (Figure 10B). This result indicated that genomic regions with lower relative genetic diversity contributed to the differentiation between G1 and G2. Taken together, the reduction in genetic diversity in these regions might be caused by directional selection.

3.4. Differences in Deep Root Trait between the Two Subpopulations of DXWR

Agronomic traits, such as plant height and tiller number, and the root traits, such as the number of deep roots, number of shallow roots, number of total roots, and deep root ratio of the G1 and G2 subpopulations in the DXWR nuclear genomes were surveyed. There were significant differences between the two subpopulations in the number of deep roots and deep root ratio (Table 4). The number of deep roots and the deep root ratio of the G2 subpopulation were significantly higher than those of the G1 subpopulation, and there were no significant differences in plant height, tiller number, number of shallow roots, or number of total roots between the two subpopulations. As the deep root ratio is an important factor in drought avoidance, it was believed that the G2 subpopulation of DXWR showed better drought avoidance.

4. Discussion

DXWR, a natural gene pool, is a critical reserve of rice germplasm resources [22]. As DXWR has undergone natural selection for various disasters and unfavorable environments in the wild state in the long term, an extremely abundant genetic diversity has been formed, and many superior genetic genes that cultivated rice do not possess or lost have been conserved. Hence, it has various specific characteristics that can be applied in modern rice breeding and biological technologies, showing great significance in their research, protection, and utilization. Since acyl-isozyme was adopted to study the genetic diversity of DXWR in 1989 [23], morphological markers [24,25], biochemical markers [26], and DNA molecular markers [27,28] have been widely used in China and abroad. Many studies have been conducted on the genetic diversity of DXWR from the perspectives of in situ conservation [29,30], years [31], generations [32], and comparisons with other ecological types of wild and cultivated rice [33,34,35,36]. It is generally believed that DXWR displays abundant genetic diversity [37,38]. Accordingly, we can detect abundant genetic diversity in DXWR in this study, as revealed by DXWR-specific SNPs and Indels. This result suggests that DXWR may have specific genetic resources, which are potentially valuable in rice breeding. In fact, many valuable genetic resources, including genes related to male sterile [39], tolerance to high temperature [40], and high nitrogen usage efficiency [41].
The DXWR originally had nine natural populations in terms of their geographical distributions (Table S1). However, our results based on genome-wide SNPs showed that the 220 DXWR lines in the ex situ conservation nursery could be only divided into two subgroups, and individuals of the two subgroups are mixed distributed. This result indicates the nine geographical populations should be derived from two original genetically distinguished populations. Interestingly, the two subgroups exhibited differences in several traits related to rice drought avoidance (e.g., DR and RDR). In addition, many genes and QTLs related to drought avoidance locate in these highly differentiated regions [18,19,20]. These results indicate genetic differentiation between G1 and G2 may be related to wild rice adaptation to environments with contrasting soil–water conditions. We also notice that subgroup G2 possesses lower genetic diversity in the highly differentiated regions. This result indicates that the directional selection drives the differentiation between G1 and G2 in terms of rice drought avoidance.
Typical DXWR lines from the G2 subgroup (mainly from Dongtangxice, Anjiashan, and Shuitaoshu populations) have genetic resources for drought avoidance and are good donors of drought avoidance in breeding. In addition, some candidate QTLs of drought avoidance have been identified in DY80, a typical line from G2 [21]. We intend to strengthen this research and use it in breeding programs. To further study and utilize the drought avoidance genetic resources of DXWR, QTL and candidate gene analyses should be conducted on deep-root-ratio–mediated drought avoidance in DXWR, and its genetic mechanism should be determined.

5. Conclusions

In this study, DXWR from nine natural populations were divided into two subpopulations based on the population structure analysis. Compared with other common wild and cultivated rice, Based on PCA and Structure analysis, 220 DXWR lines could be divided into two subpopulations, in which subpopulation G1 had more specific SNPs and Indels and was genetically more genetically diverse than subpopulation G2. The average Fst of regions with low relative genetic diversity between G1 and G2 were significantly lower than whole-genomic Fst, indicating directional selection in these regions. Some functional genes and QTLs were found to locate in highly differentiated regions between G1 and G2. Moreover, the deep root ratios of G2 were significantly higher than G1. Our results would be helpful to the conservation and utilization of DXWR germplasm. In addition, candidate genes in the differentiation regions and deep root trait phenotypes were analyzed. The results revealed that the two subpopulations differentiated by nuclear genomic SNP showed a significant difference in deep-root-ratio–mediated drought avoidance, laying the foundation for the exploration of drought avoidance genes in DXWR.

Supplementary Materials

The following supporting information can be downloaded at: https://www.mdpi.com/article/10.3390/agronomy12123056/s1. Table S1: Material information in ex situ conservation of DXWR; Table S2: The value of Max Fst, selected genes number and the distribution on chromosome of selected region in DXWR; Table S3: The alignment rate for each sample; Table S4: The information of 44 common wild rice and 468 cultivated rice; Table S5: The information of sequence data.

Author Contributions

Y.N. and L.L. conceived and designed the experiments. Y.N., G.H., H.C. and J.L. performed the experiments. Y.N., H.X., L.W. and L.C. analyzed the data. Y.N., G.H. and L.L. wrote the paper. All authors have read and agreed to the published version of the manuscript.

Funding

This research was funded by the open competition Program of Jiangxi Provincial Science and Technology (Grant No. 20213AAF01001), the National Modern Agricultural Industry Technology System Construction Program of China (Grant No. 20212BBF63001), the Jiangxi Provincial Science and Technology Support Program in China (Grant No. 20203BBF63033), the Jiangxi Modern Agricultural Research Collaborative Innovation Project in China (Grant No. JXXTCX202111), and the Open Project of State Key Laboratory of Rice Biology in China (Grant No. 20200101).

Data Availability Statement

All data used in the paper are listed at the end of the article as Table 1, Table 2, Table 3 and Table 4 of the supporting information. The data for candidate gene analysis were extracted from the online Plant-GE query system available at http://rice.plantbiology.msu.edu/cgi-bin/gbrowse/rice/. The raw sequencing data for the DXWR have been deposited in PRJNA873259.

Acknowledgments

We thank Xianhua Shen, who works at the Jiangxi Academy of Agricultural Science, for his many revising comments and language polishing to this paper, as well as many colleagues and students for their help in the collection of field data in this work.

Conflicts of Interest

The authors declare no conflict of interest.

Abbreviations

DXWR: Dongxiang wild rice, DR: Number of deep roots, DR: Number of deep roots, SR: Number of shallow roots, TR: Total number of roots, RDR: Ratio of deep roots, SD: Standard deviation, CV: Coefficient of variation.

References

  1. Nass, L.L.; Sigrist, M.S.; Ribeiro, C.; Reifschneider, F. Genetic resources: The basis for sustainable and competitive plant breeding. Crop Breed. Appl. Biot. 2012, 12, 75–86. [Google Scholar] [CrossRef] [Green Version]
  2. E, Z.G.; Wang, L. Discovery and utilization of favorable genes in wild rice. Hereditas 2008, 30, 1397–1405. [Google Scholar] [CrossRef]
  3. Xie, J.; Agrama, H.A.; Kong, D.; Zhuang, J.; Hu, B.; Wan, Y.; Yan, W. Genetic diversity associated with conservation of endangered Dongxiang wild rice (Oryza rufipogon). Genet. Resour. Crop Evol. 2010, 57, 597–609. [Google Scholar] [CrossRef]
  4. Luo, L. Breeding for water-saving and drought-resistance rice (WDR) in China. J. Exp. Bot. 2010, 61, 3509–3517. [Google Scholar] [CrossRef] [PubMed] [Green Version]
  5. Sun, C.Q.; Wang, X.K.; Yoshimura, A.; Iwata, N. A study of the genetic diversity of common wild rice (O. rufipogon Griff.) and cultivated rice (O. sativa L.) by RFLP analysis. Acta Genet. Sin. 2000, 27, 227–234. [Google Scholar]
  6. Uga, Y.; Okuno, K.; Yano, M. Dro1, a major QTL involved in deep rooting of rice under upland field conditions. J. Exp. Bot. 2011, 62, 2485–2494. [Google Scholar] [CrossRef] [PubMed] [Green Version]
  7. Scott, O.R.; Bendich, A.J. Extraction of DNA from plant tissue. Plant Mol. Biol. Manual. 1988, A6, 73–83. [Google Scholar]
  8. Martin, M. Cutadapt removes adapter sequences from high-throughput sequencing reads. Embnet J. 2011, 17, 10–12. [Google Scholar] [CrossRef]
  9. Bolger, A.M.; Lohse, M.; Usadel, B. Trimmomatic: A flexible trimmer for Illumina Sequence Data. Bioinformatics 2014, 30, 2114–2120. [Google Scholar] [CrossRef] [Green Version]
  10. Li, H. Aligning sequence reads, clone sequences and assembly contigs with BWA-MEM. arXiv 2013, arXiv:1303.3997v2. [Google Scholar]
  11. Li, H.; Handsaker, B.; Wysoker, A.; Fennell, T.; Ruan, J.; Homer, N.; Marth, G.; Abecasis, G.; Durbin, R.; 1000 Genome Project Data Processing Subgroup. The Sequence alignment/map (SAM) format and SAMtools. Bioinformatics 2009, 25, 2078–2079. [Google Scholar] [CrossRef] [Green Version]
  12. Mckenna, A.; Hanna, M.; Banks, E.; Sivachenko, A.; Cibulskis, K.; Kernytsky, A.; Garimella, K.; Altshuler, D.; Gabriel, S.; Daly, M.; et al. The Genome Analysis Toolkit: A MapReduce framework for analyzing next-generation DNA sequencing data. Genome Res. 2010, 20, 1297–1303. [Google Scholar] [CrossRef] [Green Version]
  13. Hubisz, M.J.; Falush, D.; Stephens, M.; Pritchard, J.K. Inferring weak population structure with the assistance of sample groupinformation. Mol. Ecol. Res. 2009, 9, 1322–1332. [Google Scholar] [CrossRef] [PubMed]
  14. Chang, C.C.; Chow, C.C.; Cam, T.L.; Shashaank, V.; Purcell, S.M.; Lee, J.J. Second-generation PLINK: Rising to the challenge of larger and richer datasets. GigaScience 2015, 4, 7. [Google Scholar] [CrossRef] [PubMed]
  15. Kumar, S.; Stecher, G.; Tamura, K. Mega7: Molecular evolutionary genetics analysis version 7.0 for bigger datasets. Mol. Biol. Evol. 2015, 33, 1870–1874. [Google Scholar] [CrossRef] [PubMed] [Green Version]
  16. Yu, G.; Smith, D.; Zhu, H.; Guan, Y.; Lam, T.T.Y. ggtree: An R package for visualization and annotation of phylogenetic trees with their covariates and other associated data. Methods Ecol. Evol. 2017, 8, 28–36. [Google Scholar] [CrossRef]
  17. Danecek, P.; Auton, A.; Abecasis, G.; Albers, C.A.; Banks, E.; DePristo, M.A.; Handsaker, R.; Lunter, G.; Marth, G.; Sherry, S.T.; et al. The variant call format and vcftools. Bioinformatics 2011, 27, 2156–2158. [Google Scholar] [CrossRef]
  18. You, J.; Zong, W.; Hu, H.H.; Li, X.H.; Xiao, J.H.; Xiong, L.Z. A STRESS-RESPONSIVE NAC1-Regulated Protein Phosphatase Gene Rice Protein Phosphatase18 Modulates Drought and Oxidative Stress Tolerance through Abscisic Acid-Independent Reactive Oxygen Species Scavenging in Rice. Plant. Physiol. 2014, 166, 2100–2114. [Google Scholar] [CrossRef] [Green Version]
  19. Kim, S.-K.; You, Y.N.; Park, J.C.; Joung, Y.; Kim, B.-G.; Ahn, J.C.; Cho, H.S. The rice thylakoid lumenal cyclophilin OsCYP20-2 confers enhanced environmental stress tolerance in tobacco and Arabidopsis. Plant Cell Rep. 2012, 31, 417–426. [Google Scholar] [CrossRef]
  20. Bang, S.W.; Lee, D.K.; Jung, H.; Chung, P.J.; Kim, Y.S.; Choi, Y.D.; Suh, J.W.; Kim, J.K. Overexpression of OsTF1L, a rice HD-Zip transcription factor, promotes lignin biosynthesis and stomatal closure that improves drought tolerance. Plant Biotechnol. J. 2019, 17, 118–131. [Google Scholar] [CrossRef] [Green Version]
  21. Nie, Y.; Xia, H.; Ma, X.; Lou, Q.; Liu, Y.; Zhang, A.; Chen, L.; Yan, L.; Luo, L. Dissecting genetic Basis of Deep Rooting in Dongxiang Wild Rice. Rice Sci. 2022, 29, 277–287. [Google Scholar]
  22. Zhang, F.; Luo, X.; Zhou, Y.; Xie, J. Genome-wide identification of conserved microRNA and their response to drought stress in Dongxiang wild rice (Oryza rufipogon Griff.). Biotechnol. Lett. 2016, 38, 711–721. [Google Scholar] [CrossRef]
  23. Li, Z.; Liu, G.; Yu, W. Genetic heterogeneity of wild rice in Dongxiang wild rice. J. Southwest Agric. Univ. 1989, 3, 285–287. [Google Scholar]
  24. Qiu, B.; Xiong, Y.; Yu, L.; Hu, B.; Zhang, Z.; Xie, J. Cluster analysis of plant morphological characters in population of Dongxiang wild rice. Acta Agric. Jiangxi 2006, 18, 1–5. [Google Scholar]
  25. Yu, L.; Xu, Q.; Qiu, B.; Xiong, Y.; Rao, S. Comparative Studies on the Main Agronomic Characteristics between In-situ and Ex-situ Conserved Wild Rice Populations in Dongxiang. J. Plant Genet. Res. 2007, 8, 99–101. [Google Scholar]
  26. Huang, Y.; Li, G.; Chen, D.; Shi, Q.; Xiao, Y.; Wang, F.; Yu, L.; Xiao, Y. A preliminary study on the genetic diversity of Allozymic loci of Dongxiang wild rice (Oryza rufipogon Griff.). Acta Agric. Univ. Jiangxiensis 2002, 24, 1–5. [Google Scholar]
  27. Xie, J.; Chen, D.; Xiao, Y.; Luo, S.; Zheng, K.; Zhuang, J. Genetic diversity of Dongxiang wild rice detected by SSLP markers. Sci Agric Sin 2003, 36, 873–878. [Google Scholar]
  28. Kong, D.; Xie, J.; Zhuang, J.; Fan, Y.; Wan, Y. Genetic diversity of in situ conserved Dongxiang wild rice detected by SSR. J. Agric. Biotech. 2006, 14, 742–746. [Google Scholar]
  29. Yang, Q.; Yu, L.; Zhang, W.; Shi, J.; Ren, J.; Miao, H. The Genetic Differentiation of Dongxiang Wild Rice (Oryza rufipogon Griff.) and Its Implications for In-Situ Conservation. Sci. Agric. Sin. 2007, 40, 1085–1093. [Google Scholar]
  30. Xie, J.; Hu, B.; Wan, Y.; Zhang, T.; Li, X.; Liu, R.; Huang, Y.; Dai, L.; Luo, X. Comparison of the drought resistance characters at Seedling Stage between Dongxiang common wild rice (Oryza rufipogon Griff.) and cultivars (Oryza sativa L.). Acta Ecol. Sin. 2010, 30, 1665–1674. [Google Scholar]
  31. Gao, L.; Ge, S.; Hong, D.; Lin, R.; Tao, G.; Xu, Z. Allozyme variation and conservation genetics of common wild rice (Oryza rufipogon Griff.) in Yunnan, China. Euphytica 2002, 124, 273–281. [Google Scholar] [CrossRef]
  32. Song, Z.; Xu, X.; Wang, B.; Chen, J.; Lu, B. Gentic diversity in the northernmost Oryza rufipogon populations estimated by SSR markers. Theor. Appl. Genet. 2003, 107, 1492–1499. [Google Scholar] [CrossRef] [PubMed]
  33. Zhu, S.; Zhang, Q.; Wang, M. Ribosomal DNA polymorphisms of the common wild rice from China. Acta Genet. Sin. 1998, 25, 531–537. [Google Scholar]
  34. Sun, C.; Wang, X.; Li, Z.; Yoshimura, A. Comparison of the genetic diversity of common wild rice (Oryza rufipogon) and cultivated rice (O. Sativa) using RFLP markers. Theor. Appl. Genet. 2001, 102, 157–162. [Google Scholar] [CrossRef]
  35. Zhang, X.; Guo, H.; Wang, H.; Lu, J.; Yuan, X.; Peng, S.; Wei, X. Comparative Assessment of SSR Allelic Diversity in Wild and Cultivated Rice in China. Acta Agron. Sin. 2008, 34, 591–597. [Google Scholar] [CrossRef]
  36. Duan, S.; Li, S.; Li, S.; Zhu, Y. Genetic Diversity of Wild Rice and Cultivated Rice. Acta Agron. Sin. 2009, 35, 467–474. [Google Scholar] [CrossRef]
  37. Zhu, Z.; Sun, C.; Fu, Y.; Zhang, P.; Wang, X. Comparison of the genetic diversity of common wild rice and cultivated rice using SSR markers. Sci. Agric. Sin. 2002, 35, 1437–1441. [Google Scholar]
  38. Zhang, J.; Xu, B.; Li, M. Genetic diversity of populations of an endangered medicinal plant species (Glycyrrhiza uralensis) in different environments of North China. J. Med. Plant Res. 2010, 4, 830–836. [Google Scholar]
  39. Shen, X.H.; Yan, S.; Huang, R.L.; Zhu, S.; Xiong, H.L.; Shen, L.G. Development of novel cytoplasmic male sterile source from Dongxiang Wild Rice (Oryza rufipogon). Rice Sci. 2013, 20, 379–382. [Google Scholar] [CrossRef]
  40. Cao, Z.B.; Tang, H.W.; Cai, Y.H.; Zeng, B.H.; Zhao, J.L.; Tang, X.Y.; Lu, M.; Wang, H.M.; Zhu, X.J.; Wu, X.F.; et al. Natural variation of HTH5 from wild rice, Oryza rufipogon Griff., is involved in conferring high-temperature tolerance at the heading stage. Plant Biotechnol. J. 2022, 20, 1591–1605. [Google Scholar] [CrossRef]
  41. Yang, K.S.; Chen, X.R.; Fu, J.R.; Peng, X.S.; Zhu, C.I.; He, X.P.; He, H.H. Survey of the Biologic Characteristic on the Nutritional Stress in the Dongxiang Wild Rice. J. Plant Genet. Res. 2006, 4, 427–433. [Google Scholar]
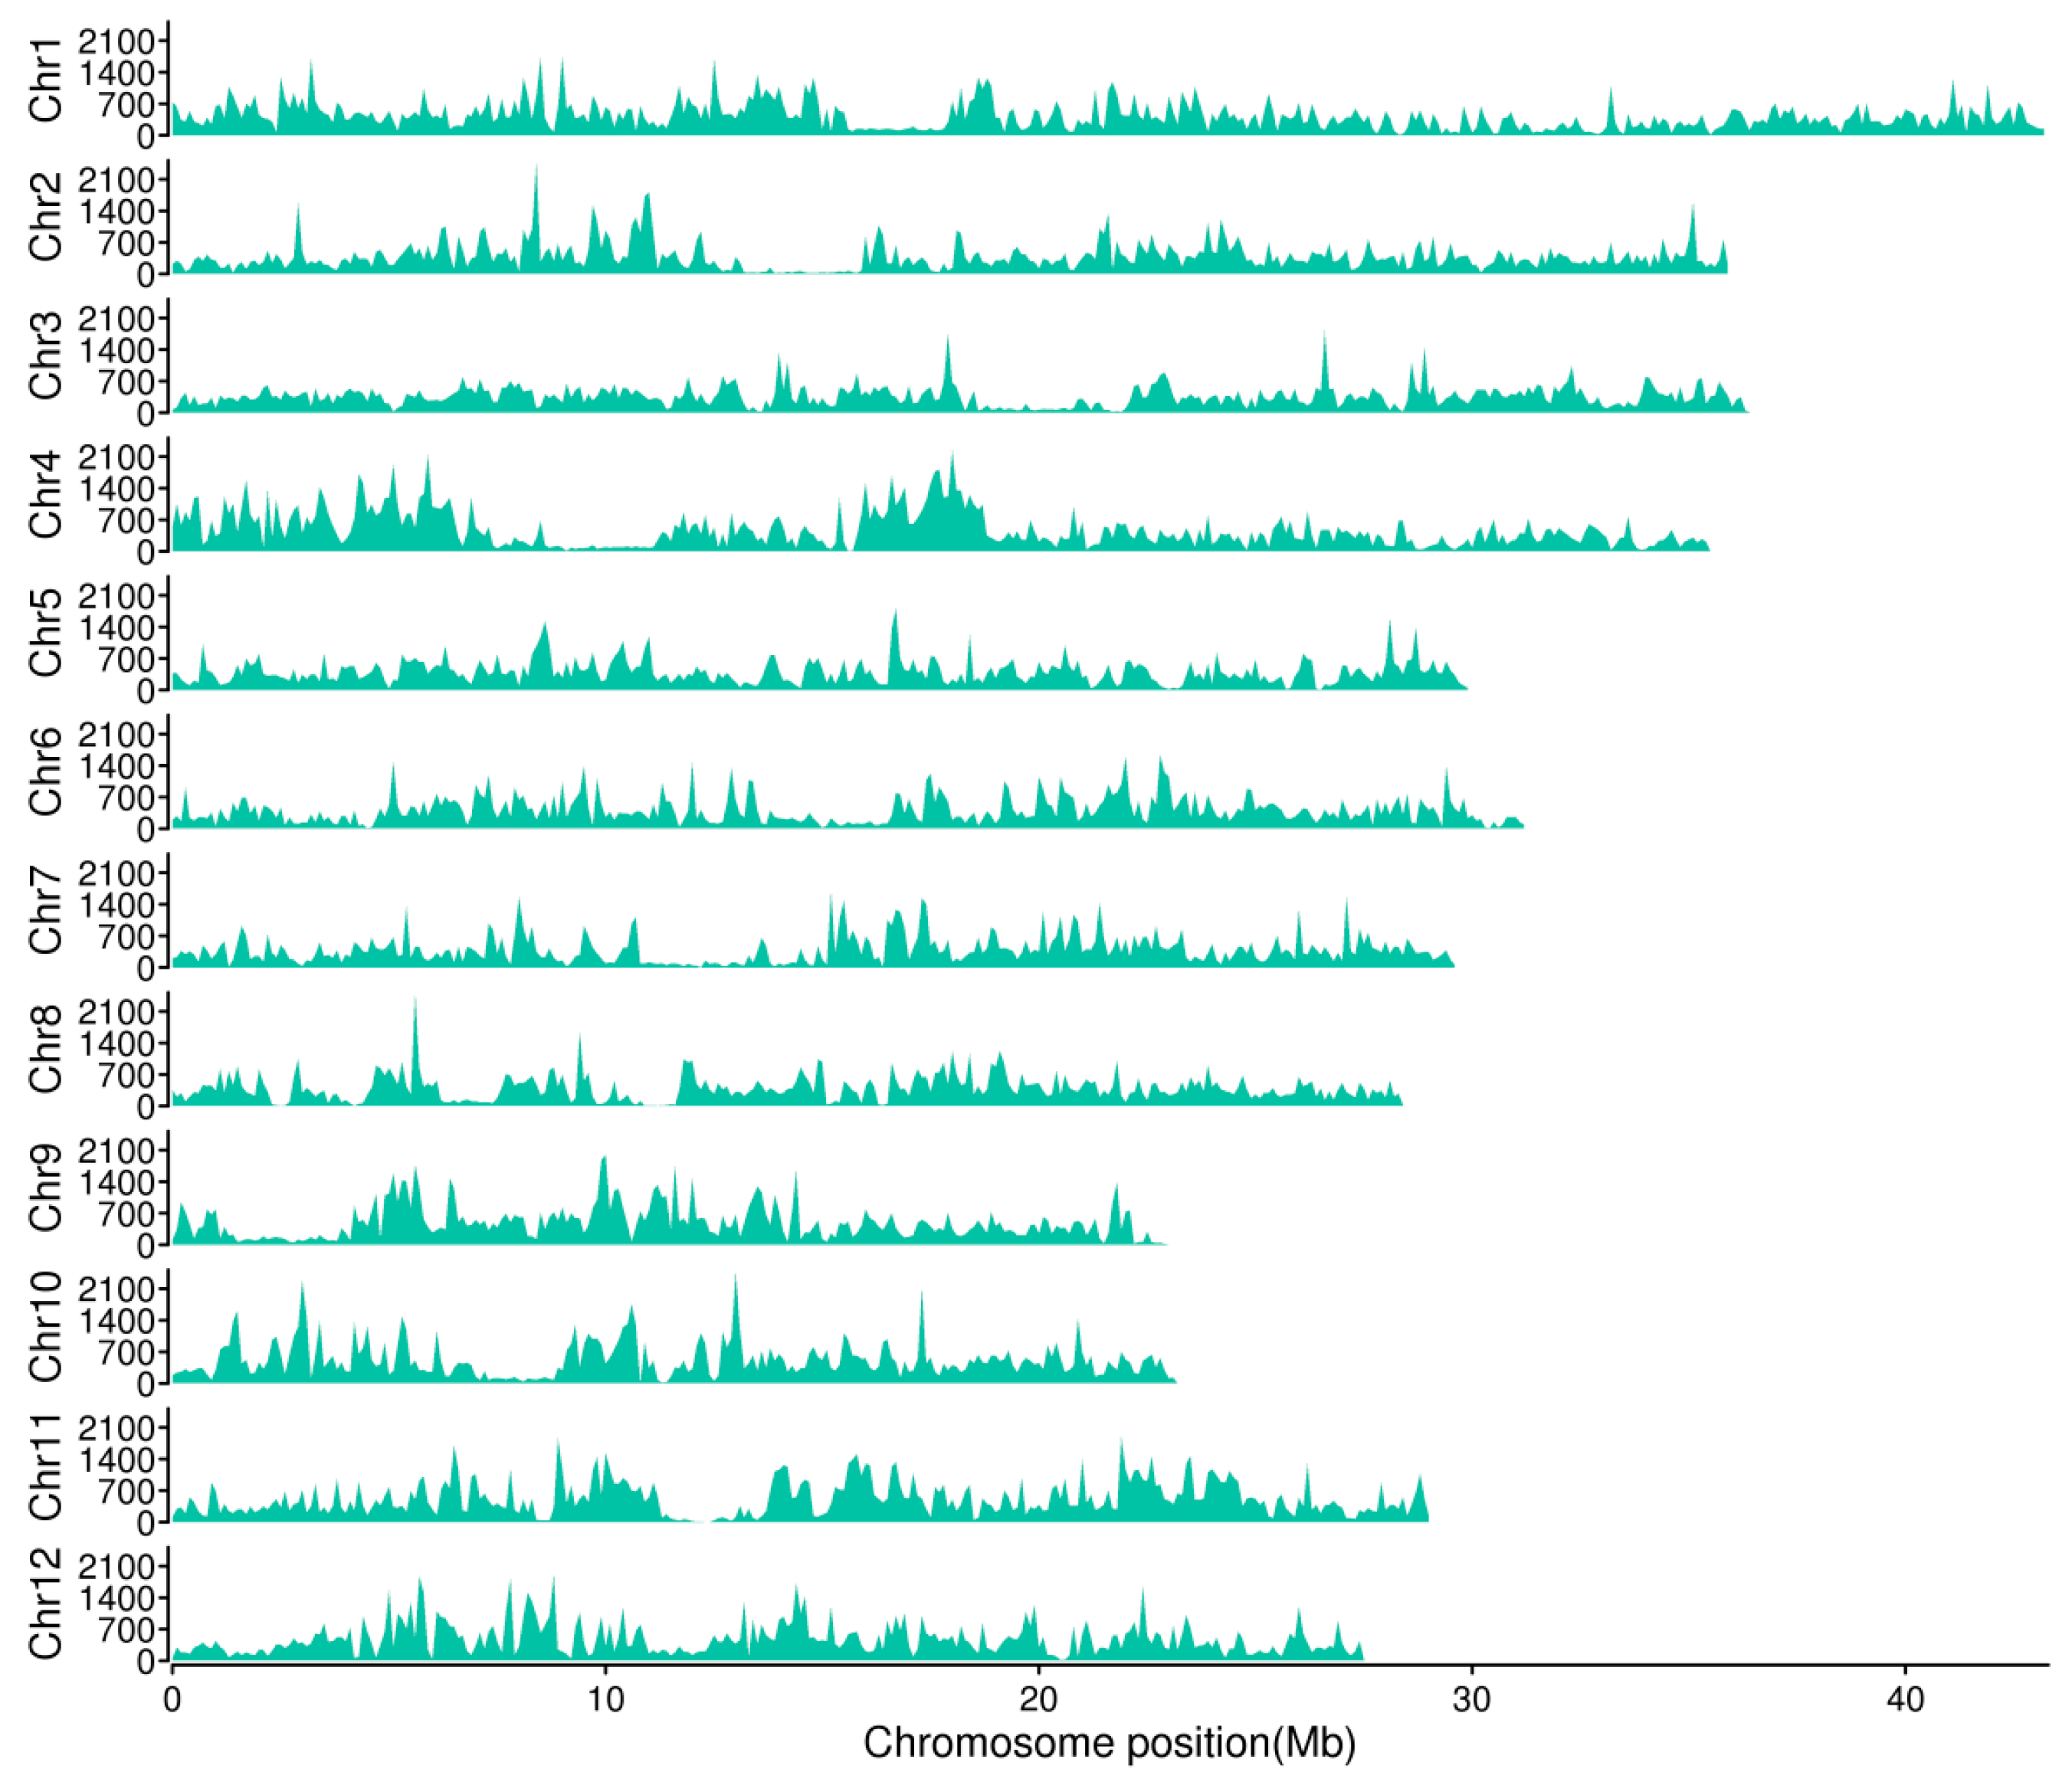
Figure 1. Distribution of variations in the 12 chromosomes in DXWR.
Agronomy 12 03056 g001
Figure 2. Venn of SNPs (A) and Indels (B) between DXWR, cultivated rice, and other common wild rice. Cultivars: common cultivated rice, Other WR: other common wild rice, DXWR: Dongxiang wild rice.
Agronomy 12 03056 g002
Figure 3. The PCA scatter plot. PCA analysis of 220 DXWR lines according to the first two eigenvectors constructed by PLINK software. G1: G1 subpopulations of DXWR, G2: G2 subpopulations of DXWR.
Agronomy 12 03056 g003
Figure 4. The phylogenetic tree. Phylogenetic tree generated by MEGA 7 illustrating the genetic relationship among 220 DXWR lines. G1: G1 subpopulations of DXWR, G2: G2 subpopulations of DXWR.
Agronomy 12 03056 g004
Figure 5. The ΔK trends (A) and the population structure (B) with different K values for the DXWR. MG1: G1 subpopulations in mitochondrial markers grouping, MG2: G2 subpopulations in mitochondrial markers grouping, MG3: G3 subpopulations in mitochondrial markers grouping, MG4: G4 subpopulations in mitochondrial markers grouping.
Agronomy 12 03056 g005
Figure 6. FST of the two variation types of two subpopulations in DXWR, cultivated rice and other common wild rice. Cultivar: cultivated rice; Other WR: other common wild rice; DXWR G1: G1 subpopulations of DXWR; DXWR G2: G2 subpopulations of DXWR.
Agronomy 12 03056 g006
Figure 7. Venn of the two types of genetic variation (A) SNP and (B) InDel between wild rice (WR) from Dongxiang (DX), WR from other regions, and cultivars. Cultivars: cultivated rice; Other WR: other common wild rice; WRDX G1: G1 subpopulations of DXWR; WRDX G2: G2 subpopulations of DXWR.
Agronomy 12 03056 g007
Figure 8. Π values for the 100 kb sliding window with a 10 kb step size across the rice genome for two DXWR subpopulations. G1: G1 subpopulations of DXWR; G2: G2 subpopulations of DXWR.
Agronomy 12 03056 g008
Figure 9. The whole genome (100 kb window, 10 K step) distribution of the genetic differentiation index (Fst) between the two subpopulations of DXWR. (A) The natural logarithms of the probability data [LnP(K)] and ΔK; (B) the dotted line represents 99% confidence region of Fst distribution.
Agronomy 12 03056 g009
Figure 10. Relationship between relative genetic diversity (G1/G2) and the genetic differentiation index between the G1 and G2 subpopulations. (A) Comparison of relative genetic diversity and population mean of G1-G2 high differentiation window; (B) relative genetic polymorphism (Π G1/Π G2) comparison of genetic differentiation index and population mean of maximum and minimum 5% windows. The p-value was based on independent t-test. G1: G1 subpopulations of DXWR, G2: G2 subpopulations of DXWR.
Agronomy 12 03056 g010
Table 1. Variation sites in DXWR obtained by resequencing.
Chr. IDLength (bp)SNPsIndels
NumberDensity (/Mb)NumberDensity (/Mb) Density (/Mb)
Chr143,270,923163,7393784.0426,407610.27
Chr235,937,250122,7023414.3419,631546.26
Chr336,413,819116,4243197.2519,296529.91
Chr435,502,694152,1744286.2722,104622.6
Chr529,958,434109,6663660.6115,839528.7
Chr631,248,787115,6043699.4718,518592.6
Chr729,697,621104,1633507.4516,614559.44
Chr828,443,022101,1553556.4114,915524.38
Chr923,012,720102,6984462.6614,273620.22
Chr1023,207,287109,7494729.0716,041691.21
Chr1129,021,106136,1454691.2420,193695.8
Chr1227,531,856120,1864365.3417,842648.05
Total373,245,5191,454,4053896.64221,673593.91
Table 2. The annotations of variation sites in DXWR.
CategorySNPInDel
NumberRatio (%)NumberRatio (%)
intergenic571,39039.2990,93041.03
upstream/downstream402,62627.6868,20730.77
   upstream207,58214.2735,20215.88
   downstream168,03011.5528,06012.66
   upstream and downstream27,0141.8649452.23
genic480,30533.0362,50828.20
  intronic227,35515.6337,96717.13
  exonic208,06114.3112,4235.60
   synonymous/nonframeshift81,0485.5744101.99
   nonsynonymous/frameshift121,4278.3577483.50
   stopgain50670.352460.11
   stoploss5190.04190.01
  5′UTR15,3721.0650672.29
  3′UTR28,2051.9468873.11
  splicing13120.091640.07
Table 3. The distribution of the original population in nuclear genome resequencing grouping of DXWR.
SubgroupZTCSTSKXLZTAJSDTSDTDTXDTXCNumber
G111513144141513089
G21222815186181715131
Number232721292220333015220
G1(%)4819624818704543040.5
G2(%)528138528230555710059.5
ZTC: Zhang Tangcun; STS: Shui Taoshu; KXL: Kan Xialong; ZT: Zhang Tang; AJS: An Jiashan; DTS: DongTangshang; DT: Dong Tang; DTX: Dong Tangxia; DTXC: Dong Tangxice.
Table 4. The performance of root and other agronomic traits in the two subpopulations of nuclear genome resequencing in DXWR. n = 15 means the sample size of each subpopulation containing 15 strains, and six plants were investigated for each strain. DR: number of deep roots, SR: number of shallow roots, TR = (DR + SR): number of total roots, RDR = (DR/TR): the ratio of deep roots. “**” indicate significance at levels of p < 0.01 by independent t-test. “*” indicate significance at levels of p < 0.05 by independent t-test.
TraitG1 (n = 15)G2 (n = 15)F
M ± SDMinMaxCV (%)M ± SDMinMaxCV (%)
Plant height121.67 ± 22.1996.33 137.67 18.00 118.08 ± 21.3291.33 129.67 18.00 0.76
Tiller32.00 ± 7.3624.33 39.00 23.00 38.17 ± 12.6728.67 54.00 33.00 0.34
DR15.33 ± 3.2811.68 18.00 21.00 28.92 ± 5.1323.67 36.33 18.00 0.01 **
SR64.67 ± 8.5056.00 73.00 13.00 73.75 ± 9.9258.33 85.67 13.00 0.54
TR80.00 ± 8.1974.00 89.73 10.00 102.67 ± 12.3687.67 112.33 12.00 0.08
RDR(%)19.28 ± 4.6315.22 24.32 24.00 28.36 ± 5.5121.65 42.46 19.00 0.03 *
Publisher’s Note: MDPI stays neutral with regard to jurisdictional claims in published maps and institutional affiliations.