Article

Influence of Structure of Detrital Food Webs on Fusarium Head Blight of Winter Wheat

by
Anton A. Goncharov
1,*,
Arina D. Kiseleva
2,
Kirill A. Mashkov
3,
Ivan V. Sotnikov
2,
Anastasia G. Izvarina
4,
Valery A. Ladatko
5,
Valentina N. Maygurova
6,
Olesya O. Miroshnichenko
4,
Oksana L. Rozanova
1,
Irina B. Rapoport
7 and
Galina V. Volkova
4
1
A.N. Severtsov Institute of Ecology and Evolution, Russian Academy of Sciences, Leninsky pr. 33, 119071 Moscow, Russia
2
Faculty of Biology, M.V. Lomonosov Moscow State University, Leninskie Gory, 1, 119991 Moscow, Russia
3
Institute of Agrobiotechnology, Russian State Agrarian University-Moscow Timiryazev Agricultural Academy, Timiryazevskaya Str. 49, 127550 Moscow, Russia
4
Federal Research Center for Biological Plant Protection, VNIIBZR Str. 1, 350039 Krasnodar, Russia
5
Federal Scientific Center for Rice, Belozerny, 3, 350921 Krasnodar, Russia
6
XEMA Company Limited, 9th Parkovaya Str. 48/4, 105043 Moscow, Russia
7
A.K. Tembotov Institute of Ecology of Mountain Territories, Russian Academy of Sciences, I. Armand Str. 37a, 360051 Nalchik, Russia
*
Author to whom correspondence should be addressed.
Agronomy 2022, 12(2), 393; https://doi.org/10.3390/agronomy12020393
Submission received: 31 December 2021 / Revised: 25 January 2022 / Accepted: 28 January 2022 / Published: 4 February 2022
(This article belongs to the Section Pest and Disease Management)

Abstract

:
Conventional methods for Fusarium head blight (FHB) control are ineffective. A better understanding of the mechanisms linking the abundance of Fusarium species in soil before winter wheat flowering and mycotoxin content in mature grain may help to improve the effectiveness of methods for FHB control. In this study, we established a field experiment aimed to trace the impact of three types of organic mulch with different C:N ratios on the structure of detrital food webs and the manifestation of winter wheat FHB. T2-toxin content in grain was significantly higher in N-poor treatment (52.1 ± 0.2 µg g−1) compared to N-rich treatment (40.4 ± 1.6 µg g−1). The structure of detrital food webs in the studied treatments changed significantly after mulch addition; the abundance of soil saprophages and mycophages increased up to 50%. Based on the results of mixed-effects modeling, the abundance of herpetobionts and soil mesofauna were positively associated with an increase in Fusarium biomass in grain. The increase in the content of T2-toxin in the grain was associated with an increase in the abundance of earthworms and phytophagous macrofauna in the soil. Results suggest the existence of a previously undescribed mechanism for FHB infection by transfer of pathogenic spores by soil invertebrates, while the content of mycotoxins in grain can be triggered by the grazing activity of soil phytophagous invertebrates.

1. Introduction

Fusarium head blight (FHB) is an important disease that reduces cereal yields and leads to the accumulation of trichothecene mycotoxins (e.g., T2-toxin, deoxynivalenol, zearalenone) making the grain unacceptable for human consumption or animal feed [1,2,3]. In Europe, about 20 species from the genus Fusarium can cause FHB of cereals [4,5]. In agroecosystems, crop residues and soil (viz. soil organic matter, SOM) are both the main energy source and habitat for Fusarium species [6]. The main factors determining the likelihood of FHB occurrence in winter wheat include weather conditions just before and during flowering (warm and wet conditions are more favorable for FHB), plant variety (more or less susceptible to FHB), pre-crop rotation (cereals as pre-crop increase risk of FHB), and soil type [4,5].
Chemical control for FHB is not very effective. Based on the results of a comprehensive meta-analysis, the use of fungicides from a class of compounds known as triazoles against FHB reduced the concentration of deoxynivalenol (DON) in wheat grain by 7.0–12.8% [7]. The use of antagonistic microorganisms, such as Trichoderma and Cryptococcus, also has low efficiency; commercially available biocontrol agents based on antagonistic strains of microorganisms reduce the incidence of FHB by 18–52% [8,9]. The high level of local species diversity of the genus Fusarium may be the main reason for the low sensitivity of this group to fungicides and antagonists [1]. Within the local pathogenic complex, not only different species, but also different strains of the same species significantly differ in their genome and secretome, determining their degree of resistance to fungicides [10]. Moreover, weed species within cereal crop rotations can serve as alternative hosts for pathogenic Fusarium species as was shown for F. graminearum causing FHB of wheat [11]. The development of new wheat varieties resistant to FHB is complicated by the lack of donors of robust genetic resistance to FHB among known wheat varieties [12].
During most of their life cycle, Fusarium species, like other saprotrophic fungi in detrital food webs, decompose organic residues on the surface and in the upper soil layers [1]. At this stage of their life cycle, Fusarium species are very vulnerable to the feeding activity and movement of soil invertebrates [13,14] and soil saprotrophic microorganisms [15,16]. In particular, spores of the pathogenic species Fusarium lateritium lost their germination capacities after passing through the intestine of the earthworm Lumbricus terrestris [17]. In a number of food choice experiments, it was shown that Fusarium species are among the most preferred saprotrophic fungi for a wide range of soil fauna, including earthworms, nematodes, and collembolans [18,19]. Overall, the occurrence of soil fauna in experimental systems diminishes the abundance of Fusarium species by 20% [13].
In agroecosystems, detrital food webs regulate the liberation of nutrients that were locked up in soil organic matter or soil microbes, thus increasing nutrient availability and productivity of plants [20,21]. The trophic structure of detrital wood webs via trophic cascades can regulate plant growth and productivity [22,23]. Interactions between nematodes of different trophic groups (root-feeding, bacterial-feeding, predatory, and entomopathogenic) and predatory soil mites inhabiting the rhizosphere crucially affect plant performance [24]. Accumulation of mycotoxins in the developing grain by Fusarium species is associated with the pasture, or aboveground, block of terrestrial ecosystems [20]. Thus, the activity of pathogenic Fusarium species can be considered as one of the mechanisms linking aboveground and belowground food webs and maintaining the unity of terrestrial ecosystems. The key elements of this mechanism are the abundance of Fusarium species in soil and the content of mycotoxins in grain and crop residues. In a series of field experiments, estimates of the effect of three model species of soil invertebrates (Aphelenchoides saprophilus, Folsomia candida, and Lumbricus terrestris) on the rate of decrease in the content of toxins and the biomass of Fusarium species in crop residues have been obtained [25,26,27].
The mechanisms governing the relationship between the abundance of Fusarium species in the soil before the flowering of cereals and the content of mycotoxins in the developed grain have not been studied in detail. It is generally accepted that a decrease in the abundance of mycelium of pathogenic Fusarium species in the soil is associated with a decrease in the risk and degree of FHB [1]. However, we did not find quantitative estimates of this relationship in the available literature. Airborne transmission of pathogenic Fusarium spores from the soil surface to a flower is considered the main route of infection [1,6]. However, invertebrates that regularly make daily vertical migrations in the agroecosystem, such as hortobionts [28], herpetobionts [29], and many taxonomic groups of soil invertebrates (for instance, Collembola) are also able to carry pathogenic spores and make a significant contribution to the infection of plants with FHB. This infection mechanism is well known for a number of groups of insects and pathogenic microorganisms [30,31]. A better understanding of the mechanisms linking the abundance of Fusarium species in soil before winter wheat flowering and mycotoxin content in mature grain may help to improve the effectiveness of FHB control methods.
Surface residues, usually in the form of plant litter, strongly influence the detrital food webs [32]. Mulches were usually observed to stimulate the soil microorganisms [33,34], microfauna [35,36], earthworms [37], predatory herpetobionts [23], and arthropod populations [38]. Amount and C:N ratio of organic amendments regulate soil N availability [39]. Under laboratory conditions, different types of mulch significantly reduced the incidence of Fusarium wilt in banana plants [40] and wheat seedlings [35]. However, the current understanding of the effects of soil environmental changes induced by different amounts of crop residue mulch on regulating detrital wood webs and FHB remains poor [36].
In this study, we aimed to obtain quantitative information on the impact of a detrital subsidy with different C:N ratios on the development of FHB in winter wheat. We established a field experiment that included the addition of N-rich, N-medium, and N-poor mixtures of straw and compost containing the same amount of organic carbon from straw (200 g C m−2) to promote soil fauna growth and development. We hypothesized that (i) an additional amount of nitrogen and organic carbon will reduce the FHB of winter wheat due to changes in the structure of the detrital food web, and (ii) higher nitrogen content in mulch will lead to higher grain yield.

2. Materials and Methods

2.1. Experimental Setup

The field experiment was carried out from 14 April to 30 June 2021 on two winter wheat fields in the Krasnodar Kraj (Russia). In the first field (45.08 N, 38.72 E, 200 m a.s.l.) the variety “Tanya” was grown, the pre-crop in the rotation was winter wheat. In the second field (45.06 N, 38.81 E, 200 m a.s.l.) the cultivar “Ostistaya—100” was grown, the pre-crop in rotation was corn. The soil type was meadow-chernozemic, or Luvic Chernozems Sodic [41], clay (55% clay, 25% silt, 20% sand) with a pH of 7.6 ± 0.2. On each field, 8 test plots were laid, measuring 7 by 7 m, grouped into two square blocks of 4 plots. The distance between the plots within a block was 5 m, and between the blocks was 100 m.
Within each block, experimental plots were assigned randomly to one of four treatments: (1) control, (2) addition of a detrital subsidy with low nitrogen content (‘N-poor mulch’), (3) addition of detrital subsidy with medium nitrogen content (‘N-medium mulch’), (4) addition of detrital subsidy with high nitrogen content (‘N-rich mulch’). Detrital subsidies were added as a 3–4 cm thick mulch laid on the soil surface. The detrital subsidy consisted of shredded wheat straw (average length 10 cm) and poultry-manure-based compost.
As the experiment was intended to mimic field technology, the detrital subsidy material was not sterilized prior to use. The amount of added detrital subsidy varied from 215 to 290 g C m−2, which is comparable to the net productivity of winter wheat [42]. The ratios of carbon pools from straw and compost were 18:3, 18:5, and 18:11 in the N-poor, N-medium, and N-rich detrital subsidies, respectively. The duration of the experiment after the start of treatment was 77 days. Samples of soil (from the upper 7 cm soil layer) and mulch were collected from the between-row space at the start of the experiment (day 0) and after 14, 42, and 77 days. Based on the experimental design, both mulch and soil samples were collected separately from the experimental plots assigned to mulch treatments. From the control treatment, only soil samples were collected.

2.2. Plants, Grain, Straw, and Compost Parameters

Development of root rot. On days 0, 14, 42, and 77 of the experiment in each experimental plot, 30 wheat plants were sampled and washed from the soil. For each plant, the degree of root rot damage was determined by categorical scaling from 0 (no signs of damage) to 4 (complete death of the root) in accordance with regulatory documents of registration tests in agriculture [43]. Based on the estimates obtained, the development of root rot was calculated using the following equation
R =   ( a · b ) · 100 N · K ,
where:
  • R—root rot development (%);
  • a—the number of plants with root rot;
  • b—the corresponding score;
  • N—number of collected plants;
  • K—the highest score on the categorical scale.
Incidence of root rot. The incidence of root rot was estimated as a percentage proportion of the number of plants with root rot to the number of collected plants.
Shoot and root mass. On days 0, 14, 42, and 77 of the experiment in each experimental plot, 30 plants were sampled, divided into shoot and root parts, and immediately weighed. The resulting estimates were calculated as the mean of 30 individual measurements.
Incidence of FHB in grain. On day 77, on each experimental plot, 25 wheat ears were sampled, and the number of grains with visible signs of FHB was counted. In accordance with “Guidelines for registration tests of pesticides in terms of biological effectiveness” [44], the incidence of FHB was estimated as the percentage of grains with visible signs of FHB.
DON and T2-toxin in grain. The DON and T2-toxin content in the grain was determined in the Stylab Laboratory (Moscow, Russia) accredited according to ISO 17025. Deoxynivalenol (DON) was determined by the use of the competitive ELISA test kit ‘Ridascreen® FAST DON’ (product No. R5902, R-Biopharm, Darmstadt, Germany). The sample extraction procedure was performed as follows: 5.0 g of milled grain were suspended with 100 mL distilled water and shaken for 10 min. The extract was filtered through a fluted filter and centrifuged. The supernatant was directly applied in the ELISA test (two replicates), which was performed according to the manufacturer’s procedure. The absorbance of the resulting dye was measured at 450 nm using a microplate reader (LEDETECT96, Biomed Dr. Wieser GmbH, Salzburg, Austria). The DON concentrations were calculated using RIDA® Soft Software (R-Biopharm). The lower limit of the working range for the determination of DON was 222 μg kg−1.
T2-toxin concentration was analyzed with an ELISA method (Ridascreen® T-2 toxin’, product No. R3801, R-Biopharm, Darmstadt, Germany). The ELISA analysis was performed according to the manufacturer’s instructions. Sample extraction was done by adding 25 mL of 70% methanol: distilled water to 5 g of milled grain. The mixture was shaken vigorously for 3 min, centrifuged for 10 min at 4000× g, and the supernatant was diluted 1 + 6 with dilution buffer (the kit component). An additional dilution of 1 + 9 with 10% methanol: PBS buffer (v/v) was made. The lower limit of the working range for the determination of T2-toxin was 35 μg kg−1.
Yield. The yield accounting was carried out on day 77 of the experiment. At each plot, wheat plants were collected from two randomly selected squares (0.25 m2 area). The collected sheaves were threshed, the resulting grain was weighed and recalculated in tons per hectare. The moisture content of the grain was 14%.
Total C and N contents in straw and compost were determined using Flash 1112 elemental analyzer (Thermo, Waltham, MA, USA) in the Joint Usage Center “Instrumental Methods in Ecology” at the A.N. Severtsov Institute of Ecology and Evolution, Russian Academy of Sciences, Moscow.

2.3. Identification and Counting of Fusarium Species in Soil and in Grain

For identification of Fusarium species occurring on the spikes, 100 grains were collected from each block, washed for 30 min with sterile water, placed on Petri dishes with sterile filter paper, and incubated at 23 °C for 72 h in the dark chamber. After incubation, the spores of Fusarium species were identified and counted on each grain using a microscope [45].
Fusarium-specific polysaccharide-protein conjugate was measured using a Fusarium antigen ELISA commercial test developed by XEMA company, Russia [46]. The test is based on the two-site sandwich enzyme immunoassay principle with rabbit affinity-purified antibodies and reflects the abundance of Fusarium-specific polysaccharide-protein conjugate in soil. This test recognizes the antigens of the mycelial form of the fungus with a very weak reaction with fungal spores [46]. The test provides arbitrary units of FPPC per gram (dried mass) of the substrate (a.u. g−2) that is considered as a proxy of Fusarium biomass.

2.4. Sampling and Identification of Invertebrates

Mesofauna. Soil animals from the size class of mesofauna were extracted from soil and mulch samples using Tullgren funnels and stored in 70% ethanol until identification (fresh mass of soil samples was 300 g; mulch samples were 50 g). Collected invertebrates were divided into five taxonomic groups: Collembola, Oribatida, Mesostigmata, Prostigmata, and “other soil mites”.
Macrofauna. Soil animals from the size class of macrofauna were extracted in the same manner as mesofauna members, but the mass of samples was larger (1000 g for soil and 200 g for mulch). Collected invertebrates were divided into the following taxonomic groups: Diplura, Protura, Pauropoda, Symphyla, Oniscidea, Gastropoda, Pseudoscorpiones, Araneae, Diplopoda, Geophilidae, Lithobiidae, Diptera (larvae), Staphylinidae (imago), Elateridae (larvae), Curculionidae (larvae and adults separately), other Coleoptera (larvae and adults separately), Formicidae, Heteroptera, Hymenoptera (larvae), Homoptera (Ortheziidae), Homoptera (Cicadellidae), Psocoptera, Thysanoptera.
Earthworms. Earthworms were collected by hand sorting two soil samples from each plot on each sampling day. Each sample was a soil cube measuring 25 cm3. Collected earthworms were identified to species level, and the wet weight of each specimen was measured.
Herpetobionts. Herpetobionts were sampled by Barber pitfall traps consisting of 94 mm diameter and 15 cm deep plastic jars. Three traps were installed on each experimental plot at the start of the experiment. The jars were filled with a 1:1 mixture of propylene glycol and water, and a detergent was added [47]. The traps were emptied on days 14, 42, and 77 of the experiment. Among collected herpetobionts, invertebrates from the following taxonomic groups were counted: Araneae, adult Staphylinidae, and adult Carabidae. Carabid beetles were identified to the species level. The counted number of herpetobionts in the sample was converted to the number of individuals per 100 trap days.
Hortobionts. Winter wheat hortobionts (arthropods living on the grassy plants) were sampled by the insect net mowing method at days 0, 42, and 77 in each experimental plot. Each sampling consisted of 20 sweeps by insect net (diameter 50 cm, handle length 1 m) and was carried out in the morning [29]. Collected invertebrates were stored in 70% ethanol until identification. Collected insects were identified to family, genus, or species level. Other taxonomic groups of hortobionts were rare. The number of hortobionts was reported directly as the number of individuals per sampling event.

2.5. Data Analysis

The abundances of mesofauna members, macrofauna members, earthworms, as well as biomass of Fusarium species in all samples were converted to a surface area basis (ind. m−2 or g m−2 for animals, and a.u. m−2 for Fusarium biomass). For this conversion, the mean soil density of 1.09 g cm−3 and the mean dry weight of the mulch (0.63 kg m−2 for N-poor mulch, 0.77 kg m−2 for N-medium mulch, and 1.07 kg m−2 for N-rich mulch) were used. For the data obtained from plots assigned to mulch addition, the sum of the abundances in mulch and soil samples was used in the analysis. Macrofauna members as well as hortobionts and herpetobionts were divided into trophic groups (phytophages, saprophages, and predators) based on their taxonomic identity (see Table S1 in Supplementary Materials for more details).
As FHB related study endpoints, the following five parameters were chosen: Fusarium biomass in grain, FHB in grain, T2-toxin in grain, total N in grain, and yield.
Before statistical analyses, the data on the abundance of soil fauna and Fusarium biomass estimated at each of the four sampling events were recalculated as integral mean values of abundance (IM) [35]. IM is numerically equal to the integrated taxon abundance throughout the experiment and in the physical sense represents the amount of “work” that was performed by the group. A statistical comparison of experimental outcomes was performed using the Kruskal-Wallis and Dunn tests. A statistical effect was considered significant at the level of α < 0.05. Data are reported as mean ± 1 SE.
To assess the impact of measured parameters on the FHB related study endpoints, linear mixed-effects modeling was performed [48,49,50]. In the model, the five study endpoints were fitted as dependent variables, and the factor “Block” was fitted as a random effect. Primarily, 30 factors included in the analysis were ranked by the sum of determination coefficient values (R2) obtained from significant linear regressions between individual tested factors and each of five FHB related study endpoints (Fusarium biomass in grain, FHB in grain, T2-toxin in grain, total N in grain, and yield). Based on the ranked list and ecological sense, 21 factors were included in further mixed-effects modeling. The selected parameters were used to construct a correlation matrix. Data on invertebrate abundance were log-transformed before analysis.
To disentangle the major drivers of the study endpoints, random-effects models were developed. The search for optimal models (one model per specific FHB related endpoint) was performed among linear mixed-effects models. The number of regressors (fixed effects) in the model was limited to two. Each regressor in the model could be a singular factor (single fixed effect), a statistical interaction of two factors, or a statistical interaction of any two factors. Pairs of factors were excluded from the analysis if their correlation exceeded 75%. The optimal linear random-effects model was identified by using covariate search adopted for ecological studies [50]. This method allows to considerably reduce the number of degrees of freedom in the final models thereby increasing the statistical power of results given the sampling effort.
Comparisons between means were done using Tukey’s test at the 0.05 significance p-level. Data were processed in R 3.5.0. The correlation matrix was calculated in the corrplot package [51]. Mixed-effects modeling was performed in the lme4 package [52].

3. Results

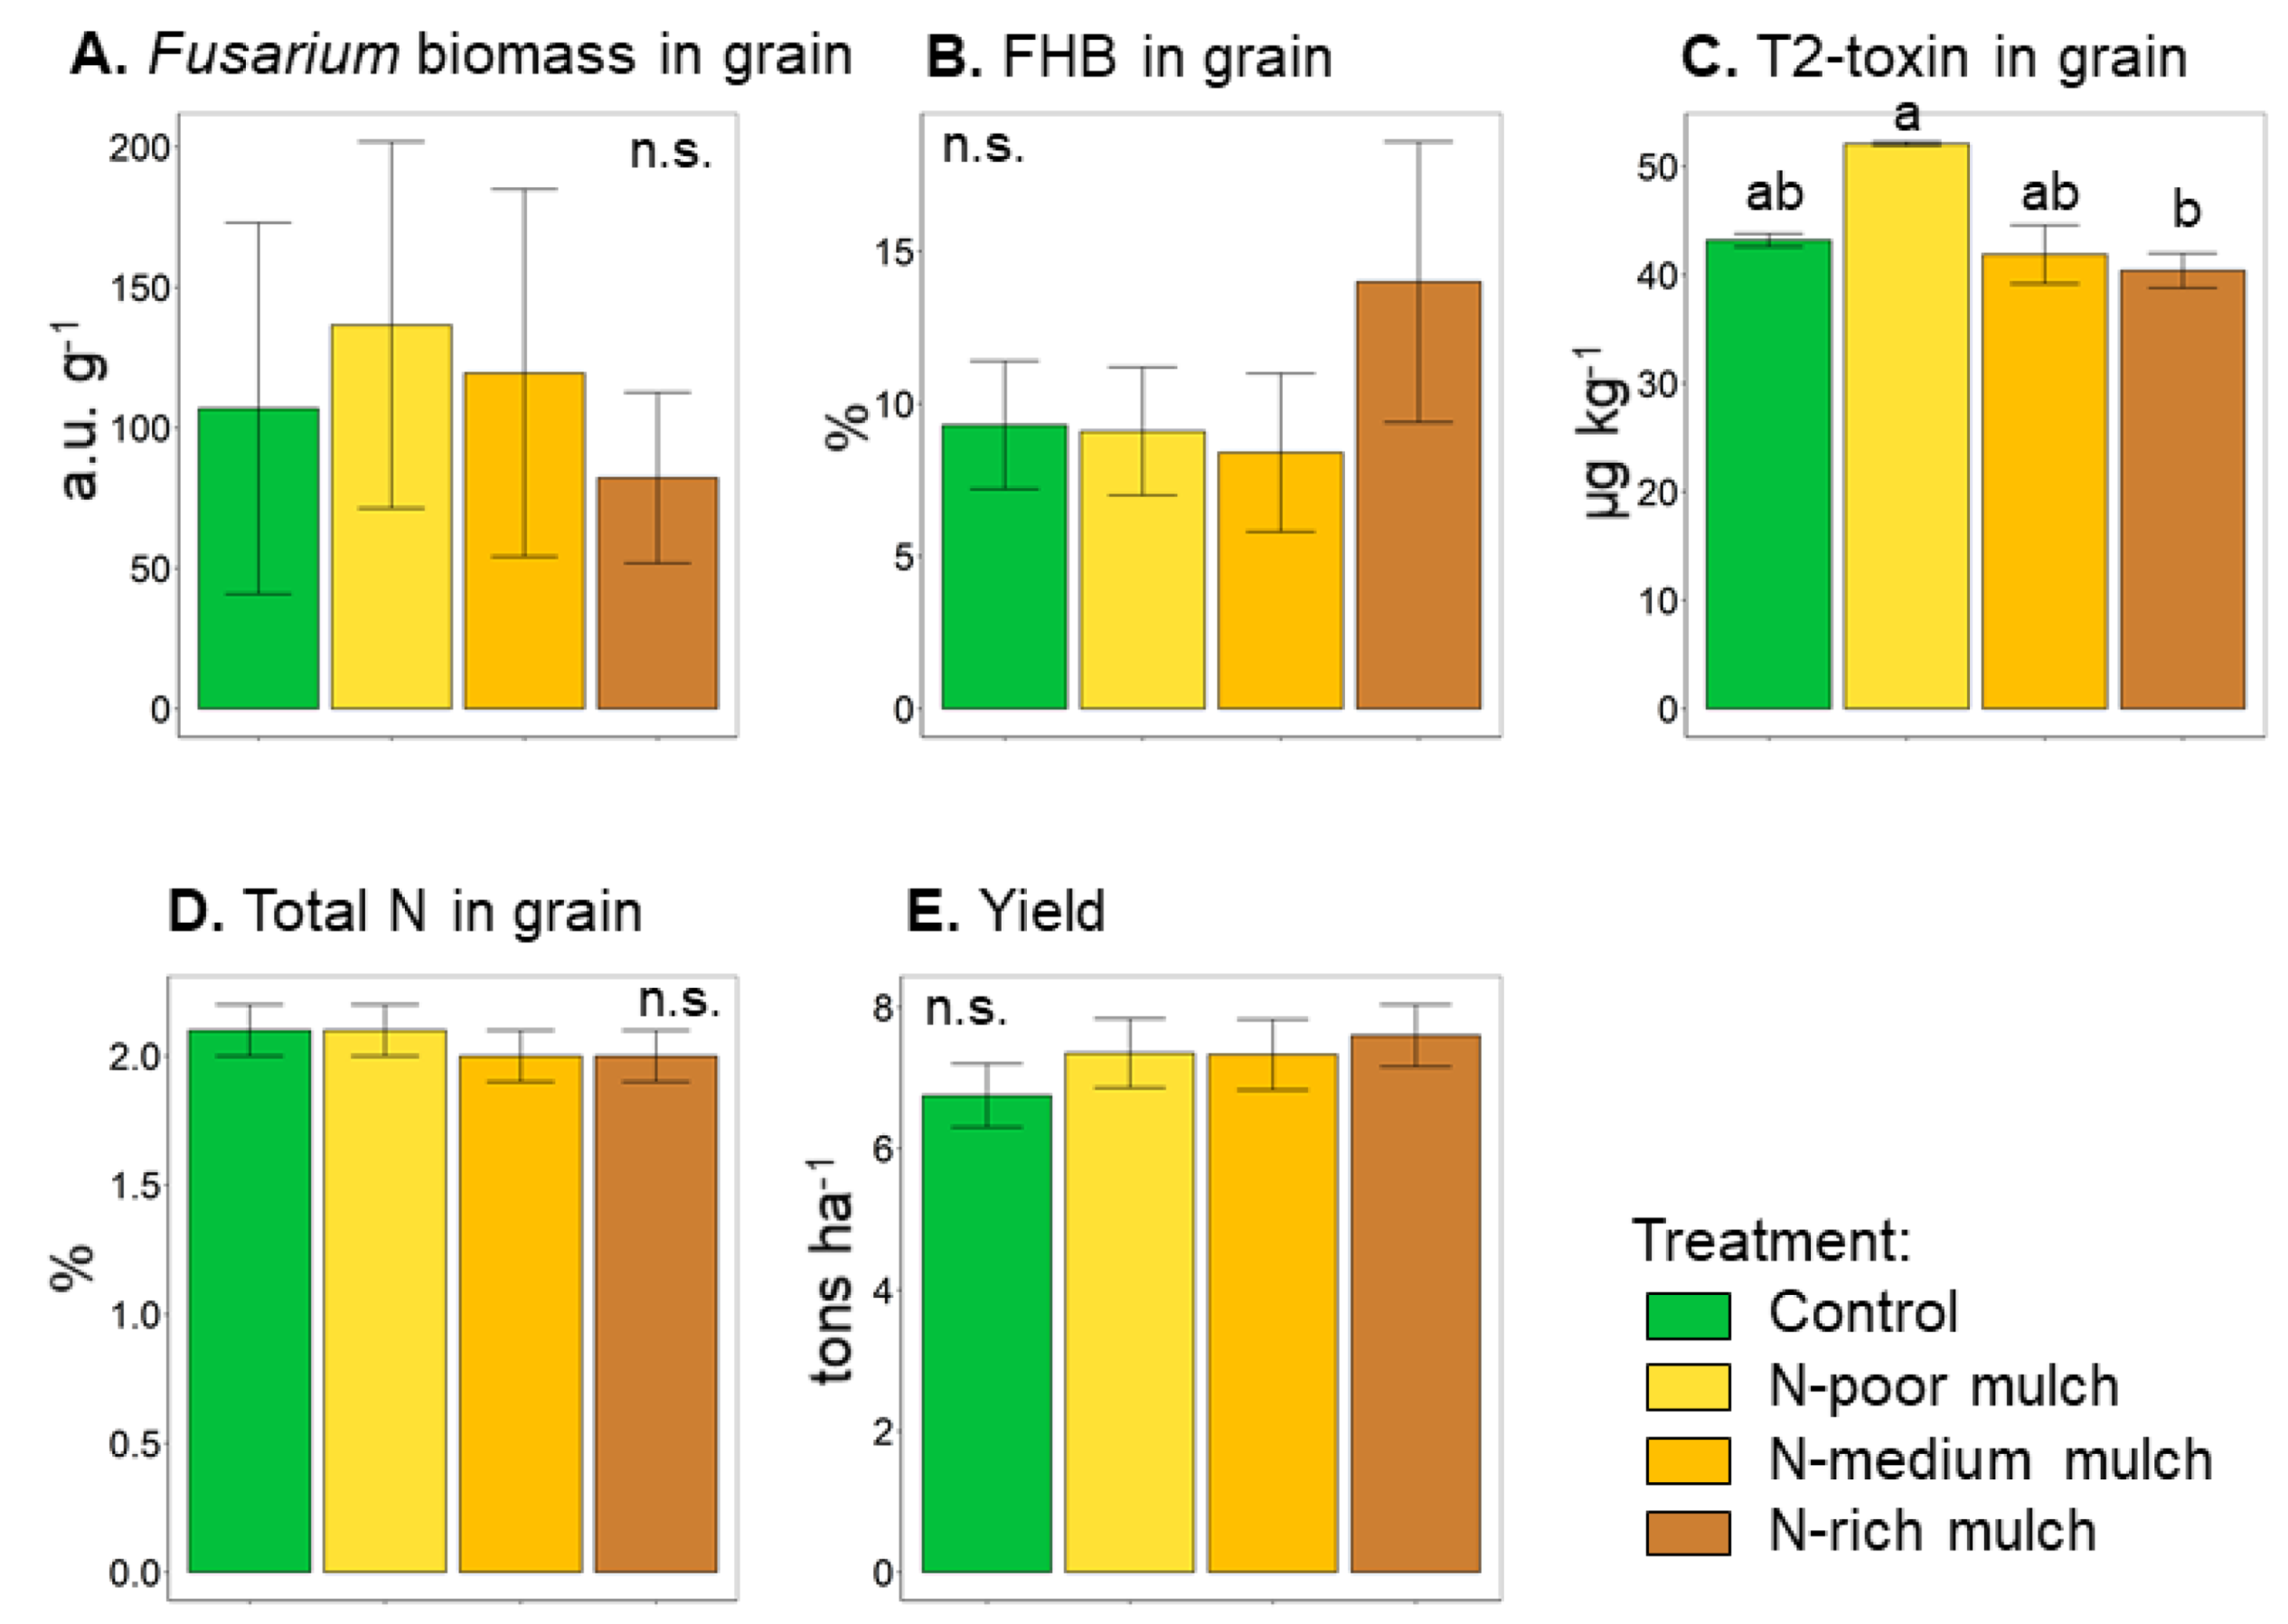
3.1. FHB Related Study Endpoints

The natural Fusarium infection was observed on collected grain. The analyzed grain was dominated by Fusarium graminearum (72% of identified Fusarium spores), and there were also F. sporotrichioides (11%) and F. langsethiae (7%). Among three tested mulch types, the narrowest C:N ratio of 25 was in N-rich mulch, and the broadest C:N ratio of 41 was observed in N-poor mulch (Table 1). Any of the five FHB related study endpoints differed significantly between control and mulch treatments (Figure 1). However, T2-toxin content in grain was significantly higher in N-poor treatment (52.1 ± 0.2 µg g−1) compared to N-rich treatment (40.4 ± 1.6 µg g−1) (Figure 1c, Table 2). DON content was below the lower limit of the working range for the determination in all grain samples tested (data not shown).

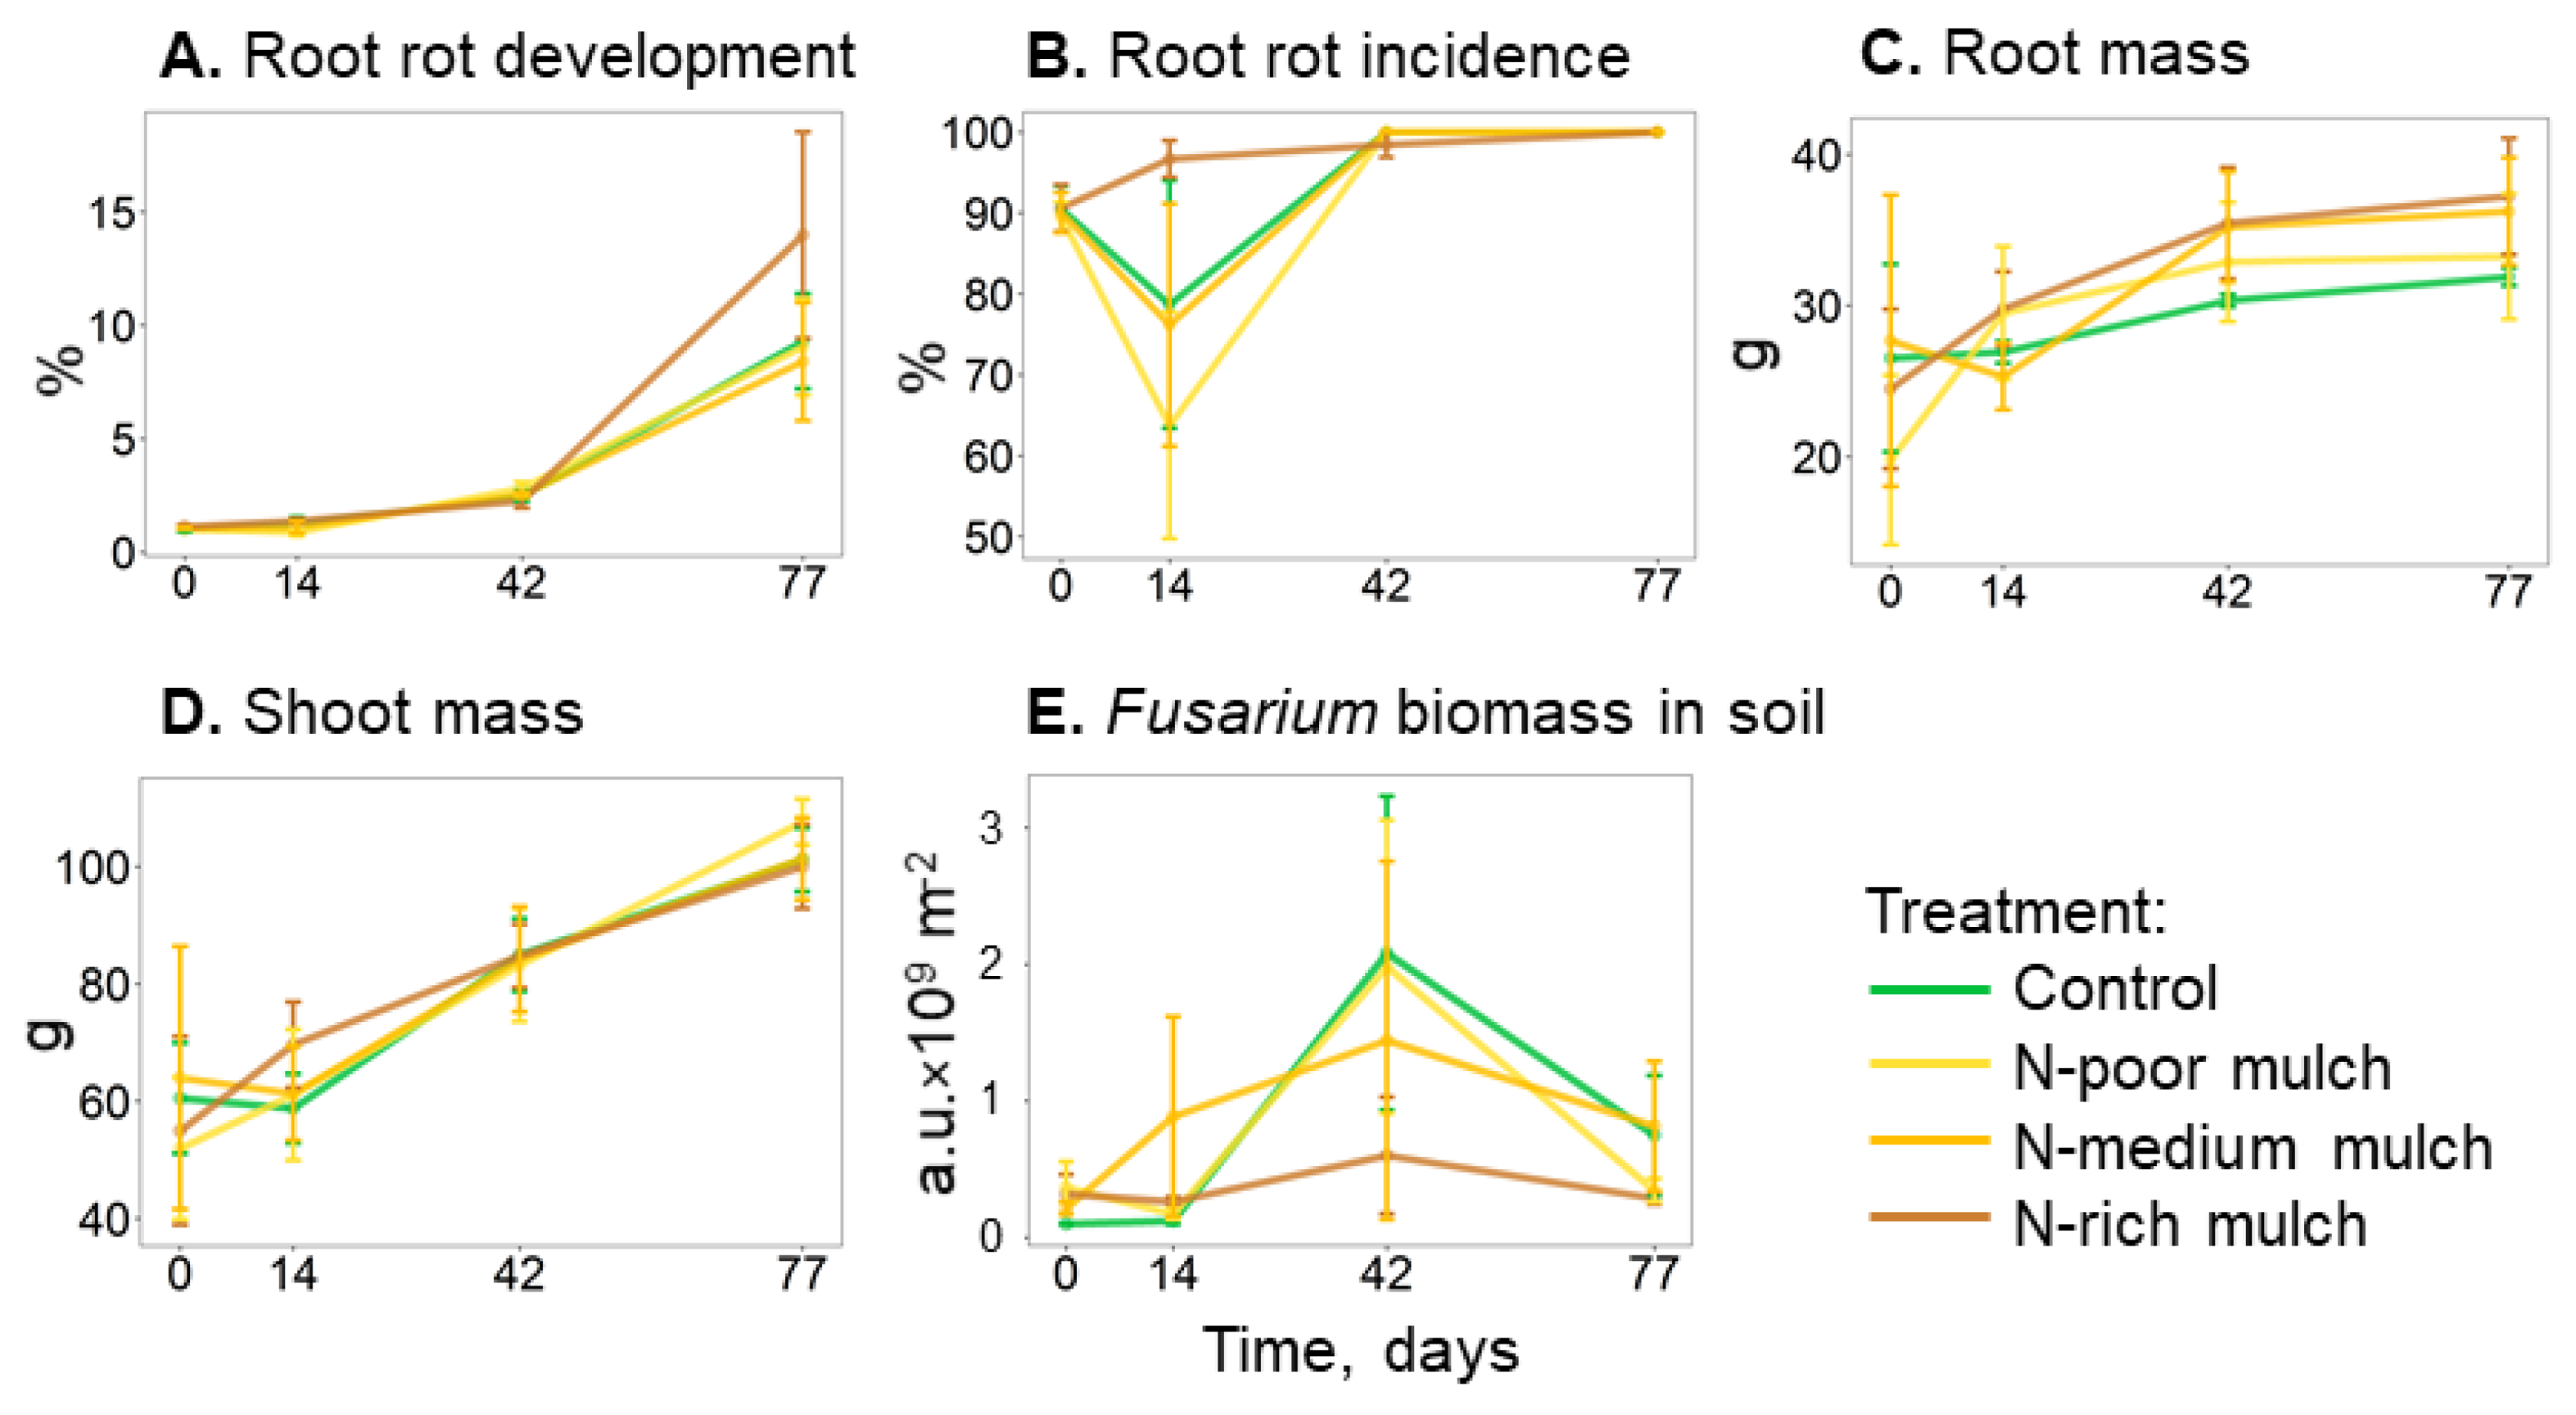
3.2. Dynamics of Plant Parameters and Fusarium Biomass

Dynamics of root rot development, root rot incidence, shoot mass and root mass of wheat plants as well as Fusarium biomass in soil did not differ among experimental treatments (Figure 2). Integral mean root mass was lower in control plots (29.4 ± 0.7 g) compared to the N-rich mulch treatment (33.3 ± 2.6 g) (Table 2).

3.3. Dynamics of Key Groups of Invertebrates

The total abundance of hortobionts decreased significantly by 50% in the N-medium mulch treatment compared to the control (Table 2). This difference was associated with a drop in the mean abundance of phytophagous hortobionts that were significantly lower in N-medium mulch treatment (9.0 ± 1.8 ind. 100 traps−1 day−1) compared to the control (19.9 ± 2.9 ind. 100 traps−1 day−1) (Table 2, Figure 3b). Among hortobionts, phytophages occupied more than 90% of total abundance (Figure 3a,b), among them herbivorous beetles (fam. Chrysomelidae) and bugs (fam. Lygaeidae, Miridae) predominated.
Neither the total abundance of herpetobionts nor the predatory and phytophagous trophic groups of herpetobionts had significant differences between the experimental treatments (Table 2, Figure 3d–f).
Population dynamics of the total mesofauna showed remarkable growth, by 30–40%, in all tested mulch treatments (Table 2, Figure 3g). This growth was associated with an increase in the abundance of Prostigmata mites and Collembola (Figure 3i,j). Integral mean abundance of Prostigmata mites (Table 2, Figure 3j) was significantly higher in N-rich, N-medium, and N-poor mulch treatments (17.9 ± 2.3, 17.1 ± 3.1, and 17.7 ± 3.2 ind × 103 m−2, respectively) compared to the control (10.3 ± 0.3 ind × 103 m−2). Integral mean abundance of Collembola (Table 2, Figure 3i) was insignificantly higher in N-medium and N-poor mulch treatments (23.4 ± 8.3, and 21.9 ± 6.4 ind × 103 m−2, respectively) compared to the control (14.1 ± 5.1 ind × 103 m−2).
The total abundance of macrofauna, as well as the tested trophic groups of the macrofauna representatives, did not differ significantly between experimental treatments (Table 2, Figure 3k–n).
The integral mean biomass of earthworms Dendrobaena schmidti (Table 2, Figure 3r) was significantly higher in N-poor mulch treatments (9.0 ± 1.5 g m−2) and was close to a significant level (p = 0.061) in N-medium mulch treatment (6.8 ± 1.0 g m−2) compared to the control (3.7 ± 2.1 g m−2).

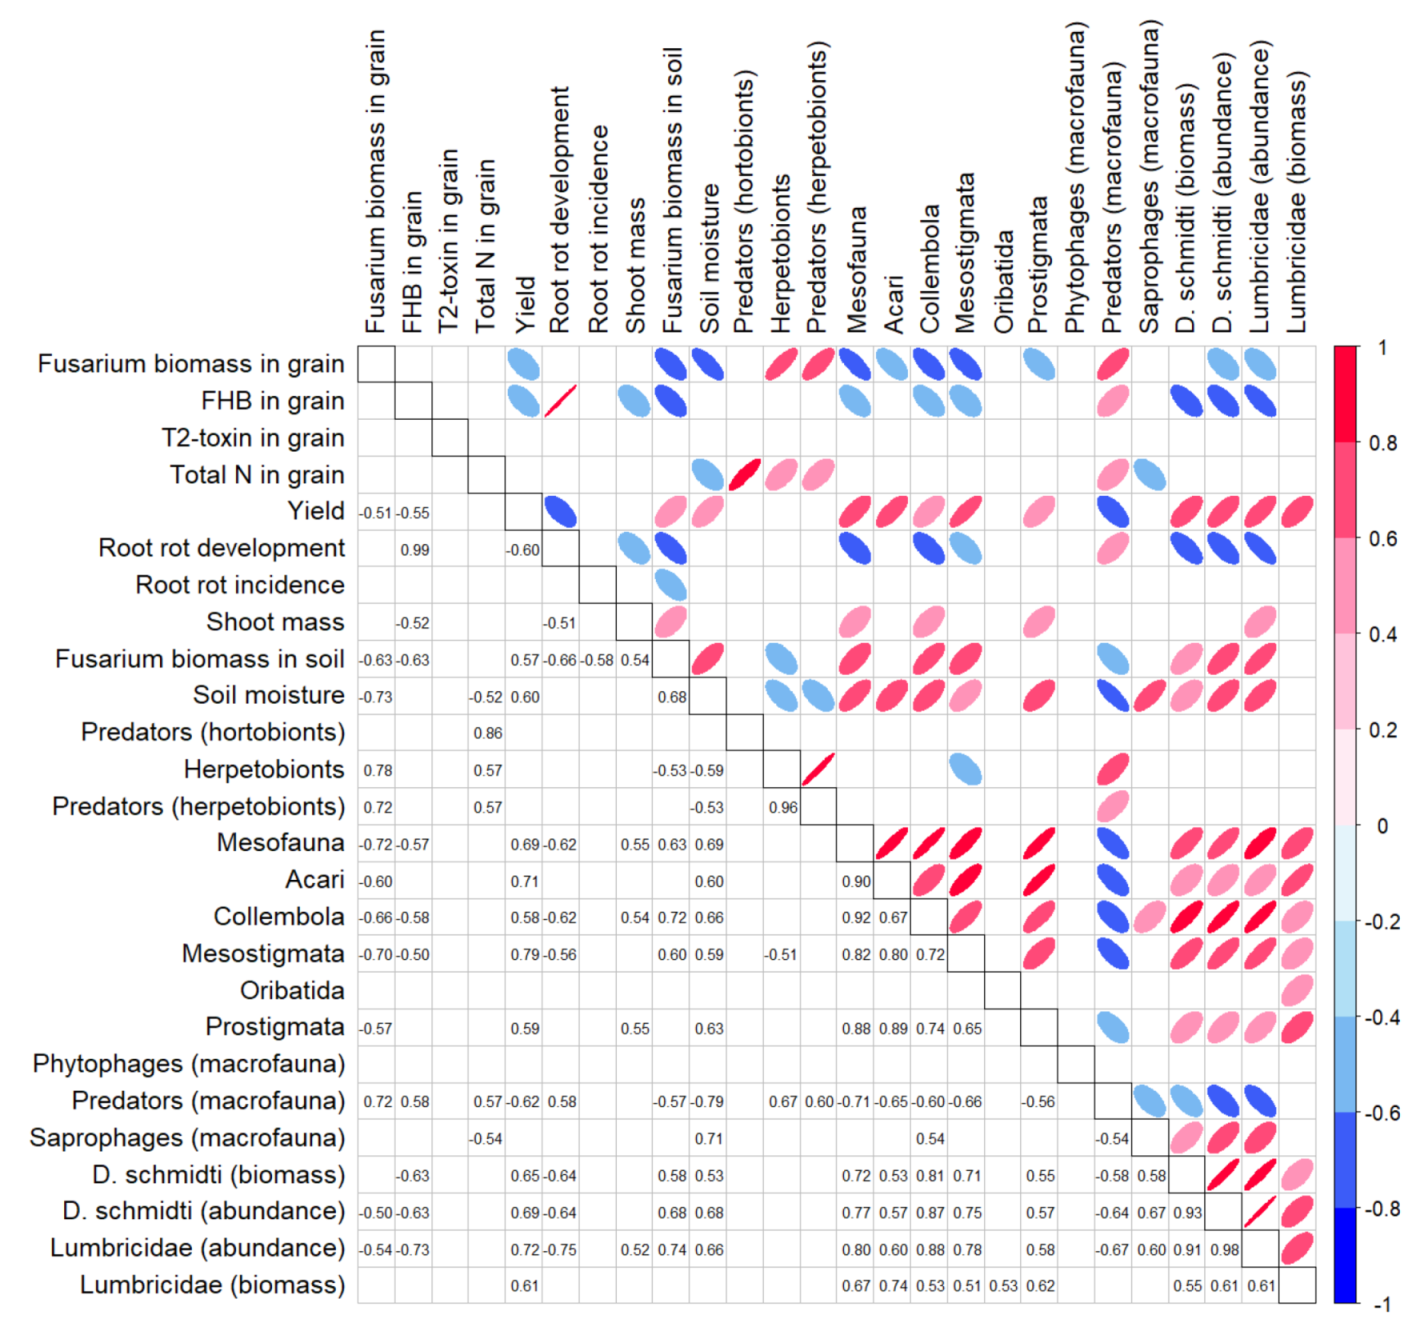
3.4. Relationship of FHB Related Study Endpoints with Other Ecosystem Parameters

Across all ecosystem parameters tested, factors such as “Root rot development”, “Biomass of D. schmidti”, “Abundance of Lumbricidae”, “Mesostigmata mites”, and “Predatory macrofauna “had the highest level of statistical significance as a single predictor (Table 3). In contrast, “Phytophagous herpetobionts”, “Hortobionts”, “Phytophagous hortobionts”, “Macrofauna”, “Root mass” were not significant as single predictors in all developed regressions (Table 3). Correlations between the five FHB-related study endpoints were weak (Figure 4).

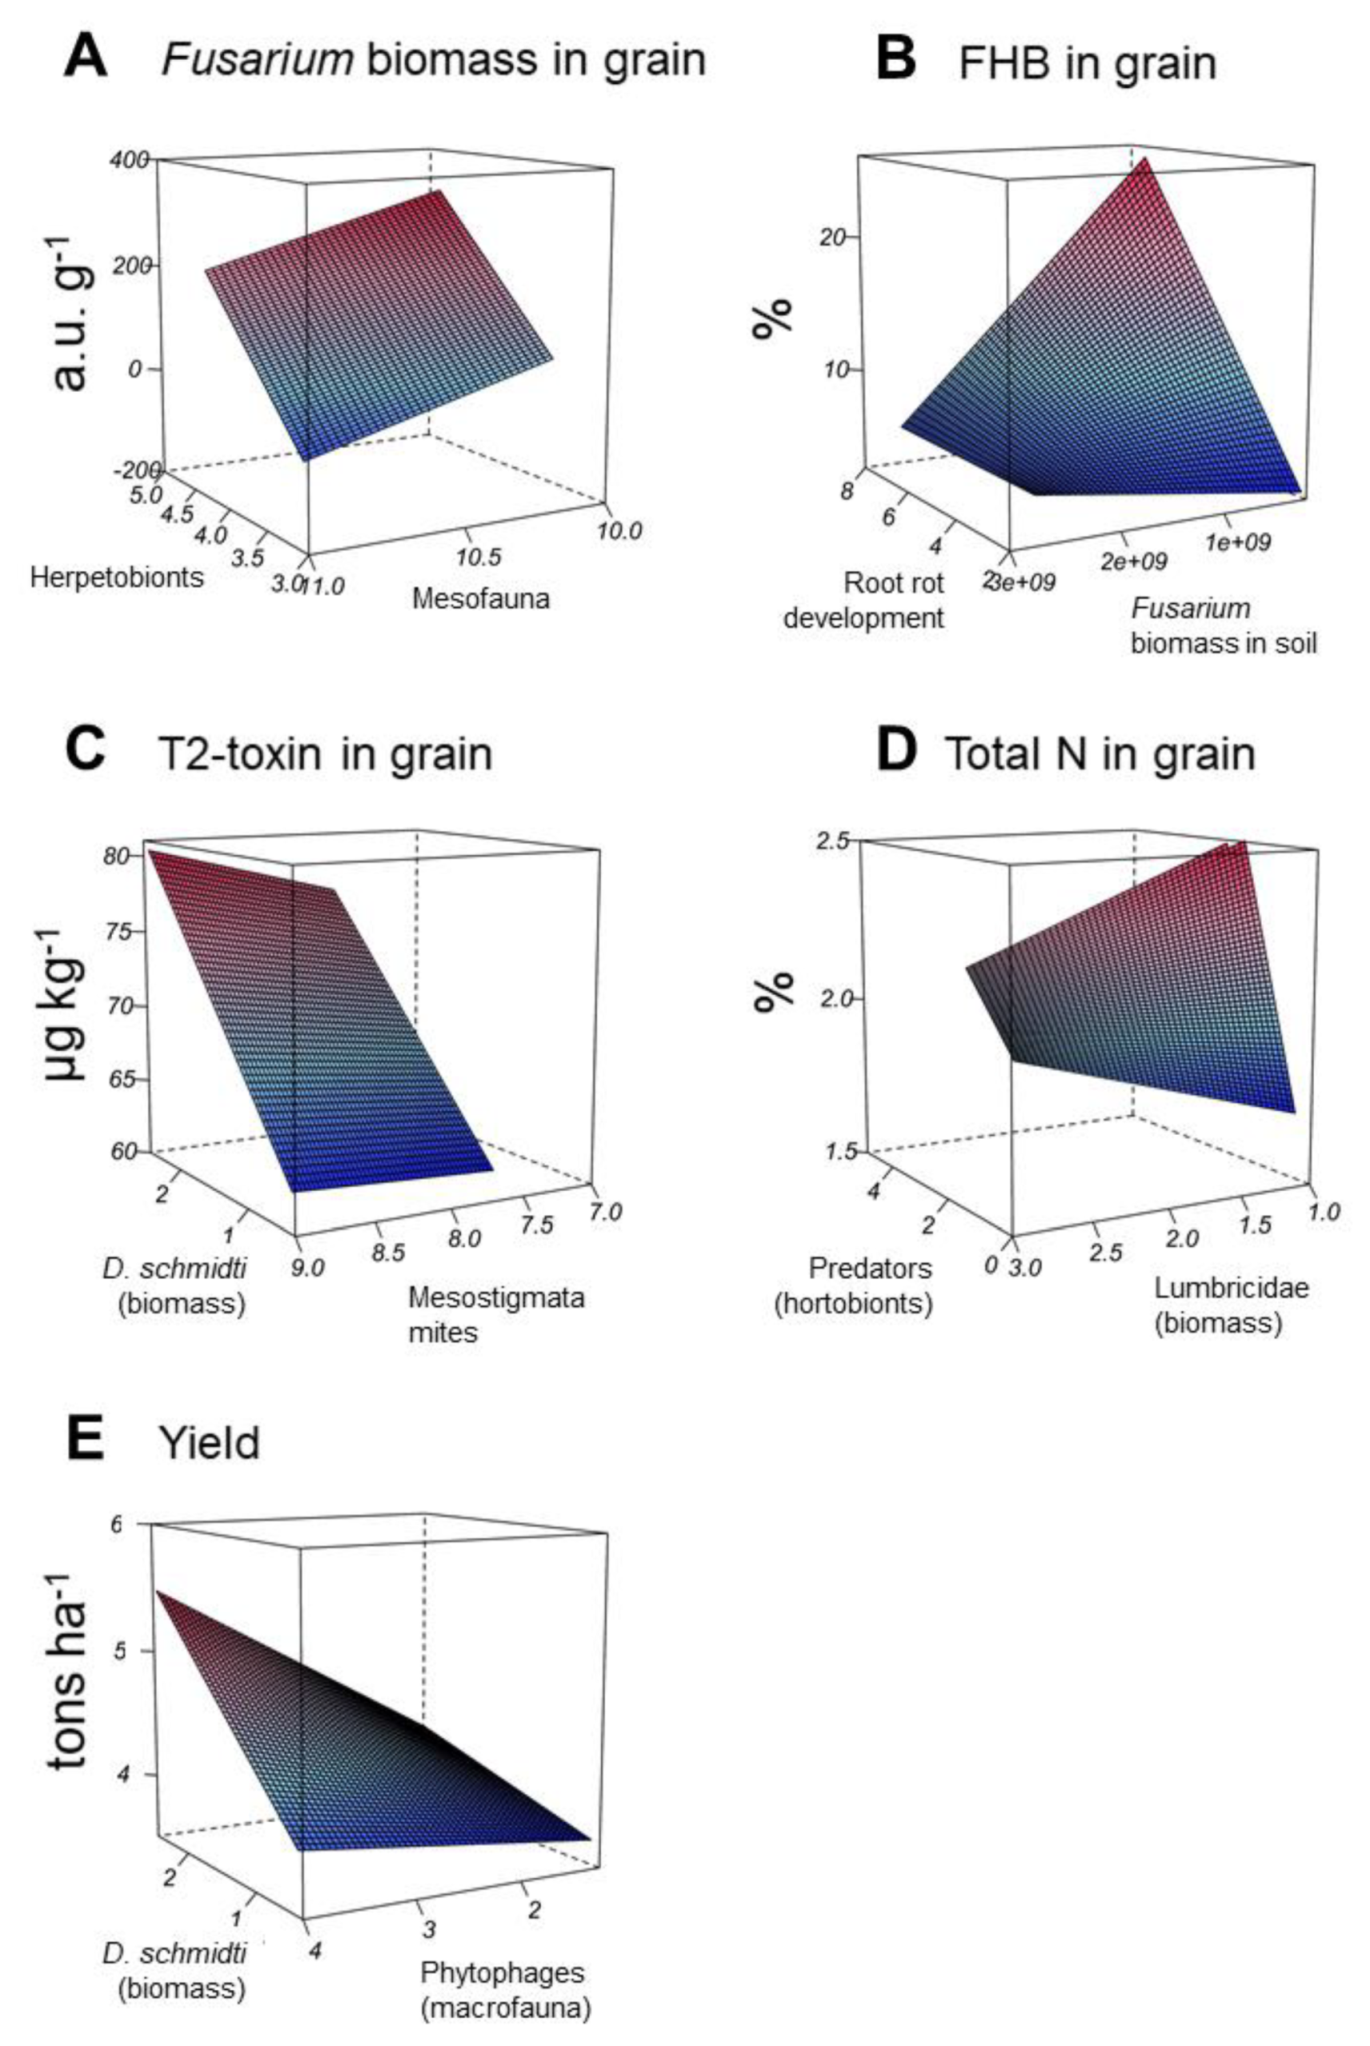
3.5. Linear Random-Effects Models for the Five FHB Related Study Endpoints

The optimal model for the Fusarium biomass in grain included two regressors: “Herpetobionts” and “Mesofauna” (Table 4). In this model, the contribution of all regressors (excluding random effects) explains 66% of the observed variance. The “Herpetobionts”, as well as “Mesofauna” regressors, were positively associated with Fusarium biomass in grain (Figure 5a). These factors did not affect the Fusarium biomass in grain interactively (Table 4).
The optimal model for FHB in grain included three regressors: “Root rot development”, “Fusarium biomass in soil” and “Root rot development × Fusarium biomass in soil”. The contribution of all regressors (excluding random effects) to the explained variance observed in this model was 66% (Table 4). The regressor “Root rot development” was positively associated with the FHB in grain (Figure 5b). On the contrary, the interactive regressor “Root rot development × Fusarium biomass in soil” negatively influenced FHB in grain (Figure 5b). This interaction had a strong impact on the manifestation of FHB in grain and was dependent on the variables “Root rot development” and “Fusarium biomass in soil”. When Fusarium biomass in soil was high, FHB in grain remained at low values regardless of root rot development. On the other hand, when Fusarium biomass in soil was low, FHB in grain realized very fast growth with increased development of root rot (Figure 5b).
The optimal model for the T2-toxin in grain included one regressor: “Biomass of D. schmidti × Phytophagous macrofauna” (Table 4). The contribution of this regressor to the explanation of observed variance in the model was 47%. Two variables forming the model regressor demonstrated a mutually reinforcing type of interaction. When at least one of these variables has a low value, the T2-toxin content in grain is also low (Figure 5c). While simultaneous increases of these variables were associated with a pronounced gain in the T2-toxin content in grain (Figure 5c).
The optimal model for the total N in grain included the following regressors: “Predatory herpetobionts”, “Biomass of Lumbricidae” and “Predatory herpetobionts × Biomass of Lumbricidae” (Table 4). Both “Predatory herpetobionts” and “Biomass of Lumbricidae” regressors had a positive influence on total N in grain. While their interactive regressor “Predatory herpetobionts × Biomass of Lumbricidae” was negatively associated with the N content in grain (Figure 5d). This interaction made the N content in grain insensitive to changes in the abundance of predatory herpetobionts in the low total biomass of Lumbricidae (Figure 5d).
The optimal yield model consisted of one regressor: “Biomass of D. schmidti × Mesostigmata mites”. The contribution of this regressor to the explanation of observed variance in the model was low and amounted to 29% (Table 4). The interaction between variables was weak, which resulted in a close-to-flat surface of the yield, dependent on the variables “Biomass of D. schmidti” and “Mesostigmata mites” (Figure 5e).

4. Discussion

Our study quantitatively illustrates that the interplay of abundancies of several ecological groups of soil invertebrates, herpetobionts, and hortobionts can be considered important predictors of variance of winter wheat FHB (Table 4, Figure 5). To our knowledge, this is the first successful attempt to prove the existence of, specify and quantitatively estimate the novel mechanism behind the relationship between detrital wood webs and winter wheat FHB. However, since these results were based on measurements taken over a single year, this can be considered a limitation in our study.

4.1. Effect of Mulching on Soil Food Webs

Among the three mulch types, only N-medium mulch reduced the abundance of phytophagous hortobionts represented by insects inhabiting wheat shoots (Table 2, Figure 3b). This result is in agreement with earlier results of experiments carried out on planted vegetables [23]. The authors explained the effect of adding a detrital subsidy on phytophagous insects by a trophic cascade [53]. However, in our work, a decrease in the number of phytophages in the N-medium treatment was not accompanied by a decrease in the number of predatory herpetobionts (Table 2, Figure 3f), while an insignificant increase in the abundance of saprotrophic macrofauna was noted (Figure 3n). A possible explanation for the changes in terrestrial ecosystem functioning caused by the addition of N-medium mulch is the compartmentalization of detrital food webs [54,55]. In this case, not all species from the groups of herpetobionts and macrofauna were associated with additional energy inputs from the detrital subsidy, and as a result, their abundance did not change with the addition of mulch. At the same time, based on the weak changes in the abundance of herpetobionts and macrofauna in all mulch treatments (Table 2, Figure 3), the proportion of species associated with the carbon from plant residues in these groups was small. These results are in agreement with the known ability of herpetobionts [56,57,58] and large soil insects [59,60] to migrate over long distances, thereby not having strong trophic connections with local food resources.
Most of the collected earthworms species were epigeic [61]. They feed on plant litter and avoid substrates with a high nitrogen content [62]. In accordance with their ecological characteristics, the most abundant species in our experiment was the earthworm D. schmidti, which demonstrated a significant increase in biomass with the addition of N-poor mulch and a downward trend in biomass change with a decrease in the C:N ratio in mulch (Table 2).
In contrast to larger invertebrates, the mesofauna members, especially Prostigmata mites and Collembola, demonstrated a significant increase in abundance in all mulch treatments (Table 2, Figure 3i,j). This observation is in agreement with the previous results [35]. The trophic preferences of Prostigmata mites are diverse, however, in agroecosystems, most Prostigmata are mycophages and saprophages [63,64,65]. Therefore, a twofold increase in the number of Prostigmata can be considered an indicator of an increase in the abundance of saprotrophic mycobiota. In this case, the observed trend of a decrease in the biomass of Fusarium species in the soil after mulch addition (Table 2, Figure 2e) can be explained by the feeding activity of soil mycophages including Prostigmata mites [66] and competition with saprotrophic mycobiota [67].

4.2. FHB Transmission Routes Associated with Soil Food Webs

Fusarium head blight is caused by a complex of species with various ecological properties [1] and leads to deterioration of a number of crop properties, mainly the accumulation of mycotoxins in the grain [5]. Since our selected five FHB-related endpoints of the study had an insignificant or weak correlation (Figure 4), it can be assumed that the negative impact of FHB on the yield is mediated by several independent mechanisms. This is consistent with the results that some FHB fungicides (quinone outside inhibitors) were reported to be associated with increased levels of deoxynivalenol in grain harvested from FHB-affected plants [7].
An accurate description of these mechanisms is beyond the scope of the experiment. However, the obtained modeling results can be used to describe the key properties of these mechanisms, using soil invertebrates as indicators of the driving processes.
Herpetobionts (with the exception of granivorous ground beetles) and soil mesofauna are considered neutral elements of the agroecosystems in relation to crops [20]. However, the abundance of these groups was positively associated with an increase in Fusarium biomass in grain (Figure 5a). It is well known that many Collembola species [68,69] and most herpetobionts, in particular ground beetles and rove beetles [70,71], climb wheat flowers during flowering to feast on pollen, which is rich in proteins [72]. The transmission of spores of pathogenic fungi has been shown for Tyrophagus putrescentiae mites, which significantly induced the mycotoxin production of aflatoxin and zearalenone in stored grain [73]. Thus, our results indicate that herpetobionts and mesofauna can carry spores of Fusarium species and infect flowering shoots of wheat.
At first glance, the positive effect of epigeic species D. schmidti on the T2-toxin content in grain contradicts numerous observations on the inhibitory effect of earthworms on Fusarium species [27]. However, data on the negative impact on Fusarium were obtained mainly for anecic earthworms that differ in their trophic habits compared to epigeic earthworms [62]. In addition, our model included the interaction of epigeic earthworms and soil phytophages from the macrofauna size class (Table 4) and was associated with the strongest accumulation of T2-toxin in grain. These results suggest that the content of T2-toxin in grain is regulated by processes associated with the state of the plant rhizosphere. This is because the greatest activity of both epigeic earthworms and soil phytophages occurs in the rhizosphere [74]. An increase in the abundance of soil phytophages likely leads to suppression of plant immunity and damage by phytopathogenic microorganisms [75,76]. At the same time, the production of mycotoxins by Fusarium species in grain also performs a protective function against other phytopathogens [1]. Therefore, additional infection of FHB-affected wheat with phytopathogens can lead to an increase in the T2-toxin content in grain.
The manifestation of visible signs of FHB (Figure 5b) was associated with the development of root rot and the Fusarium biomass in the soil. It is well known that the visible signs of FHB in a head of grain do not reflect the content of toxins in the grain [1]. Based on the model we obtained, we can estimate that the increase in the incidence of visible signs of FHB on the grain head reflects favorable environmental conditions (primarily soil moisture) for the reproduction of soil fungi occurring in the agroecosystem. Grain quality (Figure 5d) and quantity (Figure 5e) characteristics were associated with the increase in abundance of earthworms as well as predatory invertebrates feeding on phytophagous insects. These results are in full agreement with the known patterns of functioning agroecosystems [20].

5. Conclusions

The structure of detrital food webs in the studied treatments changed significantly after the addition of mulch; the abundance of soil saprophages and mycophages increased up to 50%. However, at the level of trophic groups, soil invertebrates (with the exception of earthworms) were insensitive to C:N ratio in the detrital subsidy experiments.
Yield did not differ significantly among tested treatments. The natural content of T2-toxin in grain was significantly higher in N-poor treatment (52.1 ± 0.2 µg g−1) compared to N-rich treatment (40.4 ± 1.6 µg g−1). Results of statistical modeling suggest that an increase in T2-toxin content in grain can be triggered by the grazing activity of soil phytophagous invertebrates.
These results suggest the occurrence of a mechanism of FHB infection of wheat by transfer of spores by soil invertebrates while feeding on wheat pollen.

Supplementary Materials

The following supporting information can be downloaded at: https://www.mdpi.com/article/10.3390/agronomy12020393/s1, Table S1: List of taxa of collected invertebrates assigned to ecological and trophic groups.

Author Contributions

Conceptualization and methodology, A.A.G., V.A.L. and G.V.V.; software, A.A.G.; validation, O.L.R.; formal analysis, A.A.G.; investigation, A.D.K., K.A.M., I.V.S., V.N.M., O.O.M. and I.B.R.; resources, V.A.L. and G.V.V.; data curation, A.G.I. and I.B.R.; writing—original draft preparation, A.A.G.; writing—review and editing, A.A.G. and O.L.R.; visualization, A.A.G.; supervision, G.V.V.; project administration, A.A.G.; funding acquisition, A.A.G. All authors have read and agreed to the published version of the manuscript.

Funding

The study was carried out with the financial support of the Russian Foundation for Basic Research and the Tyumen Region within the framework of project No. 20-41-720005.

Institutional Review Board Statement

Not applicable.

Informed Consent Statement

Not applicable.

Data Availability Statement

Not applicable.

Acknowledgments

The authors sincerely thank Alexander Galkin, Stylab LLC (Moscow, Russia) for analysis of grain for DON and T-2 toxin contamination. Jacob Wickham kindly improved the English of the advanced draft.

Conflicts of Interest

The authors declare no conflict of interest.

References

  1. Smith, S.N. An Overview of Ecological and Habitat Aspects in the Genus Fusarium with Special Emphasis on the Soil-Borne Pathogenic Forms. Plant Pathol. Bull. 2007, 16, 97–120. [Google Scholar]
  2. Bianchini, A.; Horsley, R.; Jack, M.M.; Kobielush, B.; Ryu, D.; Tittlemier, S.; Wilson, W.W.; Abbas, H.K.; Abel, S.; Harrison, G.; et al. DON Occurrence in Grains: A North American Perspective. Cereal Foods World 2015, 60, 32–56. [Google Scholar] [CrossRef] [Green Version]
  3. Mielniczuk, E.; Skwarylo-Bednarz, B. Fusarium Head Blight, Mycotoxins and Strategies for Their Reduction. Agronomy 2020, 10, 509. [Google Scholar] [CrossRef] [Green Version]
  4. Gagkaeva, T.Y.; Gavrilova, O.P.; Levitin, M.M.; Novozhilov, K.V. Head blight of cereal crops. Suppl. J. Zashchita Karantin Rastenij 2011, 5, 112. [Google Scholar]
  5. Karlsson, I.; Persson, P.; Friberg, H. Fusarium Head Blight from a Microbiome Perspective. Front. Microbiol. 2021, 12, 371. [Google Scholar] [CrossRef]
  6. Sutton, J.C. Epidemiology of Wheat Head Blight and Maize Ear Rot Caused by Fusarium Graminearum. Can. J. Plant Pathol. 1982, 4, 195–209. [Google Scholar] [CrossRef]
  7. Paul, P.A.; Bradley, C.A.; Madden, L.V.; Lana, F.D.; Bergstrom, G.C.; Dill-Macky, R.; Esker, P.D.; Wise, K.A.; McMullen, M.; Grybauskas, A. Meta-Analysis of the Effects of QoI and DMI Fungicide Combinations on Fusarium Head Blight and Deoxynivalenol in Wheat. Plant Dis. 2018, 102, 2602–2615. [Google Scholar] [CrossRef] [Green Version]
  8. Legrand, F.; Picot, A.; Cobo-Díaz, J.F.; Chen, W.; Le Floch, G. Challenges Facing the Biological Control Strategies for the Management of Fusarium Head Blight of Cereals Caused by F. Graminearum. Biol. Control 2017, 113, 26–38. [Google Scholar] [CrossRef]
  9. Riungu, G.M.; Muthomi, J.W.; Narla, R.D.; Wagacha, J.M.; Gathumbi, J.K. Management of Fusarium Head Blight of Wheat and Deoxynivalenol Accumulation Using Antagonistic Microorganisms. Plant Pathol. J. 2008, 7, 13–19. [Google Scholar] [CrossRef] [Green Version]
  10. Brandt, S.C.; Brognaro, H.; Ali, A.; Ellinger, B.; Maibach, K.; Rühl, M.; Wrenger, C.; Schlüter, H.; Schäfer, W.; Betzel, C. Insights into the Genome and Secretome of Fusarium Metavorans DSM105788 by Cultivation on Agro-Residual Biomass and Synthetic Nutrient Sources. Biotechnol. Biofuels 2021, 14, 74. [Google Scholar] [CrossRef]
  11. Suproniene, S.; Kadziene, G.; Irzykowski, W.; Sneideris, D.; Ivanauskas, A.; Sakalauskas, S.; Serbiak, P.; Svegzda, P.; Auskalniene, O.; Jedryczka, M. Weed Species within Cereal Crop Rotations Can Serve as Alternative Hosts for Fusarium Graminearum Causing Fusarium Head Blight of Wheat. Fungal Ecol. 2019, 37, 30–37. [Google Scholar] [CrossRef]
  12. Khan, M.K.; Pandey, A.; Athar, T.; Choudhary, S.; Deval, R.; Gezgin, S.; Hamurcu, M.; Topal, A.; Atmaca, E.; Santos, P.A.; et al. Fusarium Head Blight in Wheat: Contemporary Status and Molecular Approaches. 3 Biotech 2020, 10, 172. [Google Scholar] [CrossRef]
  13. Goncharov, A.A.; Glebova, A.A.; Tiunov, A.V. Trophic Interactions between Fusarium Species and Soil Fauna: A Meta-Analysis of Experimental Studies. Appl. Soil Ecol. 2020, 145, 103343. [Google Scholar] [CrossRef]
  14. Goncharov, A.A.; Gorbatova, A.S.; Sidorova, A.A.; Tiunov, A.V.; Bocharov, G.A. Mathematical Modelling of the Interaction of Winter Wheat (Triticum Aestivum) and Fusarium Species (Fusarium Spp.). Ecol. Model. 2022, 465, 109856. [Google Scholar] [CrossRef]
  15. Matarese, F.; Sarrocco, S.; Gruber, S.; Seidl-Seiboth, V.; Vannacci, G. Biocontrol of Fusarium Head Blight: Interactions between Trichoderma and Mycotoxigenic Fusarium. Microbiology 2012, 158, 98–106. [Google Scholar] [CrossRef] [PubMed]
  16. Błaszczyk, L.; Basińska-Barczak, A.; Ćwiek-Kupczyńska, H.; Gromadzka, K.; Popiel, D.; Stępień, Ł. Suppressive Effect of Trichoderma Spp. on Toxigenic Fusarium Species. Pol. J. Microbiol. 2017, 66, 85–100. [Google Scholar] [CrossRef] [Green Version]
  17. Moody, S.A.; Piearce, T.G.; Dighton, J. Fate of Some Fungal Spores Associated with Wheat Straw Decomposition on Passage through the Guts of Lumbricus Terrestris and Aporrectodea Longa. Soil Biol. Biochem. 1996, 28, 533–537. [Google Scholar] [CrossRef]
  18. Sabatini, M.A.; Innocenti, G. Soil-Borne Plant Pathogenic Fungi in Relation to Some Collembolan Species under Laboratory Conditions. Mycol. Res. 2000, 104, 1197–1201. [Google Scholar] [CrossRef]
  19. Bonkowski, M.; Griffiths, B.S.; Ritz, K. Food Preferences of Earthworms for Soil Fungi. Pedobiologia 2000, 44, 666–676. [Google Scholar] [CrossRef]
  20. Wardle, D.A.; Bardgett, R.D.; Klironomos, J.N.; Setälä, H.; Van Der Putten, W.H.; Wall, D.H. Ecological Linkages between Aboveground and Belowground Biota. Science 2004, 304, 1629–1633. [Google Scholar] [CrossRef] [PubMed]
  21. Moore, J.C.; McCann, K.; Setälä, H.; De Ruiter, P.C. Top-down Is Bottom-up: Does Predation in the Rhizosphere Regulate Aboveground Dynamics? Ecology 2003, 84, 846–857. [Google Scholar] [CrossRef]
  22. Riggi, L.G.; Bommarco, R. Subsidy Type and Quality Determine Direction and Strength of Trophic Cascades in Arthropod Food Webs in Agroecosystems. J. Appl. Ecol. 2019, 56, 1982–1991. [Google Scholar]
  23. Halaj, J.; Wise, D.H. Impact of a Detrital Subsidy on Trophic Cascades in a Terrestrial Grazing Food Web. Ecology 2002, 83, 3141–3151. [Google Scholar] [CrossRef]
  24. Wilschut, R.A.; Geisen, S. Nematodes as Drivers of Plant Performance in Natural Systems. Trends Plant Sci. 2021, 26, 237–247. [Google Scholar] [CrossRef]
  25. Wolfarth, F.; Schrader, S.; Oldenburg, E.; Weinert, J. Nematode–Collembolan-Interaction Promotes the Degradation of Fusarium Biomass and Deoxynivalenol According to Soil Texture. Soil Biol Biochem 2013, 57, 903–910. [Google Scholar] [CrossRef]
  26. Wolfarth, F.; Wedekind, S.; Schrader, S.; Oldenburg, E.; Brunotte, J. Regulation of the Mycotoxin Deoxynivalenol by Folsomia Candida (Collembola) and Aphelenchoides Saprophilus (Nematoda) in an on-Farm Experiment. Pedobiologia 2015, 58, 41–47. [Google Scholar] [CrossRef]
  27. Wolfarth, F.; Schrader, S.; Oldenburg, E.; Brunotte, J. Mycotoxin Contamination and Its Regulation by the Earthworm Species Lumbricus Terrestris in Presence of Other Soil Fauna in an Agroecosystem. Plant Soil 2016, 402, 331–342. [Google Scholar] [CrossRef]
  28. Tsurikov, M.N. Long-Term Dynamics of the Species Composition of Herpetobiont and Hortobiont Beetles (Coleoptera) in the Galichya Gora Nature Reserve. Entmol. Rev. 2016, 96, 191–198. [Google Scholar] [CrossRef]
  29. Afonina, V.M.; Tshernyshev, W.B.; Solovchenko, O.V. Which Biotopes Can Supply the Arable Field with Natural Enemies? IOBC Bull. 2008, 34, 1–4. [Google Scholar]
  30. Widstrom, N.W. The Role of Insects and Other Plant Pests in Aflatoxin Contamination of Corn, Cotton, and Peanuts—A Review. J. Environ. Qual. 1979, 8, 5–11. [Google Scholar] [CrossRef]
  31. Mann, R.S.; Ali, J.G.; Hermann, S.L.; Tiwari, S.; Pelz-Stelinski, K.S.; Alborn, H.T.; Stelinski, L.L. Induced Release of a Plant-Defense Volatile ‘Deceptively’ Attracts Insect Vectors to Plants Infected with a Bacterial Pathogen. PLoS Pathog. 2012, 8, e1002610. [Google Scholar] [CrossRef] [PubMed] [Green Version]
  32. Wardle, D.A. Impacts of Disturbance on Detritus Food Webs in Agro-Ecosystems of Contrasting Tillage and Weed Management Practices. In Advances in Ecological Research; Begon, M., Fitter, A.H., Eds.; Academic Press: Cambridge, MS, USA, 1995; Volume 26, pp. 105–185. [Google Scholar]
  33. Wardle, D.A.; Nicholson, K.S.; Yeates, K.W. Effect of Weed Management Strategies on Some Soil-Associated Arthropods in Maize and Asparagus Ecosystems. Pedobiologia 1993, 37, 257–269. [Google Scholar]
  34. Su, L.; Bai, T.; Qin, X.; Yu, H.; Wu, G.; Zhao, Q.; Tan, L. Organic Manure Induced Soil Food Web of Microbes and Nematodes Drive Soil Organic Matter under Jackfruit Planting. Appl. Soil Ecol. 2021, 166, 103994. [Google Scholar] [CrossRef]
  35. Goncharov, A.A.; Glebova, A.A.; Chernov, T.I.; Karpukhin, M.M.; Kuznetsova, N.A.; Leonov, V.D.; Makarova, O.L.; Maygurova, V.N.; Shesteperov, A.A.; Taranets, I.P. Detrital Subsidy Alters the Soil Invertebrate Community and Reduces Infection of Winter Wheat Seedlings by Fusarium Wilt. Appl. Soil Ecol. 2021, 163, 103914. [Google Scholar] [CrossRef]
  36. Jiang, M.; Yang, N.; Zhao, J.; Shaaban, M.; Hu, R. Crop Straw Incorporation Mediates the Impacts of Soil Aggregate Size on Greenhouse Gas Emissions. Geoderma 2021, 401, 115342. [Google Scholar] [CrossRef]
  37. Tian, G.; Kang, B.T.; Brussaard, L. Effect of Mulch Quality on Earthworm Activity and Nutrient Supply in the Humid Tropics. Soil Biol. Biochem. 1997, 29, 369–373. [Google Scholar] [CrossRef]
  38. Sun, L.; Wu, J. Combined Application of Animal Manure and Straw Benefit Soil Fauna Community in Dryland Farming. SOIL Discuss. 2021, 1–26. [Google Scholar] [CrossRef]
  39. Li, X.; Zhu, W.; Xu, F.; Du, J.; Tian, X.; Shi, J.; Wei, G. Organic Amendments Affect Soil Organic Carbon Sequestration and Fractions in Fields with Long-Term Contrasting Nitrogen Applications. Agr. Ecosyst. Environ. 2021, 322, 107643. [Google Scholar] [CrossRef]
  40. Zhang, N.; He, X.; Zhang, J.; Raza, W.; Yang, X.-M.; Ruan, Y.-Z.; Shen, Q.-R.; Huang, Q.-W. Suppression of Fusarium Wilt of Banana with Application of Bio-Organic Fertilizers. Pedosphere 2014, 24, 613–624. [Google Scholar] [CrossRef]
  41. WRB, IUSS Working Group. WRB World Reference Base for Soil Resources 2014: International Soil Classification System for Naming Soils and Creating Legends for Soil Maps; Food and Agriculture Organization: Rome, Italy, 2014; ISBN 978-92-5-108369-7. [Google Scholar]
  42. Lawlor, D.W. Photosynthesis, Productivity and Environment. J. Exp. Bot. 1995, 46, 1449–1461. [Google Scholar] [CrossRef]
  43. Sychev, V.G. (Ed.) Guidelines for Conducting Registration Tests of Agrochemicals in Agriculture; FGBNU “Rosinformagrotech”: Moscow, Russia, 2018; ISBN 978-5-7367-1459-9. (In Russian) [Google Scholar]
  44. Dolzhenko, V.I. (Ed.) Methodological Guidelines for Registration Tests of Fungicides in Agriculture; VIZR: Saint Petersburg, Russia, 2009; ISBN 978-5-7367-1473-5. (In Russian) [Google Scholar]
  45. Gagkaeva, T.; Orina, A.; Gavrilova, O. Fusarium Head Blight in the Russian Far East: 140 Years after Description of the “drunken Bread” Problem. Peer J. 2021, 9, e12346. [Google Scholar] [CrossRef] [PubMed]
  46. Ivanova, A.E.; Shutova, A.S.; Gannesen, A.V.; Lebedin, Y.S.; Eremin, S.A. Determination of the Mycelium and Antigens of a Number of Micromycetes in Soil Extracts via Enzyme-Linked Immunosorbent Assay. Appl. Biochem. Microbiol. 2020, 56, 72–77. [Google Scholar] [CrossRef]
  47. Gongalsky, K.B.; Wikars, L.-O.; Persson, T. Dynamics of Pyrophilous Carabids in a Burned Pine Forest in Central Sweden. Balt. J. Col. 2003, 3, 107–111. [Google Scholar]
  48. Zar, J.H. Biostatistical Analysis; Pearson: London, UK; Prentice-Hall: Hoboken, NJ, USA, 2010. [Google Scholar]
  49. Bonate, P.L. Pharmacokinetic-Pharmacodynamic Modeling and Simulation, 2nd ed.; Springer: New York, NY, USA, 2011; ISBN 978-1-4419-9484-4. [Google Scholar]
  50. Goncharov, A.A.; Gongalsky, K.B.; Yazrikova, T.E.; Kostina, N.V.; Korobushkin, D.I.; Makarov, M.I.; Zaitsev, A.S. Greenhouse Gas-Producing Soil Biological Activity in Burned and Unburned Forests along a Transect in European Russia. Appl. Soil. Ecol. 2020, 148, 103491. [Google Scholar] [CrossRef]
  51. Wei, T.; Simko, V. R Package “Corrplot”: Visualization of a Correlation Matrix. 2021. Available online: https://github.com/taiyun/corrplot (accessed on 15 December 2021).
  52. Bates, D.; Kliegl, R.; Vasishth, S.; Baayen, H. Parsimonious Mixed Models. arXiv 2015, arXiv:1506.04967. Available online: https://arxiv.org/abs/1506.04967 (accessed on 15 December 2021).
  53. Goncharov, A.A.; Tiunov, A.V. Trophic Chains in the Soil. Biol. Bull. Rev. 2014, 4, 393–403. [Google Scholar] [CrossRef]
  54. Moore, J.C.; Hunt, H.W. Resource Compartmentation and the Stability of Real Ecosystems. Nature 1988, 333, 261–263. [Google Scholar] [CrossRef]
  55. Pollierer, M.M.; Langel, R.; Scheu, S.; Maraun, M. Compartmentalization of the Soil Animal Food Web as Indicated by Dual Analysis of Stable Isotope Ratios (15N/14N and 13C/12C). Soil Biol. Biochem. 2009, 41, 1221–1226. [Google Scholar] [CrossRef]
  56. Matalin, A.V.; Makarov, K.V. Using Demographic Data to Better Interpret Pitfall Trap Catches. ZooKeys 2011, 100, 223. [Google Scholar] [CrossRef]
  57. Zalewski, M.; Dudek-Godeau, D.; Tiunov, A.; Godeau, J.-F.; Okuzaki, Y.; Ikeda, H.; Sienkiewicz, P.; Ulrich, W. Wing Morphology is Linked to Stable Isotope Composition of Nitrogen and Carbon in Ground Beetles (Coleoptera: Carabidae). Eur. J. Entomol. 2015, 112, 810–817. [Google Scholar] [CrossRef] [Green Version]
  58. Palmu, E.; Birkhofer, K.; Hanson, H.I.; Hedlund, K. Can ΔD and Δ18O Stable Isotopes Be Used to Detect Long-Range Dispersal among Carabid Beetles? Appl. Soil Ecol. 2017, 119, 99–103. [Google Scholar] [CrossRef]
  59. Schallhart, N.; Wallinger, C.; Juen, A.; Traugott, M. Dispersal Abilities of Adult Click Beetles in Arable Land Revealed by Analysis of Carbon Stable Isotopes. Agr. For. Entomol. 2009, 11, 333–339. [Google Scholar] [CrossRef]
  60. Schallhart, N.; Tusch, M.J.; Staudacher, K.; Wallinger, C.; Traugott, M. Stable Isotope Analysis Reveals Whether Soil-Living Elaterid Larvae Move between Agricultural Crops. Soil Biol. Biochem. 2011, 43, 1612–1614. [Google Scholar] [CrossRef] [Green Version]
  61. Rapoport, I.B. Ecology and Chorology of Earthworms (Oligochaeta, Lumbricidae) of the Kabardino-Balkarian High-Mountain Reserve (Central Caucasus). Bull. Soc. Nat. Moscou 2012, 117, 65–71. [Google Scholar]
  62. Edwards, C.A.; Bohlen, P.J. Biology and Ecology of Earthworms; Springer Science & Business Media: Berlin, Germany, 1996; Volume 3. [Google Scholar]
  63. Krantz, G.W. A Manual of Acarology; Oregon State University Book Stores: Corvallis, OR, USA, 1978. [Google Scholar]
  64. Walter, D.E.; Proctor, H.C. Mites: Ecology, Evolution, and Behaviour; Springer: Dordrecht, The Netherlands, 1999. [Google Scholar]
  65. Gerson, U.; Smiley, R.L.; Ochoa, R. Mites (Acari) for Pest Control; John Wiley & Sons: Hoboken, NJ, USA, 2008; ISBN 978-1-4051-5097-2. [Google Scholar]
  66. Kasuga, S.; Honda, K. Suitability of Organic Matter, Fungi and Vegetables as Food for Tyrophagus Similis (Acari: Acaridae). Appl. Entomol. Zool. 2006, 41, 227–231. [Google Scholar] [CrossRef] [Green Version]
  67. Hedlund, K.; Öhrn, M.S. Tritrophic Interactions in a Soil Community Enhance Decomposition Rates. Oikos 2000, 88, 585–591. [Google Scholar] [CrossRef]
  68. Usher, M.B. Seasonal and Vertical Distribution of a Population of Soil Arthropods: Collembola. Pedobiologia 1970, 10, 224–236. [Google Scholar]
  69. Farrow, R.A.; Greenslade, P. A Vertical Migration of Collembola. Entomologist 1992, 111, 38–45. [Google Scholar]
  70. Kromp, B. Carabid Beetles in Sustainable Agriculture: A Review on Pest Control Efficacy, Cultivation Impacts and Enhancement. Agr. Ecosyst. Environ. 1999, 74, 187–228. [Google Scholar] [CrossRef]
  71. Sasakawa, K. Field Observations of Climbing Behavior and Seed Predation by Adult Ground Beetles (Coleoptera: Carabidae) in a Lowland Area of the Temperate Zone. Environ. Entomol. 2010, 39, 1554–1560. [Google Scholar] [CrossRef]
  72. Goss, J.A. Development, Physiology, and Biochemistry of Corn and Wheat Pollen. Bot. Rev. 1968, 34, 333–359. [Google Scholar] [CrossRef]
  73. Vogel, P.; Liberato da Silva, G.; Esswein, I.Z.; Dallazen, M.C.; Heidrich, D.; Pagani, D.M.; Hoehne, L.; Scroferneker, M.L.; Valente, P.; Ferla, N.J. Effects of Infestations of the Storage Mite Tyrophagus Putrescentiae (Acaridae) on the Presence of Fungal Species and Mycotoxin Production in Stored Products. J. Stored Prod. Res. 2021, 94, 101883. [Google Scholar] [CrossRef]
  74. Bonkowski, M.; Villenave, C.; Griffiths, B. Rhizosphere Fauna: The Functional and Structural Diversity of Intimate Interactions of Soil Fauna with Plant Roots. Plant Soil 2009, 321, 213–233. [Google Scholar] [CrossRef]
  75. Biere, A.; Goverse, A. Plant-Mediated Systemic Interactions between Pathogens, Parasitic Nematodes, and Herbivores above-and Belowground. Annu. Rev. Phytopathol. 2016, 54, 499–527. [Google Scholar] [CrossRef] [PubMed] [Green Version]
  76. Mayer, Z.; Juhász, Á.; Posta, K. Mycorrhizal Root Exudates Induce Changes in the Growth and Fumonisin Gene (FUM1) Expression of Fusarium Proliferatum. Agronomy 2019, 9, 291. [Google Scholar] [CrossRef] [Green Version]
Figure 1. Estimates of the five FHB related study endpoints (mean ± 1 S.E., n = 5) from control (green bars), N-poor mulch (yellow bars), N-medium mulch (orange bars), and N-rich mulch (brown bars) treatments: (A) Fusarium biomass in grain, (B) FHB in grain, (C) T2-toxin in grain, (D) Total N in grain, (E) Yield. Different letters represent a significant difference between treatments (Kruskal-Wallis test and Dunn test, p < 0.05). No significant difference between treatments is denoted as “n.s.”.
Agronomy 12 00393 g001
Figure 2. Dynamics of (A) root rot development, (B) root rot incidence, (C) root mass, (D) shoot mass, and (E) Fusarium biomass in soil, in the control (green lines), N-poor mulch (yellow lines), N-medium mulch (orange lines), and N-rich mulch (brown lines) treatments. Mean ± 1 S.E., n = 5.
Agronomy 12 00393 g002
Figure 3. Dynamics of the abundance of hortobionts (AC), herpetobionts (DF), soil mesofauna (GJ), soil macrofauna (KN) and earthworms (OR), in control (green lines), N-poor mulch (yellow lines), N-medium mulch (orange lines), and N-rich mulch (brown lines) treatments. Mean ± 1 S.E., n = 5.
Agronomy 12 00393 g003
Figure 4. Pearson correlation matrix of five FHB related study endpoints and 21 ecosystem parameters included in the primary analysis. Only significant correlations are shown (p < 0.05). Correlation coefficient values are shown on the lower matrix triangle. Upper triangle: ellipses oriented from top left to bottom right represent negative correlation coefficient and vice versa. Smaller ellipse width represents a larger correlation coefficient value.
Agronomy 12 00393 g004
Figure 5. Regression surface plots of (A) Fusarium biomass in grain, (B) FHB in grain, (C) T2-toxin in grain, (D) Total N in grain, (E) Yield versus the regressors in the corresponding optimal models. The logarithmic values of abundance and biomass of invertebrates are given.
Agronomy 12 00393 g005
Table 1. Dosages of C and N from straw and compost used in the experiment.
N-Poor MulchN-Medium MulchN-Rich Mulch
C dosage, g C m−2Total215.2240.3290.6
From straw180.0180.0180.0
From compost35.260.3110.6
N dosage, g N m−2Total5.27.411.9
From straw2.12.12.1
From compost3.15.39.8
C:N ratio in mulch 413225
Table 2. Integral mean values and results of statistical comparison of measurements from experimental treatments. Different letters represent a significant difference between treatments (Kruskal-Wallis test and Dunn test, p < 0.05). No significant difference between treatments is denoted as “n.s.”.
MeasurementControlN-Poor MulchN-Medium MulchN-Rich Mulch
FHB related study endpoints
Fusarium biomass in grain, a.u. g−1106.9 ± 66.1136.6 ± 65.3119.5 ± 65.482.2 ± 30.4n.s.
Incidence of FHB in grain, %9.3 ± 2.19.1 ± 2.18.4 ± 2.614 ± 4.6n.s.
T2-toxin in grain, μg kg−143.2 ± 0.6 ab52.1 ± 0.2 a41.9 ± 2.7 ab40.4 ± 1.6 b
Total N in grain, %2.1 ± 0.12.1 ± 0.12.0 ± 0.12.0 ± 0.1n.s.
Yield, t ha−16.8 ± 0.57.4 ± 0.57.3 ± 0.57.6 ± 0.4n.s.
Ecosystem parameters
Acari, ind. × 103 m−224.4 ± 2.333.2 ± 4.029.4 ± 4.335.6 ± 3.1n.s.
Collembola, ind. × 103 m−214.1 ± 5.1 a21.9 ± 6.4 a23.4 ± 8.3 a19.7 ± 6.6 an.s.
D. schmidti (biomass), g m−23.7 ± 2.1 a9.0 ± 1.5 b6.8 ± 1.0 ab5.6 ± 1.9 ab
D. schmidti (abundance), ind. m−272.3 ± 43.997.7 ± 43.986.5 ± 25.865.6 ± 27.5n.s.
Fusarium biomass in soil, a.u. × 109 m−21.1 ± 0.51.0 ± 0.41.0 ± 0.60.4 ± 0.2n.s.
Herpetobionts, ind. 100 trap days−144.2 ± 12.548.0 ± 5.042.5 ± 4.444.4 ± 5.9n.s.
Hortobionts, ind. sampling−132.5 ± 2.8 a28.7 ± 2.7 ab18.8 ± 3.0 b26.3 ± 3.3 ab
Lumbricidae (abundance), ind. m−280.5 ± 46.9104.1 ± 43.292.2 ± 26.269.9 ± 28.2n.s.
Lumbricidae (biomass), g m−25.6 ± 1.711.1 ± 0.87.9 ± 1.113.2 ± 4n.s.
Macrofauna, ind. × 103 m−24.5 ± 0.84.6 ± 0.56.0 ± 0.65.0 ± 0.4n.s.
Mesofauna, ind. × 103 m−238.5 ± 6.5 a55.0 ± 10.3 b52.7 ± 12.3 ab55.3 ± 8.9 b
Mesostigmata mites, ind. × 103 m−24.5 ± 1.06.0 ± 1.34.4 ± 0.86.4 ± 1.1n.s.
Oribatida mites, ind. ×103 m−28.0 ± 1.79.3 ± 0.86.9 ± 0.910.1 ± 1.8n.s.
Phytophages (herpetobionts), ind. 100 trap days−18.7 ± 2.97 ± 1.27.2 ± 1.56.6 ± 1.4n.s.
Phytophages (hortobionts), ind. sampling−119.9 ± 2.9 a16.4 ± 1.7 ab9.0 ± 1.8 b16.3 ± 3.2 ab
Phytophages (macrofauna), ind. m−210.1 ± 10.135.8 ± 82.5 ± 1.68.9 ± 4.5n.s.
Predators (herpetobionts), ind. 100 trap days−129.3 ± 8.733 ± 3.328.6 ± 331.1 ± 4.6n.s.
Predators (hortobionts), ind. sampling−12.0 ± 0.72.1 ± 0.41.4 ± 0.31.6 ± 0.7n.s.
Predators (macrofauna), ind. × 103 m−21.0 ± 0.50.8 ± 0.10.6 ± 0.20.7 ± 0.1n.s.
Prostigmata mites, ind. × 103 m−210.3 ± 3.3a17.7 ± 3.2b17.1 ± 3.1b17.9 ± 2.3b
Root mass, g29.4 ± 0.730.8 ± 4.032.0 ± 1.533.3 ± 2.6n.s.
Root rot development, %3.6 ± 0.63.5 ± 0.63.3 ± 0.64.6 ± 1.1n.s.
Root rot incidence, %93.3 ± 4.489.2 ± 492.6 ± 497.6 ± 0.4n.s.
Saprophages (macrofauna), ind. × 103 m−21.7 ± 0.61.7 ± 0.43.3 ± 0.62.0 ± 0.3n.s.
Shoot mass, g79.3 ± 5.679.9 ± 8.680.0 ± 7.781.4 ± 6.8n.s.
Soil moisture, %17.5 ± 0.917.9 ± 0.619.0 ± 0.718.5 ± 0.2n.s.
Table 3. Ecosystem parameters associated with FHB related study endpoints assessed by linear regressions.
Ecosystem ParameterFusarium Biomass in Grain FHB in GrainT2-Toxin in GrainTotal N in GrainYield
Root rot developmentn.s.0.98; <0.001n.s.n.s.0.38; 0.008
D. schmidti (biomass)0.12; 0.001 0.45; 0.0030.31; 0.031n.s. §0.31; 0.029
Lumbricidae (abundance)n.s.0.56; 0.001n.s.n.s.0.53; 0.001
D. schmidti (abundance)n.s.0.36; 0.022n.s.0.36; 0.0130.61; <0.001
Mesostigmata mitesn.s.n.s.n.s.0.25; 0.0410.64; <0.001
Acarin.s.n.s.n.s.n.s.0.52; 0.001
Mesofaunan.s.n.s.n.s.n.s.0.49; 0.002
Predators (macrofauna)n.s.n.s.n.s.0.34; 0.0140.40; 0.006
Phytophages (macrofauna)n.s.n.s.0.36; 0.048n.s.n.s.
Prostigmata mitesn.s.n.s.n.s.n.s.0.36; 0.010
Collembolan.s.n.s.n.s.n.s.0.35; 0.012
Soil moisturen.s.n.s.n.s.0.29; 0.0260.34; 0.018
Fusarium biomass in soiln.s.n.s.n.s.n.s.0.34; 0.014
Lumbricidae (biomass)n.s.n.s.n.s.n.s.0.33; 0.016
Root rot incidencen.s.n.s.0.24; 0.046n.s.n.s.
Herpetobionts0.19; 0.044n.s.n.s.0.34; 0.013n.s.
Oribatida mitesn.s.n.s.n.s.n.s.0.14; 0.050
Predators (herpetobionts)n.s.n.s.n.s.0.33; 0.014n.s.
Predators (hortobionts)n.s.n.s.n.s.0.79; <0.001n.s.
Saprophages (macrofauna)n.s.n.s.n.s.0.30; 0.021n.s.
Shoot massn.s.n.s.n.s.0.26; 0.030n.s.
Total C in mulchn.s.n.s.n.s.n.s.n.s.
Total N in mulchn.s.n.s.n.s.n.s.n.s.
C:N ratio in mulchn.s.n.s.n.s.n.s.n.s.
Phytophages (herpetobionts)n.s.n.s.n.s.n.s.n.s.
Hortobiontsn.s.n.s.n.s.n.s.n.s.
Phytophages (hortobionts)n.s.n.s.n.s.n.s.n.s.
Macrofaunan.s.n.s.n.s.n.s.n.s.
Root massn.s.n.s.n.s.n.s.n.s.
†-Factors are ranged by the sum of their R2 values in significant regressions across study endpoints. ‡-Statistics of corresponding significant linear regression (R2 value; p-value). §-A corresponding regression is not significant.
Table 4. Coefficient values of regressors and information statistics of optimal models for the five FHB related study endpoints. R2 marginal–proportion of variability observed in the whole data sample explained by fixed effects only. R2 conditional proportion of variability observed in the whole data sample explained by fixed effects and random effects.
Dependent VariablesRegressor ParametersModel Parameters
NameEstimateSE, %pR2 MarginalR2 Conditional
Fusarium biomass in grainIntercept903.7545.90.04466.184.2
Herpetobionts212.1218.4<0.001
Mesofauna−147.7221.3<0.001
FHB in grainIntercept−6.4710.0<0.00165.999.2
Root rot development4.463.3<0.001
Fusarium biomass in soil4.44 × 10920.0<0.001
Fusarium biomass in soil × Root rot development−1.61 × 10920.7<0.001
T2-toxin in grainIntercept35.796.4<0.00146.770.8
D. schmidti (biomass) × Phytophagous macrofauna1.9221.40.001
Total N in grainIntercept1.575.3<0.00151.294.6
Predatory herpetobionts0.8210.8<0.001
Lumbricidae (biomass)0.1429.3<0.001
Predatory herpetobionts × Lumbricidae (biomass)−0.2218.10.005
YieldIntercept5.7910.3<0.00129.538.1
D. schmidti (biomass) × Mesostigmata mites0.1135.30.013
Publisher’s Note: MDPI stays neutral with regard to jurisdictional claims in published maps and institutional affiliations.

